 Jian Wang
 Yixiao Mao
 Xinna Gao3
 Yu Zhang
- 1School of Biomedical Engineering, Southern Medical University, Guangzhou, Guangdong, China
- 2Guangdong Provincial Key Laboratory of Medical Image Processing, Southern Medical University, Guangzhou, Guangdong, China
- 3Department of Radiation Oncology, Southern Medical University Nanfang Hospital, Guangzhou, Guangdong, China
Objectives: Recurrence risk evaluation is clinically significant for patients with locally advanced cervical cancer (LACC). We investigated the ability of transformer network in recurrence risk stratification of LACC based on computed tomography (CT) and magnetic resonance (MR) images.
Methods: A total of 104 patients with pathologically diagnosed LACC between July 2017 and December 2021 were enrolled in this study. All patients underwent CT and MR scanning, and their recurrence status was identified by the biopsy. We randomly divided patients into training cohort (48 cases, non-recurrence: recurrence = 37: 11), validation cohort (21 cases, non-recurrence: recurrence = 16: 5), and testing cohort (35 cases, non-recurrence: recurrence = 27: 8), upon which we extracted 1989, 882 and 315 patches for model's development, validation and evaluation, respectively. The transformer network consisted of three modality fusion modules to extract multi-modality and multi-scale information, and a fully-connected module to perform recurrence risk prediction. The model's prediction performance was assessed by six metrics, including the area under the receiver operating characteristic curve (AUC), accuracy, f1-score, sensitivity, specificity and precision. Univariate analysis with F-test and T-test were conducted for statistical analysis.
Results: The proposed transformer network is superior to conventional radiomics methods and other deep learning networks in both training, validation and testing cohorts. Particularly, in testing cohort, the transformer network achieved the highest AUC of 0.819 ± 0.038, while four conventional radiomics methods and two deep learning networks got the AUCs of 0.680 ± 0.050, 0.720 ± 0.068, 0.777 ± 0.048, 0.691 ± 0.103, 0.743 ± 0.022 and 0.733 ± 0.027, respectively.
Conclusions: The multi-modality transformer network showed promising performance in recurrence risk stratification of LACC and may be used as an effective tool to help clinicians make clinical decisions.
1 Introduction
Cervical cancer is one of the most common malignancies in females worldwide, which ranks as the 4th leading cause of death among cancers in women (1). Locally advanced cervical cancer (LACC), as the cervical cancer in IB2, IIA2 and IIB~IVA stages, is generally considered as a local mass with the size larger than 4cm or invades the surrounding tissues, in which distant metastasis does not occur (1). In clinical practices, the treatment for patients with LACC does not follow the same pattern (2). Most LACC patients are routinely treated with concurrent chemoradiation therapy, and the prognosis is heterogeneous (3). Despite neoadjuvant and adjuvant therapies are being tentatively introduced into the treatment regimen, the overall outcomes are not significantly improved (4, 5). The potential reason may be associated with the small-scale cohorts benefited from the neoadjuvant and adjuvant treatments, and all of these patients are from the high-risk recurrence group (6). Therefore, an interesting and crucial topic is to accurately predict recurrence risk so as to formulate the individualized therapeutic schedule for LACC patients.
With the rapid development of imaging techniques, imaging examinations has been considered as a routine for patients with cervical cancer. Currently, several studies have conducted recurrence and prognosis analysis for cervical cancer by extracting and evaluating high-throughput imaging features (7, 8). For example, some work has carried out texture analysis based on positron emission tomography (PET) or magnetic resonance (MR) images to predict the recurrence risk of cervical cancer (9, 10). In addition, the ultrasound (US) and computed tomography (CT) images were also used in recurrence-related tasks, such as lymph node metastasis prediction and survival assessment (11, 12). However, few studies have tried to focus on the recurrence risk stratification of LACC. Moreover, previous methods only utilized the information from mono-modality data and did not take multi-modality complementary information into consideration. Consequently, it is desirable to design an efficient model to make full use of multi-modality data (i.e., CT and MR images) for accurately stratifying the recurrence status of LACC.
In recent years, deep learning has demonstrated its superiority over conventional radiomics methods based on hand-crafted features (13), and it avoids the complex hand-crafted feature extraction (14). Transformer, as one of the most popular deep learning architectures, has been successfully applied to various medical image analysis tasks and shows promising performance (15–17). In this study, we investigated the ability of transformer network in recurrence risk stratification of LACC by using non-contrast enhanced CT images and T1-Weighted MR images. Specifically, the transformer network consisted of three modality fusion modules to extract multi-modality and multi-scale information, and a fully-connected module to perform recurrence risk prediction. The performance of the model was assessed by six metrics. The results showed that our proposed model significantly outperformed the conventional radiomics methods.
2 Materials and methods
2.1 Patients
This study was approved by the Institutional Review Board, and written informed consent requirement was waived. Totally, 104 patients with pathologically diagnosed LACC between July 2017 and December 2021 were retrospectively enrolled. For all participants, the inclusion criteria were as follows: (1) patients who pathologically confirmed LACC; (2) patients who underwent radiotherapy as the main treatment; (3) patients who underwent both CT and MR examinations within three weeks before radiotherapy. The exclusion criteria were as follows: (1) external irradiation treatment was interrupted for more than one month; (2) the radiation dose to tumor was less than 80Gy; (3) surgery was performed before radiotherapy. All enrolled participants with matched multi-modality data were randomly divided into training and testing cohorts at a ratio of 2: 1 to develop and assess the network, respectively.
Recurrent tumors were classified into local, regional, or distant progressive tumors after concurrent chemoradiotherapy was completed. Clinical follow-up exams of the patients were performed every 3 months until 36 months. Physical examination and tumor markers were checked. Imaging examination of pelvic MRI (CT for special patients) was performed when suspected of recurrence and the biopsy was performed for confirmation.
The clinicopathologic data of all enrolled patients, including age, tumor stage (FIGO 20091), pathologic diagnosis, lymph node status and dose of radiotherapy, were obtained from medical records for statistical analysis and the recurrence status of all patients was also followed up.
2.2 CT and MR image acquisition
The CT images were collected from the CT scanner (Philips Healthcare, Best, The Netherlands). The scanning current and voltage were 300 mAs and 120 kV, respectively. Both slice thickness and slice distance were set to 3 mm, and the resolution was 512×512 pixels. The scanning range of CT was from the diaphragm to the proximal femur. The MR images were acquired from four MR scanners: an Achieva 3T MR scanner (Philips Medical Systems, Best, The Netherlands), with the repetition time of 431.5-697.4 msec, echo time of 10 msec, slice thickness of 5 mm, flip angle of 90°, percentage phase field of view of 100%, and matrix of 320×320 or 560×560; an Ingenia 3T MR scanner (Philips, Best, The Netherlands), with the repetition time of 431.5-697.4 msec, echo time of 10 msec, slice thickness of 5 mm, flip angle of 90°, percentage phase field of view of 100%, and matrix of 320×320 or 560×560; a Signa HDxt 1.5T MR scanner (GE Medical Systems, Milwaukee, Wis, USA), with the repetition time of 200-620 msec, echo time of 8.104 msec, slice thickness of 6 mm, flip angle of 90°, percentage phase field of view of 100%, and matrix of 512×512; an OPTIMA MR360 1.5T MR scanner (GE Healthcare, Milwaukee, Wis, USA), with the repetition time of 393-1179 msec, echo time of 12.36 msec, slice thickness of 5-7.5 mm, flip angle of 90°, percentage phase field of view of 100%, and matrix of 512×512. The scanning range of MR scanners was the whole pelvic area.
2.3 Imaging registration and VOI segmentation
In this study, we mainly focused on the imaging information of the primary tumor regions for recurrence risk stratification. The lymph node status was not included in the model. The specific reason is that the patients included in this study were all patients who had not undergone surgery, and there was no gold standard (pathological result) to verify the presence of lymph node metastasis. Previous studies (18, 19) have also shown that it is sufficient to use only the imaging information of primary lesions for cancer prognosis analysis, and the method selection of this study is generally in line with the previous research norms.
We chose non-contrast enhanced CT and T1-weighted MR images to carry out imaging analysis and used T1-weighted MR to contour the tumor. The main reason is that MR imaging has higher soft-tissue contrast resolution, so cervical cancer, which originates in the pelvis and is mixed with surrounding soft tissues, can be well identified. In order to ensure that the primary lesion area can be accurately located in CT images, we registered them with the MR images and then used the VOIs (i.e., primary tumor regions) of MR images to extract lesion regions in both registered CT images and original MR images. Specifically, as shown in Figure 1, we first cropped CT images to focus on the pelvic area, and then aligned cropped CT images to the MR images via elastic registration (3D Slicer software 4.11). The VOIs were manually delineated on T1-weighted MR images by using ITK-SNAP 3.6 (ITK-SNAP 3.x Team, www.itksnap.org) by a radiologist with 10 years of experience.
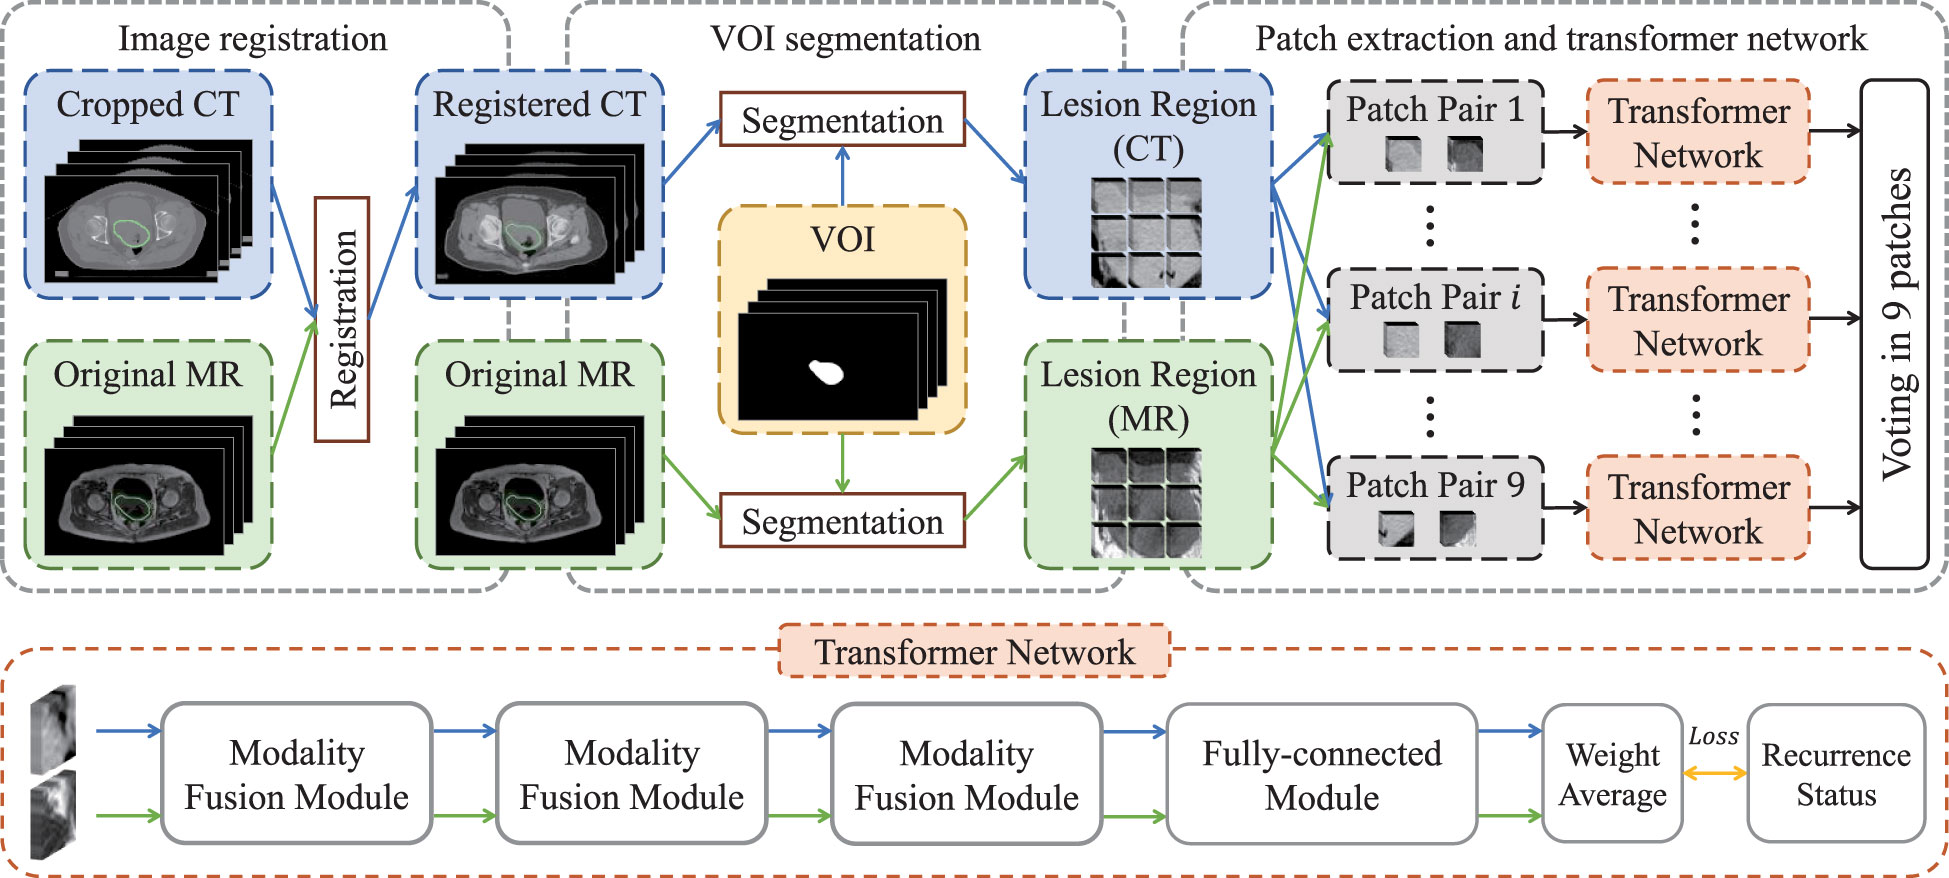
Figure 1 The flow chart of the proposed model for the recurrence risk stratification of LACC.
2.4 Patch extraction
The lesion regions of all patients were resampled into a volume with the specified resolution of 86×86×12, and then zero-mean normalization was applied to each volume for image standardization so as to eliminate the bias introduced by inconsistent imaging parameters (20). Subsequently, each volume was split into nine patches with the size of 32×32×12, in which adjacent patches had 5-voxel overlap alone coronal and sagittal directions. Finally, paired multi-modality patches were taken as the input of transformer network for recurrence risk prediction.
2.5 Transformer network
The flow chart of transformer network is shown in Figure 1. The transformer network was composed of three modality fusion modules and a fully-connected module. The modality fusion module (as shown in Figure 2) consisted of two spatial pyramid units and a transformer unit. The former was used to extract the multi-scale image features effectively. The spatial pyramid features were obtained by utilizing three paralleled 3×3×3 convolutional layers with the dilation rates of 1, 3 and 5, respectively. Then, a pixel-wise summation operator and a 1×1×1 convolution layer were used to aggregate these features. In order to avoid gradient vanishing and accelerate convergence, a batch normalization (BN) layer and a Leaky ReLU nonlinearity operation were plugged after each convolutional layer. Subsequently, a transformer unit was utilized to capture semantic features between two modalities data (21). Specifically, we performed two multi-head self-attention operations for each modality to learn modality-specific information, and two multi-head cross-attention operations to extract complementary features from the other modality. Afterwards, weight average operator was adopted to aggregate all feature maps, and the weights of different features were learned automatically. A multi-layer perceptron (MLP) layer and a vision transformer (ViT) unit (17) were then applied to further extract semantic representations. Subsequently, CT and MR features were fed into the fully-connected module that contained a global average pooling layer, three stacked fully-connected layers (with the node number of 8, 4, 1, respectively) and a Sigmoid activation function to generate the patch-level predictions for CT and MR images, respectively. Another weight average operation was then used to aggregate the predicted probabilities of two modalities. Finally, we adopted the voting strategy to integrate the predicted probabilities of nine paired patches to obtain patient-level recurrence risk prediction.
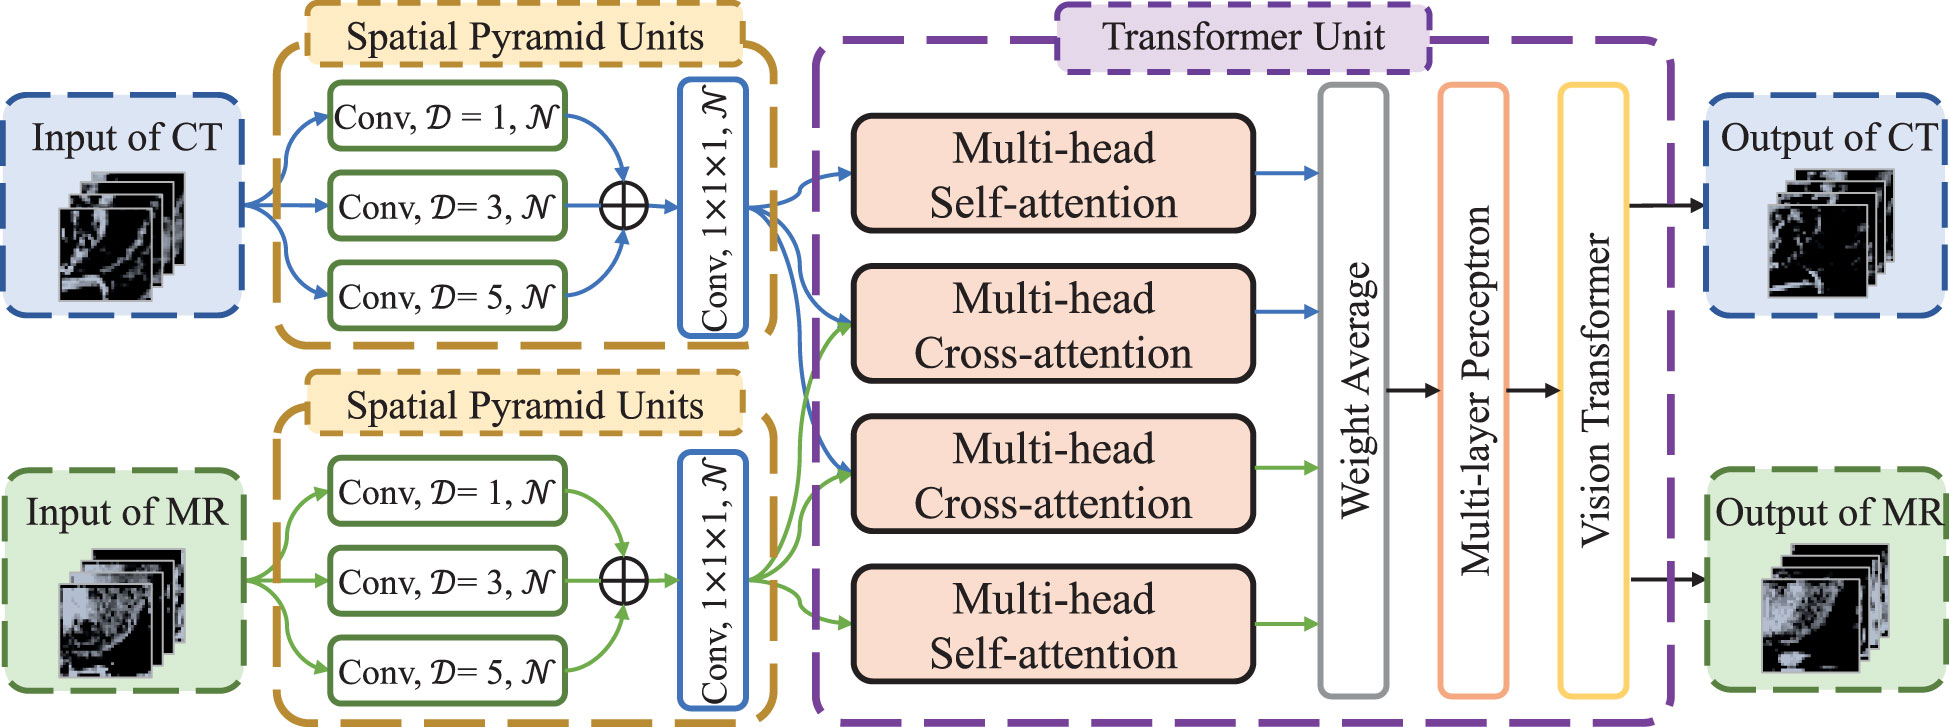
Figure 2 The architecture of modality fusion module. D is dilation rate in the convolutional layers and N is the number of convolutional kernels, which is set to 4, 8 and 16, respectively, in the three modality fusion modules.
2.6 Conventional radiomics methods and deep neural networks
To verify the effectiveness of our method, we compared the proposed method with some conventional radiomics methods and deep neural networks. For conventional radiomics methods, followed by (22), we extracted 4 non-texture features (including volume, size, solidity and eccentricity) and 10320 texture features from each modality for each patient. Subsequently, we utilized a filter-based feature selection method, namely Relief algorithm (23), to select the features with the best distinguishing power. The selected features were then used to construct the decision tree classifier (24), naive bayes classifier (25), k-nearest neighbor (KNN) classifier (26) and support vector machine (SVM) classifier (27), respectively, for recurrence risk prediction. For comparison with deep neural networks, we reproduced ResNet18 (28) and MobileNetV1 (29) networks. We employ the same data preprocessing strategy as the proposed method, and then utilized the input-level fusion strategy to fuse multi-modality images into deep networks by multi-channel.
2.7 Implementation details and statistical analysis
We conducted data augmentation strategy (i.e., random affine transformation) to generate sufficient images to train the transformer network so as to alleviate the overfitting and data imbalance issues (30). Specifically, all VOIs were first scaled to the volume with the size of 560×560×20 and then underwent rotation (within π/18, π/18, π/4 in the coronal, sagittal and transverse sections, respectively) and zoom (between 0.75 and 1.25) operations, followed by patch extraction. For each method, we randomly divided the training and validation sets five times to verify the robustness of the method. In the training stage, we utilized binary cross entropy as the loss function and recurrence status as the label. And Kaiming initialization (31) and Adam optimizer (32) were adopted to initialize and optimize model's parameters. The model was complemented under the PyTorch (version 1.10.1) based on Python (version 3.8.0). All intensive calculations were offloaded to a workstation with Central Processing Unit (CPU) of Intel(R) Xeon(R) CPU E5-2623 v3 @ 3.00GHz, Graphics Processing Unit (GPU) of NVIDIA Pascal Titan X, and 125 GB RAM. The conventional radiomics model was carried out by MATLAB software (version 2020a).
Continuous variables were expressed as means (standard deviation), and categorical data were expressed as numbers (percentage). The model's prediction performance was assessed by six metrics, including the area under the receiver operating characteristic curve (AUC), accuracy, f1-score, sensitivity, specificity and precision. Univariate analysis with F-test was conducted to compare differences between clinical variables and recurrence status of LACC, while T-test for the difference comparison of AUCs, and significant difference was defined by P < 0.05. All statistical analyses were implemented using R software (version 4.0.2).
3 Results
3.1 Clinical characteristics
The clinical baseline characteristics of the enrolled participants are shown in Table 1. The inclusion and exclusion criteria are shown in Figure 3 (left). To develop and assess the proposed model, the enrolled patients were randomly divided into the training cohort and testing cohort with an approximate ratio of 2: 1. Then, in the training cohort, we further portioned two-thirds samples for training the network and the rest for validating the network, respectively. We performed three-fold augmentation for non-recurrence cases and ten-fold augmentation for recurrence cases in the training set to bridge the quantitative gap between two categories. Totally, 1989 (non-recurrence: recurrence = 999: 990), 882 (non-recurrence: recurrence = 432: 450) and 315 (non-recurrence: recurrence = 243: 72) patches were generated from training, validation and testing cohorts. The flow chart of the study is shown in Figure 3 (right). The all cohorts maintained the same class distribution.
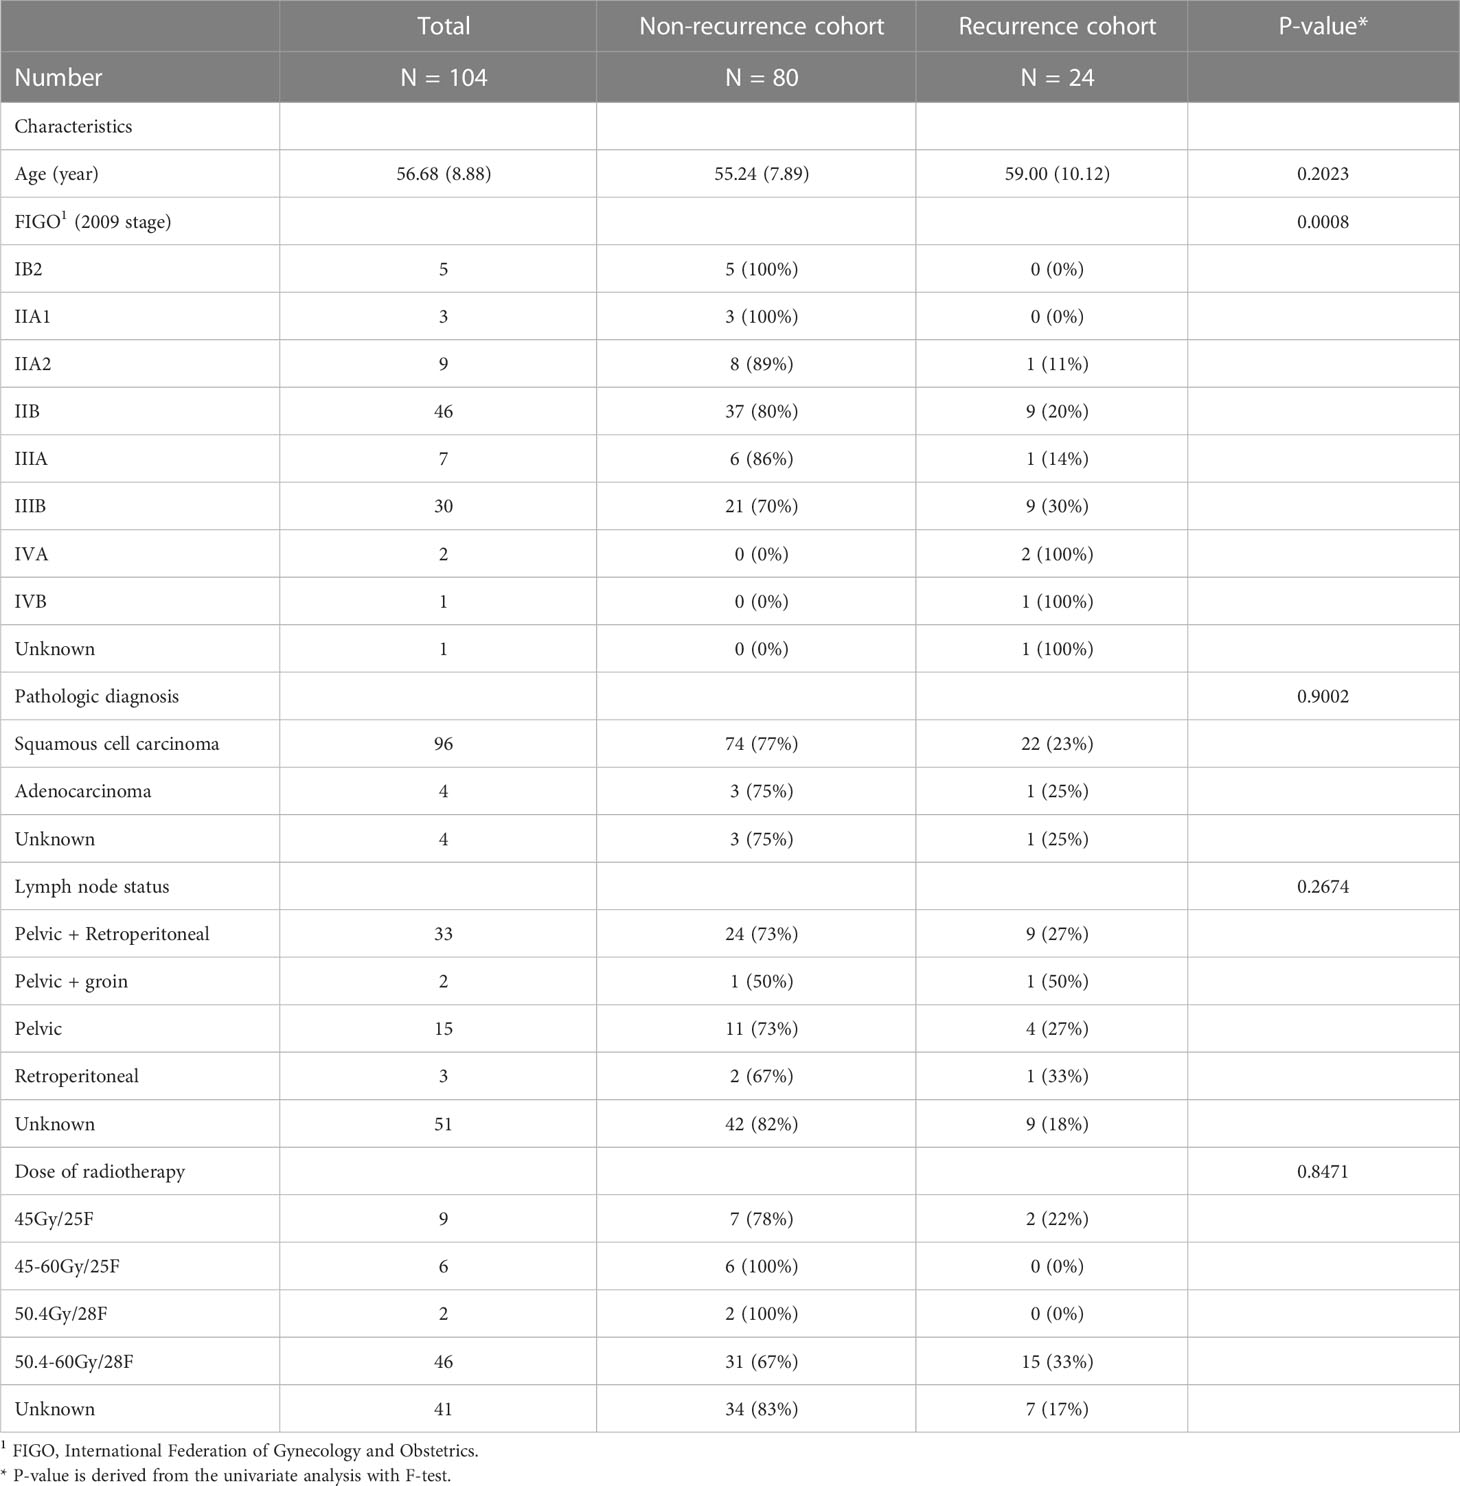
Table 1 Clinical characteristics of recurrence and non-recurrence cohorts.
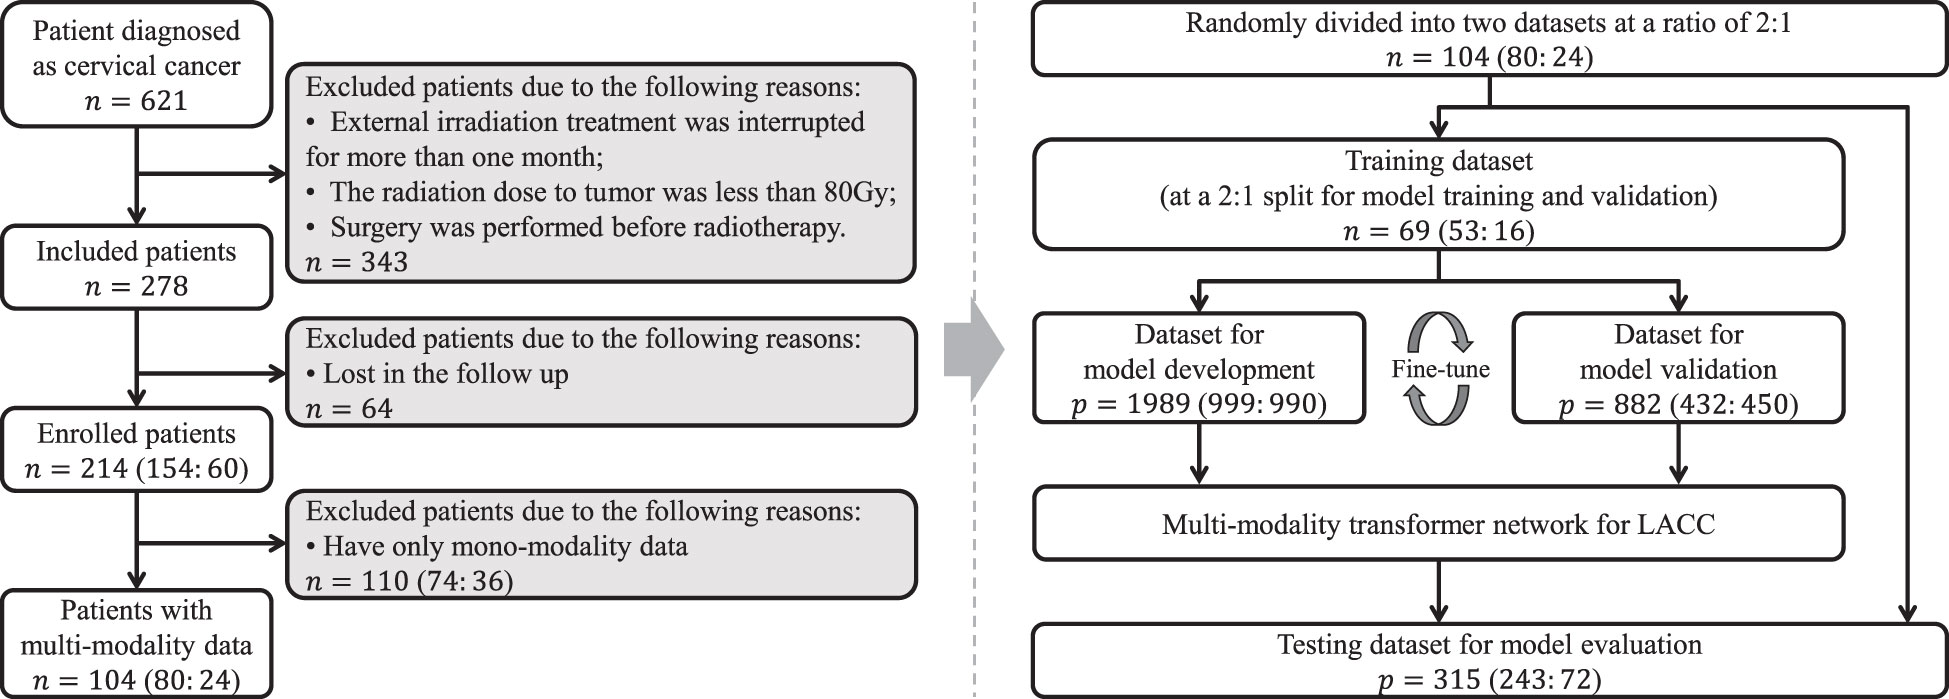
Figure 3 Patient inclusion and exclusion criteria, and the study flow chart.
3.2 Training process and prediction performance of transformer network
The training process of transformer network is shown in Figure 4, which suggests that the loss of model gradually converged and the accuracy gradually stabilized as iterations number increased. The prediction performance of transformer network on recurrence risk prediction of LACC is listed in Table 2. From Table 2, we can observe that the transformer network can accurately predict the recurrence status of all samples in the training cohort. Meanwhile, it achieved good performance with AUC of 0.819 ± 0.038, accuracy of 0.869 ± 0.023, f1-score of 0.914 ± 0.016, sensitivity of 0.911 ± 0.038, specificity of 0.725 ± 0.094 and precision of 0.919 ± 0.025 in the testing cohort.
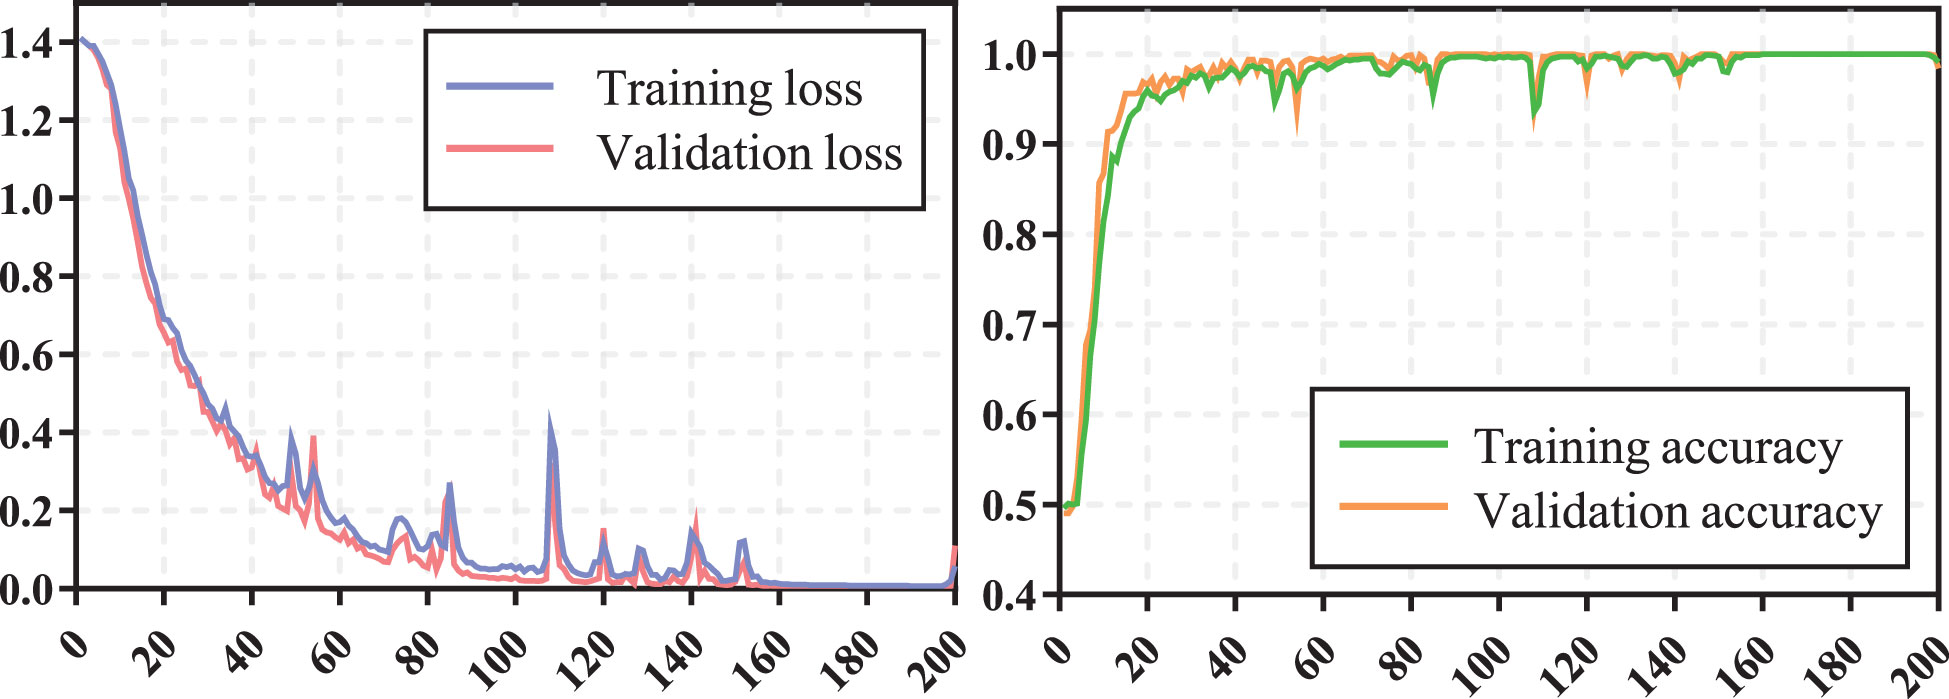
Figure 4 The training process of transformer network.
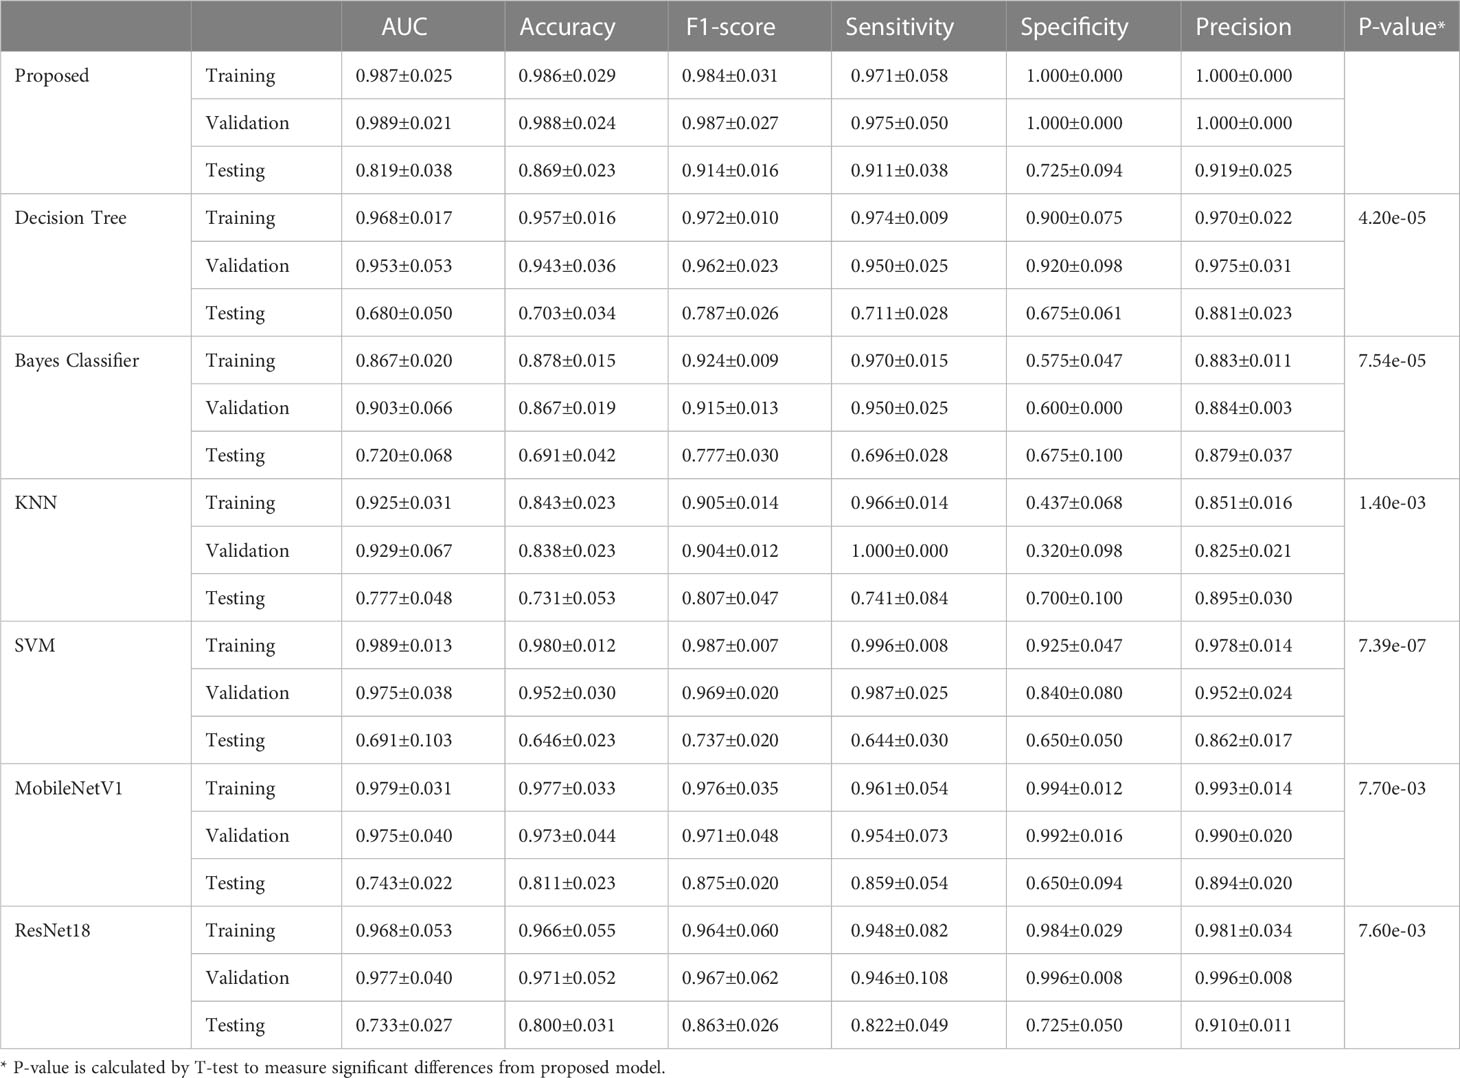
Table 2 Comparison results of the proposed method and other competing methods.
3.3 Comparison with conventional radiomics methods and deep neural networks
We compared the proposed transformer network with conventional radiomics methods and deep neural networks. The results are shown in Table 2. We can find that the transformer network is generally superior to other methods in both training, validation and testing cohorts. Particularly, in testing cohort, the transformer network achieved the highest AUC of 0.819 ± 0.038, while conventional radiomics methods got the AUCs of 0.680 ± 0.050, 0.720 ± 0.068, 0.777 ± 0.048 and 0.691 ± 0.103, respectively. The AUCs of the ResNet18 and MobileNetV1 were 0.743 ± 0.022 and 0.733 ± 0.027, respectively, which did not show competitive performances. We analyzed that these two classical networks both used the input-level modality fusion strategy, which made it difficult to establish the intrinsic relationship between different modalities of the same patient, resulting in the degradation of the model performance (15). By contrast, we adopted the transformer structure, and used its unique attention mechanism to fully learn the complementary information between modalities and mined discriminative semantic features. Therefore, the proposed model was more accurate and robust. Figure 5 (left) plots the ROC curves of all competing methods in testing cohort.
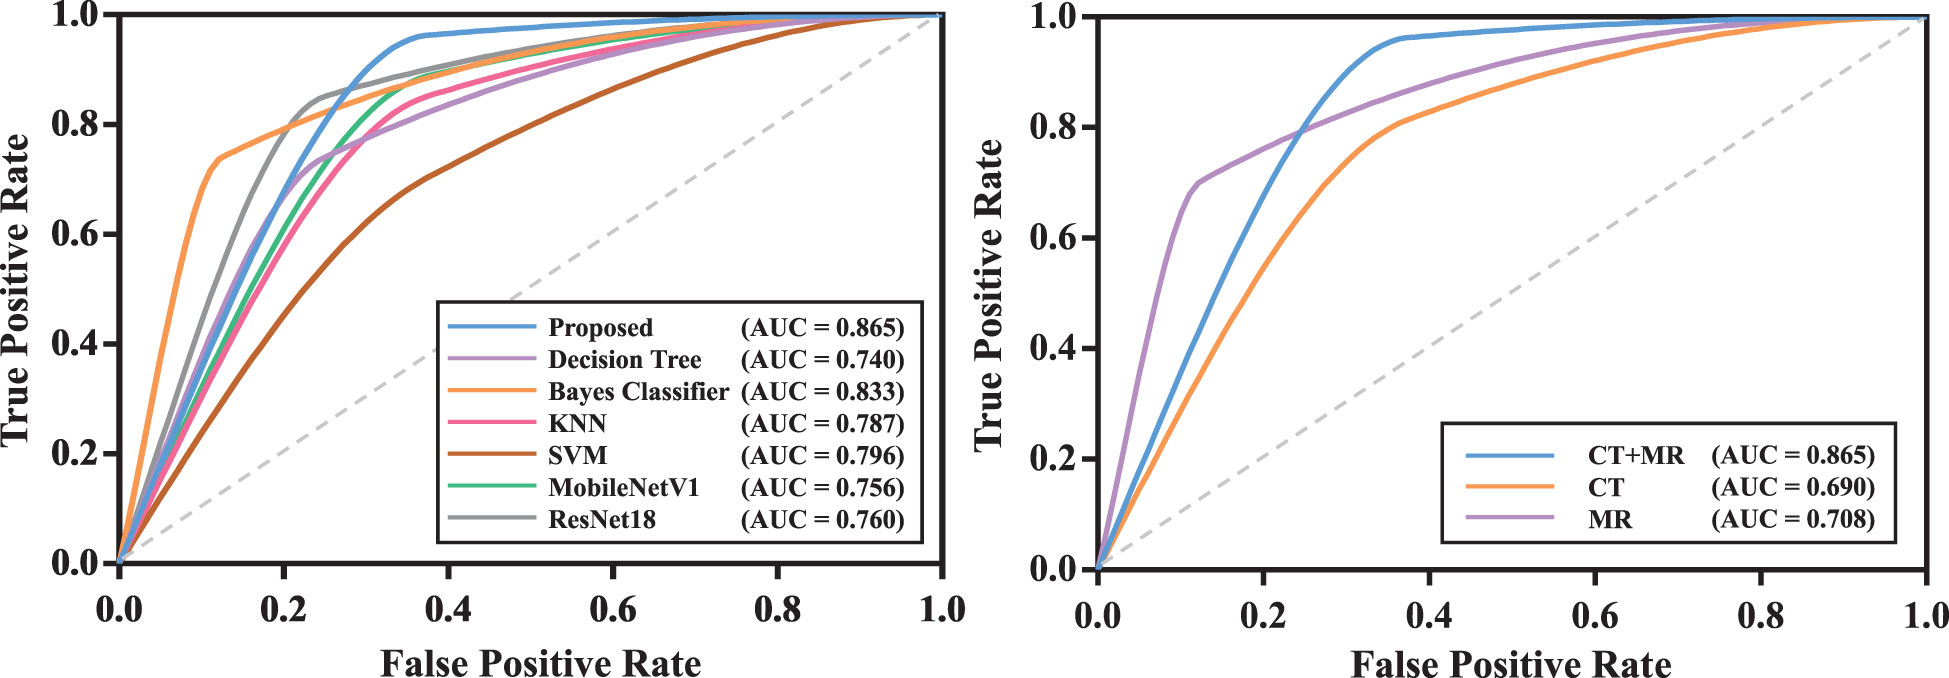
Figure 5 The ROC curves of models in testing cohort. The model with the best test result was shown. Left: ROC curves of all competing methods; Right: ROC curves of the proposed model with mono-modality and multi-modality data.
3.4 Efficacy of multi-modality data
We compared the prediction performance of the proposed model on mono-modality data (i.e., only trained with CT or MR images) and multi-modality data. The detailed experimental design can be found in Supplementary Materials. Table 3 shows the experimental results, and Figure S1 depicts the training process of transformer network on mono-modality data. We can see that the model with multi-modality data obtained the best results when compared with the models with only mono-modality data. Figure 5 (right) exhibits the corresponding ROC curves, further validating the above-mentioned contents. It is not surprising about the observation, in that multi-modality data can provide more complementary information for the recurrence risk stratification of LACC.
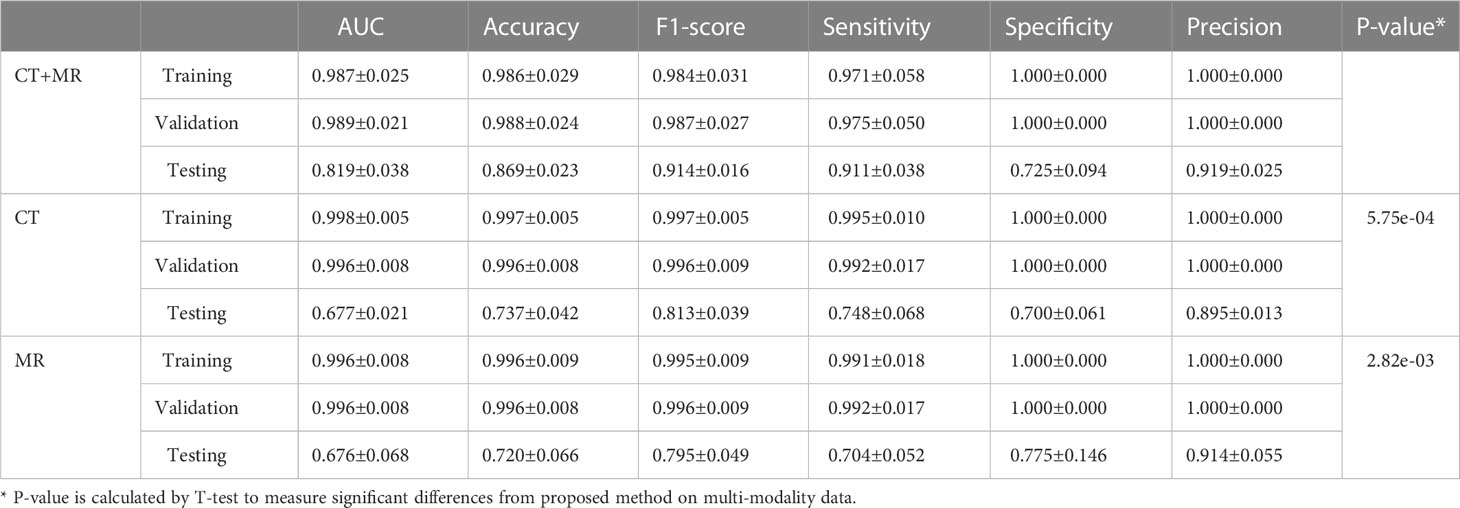
Table 3 Comparison results of the proposed method on mono-modality data and multi-modality data.
3.5 Efficacy of key modules in transformer network
We also validated the efficacy of key modules in transformer network. The detailed experimental design and results can be found in Supplementary Materials.
4 Discussion
In this study, we developed and evaluated a transformer network for the recurrence risk stratification of locally advanced cervical cancer (LACC) based on computed tomography (CT) and magnetic resonance (MR) images. The proposed method achieved excellent prediction performance, which could be potentially used as an effective tool for the decision-making support in a non-invasive way.
The individualized treatment of cervical cancer is guided by the FIGO staging (33, 34). For patients with LACC, the preferred treatment is concurrent chemoradiation rather than surgery (3). However, unlike surgery treatment that can evaluate recurrence risk based on the resected tumor, the concurrent chemoradiation lacks of the conditions for adequate pathological evaluation after local biopsy. Hysteretic risk assessment and intervention would lead to cancer recurrence for partial patients. Therefore, it is desirable to accurately predict the recurrence risk of LACC so as to determine appropriate adjuvant treatment strategies.
Under the current advocacy of precision medicine (35) powered by patient data (36), personalized treatment is the inevitable trend of current medical technology development. The FIGO 2018 staging system has acknowledged the value of imaging for optimal risk stratification and treatment planning (37, 38) and European Society of Urogenital Radiology (ESUR) guidelines also affirmed the important role of MR images in the risk assessment of cervical cancer recurrence (39). Additionally, medical imaging acquisition and storage techniques enable the non-invasive analysis for various diseases, which efficiently assists clinicians in disease diagnosis, treatment and prognosis (40, 41). Typically, radiomics signatures have been widely used and show promising value (42, 43). With the widespread promotion of deep learning technology, the threshold for mastering such high-precision models has been completely lowered. Compared to conventional radiomics methods, deep learning simplifies the multi-step pipeline by automatically learning useful features from images, and exhibits better predictive performance (44). As one of the challenges of deep learning, large-scale data are needed for model training. However, the low incidence of LACC might lead to insufficient training data. To this end, in our work, we employed the patch-based strategy to extract a large amount of image patches from each patient and additionally performed data augmentation to scale up training data and prevent overfitting. Furthermore, we designed a relatively simple network, which embedded three modality fusion modules and a fully-connected module, and the satisfactory results demonstrated its ability of recurrence risk stratification.
Computed tomography (CT) and magnetic resonance (MR) have been considered as the routine examinations of cervical cancer patients. Previous studies have suggested that CT and MR images help identify metastatic lymph nodes and distant metastases for patients with cervical cancer (45) and MR images can also evaluate the extent of tumors in the cervix and in the pelvis (46). Additionally, CT and MR images can provide information of tumors, such as lesion size and invasion degree, which is crucial for preliminary clinical staging and prognosis evaluation (47–51). Therefore, many models based on CT or MR images have been proposed for the subtype identification (52), staging analysis (53, 54), lymph node metastasis prediction (54, 55) and prognosis analysis (12, 56, 57) of cervical cancer. Compared to the above methods, the main contributions of this paper lie in the following aspects: (I) We first investigated the feasibility of deep learning method in accurately predicting recurrence risk so as to help formulate the individualized therapeutic schedule for LACC patients. (II) With matched CT and MR images, we proposed a multi-modality model to fully extract modality-specific and modality-sharable features for improving model's performance. (III) We developed a transformer network which can utilize multi-scale and multi-modality discriminative information and experimental results demonstrated its efficacy.
Our study had some limitations. First, our model was constructed only based on imaging (i.e., CT and MR) features, and more integrable factors (e.g., tumor size and tumor marker level) can be collected for further analysis. Second, the VOI segmentation was still a manual process, which was time-consuming and experience-dependent. Last but not the least, this work was a retrospective and single-site study, and a prospective and multi-site cohort is required to further evaluate the model's performance. Nevertheless, to the best of our knowledge, this is the first work to predict the recurrence risk of LACC patients via the deep learning technique, which might supply a valuable reference for the application of deep learning in LACC.
In conclusion, we investigated the ability of transformer network in recurrence risk stratification of LACC based on CT and MR images. The promising results demonstrated that the proposed models might help clinicians make clinical decisions for patients with LACC.
Data availability statement
The raw data supporting the conclusions of this article will be made available by the authors, without undue reservation.
Ethics statement
The studies involving human participants were reviewed and approved by the institutional review board of NanFang Hospital, Guangzhou, Guangdong, 510515, PR China. Written informed consent for participation was not required for this study in accordance with the national legislation and the institutional requirements.
Author contributions
JW: Conceptualization, resources, data curation. YM: Writing - original draft, methodology, visualization. XG: Investigation, resources. YZ: Supervision, funding acquisition, writing - review & editing, conceptualization. All authors contributed to the article and approved the submitted version. We would like to express our sincere gratitude towards Zhenyuan Ning for his treasured and generous support.
Funding
This work was supported in part by the National Natural Science Foundation of China under Grant 61971213 and Grant 61671230, in part by the Basic and Applied Basic Research Foundation of Guangdong Province under Grant 2019A1515010417, and in part by the Guangdong Provincial Key Laboratory of Medical Image Processing under Grant No. 2020B1212060039.
Conflict of interest
The authors declare that the research was conducted in the absence of any commercial or financial relationships that could be construed as a potential conflict of interest.
Publisher’s note
All claims expressed in this article are solely those of the authors and do not necessarily represent those of their affiliated organizations, or those of the publisher, the editors and the reviewers. Any product that may be evaluated in this article, or claim that may be made by its manufacturer, is not guaranteed or endorsed by the publisher.
Supplementary material
The Supplementary Material for this article can be found online at: https://www.frontiersin.org/articles/10.3389/fonc.2023.1100087/full#supplementary-material
Abbreviations
LACC, locally advanced cervical cancer; CT, computed tomography; MR, magnetic resonance; AUC, the area under the receiver operating characteristic curve; CI, confidence interval; PET, positron emission tomography; US, ultrasound; FIGO, International Federation of Gynecology and Obstetrics; VOI, volume of interest; BN, batch normalization; MLP, multi-layer perceptron; ViT, vision transformer; KNN, k-nearest neighbor; SVM, support vector machine; CPU, Central Processing Unit; GPU, Graphics Processing Unit; ROC, receiver operating characteristic; ESUR, European Society of Urogenital Radiology.
Footnotes
- ^ Since the data were collected from 2017, we uniformly used the FIGO 2009 staging system instead of the newly revised FIGO 2018.
References
1. Sung H, Ferlay J, Siegel RL, Laversanne M, Soerjomataram I, Jemal A, et al. Global cancer statistics 2020: GLOBOCAN estimates of incidence and mortality worldwide for 36 cancers in 185 countries. CA Cancer J Clin (2021) 71:209–49. doi: 10.3322/caac.21660
2. Loizzi V, Cormio G, Vicino M, Selvaggi L. Neoadjuvant chemotherapy: An alternative option of treatment for locally advanced cervical cancer. Gynecol Obstet Invest (2008) 65:96–103. doi: 10.1159/000108600
3. Cho O, Chun M. Management for locally advanced cervical cancer: New trends and controversial issues. Radiat Oncol J (2018) 36:254–64. doi: 10.3857/roj.2018.00500
4. Horeweg N, Mittal P, Gradowska PL, Boere I, Nout RA, Chopra S. A systematic review and meta-analysis of adjuvant chemotherapy after chemoradiation for locally advanced cervical cancer. Crit Rev Oncol Hematol (2022) 172:103638. doi: 10.1016/j.critrevonc.2022.103638
5. Nguyen VT, Winterman S, Playe M, Benbara A, Zelek L, Pamoukdjian F, et al. Dose-intense cisplatin-based neoadjuvant chemotherapy increases survival in advanced cervical cancer: An up-to-Date meta-analysis. Cancers (Basel) (2022) 14:842. doi: 10.3390/cancers14030842
6. Kokka F, Bryant A, Brockbank E, Powell M, Oram D. Hysterectomy with radiotherapy or chemotherapy or both for women with locally advanced cervical cancer. Cochrane Database Syst Rev (2015) 4:CD10260. doi: 10.1002/14651858.CD010260.pub2
7. Kumar V, Gu Y, Basu S, Berglund A, Eschrich SA, Schabath MB, et al. Radiomics: The process and the challenges. Magn Reson Imaging (2012) 30:1234–48. doi: 10.1016/j.mri.2012.06.010
8. Ai Y, Zhu H, Xie C, Jin X. Radiomics in cervical cancer: Current applications and future potential. Crit Rev Oncol Hematol (2020) 152:102985. doi: 10.1016/j.critrevonc.2020.102985
9. Reuz ES, Orlhac F, Chargari C, Nioche C, Limkin E, Riet F, et al. Prediction of cervical cancer recurrence using textural features extracted from 18F-FDG PET images acquired with different scanners. Oncotarget (2017) 8:43169. doi: 10.18632/oncotarget.17856
10. Gao S, Du S, Lu Z, Xin J, Gao S, Sun H. Multiparametric PET/MR (PET and MR-IVIM) for the evaluation of early treatment response and prediction of tumor recurrence in patients with locally advanced cervical cancer. Eur Radiol (2020) 30:1191–201. doi: 10.1007/s00330-019-06428-w
11. Jin X, Ai Y, Zhang J, Zhu H, Jin J, Teng Y, et al. Noninvasive prediction of lymph node status for patients with early-stage cervical cancer based on radiomics features from ultrasound images. Eur Radiol (2020) 30:4117–24. doi: 10.1007/s00330-020-06692-1
12. Yusufaly TI, Zou J, Nelson TJ, Williamson CW, Simon A, Singhal M, et al. Improved prognosis of treatment failure in cervical cancer with nontumor PET/CT radiomics. J Nucl Med (2022) 63:1087–109. doi: 10.2967/jnumed.121.262618
13. Szegedy C, Vanhoucke V, Ioffe S, Shlens J, Wojna Z. Rethinking the inception architecture for computer vision. Proceedings of the IEEE conference on computer vision and pattern recognition (2016) 2818–26.
14. Chartrand G, Cheng PM, Vorontsov E, Drozdzal M, Turcotte S, Pal CJ, et al. Deep learning: A primer for radiologists. Radiographics (2017) 37:2113–31. doi: 10.1148/rg.2017170077
15. Dai Y, Gao Y, Liu F. Transmed: Transformers advance multi-modal medical image classification. Diagnostics (2021) 11:1384. doi: 10.3390/diagnostics11081384
16. He K, Gan C, Li Z, Rekik I, Yin Z, Ji W, et al. Transformers in medical image analysis: A review. Intelligent Medicine (2022).
17. Dosovitskiy A, Beyer L, Kolesnikov A, Weissenborn D, Zhai X, Unterthiner T, et al. An image is worth 16×16 words: Transformers for image recognition at scale. arXiv preprint arXiv (2020). p. 2010.11929.
18. Liu S, Li R, Liu Q, Sun D, Yang H, Pan H, et al. Radiomics model of 18F-FDG PET/CT imaging for predicting disease-free survival of early-stage uterine cervical squamous cancer. Cancer Biomarkers: Section A Dis Markers (2022) 33(2):249–59. doi: 10.3233/CBM-210201
19. Beukinga RJ, Hulshoff JB, Mul VEM, Noordzij W, Kats-Ugurlu G, Slart R, et al. Prediction of response to neoadjuvant chemotherapy and radiation therapy with baseline and restaging (18)F-FDG PET imaging biomarkers in patients with esophageal cancer. Radiology (2018) 287(3):983–992. doi: 10.1148/radiol.2018172229
20. Onofrey JA, Casetti-Dinescu DI, Lauritzen AD, Sarkar S, Venkataraman R, Fan RE, et al. Generalizable multi-site training and testing of deep neural networks using image normalization. Proc IEEE Int Symp BioMed Imaging (2019) 2019:348–51. doi: 10.1109/ISBI.2019.8759295
21. Petit O, Thome N, Rambour C, Themyr L, Collins T, Soler L. U-Net transformer: Self and cross attention for medical image segmentation. In International Workshop on Machine Learning in Medical Imaging (2021) Springer 267–76.
22. Ning Z, Luo J, Li Y, Han S, Feng Q, Xu Y, et al. Pattern classification for gastrointestinal stromal tumors by integration of radiomics and deep convolutional features. IEEE J BioMed Health Inform (2018) 23:1181–91. doi: 10.1109/JBHI.2018.2841992
23. Kira K, Rendell LA. The feature selection problem: Traditional methods and a new algorithm. AAAI’92 (1992) 2(1992a):129–34. doi: 10.5555/1867135.1867155
24. Safavian SR, Landgrebe D. A survey of decision tree classifier methodology[J]. IEEE Trans Syst Man Cybern B Cybern (1991) 21(3):660–74. doi: 10.1109/21.97458
25. Rish I. An empirical study of the naive bayes classifier[C]. In: IJCAI 2001 workshop on empirical methods in artificial intelligence (2001) 3(22):41–46.
26. Peterson LE. K-Nearest neighbor[J]. Scholarpedia (2009) 4(2):1883. doi: 10.4249/scholarpedia.1883
27. Cortes C, Vapnik V. Support vector machine. Mach Learn (1995) 20:273–97. doi: 10.1007/BF00994018
28. He K, Zhang X, Ren S, Sun J. (2016). Deep residual learning for image recognition[C], in: Proceedings of the IEEE conference on computer vision and pattern recognition, . pp. 770–8.
29. Howard AG, Zhu M, Chen B, Kalenichenko D, Wang W, Weyand T, et al. Mobilenets: Efficient convolutional neural networks for mobile vision applications[J]. arXiv preprint arXiv (2017).
30. Perez L, Wang J. The effectiveness of data augmentation in image classification using deep learning. Convolutional Neural Networks Vis. Recognit(2017) 11(2017):1–8.
31. He K, Zhang X, Ren S, Sun J. Delving deep into rectifiers: Surpassing human-level performance on ImageNet classification. Biochem Biophys Res Commun (2015) 498:254–61. doi: 10.1109/ICCV.2015.123
32. Kingma DP, Ba J. Adam: A method for stochastic optimization. arXiv preprint arXiv (2014). p. 1412.6980.
33. Koh W, Abu-Rustum NR, Bean S, Bradley K, Campos SM, Cho KR, et al. Cervical cancer, version 3.2019, NCCN clinical practice guidelines in oncology. J Natl Compr Canc Netw (2019) 17:64–84. doi: 10.6004/jnccn.2019.0001
34. Bhatla N, Berek JS, Cuello Fredes M, Denny LA, Grenman S, Karunaratne K, et al. Revised FIGO staging for carcinoma of the cervix uteri. Int J Gynaecol Obstet (2019) 145(1):129–35. doi: 10.1002/ijgo.12749
35. Collins FS, Varmus H. A new initiative on precision medicine[J]. N Engl J Med (2015) 372(9):793–5. doi: 10.1056/NEJMp1500523
37. Wright JD, Matsuo K, Huang Y, Tergas AI, Hou JY, Khoury-Collado F, et al. Prognostic performance of the 2018 international federation of gynecology and obstetrics cervical cancer staging guidelines[J]. Obstetrics Gynecol (2019) 134(1):49. doi: 10.1097/AOG.0000000000003311
38. Manganaro L, Lakhman Y, Bharwani N, Gui B, Gigli S, Vinci V, et al. Staging, recurrence and follow-up of uterine cervical cancer using MRI: Updated guidelines of the European society of urogenital radiology after revised FIGO staging 2018[J]. Eur Radiol (2021) 31(10):7802–16. doi: 10.1007/s00330-020-07632-9
39. Kubik-Huch RA, Weston M, Nougaret S, Leonhardt H, Thomassin-Naggara I, Horta M, et al. European Society of urogenital radiology (ESUR) guidelines: MR imaging of leiomyomas[J]. Eur Radiol (2018) 28(8):3125–37. doi: 10.1007/s00330-017-5157-5
40. Xie C, Pang C, Chan B, Wong EY, Dou Q, Vardhanabhuti V. Machine learning and radiomics applications in esophageal cancers using non-invasive imaging methods–a critical review of literature. Cancers (2021) 13:2469. doi: 10.3390/cancers13102469
41. Huang G, Cui Y, Wang P, Ren J, Wang L, Ma Y, et al. Multi-parametric magnetic resonance imaging-based radiomics analysis of cervical cancer for preoperative prediction of lymphovascular space invasion. Front Oncol (2021) 11:663370. doi: 10.3389/fonc.2021.663370
42. Liu D, Zhang X, Zheng T, Shi Q, Cui Y, Wang Y, et al. Optimisation and evaluation of the random forest model in the efficacy prediction of chemoradiotherapy for advanced cervical cancer based on radiomics signature from high-resolution T2 weighted images. Arch Gynecol Obstet (2021) 303:811–20. doi: 10.1007/s00404-020-05908-5
43. Jia CL, Cao Y, Song Q, Zhang WB, Li JJ, Wu XX, et al. Radiomics nomogram of MR: A prediction of cervical lymph node metastasis in laryngeal cancer. Zhonghua Er Bi Yan Hou Tou Jing Wai Ke Za Zhi (2020) 55:1154–61. doi: 10.3760/cma.j.cn115330-20200719-00604
44. Borowiec ML, Dikow RB, Frandsen PB, McKeeken A, Valentini G, White AE. Deep learning as a tool for ecology and evolution. Methods Ecol Evol (2021) 13(8):1640–60. doi: 10.1111/2041-210X.13901
45. Haldorsen IS, Lura NAL, Blaak Ae RJ, Fischerova D, Werner HM. What is the role of imaging at primary diagnostic work-up in uterine cervical cancer? Curr Oncol Rep (2019) 21:1–15. doi: 10.1007/s11912-019-0824-0
46. Devine C, Viswanathan C, Faria S, Marcal L, Sagebiel TL. Imaging and staging of cervical cancer. Semin Ultrasound CT MR (2019) 40:280–6. doi: 10.1053/j.sult.2019.03.001
47. Yu K, Zhang C, Berry GJ, Altman RB, Re C, Rubin DL, et al. Predicting non-small cell lung cancer prognosis by fully automated microscopic pathology image features. Nat Commun (2016) 7:1–10. doi: 10.1038/ncomms12474
48. Cozzi L, Dinapoli N, Fogliata A, Hsu WC, Reggiori G, Lobefalo F, et al. Radiomics based analysis to predict local control and survival in hepatocellular carcinoma patients treated with volumetric modulated arc therapy. BMC Cancer (2017) 17:1–10. doi: 10.1186/s12885-017-3847-7
49. van Timmeren JE, Leijenaar RT, van Elmpt W, Reymen B, Oberije C, Monshouwer R, et al. Survival prediction of non-small cell lung cancer patients using radiomics analyses of cone-beam CT images. Radiother Oncol (2017) 123:363–9. doi: 10.1016/j.radonc.2017.04.016
50. Ning Z, Luo J, Xiao Q, Cai L, Chen Y, Yu X, et al. Multi-modal magnetic resonance imaging-based grading analysis for gliomas by integrating radiomics and deep features. Ann Transl Med (2021) 9:298. doi: 10.21037/atm-20-4076
51. Chen T, Ning Z, Xu L, Feng X, Han S, Roth HR, et al. Radiomics nomogram for predicting the malignant potential of gastrointestinal stromal tumours preoperatively. Eur Radiol (2019) 29:1074–82. doi: 10.1007/s00330-018-5629-2
52. Tsujikawa T, Rahman T, Yamamoto M, Yamada S, Tsuyoshi H, Kiyono Y, et al. 18F-FDG PET radiomics approaches: Comparing and clustering features in cervical cancer. Ann Nucl Med (2017) 31:678–85. doi: 10.1007/s12149-017-1199-7
53. Mu W, Chen Z, Liang Y, Shen W, Yang F, Dai R, et al. Staging of cervical cancer based on tumor heterogeneity characterized by texture features on 18F-FDG PET images. Phys Med Biol (2015) 60:5123. doi: 10.1088/0031-9155/60/13/5123
54. Song J, Hu Q, Ma Z, Zhao M, Chen T, Shi H. Feasibility of T2WI-MRI-based radiomics nomogram for predicting normal-sized pelvic lymph node metastasis in cervical cancer patients. Eur Radiol (2021) 31:6938–48. doi: 10.1007/s00330-021-07735-x
55. Dong T, Yang C, Cui B, Zhang T, Sun X, Song K, et al. Development and validation of a deep learning radiomics model predicting lymph node status in operable cervical cancer. Front Oncol (2020) 10:464. doi: 10.3389/fonc.2020.00464
56. Liu S, Li R, Liu Q, Sun D, Yang H, Pan H, et al. Radiomics model of 18F-FDG PET/CT imaging for predicting disease-free survival of early-stage uterine cervical squamous cancer. Cancer biomark (2022) 33:249–59. doi: 10.3233/CBM-210201
Keywords: cervical cancer, recurrence risk stratification, multi-modality data, deep learning, transformer network
Citation: Wang J, Mao Y, Gao X and Zhang Y (2023) Recurrence risk stratification for locally advanced cervical cancer using multi-modality transformer network. Front. Oncol. 13:1100087. doi: 10.3389/fonc.2023.1100087
Received: 16 November 2022; Accepted: 01 February 2023;
Published: 16 February 2023.
Edited by:
Alessio G. Morganti, University of Bologna, ItalyCopyright © 2023 Wang, Mao, Gao and Zhang. This is an open-access article distributed under the terms of the Creative Commons Attribution License (CC BY). The use, distribution or reproduction in other forums is permitted, provided the original author(s) and the copyright owner(s) are credited and that the original publication in this journal is cited, in accordance with accepted academic practice. No use, distribution or reproduction is permitted which does not comply with these terms.
*Correspondence: Yu Zhang, yuzhang@smu.edu.cn
†These authors have contributed equally to this work and share first authorship