 Valentin-Florian Rauca1,2
 Laurian Vlase3*Tibor Casian3Alina Sesarman1,2Ana-Maria Gheldiu4
 Andrei Mocan4Manuela Banciu1,2
 Anca Toiu5
- 1Department of Molecular Biology and Biotechnology, Faculty of Biology and Geology, Babes-Bolyai University, Cluj-Napoca, Romania
- 2Molecular Biology Centre, Institute for Interdisciplinary Research in Bio-Nano-Sciences, Babes-Bolyai University, Cluj-Napoca, Romania
- 3Department of Pharmaceutical Technology and Biopharmacy, “Iuliu Haţieganu” University of Medicine and Pharmacy, Cluj-Napoca, Romania
- 4Department of Pharmaceutical Botany, “Iuliu Haţieganu” University of Medicine and Pharmacy, Cluj-Napoca, Romania
- 5Department of Pharmacognosy, “Iuliu Haţieganu” University of Medicine and Pharmacy, Cluj-Napoca, Romania
Backround: Ajuga species have been used in traditional medicine for their diuretic, anti-inflammatory, wound-healing, and hepatoprotective properties.
Purpose: The phytochemical profile and anticancer potential of three Ajuga sp. (A. genevensis, A. chamaepitys, and A. laxmannii) from Romania was investigated.
Materials and Methods: The phytochemicals were extracted from the aerial parts of Ajuga sp. by using different solvents and methods. The hydroalcoholic extracts were examined for total phenolic, flavonoid and iridoid contents, and HPLC/MS was used to analyze the polyphenolic compounds and iridoids. The phytochemical profile was also evaluated by principal component analysis in connection with antitumor efficacy of extracts. The antiproliferative potential was evaluated using the ELISA BrdU-colorimetric immunoassay. Western Blot with regard to inflammatory protein NF-κB (nuclear factor kappa-light-chain-enhancer of activated B cells) p65 subunit expression in cell lysates was performed. Quantification of oxidative stress marker malondialdehyde (MDA) was determined by high-performance liquid chromatography (HPLC). Enzymatic and non-enzymatic antioxidant capability was assessed by measuring catalase activity and by evaluating the total antioxidant capacity (TAC) of treated cells.
Results: Ajuga laxmannii ethanol extract showed the highest total phenolic and flavonoid content, while A. genevensis ethanol extract was more abundant in iridoids. The overall cytostatic effect of the investigated plant extracts was exerted through strong inhibitory actions on NF-κB, the key molecule involved in the inflammatory response and via oxidative stress modulatory effects in both murine colon carcinoma and melanoma cell lines.
Conclusion: Ajuga laxmannii showed the most significant antitumor activity and represents an important source of bioactive compounds, possibly an additional form of treatment alongside conventional anticancer drugs.
Introduction
Medicinal plants have always been an important source for various pharmaceuticals since ancient times. Nowadays the scientific interest for new drugs production from bioactive compounds isolated from natural products is still growing. Herbal medicines were often used only based on empirical observations since antiquity, without knowing the phytochemicals from the extracts or details of their pharmacological effects (Atanasov et al., 2015). Although many herbal remedies have a well-known composition and certain biological effects, some of them are still used only based on traditional medicine, and lacking the validation of their safety and efficacy. The research on unexplored medicinal plants traditionally used in folk medicine could determine the development of novel herbal formulations with significant biological activities. Due to their important pharmacological effects, the natural compounds are effectively used to obtain new phytomedicines. Ajuga species (Lamiaceae), which are widely distributed in many parts of the world (Atay et al., 2016) present significant medicinal importance, confirmed by the large number of constitutive compounds with anti-inflammatory, antioxidant, cytotoxic, analgesic, or antibacterial activity (Israili and Lyoussi, 2009; Toiu et al., 2018). Six Ajuga species are mentioned in the Romanian spontaneous flora, with Ajuga genevensis L. and Ajuga reptans L. widely distributed and used in traditional medicine, although there are few data on phytochemistry and bioactivities of Romanian species (Toiu et al., 2016, 2017). A. laxmannii (Murray) Benth is used in folk medicine as a galactagogue and anti-inflammatory agent. Our previous research showed the antioxidant, antimicrobial, and anti-inflammatory effects of aerial parts extracts (Toiu et al., 2018). A. chamaepitys (L.) Schreb. is a typical herb from Mediterranean area, which can also be found in other parts of Europe, the Near and Middle East. The monoterpene glycosides content and the essential oil composition have been recently studied on species from Italy, together with the evaluation of antioxidant activity and cytotoxicity by MTT assay (Venditti et al., 2016).
The anticancer activity of natural compounds is attributed to their synergistically acting complex mixture of phytochemicals with chemopreventive and chemotherapeutic potential, which can prove to be far more effective than isolated bioactive molecules (de Kok et al., 2008). Accordingly, the unexplored plants used in folk medicine require extensive studies for reliable evidence-based phytotherapy.
Although complementary and alternative ethnopharmacological approaches are mainly focused on counteracting the side effects and collateral symptoms of conventional cancer therapies, in this paper we investigated a potential disjunction (change in traditional plant use) (Leonti and Casu, 2013), by assessing the anticancer activity of these indigenous herbs. Therefore, this study was aimed to perform a comparative phytochemical analysis of A. genevensis, A. chamaepitys, and A. laxmannii aerial parts extracts, mainly polyphenolic compounds and iridoids, and to assess the anticancer potential against B16.F10 murine melanoma and C26 colon carcinoma cells. Both cell lines are characterized by increased metastatic potential and are prone to therapeutic alterations of their redox status (Rauca et al., 2018; Sesarman et al., 2018). In addition, melanoma and colon carcinoma are two of the deadliest cancers in modern society, possibly interlinked by epigenetic mechanisms, as recent reports concluded that colorectal cancer is one of the most common discordant cancers post-melanoma (Frank et al., 2017). As previously reported, the highly metastatic B16.F10 murine melanoma cells present a multitude of genetic alterations leading to an abnormal constitutive activation of the major signaling pathway Ras/Raf/MEK/ERK (MAPK), in contrast to normal melanocytes, in which the activation of this path is weak (Alupei et al., 2014). In colon cancer cells, as opposed to normal colon epithelial cells, the PI3K/PTEN/AKT signaling pathway is altered via frequent mutations of PTEN (Zhang et al., 2015). Moreover, one of the most important downstream targets of both Raf and AKT is NF-κB (Yajima et al., 2012), which is considered a potential key player in the treatment of melanoma (Madonna et al., 2012) and a major orchestrator in the initiation and propagation of colorectal cancer (Vaiopoulos et al., 2013). The potential synergistic interaction between bioactive constituents suggests that the whole plant extract may contribute to better therapeutic outcomes compared to the administration of single isolated compounds at an equivalent dose (Rasoanaivo et al., 2011).
Materials and Methods
Chemicals and Reagents
High purity chemicals: sodium carbonate, sodium acetate trihydrate, and anhydrous aluminum chloride were acquired from Sigma-Aldrich (Germany). Folin-Ciocâlteu reagent was purchased from Merck (Germany). The standard chemicals; chlorogenic acid, p-coumaric acid, caffeic acid, rutin, apigenin, quercetin, isoquercitrin, hyperoside, kaempferol, quercetol, myricetol, fisetin, gallic acid, aucubin, catalpol, and harpagoside were sourced from Sigma-Aldrich (Germany), ferulic acid, sinapic acid, gentisic acid, patuletin, luteolin from Roth (Germany), caftaric acid from Dalton (United States), harpagide, and 8-O-acetyl-harpagide from PhytoLab GmbH & Co. (Germany). HPLC grade solvents (methanol, acetonitrile, ammonium acetate, and silver nitrate) were purchased from Sigma-Aldrich. Distilled, deionised water was produced by a Direct Q-5 Millipore (Millipore SA, Molsheim, France) water system.
Preparation of Standard Solutions
Standard stock solutions of the flavonoids and iridoids were prepared by dissolving 1 mg of each compound in 1 mL methanol and stored at 4°C, protected from daylight. They were appropriately diluted with double distilled water before being used as working solutions.
Plant Samples and Extraction Procedures
The aerial parts of Ajuga species collected in flowering stage in June 2016 were obtained and authenticated by one of us (A.M.) from Cluj County, Romania and deposited in the Department of Pharmacognosy, “Iuliu Haţieganu” University, Cluj-Napoca (voucher specimens AG-23, AC-2, and AL-3, respectively). The dried plant samples were ground to a fine powder before extraction. The aerial parts extracts of A. genevensis, A. chamaepitys, and A. laxmannii were prepared by reflux extraction, using 5 g herbal material and different solvents (100 mL 70% methanol and 100 mL 70% ethanol, respectively), for 30 min, at 60°C (Methanol Extract, ME and Ethanol Extract, EE, respectively) (Toiu et al., 2018). The extracts were filtered and stored in dark glass bottle at +4°C until further analysis.
Total Phenolic, Flavonoid, and Iridoid Content of Aerial Parts Extracts
The TPC was determined by Folin-Ciocalteu method with slight modification (Toiu et al., 2018) and expressed as GAEs, meaning mg gallic acid/g dry weight herbal material (mg GAEs/g dw) (R2 = 0.999). The TFC was determined using AlCl3 method (Toiu et al., 2018), and expressed as REs (mg RE/g dw) (R2 = 0.999). The TIC was determined by a photometric method based on a Trim-Hill reaction and the results were expressed as AEs (mg AE/g dw) (Erdenechimeg et al., 2017).
High Performance Liquid Chromatography (HPLC)- Mass Spectrometry (MS) Methods
According to the previously reported methods (Vlase et al., 2012; Toiu et al., 2018) chromatographic separations were carried out on an Agilent 1100 HPLC Series system (Agilent Technologies, Darmstadt, Germany), coupled to an Agilent Ion Trap SL mass spectrometer with an electrospray or APCI ion source.
The liquid chromatograph was equipped with binary gradient pump, degasser, column thermostat and autosampler. The chromatographic separation was performed on a reversed-phase Zorbax SB-C18 (100 mm × 3.0 mm i.d., 3.5 μm) analytical column. The column temperature was set at 48°C. The chromatographic data were collected and processed by ChemStation and DataAnalysis software from Agilent, United States. The MS system operated using an electrospray ion source in negative mode. The identification and quantification of polyphenols were made in UV assisted by MS. Quantitative determinations were performed using an external standard method. In order to determine the concentration of polyphenols in plant samples, the calibration curves in the range of 0.5–50 μg/mL for a five point plot, with good linearity (R2 > 0.999) were employed. The compounds were identified by comparison of their retention times and the recorded ESI-MS with those of standards in the same chromatographic conditions (Vlase et al., 2012; Andriamadio et al., 2015). LC-ESI-MS/MS analysis of iridoids was performed using an Agilent 1100 model coupled to an Agilent Ion Trap 1100 SL MS instrument. The LC was equipped with a binary pump, autosampler, thermostat and detector (all 1100 Series from Agilent Inc., United States). The separation was carried out on an Atlantis HILIC (100 mm × 3.0 mm, 3.5 μm) analytical column. The system was controlled with Data Analysis software (version B01.03, Agilent Inc., United States).
The mass spectrometer equipped with an electrospray ionization (ESI) source operated in the positive mode, with a scan range between 360 and 680 m/z. The LC-ESI-MS/MS method identified the targeted iridoids (aucubin, catalpol, harpagide, harpagoside, and 8-O-acetyl-harpagide) based on their sodium adducts (M+23 m/z): aucubin (369 m/z), catalpol (385 m/z), harpagide (387.2 m/z), harpagoside (517.4 m/z) and 8-O-acetyl-harpagide (429.3 m/z), and by comparison with standards in the same chromatographic conditions. The working conditions were determined as the capillary temperature to 300°C, drying gas flow (Nitrogen) 12 L/min, and a pressure of 60 psi for the nebulizer. For quantitation of the iridoids, stock solutions of the five commercially available standards were prepared in acetonitrile. All calibration curves yielded a coefficient of determination of R2 ≥ 0.99. The results are expressed as μg per mL of extract (μg/mL).
Cell Types and Culture Conditions
The B16.F10 murine melanoma cell line was cultured in DMEM medium (Lonza, Basel, Switzerland). The C26 murine colon carcinoma cell line (Cell Lines Service GmbH, Eppelheim, Germany) was cultured in RPMI-1640 medium (Lonza, Basel, Switzerland). Culture media were supplemented with 10% heat-inactivated fetal bovine serum (FBS), 100 IU/mL penicillin, 100 μg/mL streptomycin and 4 mM L-glutamine. The cells were incubated as monolayers at 37°C in a 5% CO2 humidified atmosphere.
Cell Proliferation Assay
To determine the effect of Ajuga sp. extracts on B16.F10 murine melanoma and C26 colon carcinoma cells proliferation, 5 × 10³ cancer cells/well were cultured in 96-well plates for 24 h. The range of concentrations for each extract was selected based on previous studies regarding in vitro cytotoxic activity of Ajuga sp. (Sadati et al., 2012) and the effect was measured in triplicate samples for the controls (cells incubated in medium alone) and for each concentration of the vegetal extracts. To screen for ethanol toxicity, cells were incubated with the same concentrations of the solvent as those used for the preparation of the ethanolic extracts. The proliferative activity of the cancer cells after different treatments was tested using ELISA BrdU-colorimetric immunoassay (Roche Applied Science, Penzberg, Germany) as previously described (Licarete et al., 2017). Cell proliferation was calculated as percentage of untreated cells (control value). To measure the effectiveness of the treatments, the IC50 was calculated by GraphPad Prism version 6 for Windows software.
Preparation of Cell Lysates
To assess the biological activity of the selected plant species, the extract concentrations that exerted strong (IC80) and medium (IC50) inhibition of proliferation in both cell lines (IC40 and IC20 in the case of EAAG on B16.F10 cells) were used for total cell lysates preparation as described previously (Licarete et al., 2017). The adherent co-cultured cells after different treatments were detached and lysed with lysis buffer containing 10 mM HEPES (pH 7), 200 mM NaCl, 1%Triton X, 10 mM MgCl2, 1 mM dithiothreitol (DTT), and protease inhibitor cocktail tablets (Complete, Roche Diagnostics GmbH, Germany). The homogenates were incubated for 30 min on ice and then centrifuged for 10 min at 15 000 × g, at 4°C. The supernatants were collected and stored at -80°C for molecular investigations (Rauca et al., 2018). To determine the protein concentration of each sample, the Bradford assay was used (BioRad, Hercules, CA, United States) (Alupei et al., 2014).
Western Blot Analysis of the Expression Levels of NF-κB-p65 Subunit
To assess the effect of the selected ethanolic extracts on the expression of key inflammatory transcription factor NF-κB-p65 subunit in the cell lysates obtained from standard C26 and B16.F10 cell culture, western blot analysis was performed, as previously described (Patras et al., 2016). A total of 40 μg of total protein was loaded per lane onto a 10% polyacrylamide gel. Electrophoresis was performed at 50 mV, and the electro-transfer of proteins onto a nitrocellulose membrane was conducted at 100 mV for 50 min. The membranes were blocked with 5% skimmed milk powder (Bio-Rad Laboratories, Inc., Hercules, CA, United States) in TBS containing 0.1% Tween-20 (TBS-T) for 3 h at room temperature. Subsequently, the membranes were incubated at 4°C overnight with mouse monoclonal anti-NF-κB-p65 antibodies (sc56735; Santa Cruz Biotechnology, Inc., Dallas, TX, United States), diluted 500-fold in 5% skimmed milk powder in TBS-T. A primary rabbit polyclonal antibody against mouse β-actin (A2103; Sigma-Aldrich; Merck KGaA), diluted 1,000-fold in TBS-T, was used for the loading control. To detect the bound antibodies, the membranes were washed with TBS-T and incubated with a goat anti-rabbit (sc-2004; Santa Cruz Biotechnology, Inc.) or a goat anti-mouse horseradish peroxidase (HRP)-conjugated IgG (secondary antibody, sc-2005; Santa Cruz Biotechnology, Inc.), diluted 4,000-fold in 5% skimmed milk powder in TBS-T at room temperature for 1 h. The detection was performed by using ClarityTM Western ECL kit (Bio-Rad Laboratories, Hercules, CA, United States) and the membranes were exposed to an X-ray film (Kodak, Knoxville, TN, United States) for 3 min max. The analysis of the films was performed using Image J freeware for Windows 7 64 bit (Licarete et al., 2017). The final results were presented as mean ± standard deviation (SD) of two independent experiments.
Measurement of Oxidative Stress Parameters
Malondialdehyde levels in cell lysates were determined by high-performance liquid chromatography (HPLC) as previously described (Licarete et al., 2017). After cell lysates deproteinization, quantification of MDA was performed using HPLC column type RP18 (5 μm) (Supelco, Bellefonte, PA, United States) and a mobile phase consisting of 30 mM KH2PO4/methanol in a volume ratio of 65:35. Flow rate was set at 1 mL/min and MDA absorbance was measured at 254 nm. The retention time of MDA was about 2.8 min. Data were normalized to the protein concentration from the cell lysates and expressed as μg MDA/mg protein. Each sample was determined in duplicate. The measurement of catalase activity was performed according to the method of Aebi and was expressed as units of catalytic activity/mg of protein (Aebi, 1984). The assessment of TAC was based on the method described by Erel and the results expressed as mmoles of non-enzymatic antioxidants/mg of protein (Erel, 2004). The samples were measured in duplicate.
Multivariate Data Analysis
The interspecies induced variability in the phytochemical composition of extracts was evaluated using OPLS-DA (Orthogonal PLS – Discriminant Analysis). Prior to model development the X dataset, represented by the phytochemical composition of each extract, and Y dataset, represented by a binary variable matrix encoding class membership were scaled to unit variance. Class membership of observations was assigned in function of plant species. Model performance was evaluated through the fraction of explained variability by each component (R2X), the total variation of Y explained by the model (R2Y), and predictive capacity (Q2) calculated using full cross-validation. Interpretations were done by generating the corresponding score and loading plots (SIMCA 15, Sartorius Stedim, Sweden).
Correlations between biological activity and extract type were evaluated using PLS method, through an experimental design approach (Modde 11 Pro, Sartorius Stedim, Sweden). The full factorial experimental design was built on three factors, namely extract type (EEAG, EEAC, and EEAL), cell type (B16F10, C26), and extract concentration. The response was represented by the percentage of proliferation inhibition against the control group (untreated cells). Model performance was evaluated using R2, Q2, Validity and Reproducibility parameters, while model significance and lack of fit were assessed using F-testing. Interpretations were done by generating coefficient plots, and the significance of each coefficient (factor) was tested using ANOVA.
Statistical Analysis
All phytochemical assays were performed in triplicate, and the results were expressed as the mean ± S.D. Statistical comparisons between two independent groups were performed using the Student’s t-test (with equal and unequal variances, depending upon to the results of the F-test) for normally distributed data. Pearson and Spearman’s correlation analyses were used to calculate statistical relationships between parameters. Analyses were performed using SPSS 16.0 for Windows (SPSS Inc., United States). Data from different experiments were indicated as mean ± SD. The IC20, IC40, IC50, and IC80 values of different treatments were calculated by using non-linear regression of sigmoidal dose response curves and interpolation of fit offered by the GraphPad Prism version 6 for Windows, GraphPad Software (San Diego, CA, United States). Phytochemical composition of extracts originating from different species was evaluated using OPLS-DA (Orthogonal PLS – Discriminant Analysis). The antioxidant and anti-inflammatory effects of the selected Ajuga sp. extracts on C26 and B16.F10 cell lines were evaluated using one-way ANOVA with Bonferroni correction for multiple comparisons. A value of P < 0.05 was considered statistically significant.
Results
Total Bioactive Compounds and HPLC-MS Analysis
Results for TPC, TFC, and TIC for the Ajuga sp. extracts are presented in Table 1. In all cases the ethanol extracts contained higher amounts of each class of bioactive compounds compared to methanol extracts. The values for TPC and TFC were higher in EEAL extracts, followed by EEAC, whereas EEAG extract was more abundant in iridoids. The content in total iridoids was similar in A. genevensis and A. laxmannii extracts. The results were in good agreement with our previous studies on EEAL extracts (Toiu et al., 2018).
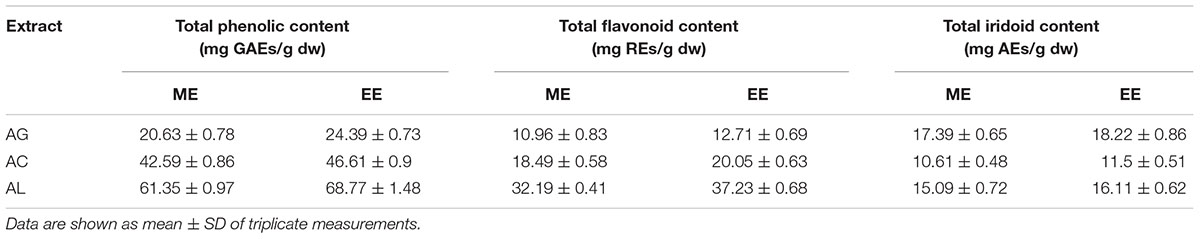
Table 1. Total phenolic, flavonoid, and iridoid content in A. genevensis (AG), A. chamaepitys (AC), and A. laxmannii (AL) extracts.
The analysis of the Ajuga sp. extracts using an optimized HPLC/MS method showed the presence of 9 polyphenols (three phenolcarboxylic acids, four flavonoid glycosides, and two free aglycones) (Figure 1 and Table 2) The HPLC-MS analysis of iridoids indicated that the major compound identified in all extracts was 8-O-acetyl-harpagide, followed by harpagide, while the aucubin and catalpol were found in lower amount (Figures 2, 3 and Table 3). The spectrophotometric determinations revealed that EEAG contains the highest amount of iridoids, and the HPLC analysis showed the same tendency. The obtained results allow the characterization of Ajuga sp. extracts in main biologically active compounds, therefore the possibility of correlation between the therapeutic effect and the dose.
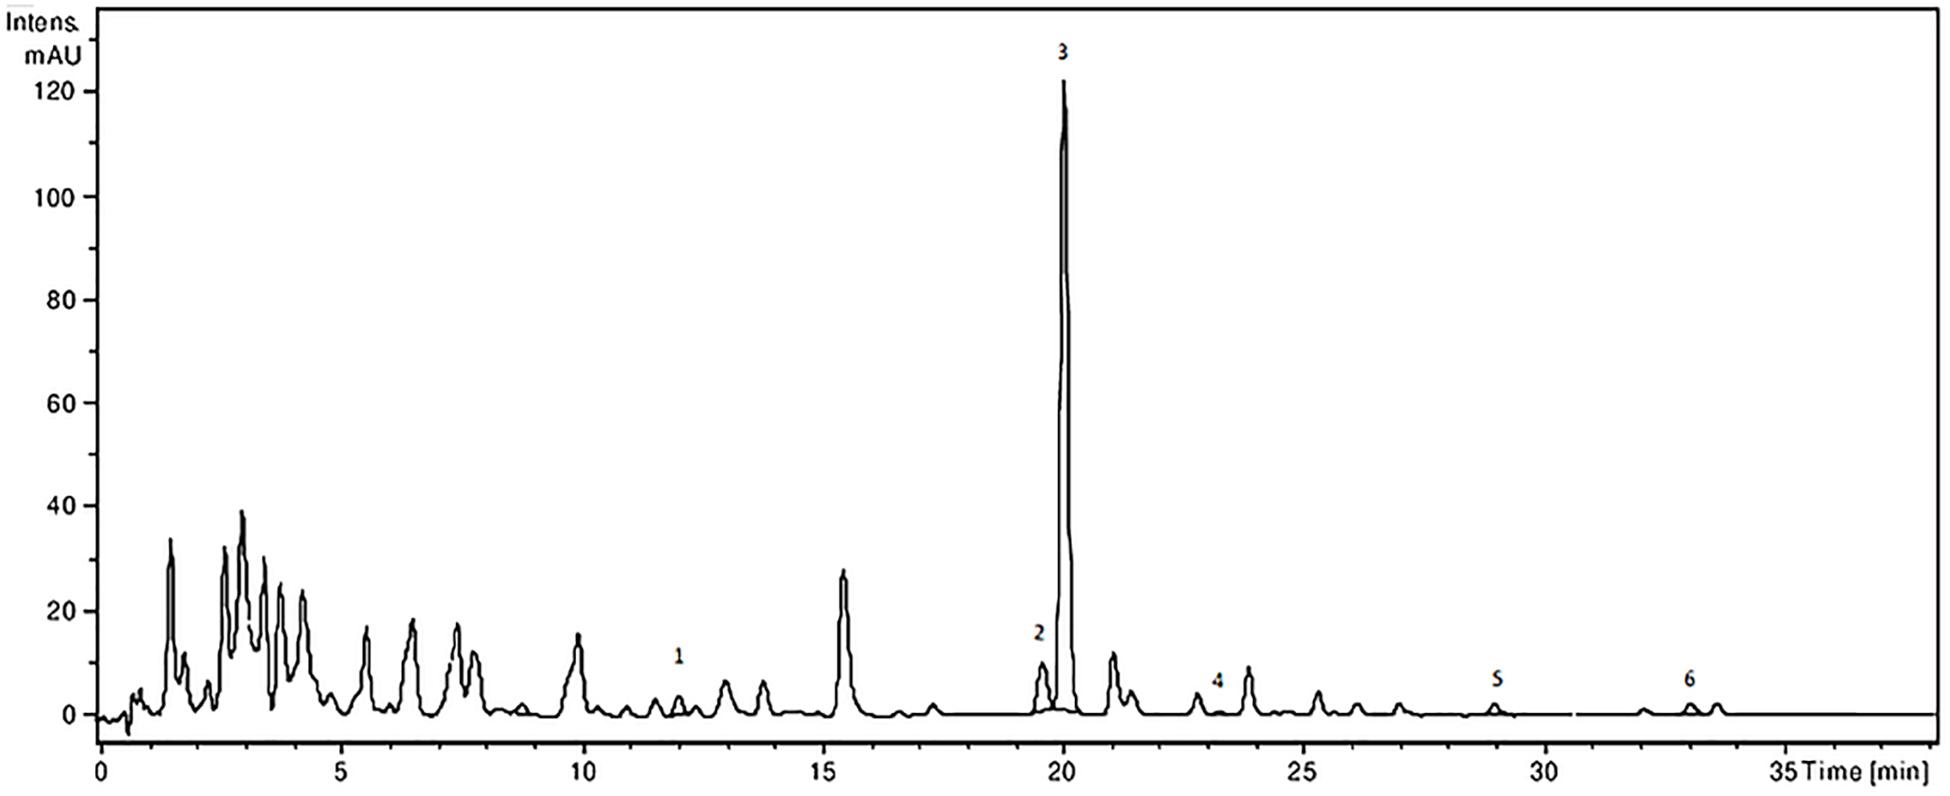
Figure 1. HPLC-UV-MS chromatogram of polyphenolic compounds from A. laxmannii ethanol extract. The identified compounds: ferulic acid (1), isoquercitrin (2), rutin (3), quercitrin (4), luteolin (5), and apigenin (6).
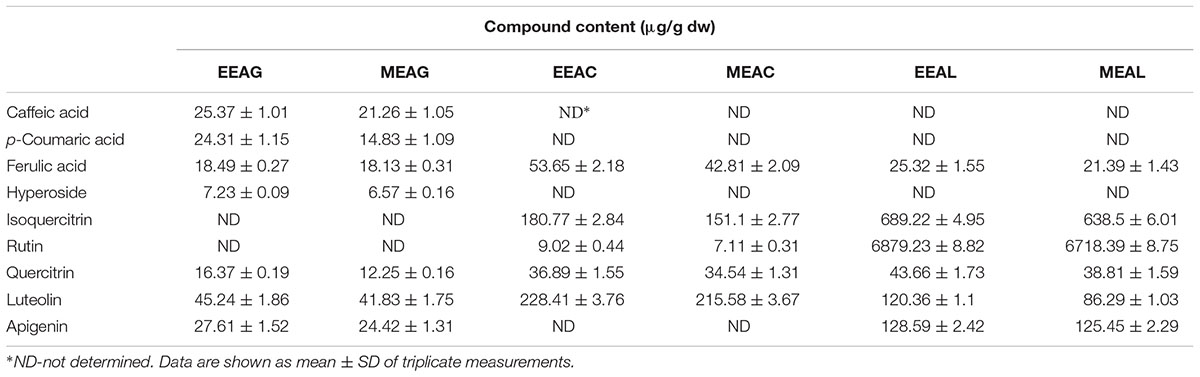
Table 2. Polyphenolic profile of A. genevensis (AG), A. chamaepitys (AC), and A. laxmannii (AL) extracts.
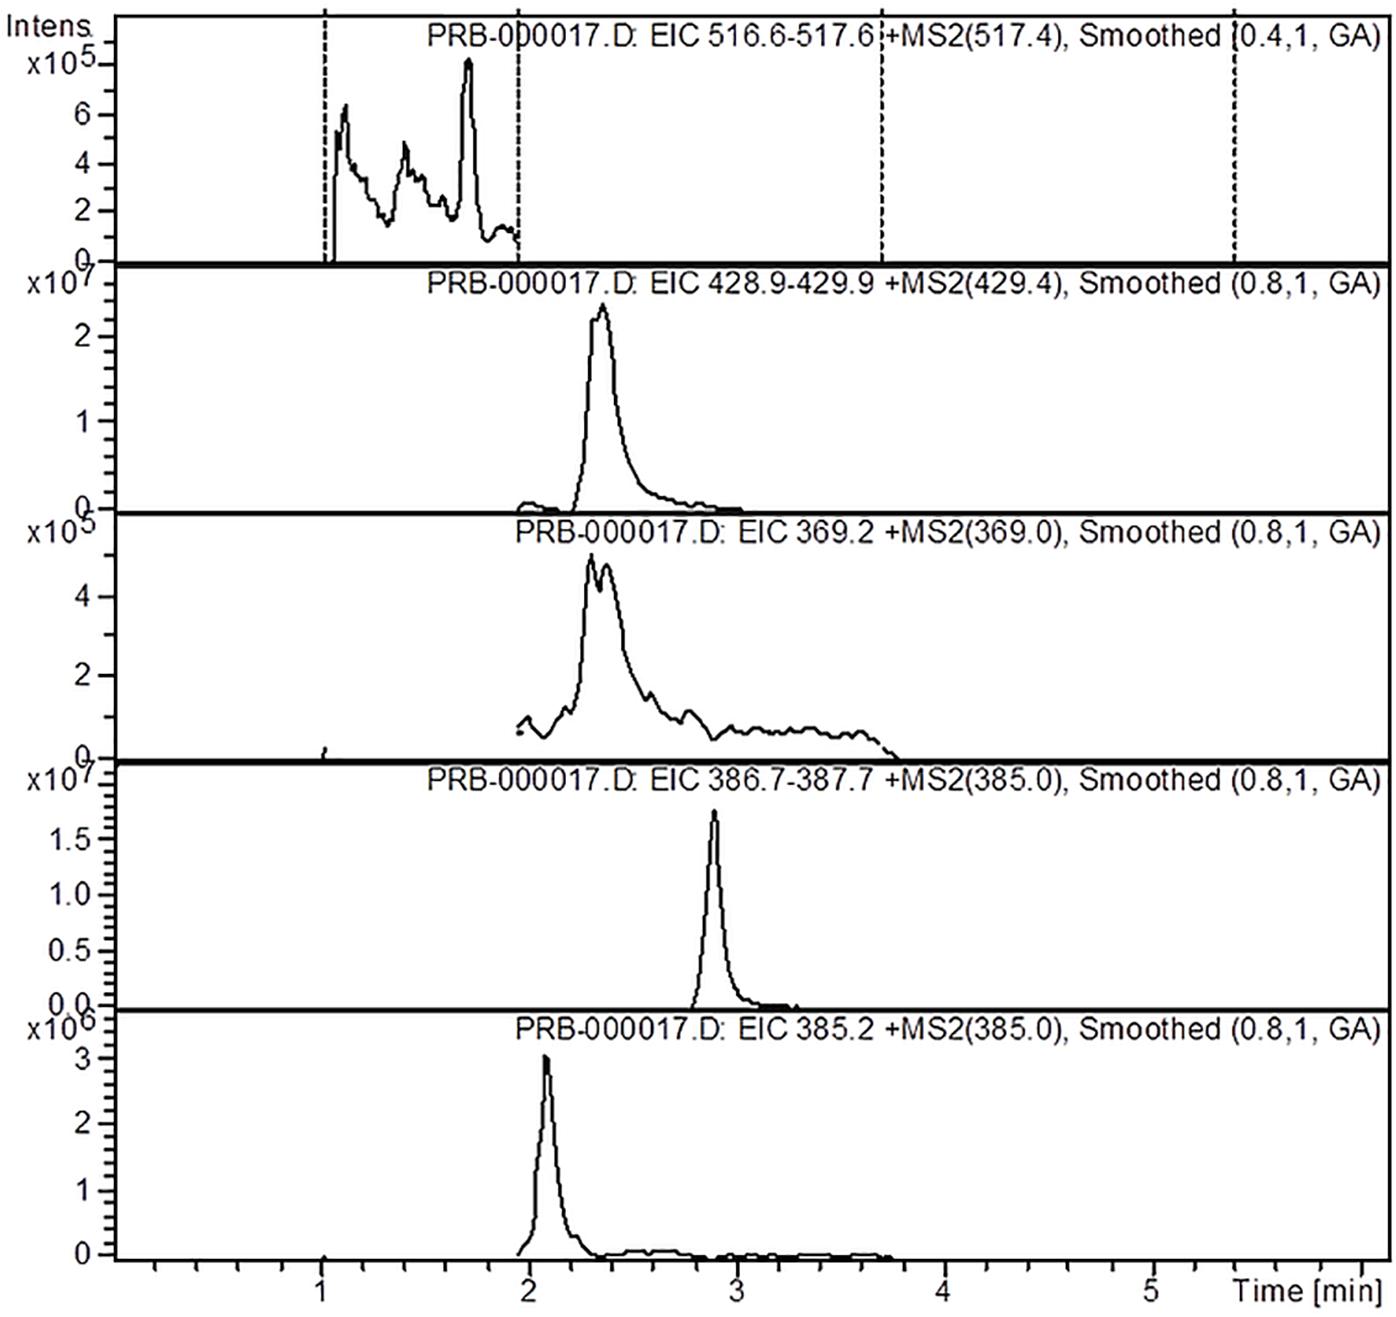
Figure 2. HPLC-MS-MS chromatogram of iridoids from A.genevensis ethanolic extract.
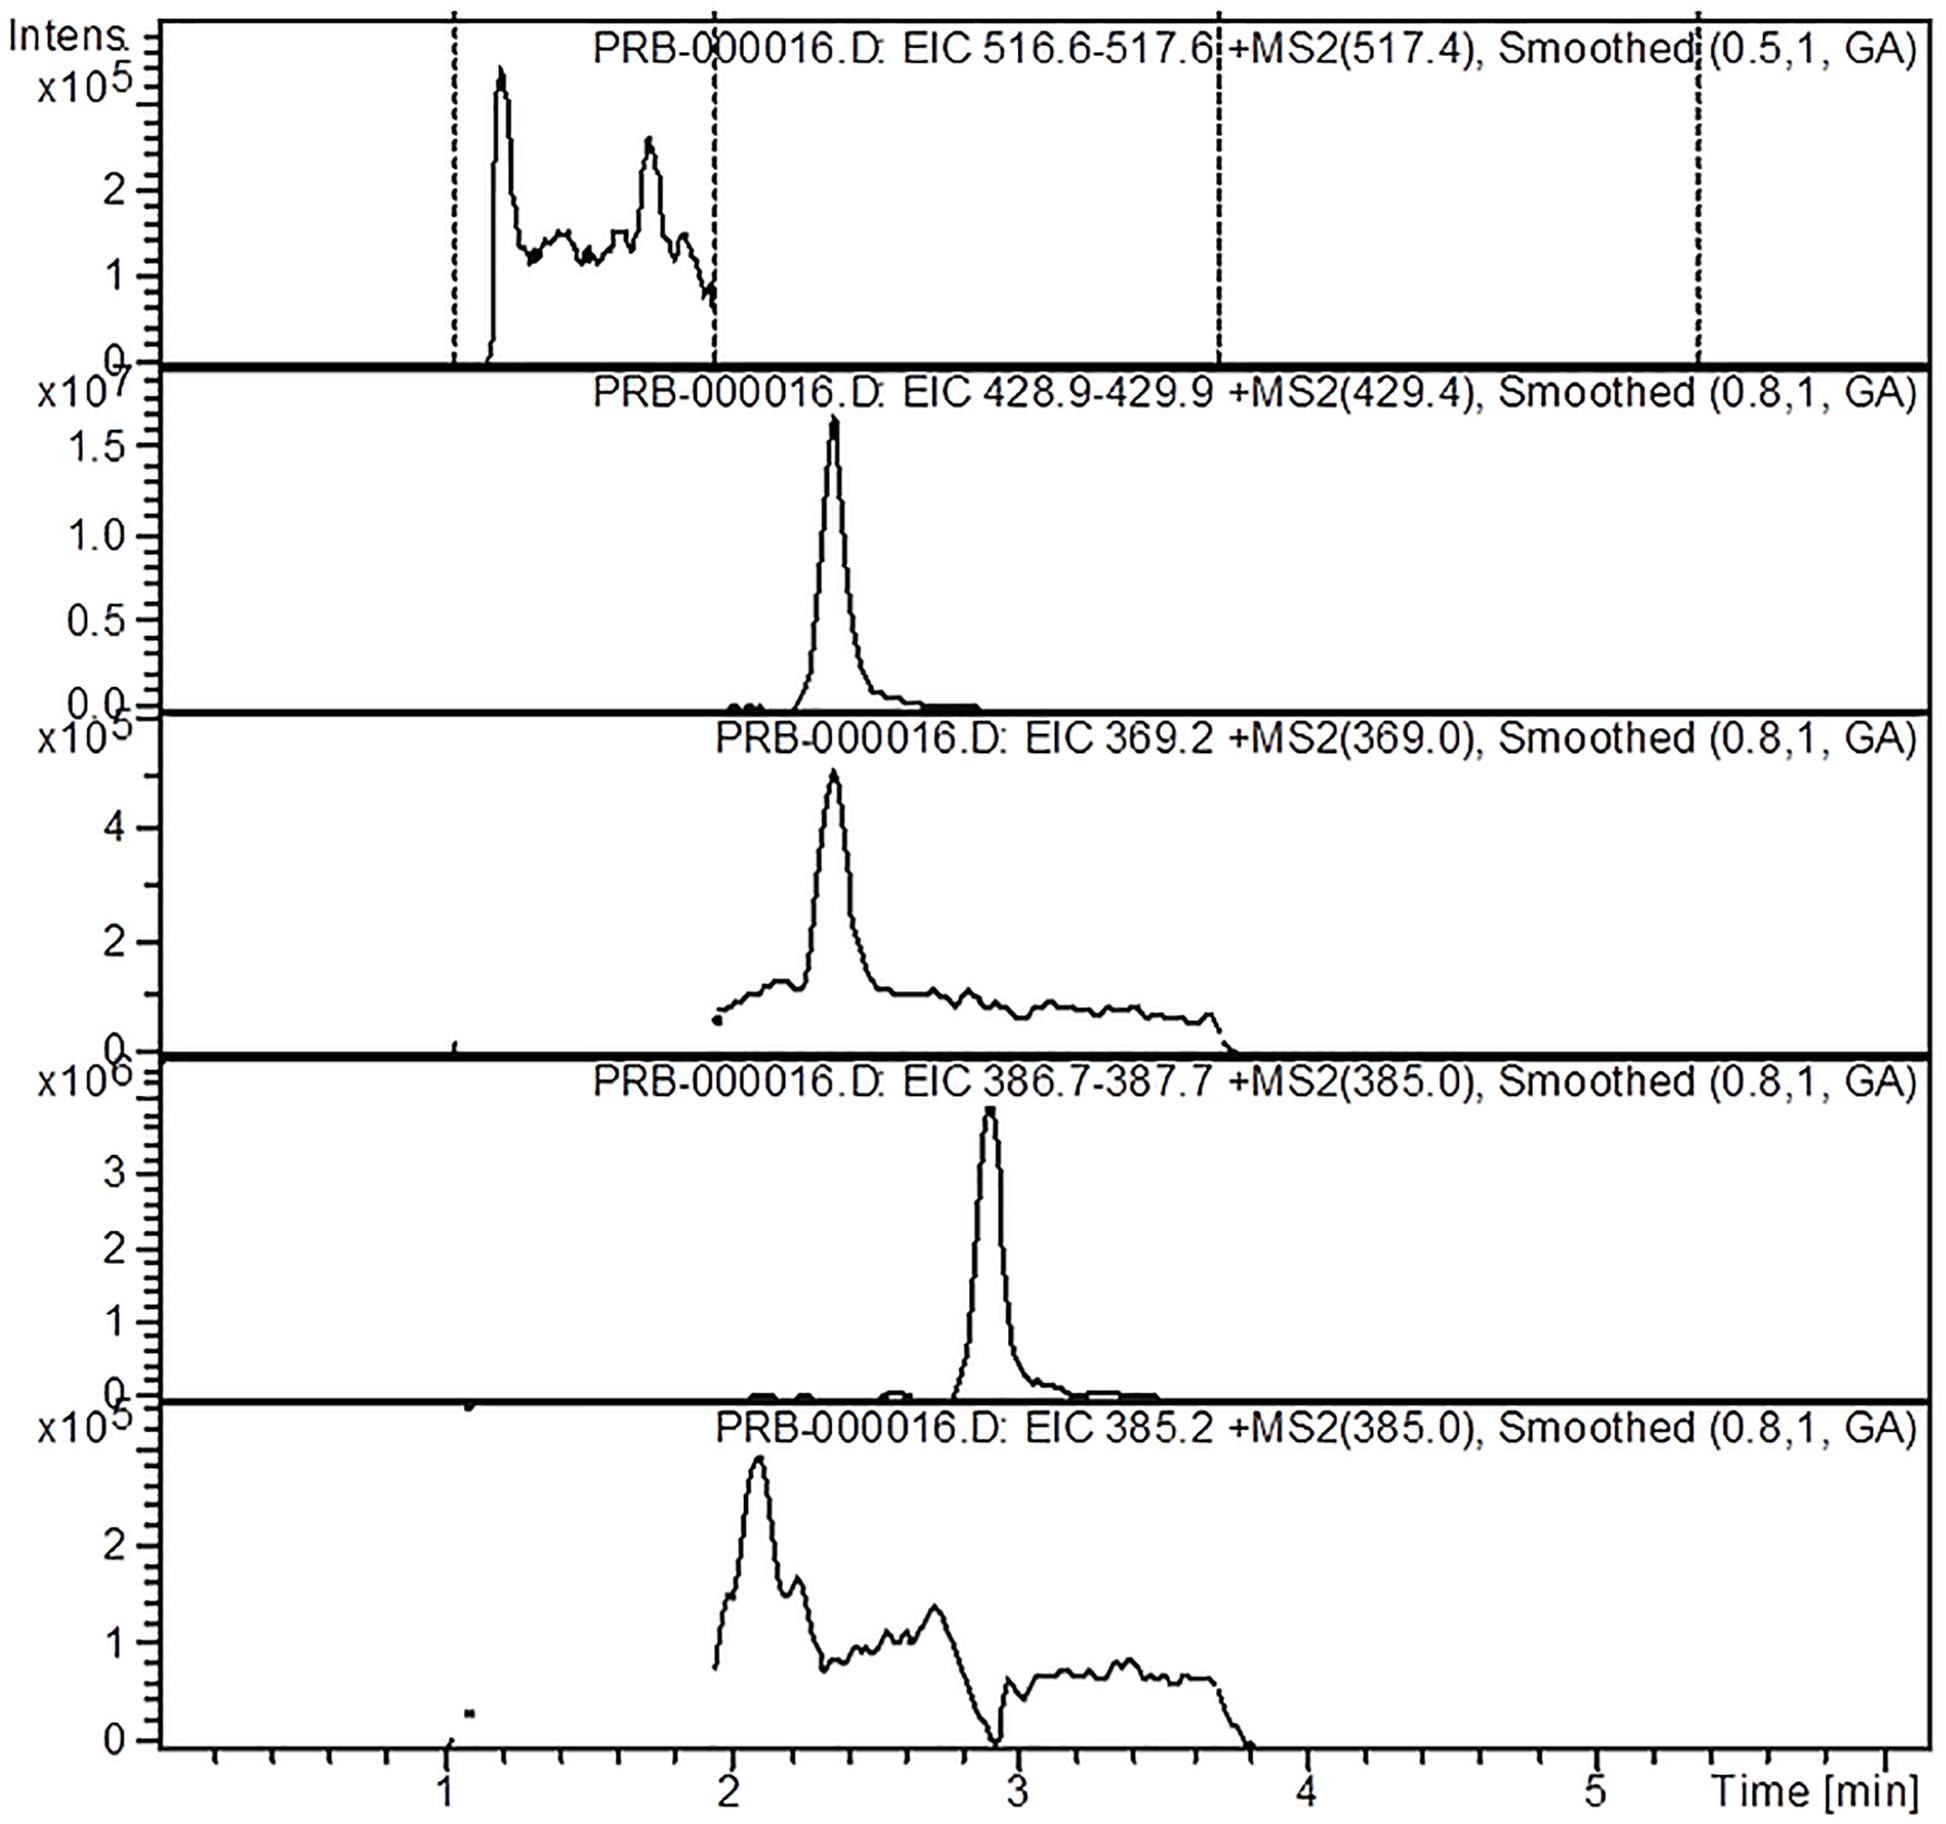
Figure 3. HPLC-MS-MS chromatogram of iridoids from A. chamaepitys ethanol extract.
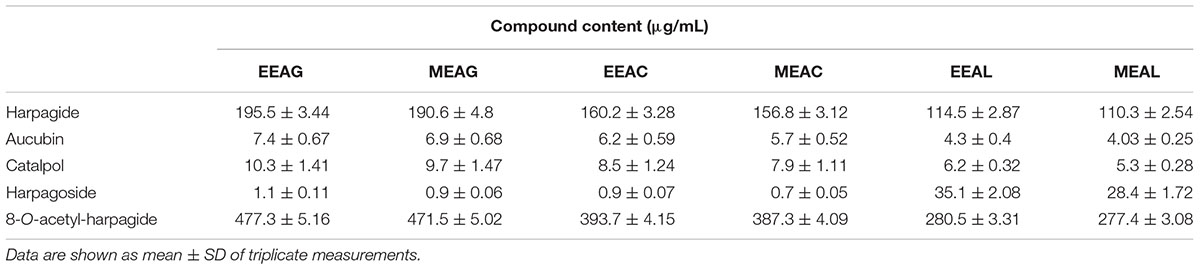
Table 3. Iridoid profile of A. genevensis (AG), A. chamaepitys (AC), and A. laxmannii (AL) extracts.
Antiproliferative Activity of Ajuga sp. Extracts on C26 and B16.F10 Cancer Cell Lines
The effects of different treatments at various concentrations (50–650 μg/mL) on the proliferation of C26 and B16.F10 cells were expressed as percentage of inhibition compared to the proliferation of the untreated control cells (Figures 4A,B) and as IC50 values for each extract tested (Table 4). Our data showed that EEAL exerted strong inhibitory effects at much lower concentrations than EEAC and EEAG on B16.F10 melanoma (Figure 4A and Table 4) as well as on C26 Colon Carcinoma Cells (Figure 4B and Table 4). The relationship between input variables (plant species, extract concentration, cell type – X dataset) and cell proliferation inhibition rate (Y dataset) was assessed by fitting a polynomial equation through PLS method (Figure 5). The specific types of polyphenols (isoquercitrin, rutin and apigenin) (Table 2) and iridoids (harpagoside and 8-O-acetyl-harpagide) (Table 3) might be involved in strong antitumor activity of the vegetal extracts tested.
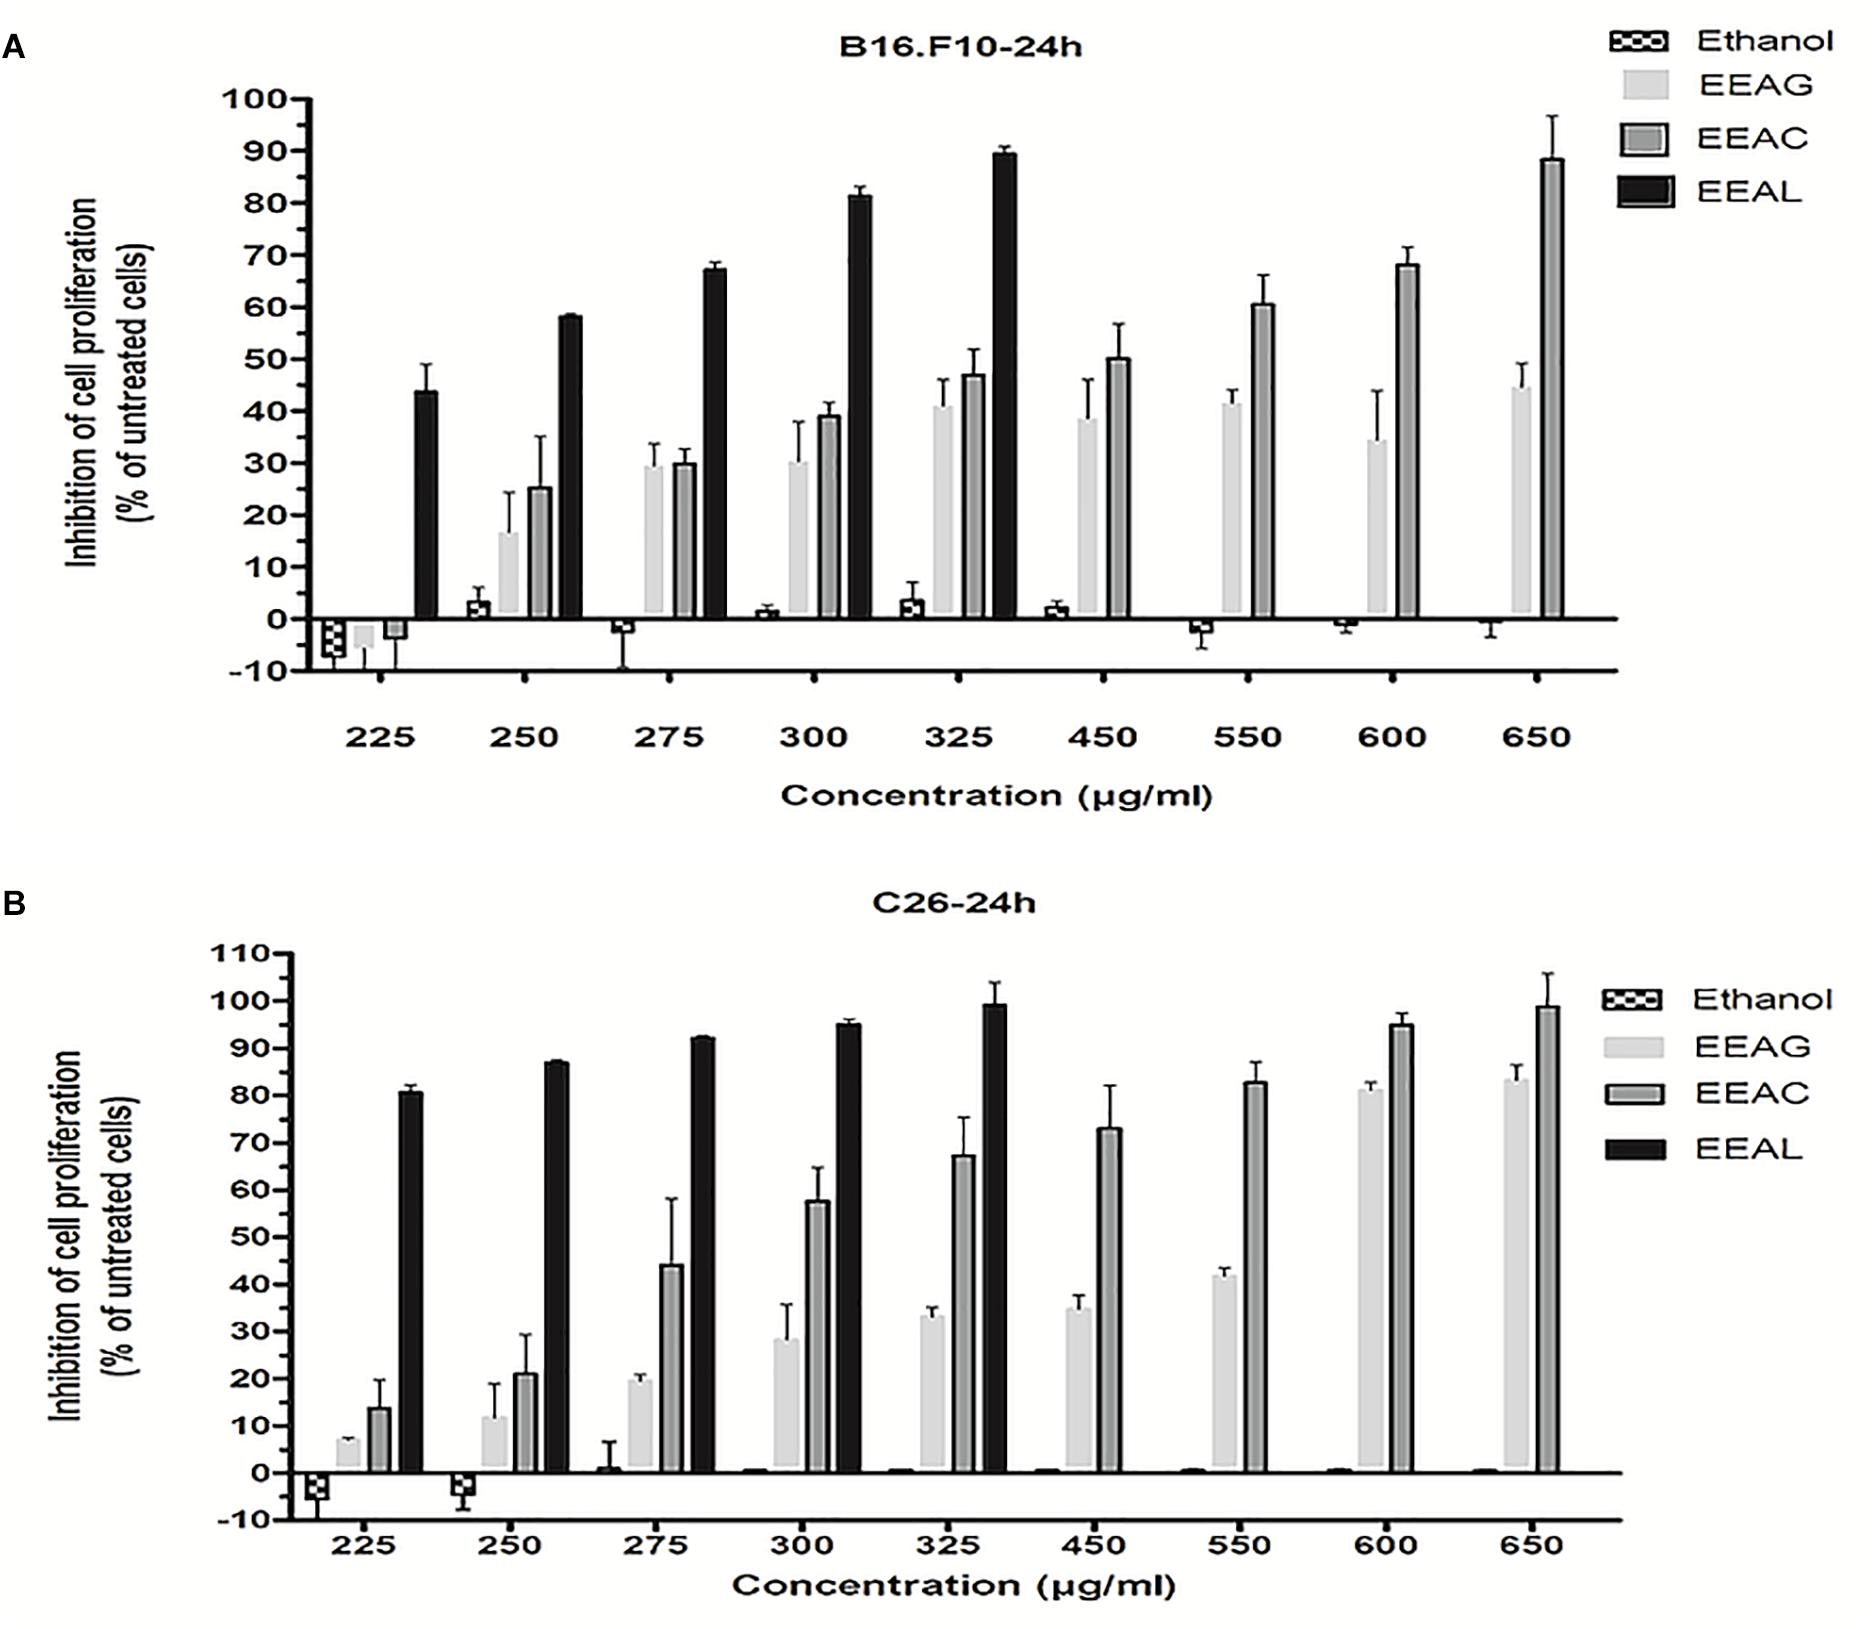
Figure 4. Effects of Ajuga sp. extracts on cell proliferation. (A) 24 h after incubation of B16.F10 cells with different concentrations of EEAG, EEAC, and EEAL extracts. (B) 24h after incubation of C26 cells with different concentrations of EEAG, EEAC, and EEAL extracts. Data are shown as mean ± SD of triplicate measurements. EEAG, A. genevensis ethanolic extract; EEAC, A. chamaepitys ethanolic extract; EEAL, A. laxmannii ethanolic extract. Ethanol-treated cells were used as toxicity controls.
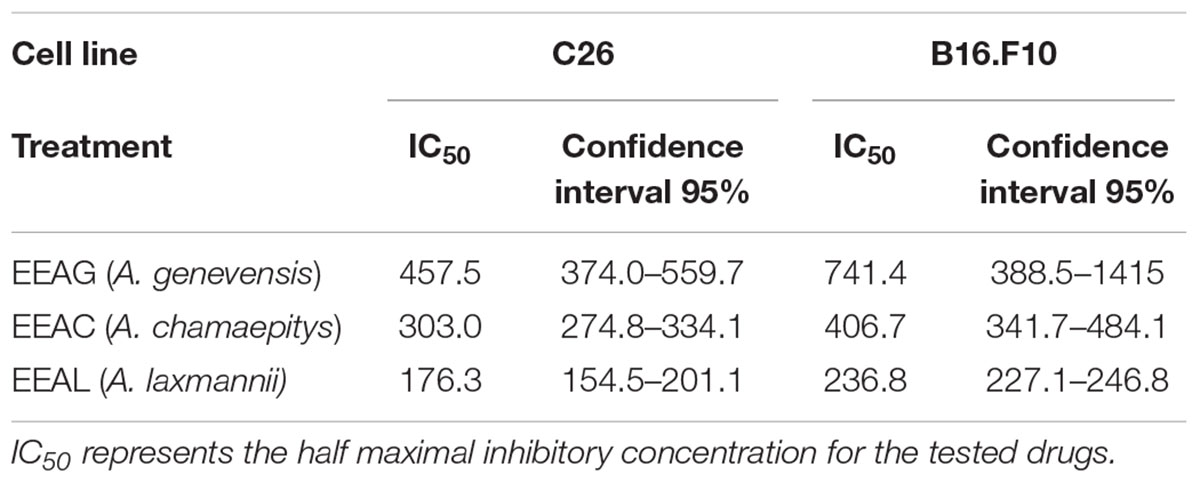
Table 4. Cytotoxicity of Ajuga sp. ethanolic extracts against C26 and B16.F10 murine cancer cell lines by ELISA BrdU-colorimetric immunoassay (IC50 value, μg/mL).
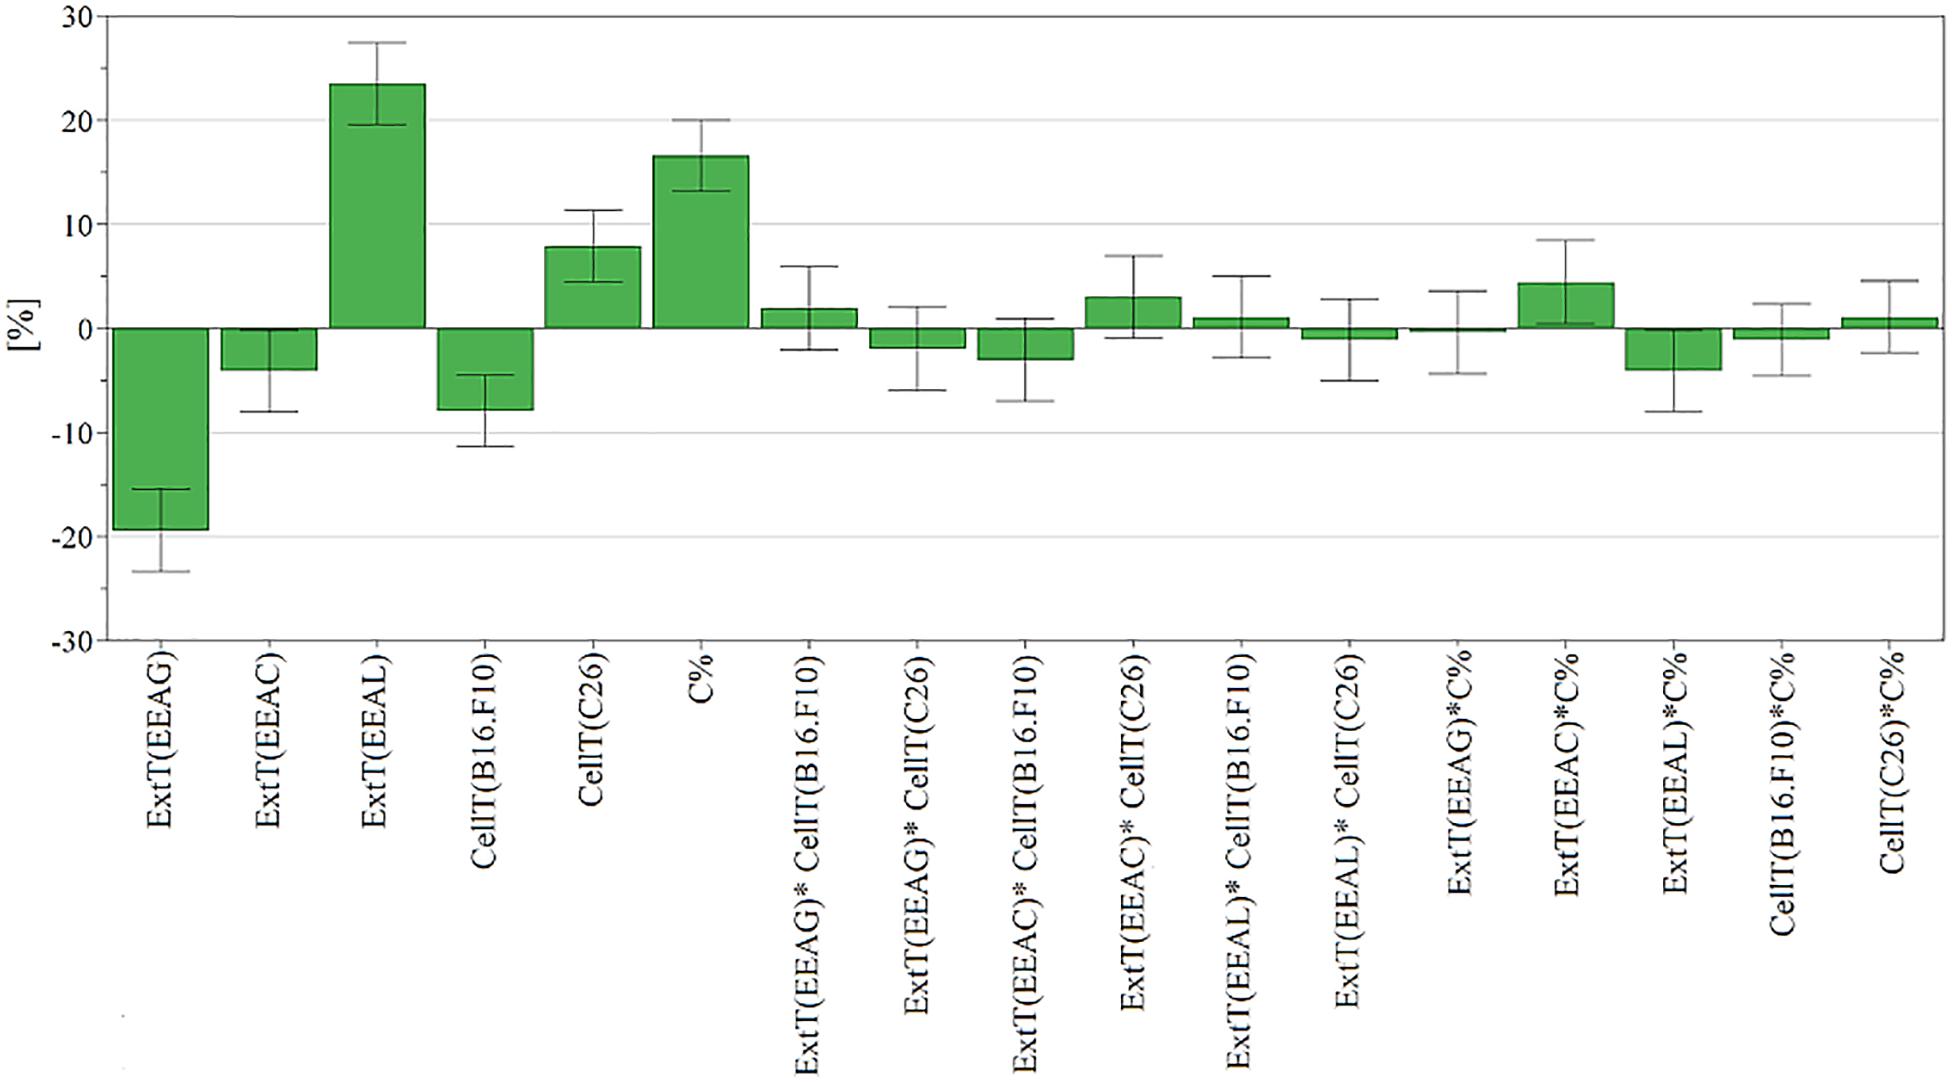
Figure 5. Scaled and centered coefficient bar plot for cell proliferation inhibition. To analyze the effect of factors on cell proliferation inhibition, the coefficients of the polynomial equation were plotted. The coefficient of a factor represents the change in response induced by increasing the factor’s level from low to high while all other factors are at average level. Each coefficient has a 95% confidence interval, represented through error bars, and reflecting its uncertainty. EEAG, A. genevensis ethanolic extract; EEAC, A. chamaepitys ethanolic extract; EEAL, A. laxmannii ethanolic extract.
Strong Inhibitory Actions of the Vegetal Extracts on NF-κB-p65 Expression in C26 and B16.F10 Total Cell Lysates
Our results indicated that IC80 concentrations of all Ajuga sp. extracts tested in this study (IC40 in the case of EEAG tested on B16.F10) elicited a very strong inhibition (≥80% compared with control) of the key inflammatory transcription factor NF-κB-p65 expression (Figures 6A–D). In addition, the IC50 concentrations (Table 4) tested on both cell lines (IC20 in the case of EEAG tested on B16.F10) determined various levels of inhibition (30–70% compared with control) (Figures 6E–H).
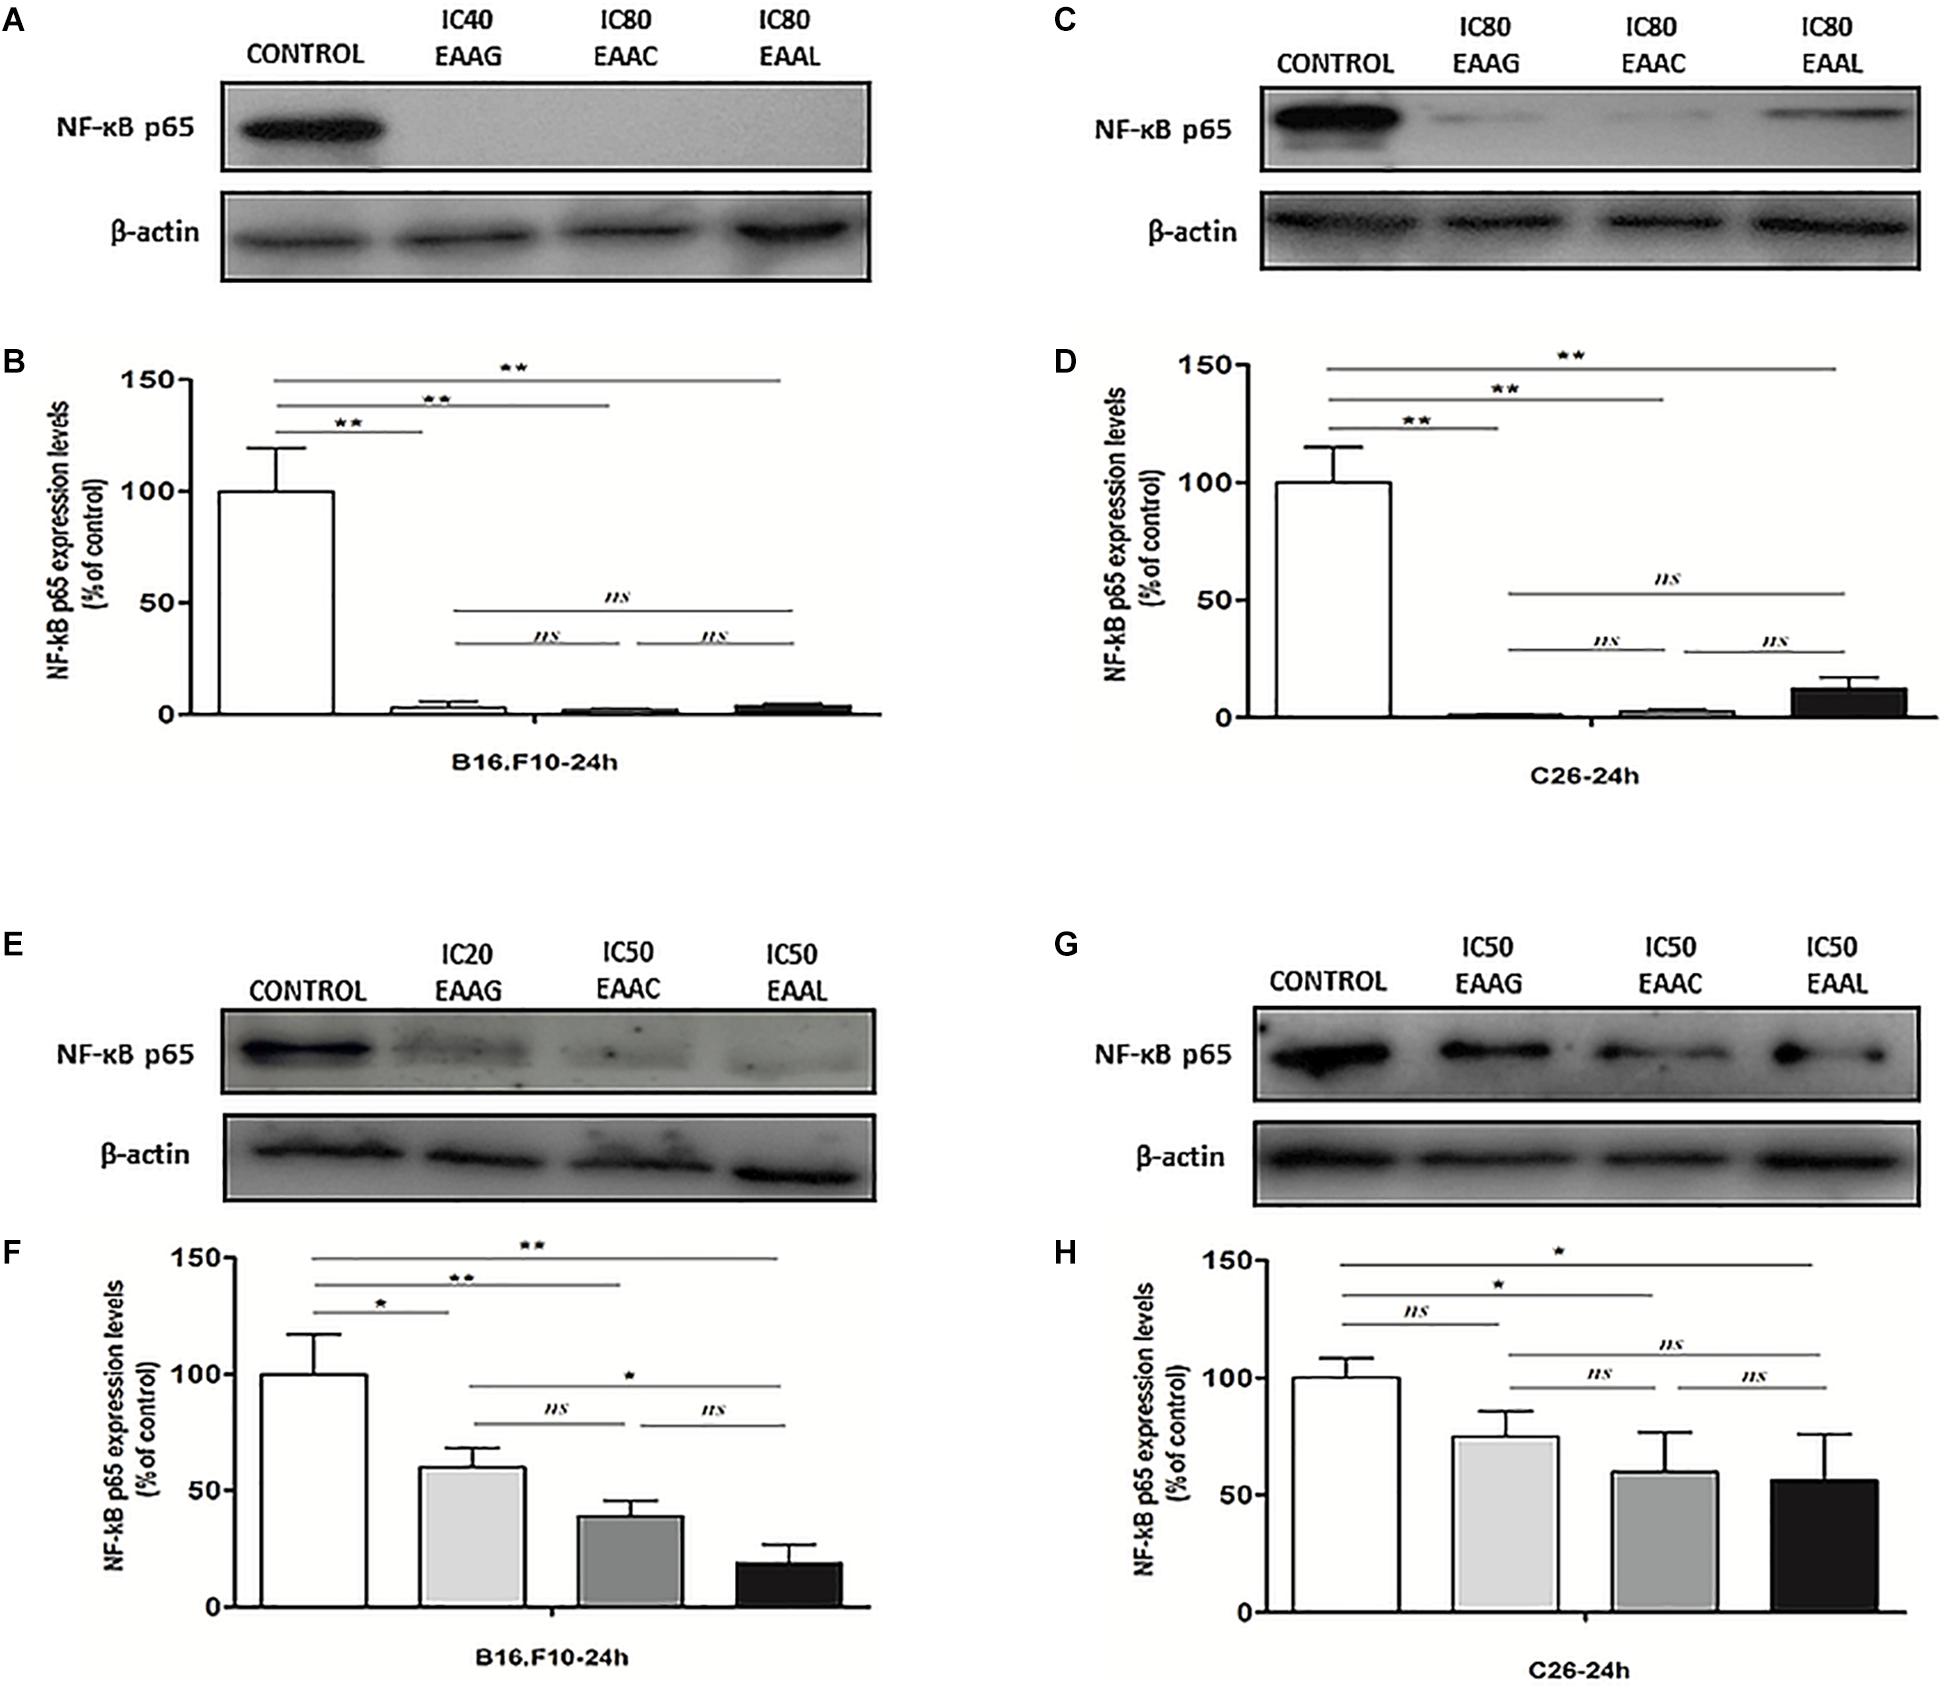
Figure 6. The expression of NF-κB-p65 in cell lysates after different treatments. Western blot analysis of total NF-κB-p65 expression in cell lysates from (A,E) B16.F10 cells and (C,G) C26 cells after different treatments; β-actin was used as loading control. (B) % of NF-κB-p65 expression relative to control in B16.F10 melanoma cells after IC40 EEAG, IC80 EEAC, and IC80 EEAL treatments. (F) % of NF-κB-p65 expression relative to control in B16.F10 melanoma cells after IC20 EEAG, IC50 EEAC, and IC50 EEAL treatments. (D) % of NF-κB expression relative to control in C26 colon carcinoma cells after IC80 EEAG, IC80 EEAC, and IC80 EEAL treatments. (H) % of NF-κB expression relative to control in C26 colon carcinoma cells after IC50 EEAG, IC50 EEAC, and IC50 EEAL treatments. On B16.F10 cells: Control, untreated cells; IC40 or IC20 EEAG, cells incubated with 650 μg/mL or 260 μg/mL A. genevensis ethanolic extract; IC80 or IC50 EEAC, cells incubated with 650 μg/mL or 406.7 μg/mL A. chamaepitys ethanolic extract; IC80 or IC50 EEAL, cells incubated with 325 μg/mL or 236.8 μg/mL A. laxmannii ethanolic extract. On C26 cells: Control, untreated cells; IC80 or IC50 EEAG, cells incubated with 650 μg/mL or 457.5 μg/mL A. genevensis ethanolic extract; IC80 or IC50 EEAC, cells incubated with 650 μg/mL or 303 μg/mL A. chamaepitys ethanolic extract; IC80 or IC50 EEAL, cells incubated with 325 μg/mL or 176.3 μg/mL A. laxmannii ethanolic extract. Results represent the mean ± SD of two independent measurements. One way ANOVA test with Bonferroni correction for multiple comparisons was used to analyze the effects of different treatments on the levels of NF-κB-p65 in comparison with the pro-inflammatory transcription factor production in control (ns, P > 0.05; ∗P < 0.05;∗∗P < 0.01).
Modulatory Effects of Ajuga sp. Extracts on “Physiological” Oxidative Stress of Cancer Cells
As cancer cells are under persistent oxidative stress (Alupei et al., 2015) we investigated the potential relationship between the antiproliferative activity of the vegetal extracts, and oxidative stress generated in both cancer cell types. Thus, the levels of a general oxidative stress marker – MDA, as well as the catalytic activity of catalase and production of non-enzymatic antioxidant systems were assessed on both cell lines and are shown in Figures 7, 8. Our results indicated that the IC80 concetrations of the extracts (IC40 in the case of EEAG on B16.F10) increased the pro-oxidative damage (Figures 7B, 8B) in correlation with a proportional increase in the antioxidant capacity of the remaining cancer cells (Figures 7F, 8F) of both cell lines. The activity of the antioxidant enzyme catalase on both cell lines was not significantly modified by the IC80 extract concentrations used in this investigation (Figures 7D, 8D). However, the IC50 extract concentrations (IC20 in the case of EEAG) had a moderate antioxidant effect on B16.F10 cells by reducing the levels of MDA compared to control (Figure 8A) and slightly stimulating catalase activity (Figure 8C). On C26 cells, the IC50 extract concentrations did not significantly modify any of the parameters of oxidative stress tested (Figures 7A,C,E).
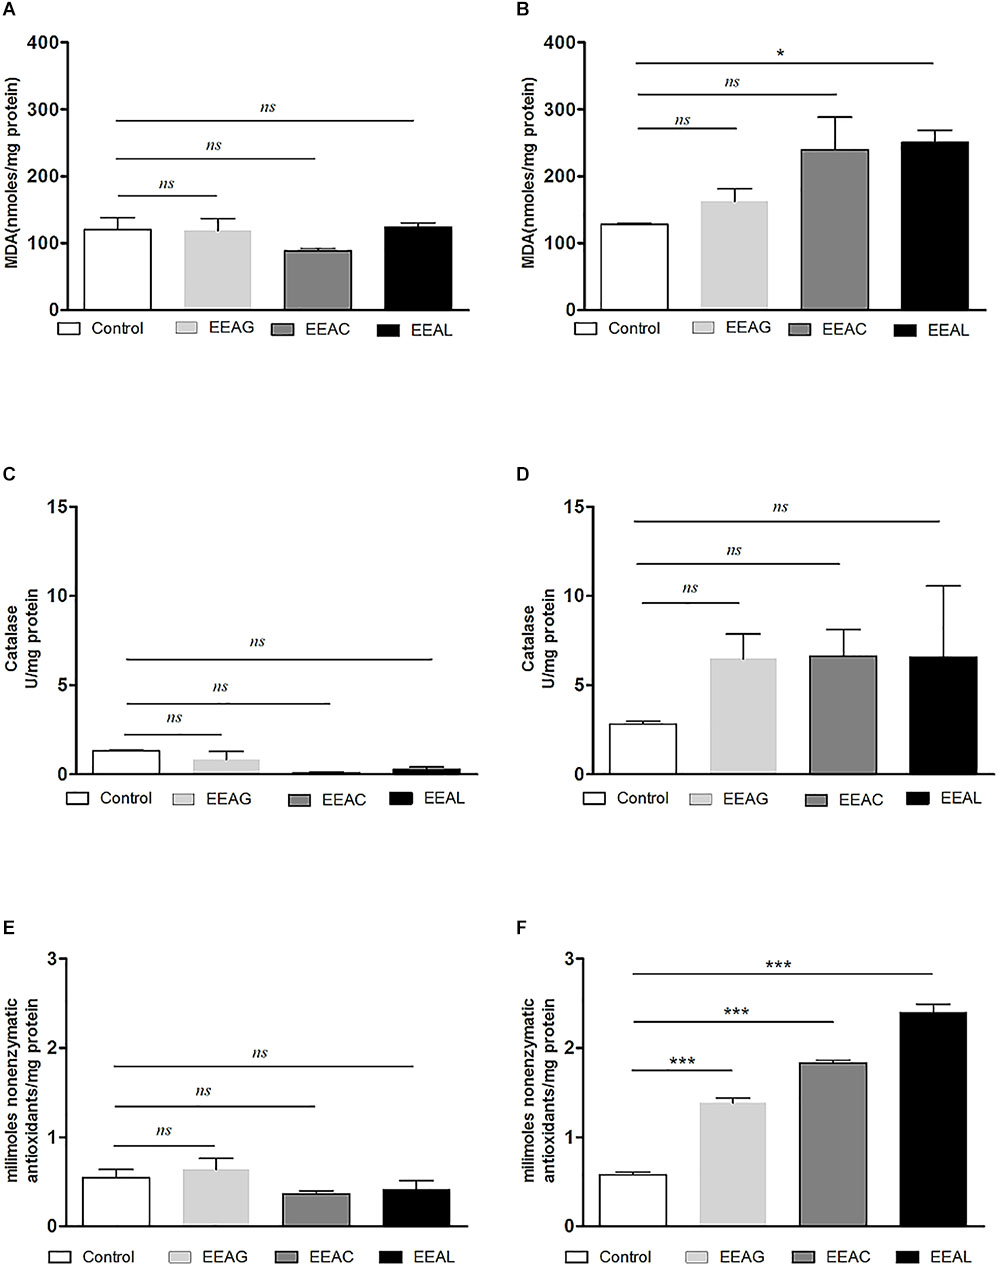
Figure 7. Effects of Ajuga sp. extracts on the oxidative stress generated by C26 colon carcinoma cells. (A,B) Malondialdehyde (MDA) concentration after (A): IC50 EEAG, IC50 EEAC, and IC50 EEAL treatment and (B): IC80 EEAG, IC80 EEAC, and IC80 EEAL treatment. (C,D) Catalytic activity of catalase after (C): IC50 EEAG, IC50 EEAC, and IC50 EEAL treatment, and (D): IC80 EEAG, IC80 EEAC, and IC80 EEAL treatment. (E,F) Total non-enzymatic antioxidant system levels in the cell lysates obtained from standard culture of C26 colon carcinoma cells after 24 h of incubation with (E): IC50 EEAG, IC50 EEAC, and IC50 EEAL treatment, and (F): IC80 EEAG, IC80 EEAC, and IC80 EEAL treatment. One way ANOVA test with Bonferroni correction for multiple comparisons was performed to analyze the differences between the effects of the treatments applied on MDA and non-enzymatic antioxidant defense systems levels and on catalase activity. Control, untreated C26 cells; IC80 or IC50 EEAG, cells incubated with 650 μg/mL or 457.5 μg/mL A. genevensis ethanolic extract; IC80 or IC50 EEAC, cells incubated with 650 μg/mL or 303 μg/mL A. chamaepitys ethanolic extract; IC80 or IC50 EEAL, cells incubated with 325 μg/mL or 176.3 μg/mL A. laxmannii ethanolic extract. (ns, P > 0.05; ∗P < 0.05; ∗∗∗P < 0.001).
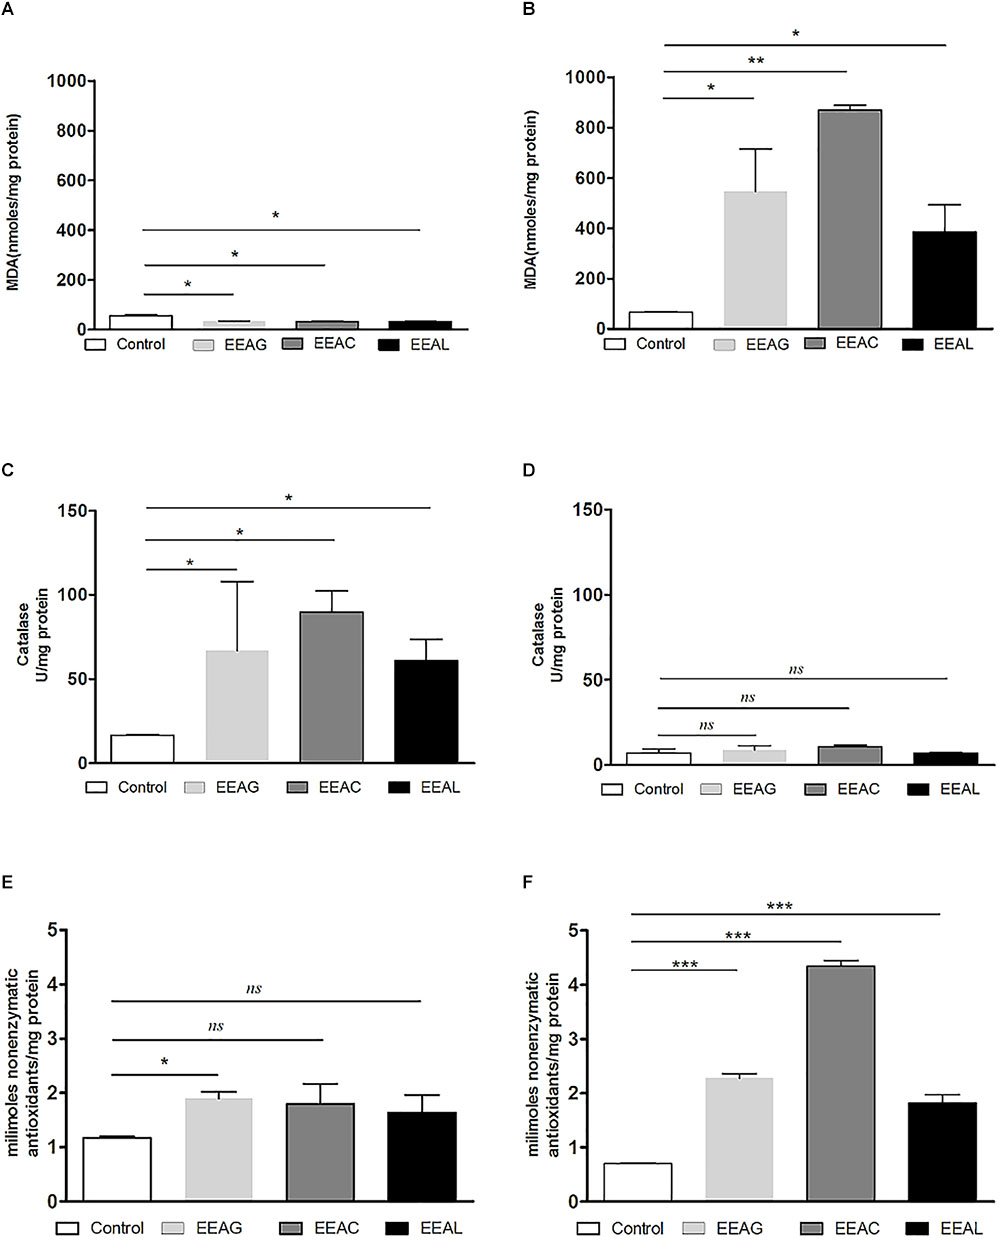
Figure 8. Effects of Ajuga sp. extracts on the oxidative stress generated by B16.F10 melanoma cells. (A,B) MDA concentration after (A): IC20 EEAG, IC50 EEAC, and IC50 EEAL treatment and (B): IC40 EEAG, IC80 EEAC, and IC80 EEAL treatment. (C,D) Catalytic activity of catalase after (C) IC20 EEAG, IC50 EEAC, and IC50 EEAL treatment and (D): IC40 EEAG, IC80 EEAC, and IC80 EEAL treatment. (E,F) Total non-enzymatic antioxidant system levels in the cell lysates obtained from standard culture of B16.F10 murine melanoma cells after 24 h of incubation with (E): IC20 EEAG, IC50 EEAC, and IC50 EEAL treatment and (B): IC40 EEAG, IC80 EEAC, and IC80 EEAL treatment. One way ANOVA test with Bonferroni correction for multiple comparisons was performed to analyze the differences between the effects of the treatments applied on MDA and non-enzymatic antioxidant defense systems levels and on catalase activity. Control, untreated B16.F10 cells; IC40 or IC20 EEAG, cells incubated with 650 μg/mL or 260 μg/mL A. genevensis ethanolic extract; IC80 or IC50 EEAC, cells incubated with 650 μg/mL or 406.7 μg/mL A. chamaepitys ethanolic extract; IC80 or IC50 EEAL, cells incubated with 325 μg/mL or 236.8 μg/mL A. laxmannii ethanolic extract. (ns, P > 0.05; ∗P < 0.05; ∗∗P < 0.01; ∗∗∗P < 0.001).
Multivariate Data Analysis
The model built to analyze the phytochemical composition of ethanolic extracts of the three different species consisted of two predictive components and one orthogonal component. 96% of X variation captured by two predictive components was found correlated with class separation, while only 2.16% variability was attributed as orthogonal. Both predictive components were found significant judging from their eigenvalues, first predictive component presented an eigenvalue of 11.8 (R2X-69.4%) and the second predictive component 4.56 (R2X-26.8%). From the score scatter plot presented under Figure 9, a good separation of observations can be seen in function of class membership, reflected also in the total sum of variation in Y explained by the model (R2Y- 99.5%) and in the goodness of prediction (Q2-99.1%).
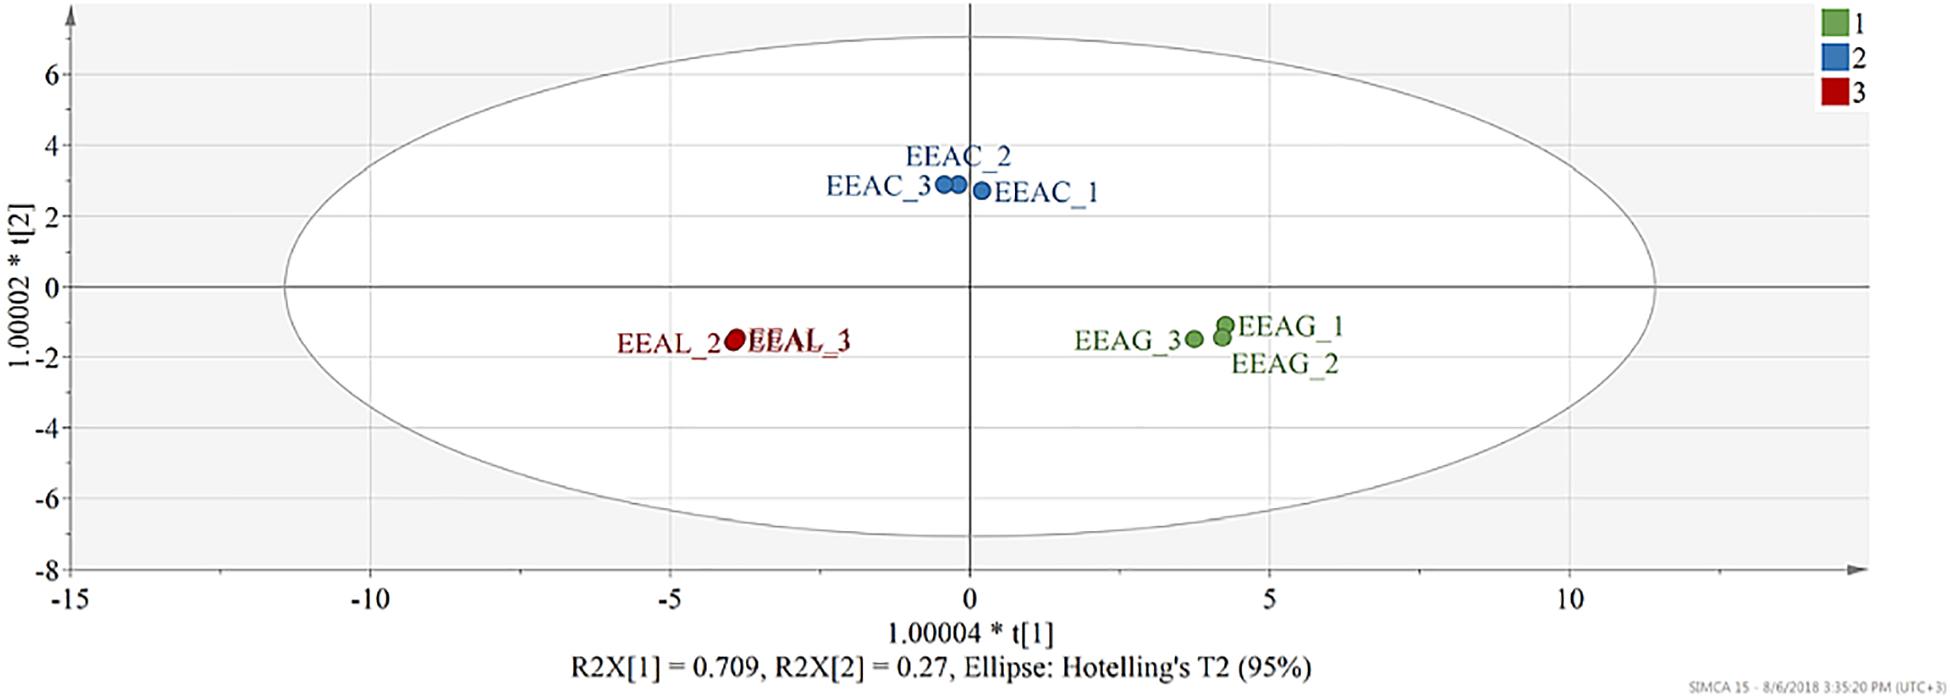
Figure 9. Score scatter plot of the OPLS-DA model (R2Y-99.8% and Q2-99.5%) – t(1) – first predictive component vs. t(2) – second predictive component. Each observation is represented by a point in multidimensional space, differentially colored according to plant species. EEAG, A. genevensis ethanolic extract; EEAC, A. chamaepitys ethanolic extract; EEAL, A. laxmannii ethanolic extract. R2X-fraction of variability in X (physicochemical descriptors) explained by each component; R2Y-total variation of Y (class membership) explained by the model; Q2-predictive capacity.
To identify the phytochemical descriptors responsible for class separation the corresponding loading plot was generated (Figure 10). Graphical interpretation of the loading plot is made by considering the positioning of physicochemical descriptors in relation to the artificial dummy variables that reflect class membership [$M6.DA(1), $M6.DA(2), and $M6.DA(3)]. The right hand-group of variables represented by caffeic acid, p-coumaric acid, hyperoside, 8-O-acetyl-harpagide, harpagide, aucubine and catalpol are found in higher concentration in extract EEAG [situated close to $M6.DA(1)] and in lower concentration in extracts EEAL [situated in opposite direction from $M6.DA(3)], while EEAC has middle concentrations in these phytochemical descriptors. In a similar way, the left hand-group of variables represented by rutin, harpagoside, apigenin, isoquercitrin, quercitrin are found in higher concentration in extracts EEAL, respectively in lower concentration in extract EEAG and intermediate concentration in extract EEAC. TPC and TFC parameters are correlated with the left hand-group variables, presenting higher values for extracts EEAL. The second predictive component captures variability related to ferulic acid and luteolin content, respectively TIC. EEAG extracts presented higher content of ferulic acid, luteolin and low values of TIC, while EEAC and EEAL extracts show an opposite pattern.
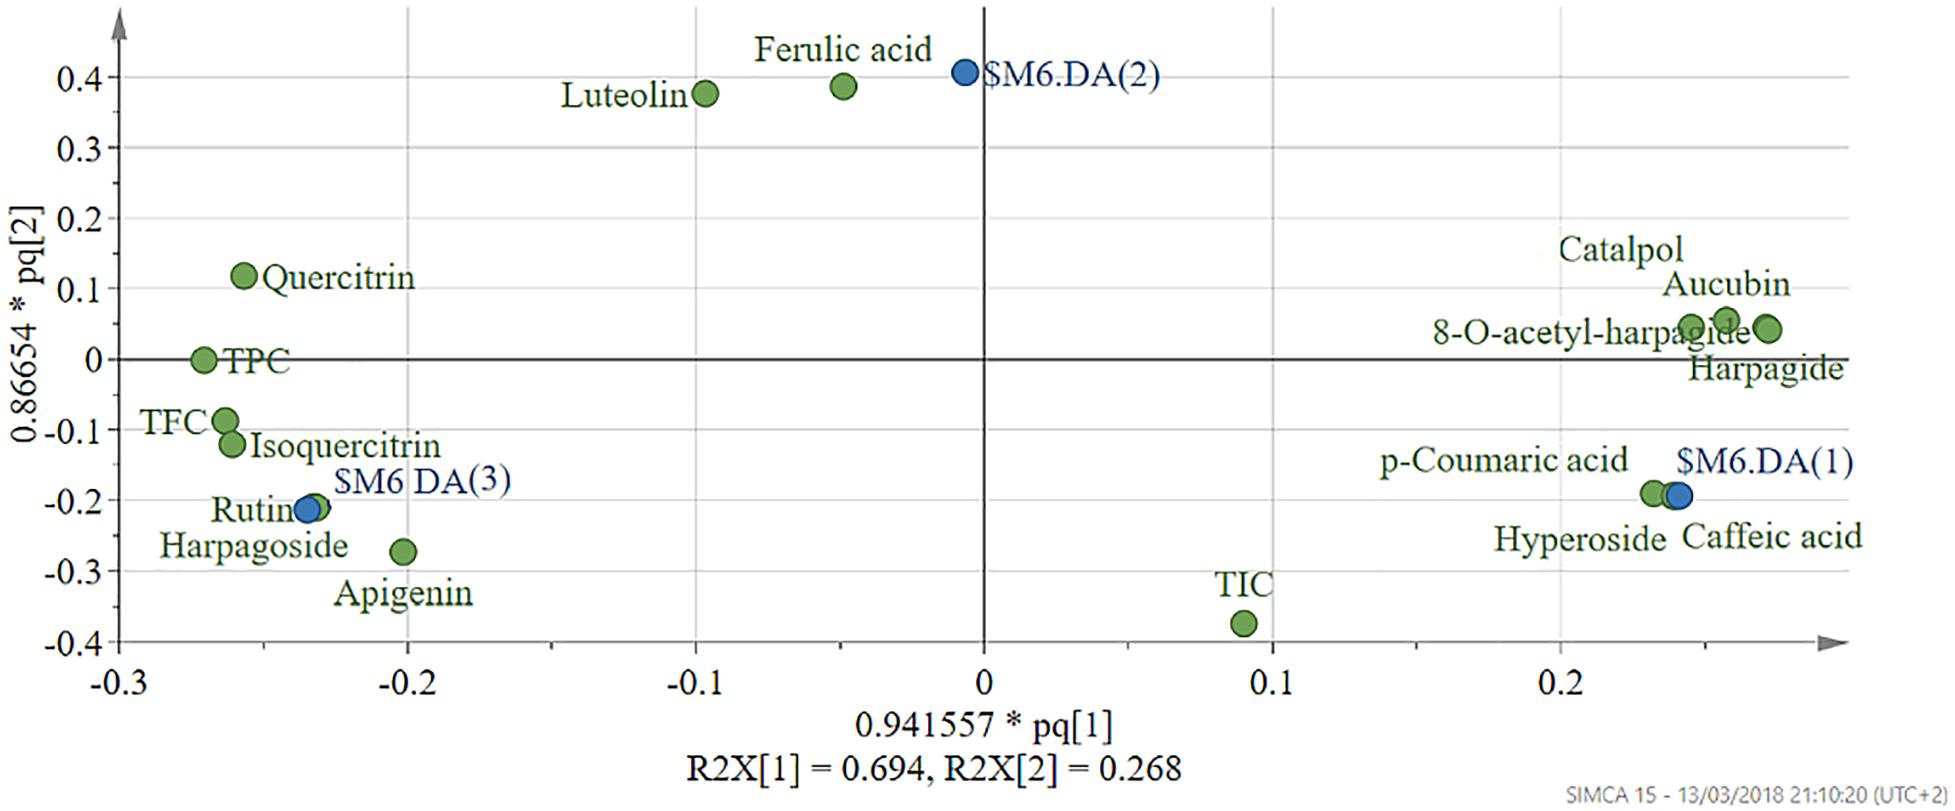
Figure 10. Loading scatter plot of OPLS-DA model – pq(1) vs. pq(2). Physicochemical descriptors in relation to the artificial dummy variables that reflect class membership: $M6.DA(1)-EEAG; $M6.DA(2)-EEAC; $M6.DA(3)-EEAL. p- X loading weight; q- Y loading weight. EEAG, A. genevensis ethanolic extract; EEAC, A. chamaepitys ethanolic extract; EEAL, A. laxmannii ethanolic extract.
The relationship between input variables (plant species, extract concentration, cell type – X dataset) and cell proliferation inhibition rate (Y dataset) was assessed by fitting a polynomial equation through PLS method. The developed model explained most of the response variation (R2-0.85) and had good predictive capacity (Q2-0.71) and high reproducibility (0.953). Comparing the modeled response variation with un-modeled part (residuals) yielded a significant model, p < 0.05 (5.59e–17). The residuals were further decomposed into model error and replicate error and compared. According to p value of 0.146 (p > 0.05) the replicate and model error originate from the same distribution, meaning there is no lack of fit. The model validity parameter (0.518) calculated using the lack of fit p value was above 0.25, also suggesting a valid model (Surowiec et al., 2015). To analyze the effect of factors on cell proliferation inhibition, the coefficients of the polynomial equation were plotted (Figure 5). The coefficient of a factor represents the change in response induced by increasing the factor’s level from low to high while all other factors are at average level. Each coefficient has a 95% confidence interval, represented through error bars, reflecting its uncertainty (Casian and Iurian, 2017).
Discussion
In the present study, we evaluated the antiproliferative potential of three indigenous Ajuga sp. extracts, EEAG (A. genevensis), EEAC (A. chamaepitys), and EEAL (A. laxmannii) on C26 and B16.F10 murine cancer cell lines via ELISA BrdU-colorimetric immunoassay. Additionally, we investigated the potential anti-inflammatory and antioxidant/pro-oxidant activity underlying the observed cancer cell growth inhibition. As shown in Figures 4A,B, standardized ethanolic extracts of the three selected species induced different degrees of proliferation inhibition in both cell lines after 24 h. EEAL exhibited the strongest inhibitory effect with a corresponding IC50 of 176.3 μg/mL on C26 cells and 236.8 μg/mL on B16.F10 cells (Table 4). To analyze the effect of factors on cell proliferation inhibition, the coefficients of the polynomial equation were plotted. According to the coefficient plot (Figure 5), the most important factor affecting cell proliferation was the plant species, followed by extract concentration and cell type. EEAL exerted the best biological activity, inhibiting the proliferation of both cell lines most efficiently, while EEAG yielded the lowest inhibition levels. Independent of plant type, the exerted effects were concentration dependent, higher concentrations being more effective. Regarding the type of cell culture, higher inhibition rates were obtained for C26 compared to B16.F10 cells. The absence of significant interactions between extract type and cell type suggests that for all extracts, this cell type dependent proliferation inhibition has the same pattern. The differences in biological activity of extracts originating from the three Ajuga sp. were consistent with the good separation of observations in function of class membership (Figure 9) and further interpretation by OPLS-DA enabled the identification of phytochemical compounds responsible for the increased antiproliferative activity of EEAL. Variables situated in the left hand-group of Figure 10 (rutin, harpagoside, apigenin, isoquercitrin, quercitrin, TPC, and TFC) are responsible for the increased biological activity of EEAL extract. This was in concordance with previous studies revealing that isoquercitrin suppresses colon cancer cell growth in vitro (Amado et al., 2014) and that rutin, quercitrin and isoquercitrin tested separately present different degrees of antiproliferative effects (Orfali et al., 2016). Moreover, apigenin administered alone on cancer cells inhibited proliferation, invasion and migration (Yan et al., 2017). Synergistic antiproliferative effects demonstrated in cancer cell lines provided with flavonoid combination treatments further support our findings (Campbell Jessica et al., 2006). The same biologically active compounds were found in lower concentration in EEAG and intermediate concentration in EEAC, also reflected in the different degrees of proliferation inhibition (Figures 4A,B). EEAC extract presented higher content of ferulic acid, luteolin and low values of TIC, while EEAG and EEAL showed an opposite pattern (Figure 10). Luteolin’s antiproliferative activity resides in the potential to induce cell cycle arrest via inhibiting IGF-1-mediated PI3K/PKB activation (Tuorkey, 2016), and ferulic acid has been proven effective in inhibiting proliferation of osteosarcoma cells (Zhang et al., 2016). The right hand-group of variables represented by caffeic acid, p-coumaric acid, hyperoside, 8-O-acetyl-harpagide, harpagide, aucubine and catalpol (Figure 10) are found in higher concentration in extract EEAG and in lower concentration in extract EEAL, while EEAC has middle concentrations in these phytochemical descriptors. Among these bioactive compounds, caffeic acid, and p-coumaric acid can decrease cell proliferation and attenuate the viability of cancer cells in vitro (Anantharaju et al., 2016).
The pattern of polyphenols indicates large differences between the three Ajuga sp., therefore they could be used as potential taxonomic markers. Luteolin was found in highest amount in EEAC. The major compound from EEAL was rutin, in high yield, whilst in EEAC it was present in small quantities and in EEAG was not determined. Rutin had been previously reported by several in vitro and in vivo studies for the anti-inflammatory, antioxidant, neuroprotective, nephroprotective, hepatoprotective, and antihyperglycemic effects (Ghorbani, 2017). However, other studies highlighted the fact that flavonoids such as rutin and quercetin derivatives can act as pro-oxidant molecules via auto-oxidation of the hydroxyl group at the 3 position, depending on concentration and reaction conditions (Kessler et al., 2003). Accordingly, our experimental data reported what might be a dose dependent “double-edged sword” effect of Ajuga sp. extracts on B16.F10 melanoma cell generated oxidative stress. Lower doses (IC20 EEAG, IC50EEAC, and IC50 EEAL) had a moderate anti-oxidant effect by slightly reducing MDA levels and stimulating catalase activity (Figure 8A), while higher doses (IC40 EEAG, IC80 EEAC, and IC80 EEAL) increased MDA levels in correlation with a proportional increase in the total anti-oxidant capacity of the cancer cells. This indicates that melanoma cells might become resistant to high doses of Ajuga sp. extracts because of their ability to increase the levels of endogenous antioxidants and melanin production (Denat et al., 2014; Rauca et al., 2018), as an adaptive response to oxidative damage. In the case of C26 colon carcinoma cells, lower doses (IC50 EEAG, IC50 EEAC, and IC50 EEAL) did not significantly modulate the oxidative stress parameters (Figures 7A,C,D). The higher doses (IC80 EEAG, IC80 EEAC, and IC80 EEAL) revealed an overall anti-oxidant effect suggested by a strong increase in the total anti-oxidant capacity of the cells (Figure 7F) and the absence of a significant MDA level increase by EEAG and EEAC treatment, compared to a moderate MDA level increase by EEAL treatment (Figure 7B). The differences between the extract effects on the two cancer cell lines might also be explained by the higher IC50 values on B16.F10 cells compared to IC50 values on C26 cells (Table 4). Only in the case of EEAL, effective at lower concentrations, the pro-oxidant state can be correlated with anti-proliferative effects on both cell lines, as previous studies suggested that, depending on the cellular context, even though cancer cell survival can rely on antioxidant activity, high doses of an agent with antioxidant properties can effectively kill the cells by enhancing ROS production (Hawk et al., 2016). Thus, EEAG and EEAC effective at higher concentrations determined higher levels of MDA on B16.F10 cell line, close to the upper limit of physiological range (μM), which can directly kill cancer cells. This finding is consistent with previous studies, showing that cancer cells are more susceptible to ROS and phenolic compounds can act as pro-oxidants under certain conditions, such as high concentrations (Leon-Gonzalez et al., 2015). Based on the proliferation results, the extract doses that exerted strong inhibitory effects (IC80) and moderate inhibitory effects (IC50, IC40, and IC20) were used to further investigate the molecular mechanisms of cancer cell growth inhibition. Constitutive expression of NF-κB-p65, the pivotal transcription factor in inflammation and tumor cell proliferation (Xia et al., 2014) was strongly inhibited by the higher concentrations (IC80/IC40) of all tested extracts on both cell lines (Figures 6A–D) and presented a moderate to strong inhibition in the cells treated with IC50/IC20 concentrations (Figures 6E–H). The importance of NF-κB-p65 levels of expression in the outcome of different types of cancer was previously demonstrated (Weichert et al., 2007; Zhu et al., 2017), concluding that either nuclear or cytoplasmic expression of the transcription factor was correlated with unfavorable prognosis of solid tumors (Wu et al., 2015). Moreover, the high constitutive levels can be correlated with a higher constitutive activation of NF-κB in melanoma (Madonna et al., 2012), as well as in colon carcinoma, reported by our previous studies (Luput et al., 2018; Sesarman et al., 2018). The constitutive activation of NF-κB in several types of cancer regulates cell proliferation, apoptosis, and cell migration (Karin et al., 2002). Thus, the reduced NF-κB-p65 expression levels (Figures 6A–H) might contribute to the cytostatic effect of the investigated plant extracts. Although in vivo NF-κB tumor-specific suppression on melanoma is beneficial, generalized suppression of NF-κB is harmful (Enzler et al., 2011). The almost complet reduction of NF-κB-p65 expression levels at high concentrations (Figures 6B,D) indicates potential host toxicity, therefore, only the IC50 values (IC20 in the case of EEAG on B16.F10) (Figures 6F,H) might be a viable option in vivo. The main inhibitors of NF-κB-p65 expression in each of the tested extracts might be quercetin derivatives and apigenin in EEAL, luteolin in EEAC and caffeic acid in EEAG, as pointed out in previous studies (Gupta et al., 2010). It has been demonstrated that the number of available hydroxyl groups of aglycone and glycosylated polyphenols is related to modulatory effect of these compounds on oxidative stress (Rice-Evans et al., 1996; Csepregi et al., 2016). The presence of hydroxyl group-rich-flavonoids in EEAL, the extract with the highest TFC and TPC (Table 1), and the phenolic nature of predominant bioactive compounds in EEAC and EEAG, respectively might also have contributed to the significant increase in non-enzymatic antioxidant capacity of cancer cells after high extract dose treatment (Figures 7F, 8F) (P < 0.001). Considering that both colon carcinoma and melanoma cells are susceptible to oxidative stress, which further damages their already shattered defense systems (Venza et al., 2015; Luput et al., 2017), the modulation of oxidative stress might be one of the focal anti-cancer mechanisms of Ajuga sp. extracts in this study. Moreover, the higher values of TPC and TFC in EEAL compared to EEAC and EEAG (Figure 10) can explain why A. laxmannii exerted the best biological activity, inhibiting the proliferation of C26 and B16.F10 cells most efficiently at lower doses, probably in a synergistic manner (de Kok et al., 2008).
In conclusion, the results of our study indicated that the overall cytostatic effect of the investigated plant extracts was exerted through strong inhibitory actions on NF-κB-p65, the key molecule involved in the inflammatory response, and via oxidative stress modulatory effects in both murine colon carcinoma and melanoma cell lines. Among the three selected species, Ajuga laxmannii elicited the strongest inhibitory action at lower doses on B16.F10 and C26 cancer cell lines, compared to Ajuga chamaepitys and A. genevensis, due to the richer composition in bioactive polyphenolic compounds. Nevertheless, extended studies on experimental tumor models could shed more light on the anticancer activity of the selected indigenous Ajuga sp. extracts. Our results indicated that A. laxmannii extract holds the potential to become an additional form of treatment alongside conventional anticancer drugs.
Author Contributions
V-FR, LV, AT, and MB contributed to conceptualization and design of the study. V-FR, AS, A-MG, AT, and AM performed the experiments. TC, V-FR, and AM performed the statistical analysis. V-FR, AT, and MB wrote sections of the manuscript. All authors contributed to manuscript revision, read, and approved the submitted version.
Conflict of Interest Statement
The authors declare that the research was conducted in the absence of any commercial or financial relationships that could be construed as a potential conflict of interest.
Acknowledgments
AT acknowledges the support by UEFISCDI, Romania, project no. PNII-RU-TE-2014-4-1247.
Abbreviations
AE, aucubin equivalent; AKT (PKB), protein kinase B; dw, dried weight; EEAC, ethanolic extract from aerial parts of A. chamaepitys; EEAG, ethanolic extract from aerial parts of A. genevensis; EEAL, ethanolic extract from aerial parts of A. laxmannii; ERK, extracellular receptor kinase; GAE, gallic acid equivalent; IC50, half maximal inhibitory concentration; IGF-1, insulin-like growth factor 1; MAPK, mitogen-activated protein kinase; MDA, malondialdehyde; MEK, MAPK/ERK kinase; NF-κB, nuclear factor kappa-light-chain-enhancer of activated B cells; OPLS-DA, orthogonal partial least squares discriminant analysis; PI3K, phosphoinositide 3 kinase; PLS, partial least squares regression; PTEN, phosphatase and tensin homolog; Raf, rapidly accelerated fibrosarcoma protein; Ras, rat sarcoma protein; RE, rutin equivalent; ROS, reactive oxygen species; TAC, total antioxidant non-enzymatic capacity; TFC, total flavonoid content; TIC, total iridoid content; TPC, total phenolic content.
References
Alupei, M. C., Licarete, E., Cristian, F. B., and Banciu, M. (2014). Cytotoxicity of lipophilic statins depends on their combined actions on HIF-1alpha expression and redox status in B16.F10 melanoma cells. Anticancer Drugs 25, 393–405. doi: 10.1097/cad.0000000000000065
Alupei, M. C., Licarete, E., Patras, L., and Banciu, M. (2015). Liposomal simvastatin inhibits tumor growth via targeting tumor-associated macrophages-mediated oxidative stress. Cancer Lett. 356(2 Pt B), 946–952. doi: 10.1016/j.canlet.2014.11.010
Amado, N. G., Predes, D., Fonseca, B. F., Cerqueira, D. M., Reis, A. H., Dudenhoeffer, A. C., et al. (2014). Isoquercitrin suppresses colon cancer cell growth in vitro by targeting the wnt/β-catenin signaling pathway. J. Biol. Chem. 289, 35456–35467. doi: 10.1074/jbc.M114.621599
Anantharaju, P. G., Gowda, P. C., Vimalambike, M. G., and Madhunapantula, S. R. V. (2016). An overview on the role of dietary phenolics for the treatment of cancers. Nutr. J. 15:99. doi: 10.1186/s12937-016-0217-2
Andriamadio, J. H., Rasoanaivo, L. H., Benedec, D., Vlase, L., Gheldiu, A. M., Duma, M., et al. (2015). HPLC/MS analysis of polyphenols, antioxidant and antimicrobial activities of Artabotrys hildebrandtii O. Hffm. extracts. Nat. Prod. Res. 29, 2188–2196. doi: 10.1080/14786419.2015.1007458
Atanasov, A. G., Waltenberger, B., Pferschy-Wenzig, E. M., Linder, T., Wawrosch, C., Uhrin, P., et al. (2015). Discovery and resupply of pharmacologically active plant-derived natural products: a review. Biotechnol. Adv. 33, 1582–1614. doi: 10.1016/j.biotechadv.2015.08.001
Atay, I., Kirmizibekmez, H., Kaiser, M., Akaydin, G., Yesilada, E., and Tasdemir, D. (2016). Evaluation of in vitro antiprotozoal activity of Ajuga laxmannii and its secondary metabolites. Pharm. Biol. 54, 1808–1814. doi: 10.3109/13880209.2015.1129542
Campbell Jessica, K., King Jennifer, L., Harmston, M., Lila Mary, A., and Erdman John, W. (2006). Synergistic effects of flavonoids on cell proliferation in hepa-1c1c7 and LNCaP cancer cell lines. J. Food Sci. 71, S358–S363. doi: 10.1111/j.1750-3841.2006.00013.x
Casian, T., and Iurian, S. (2017). QbD for pediatric oral lyophilisates development: risk assessment followed by screening and optimization. Nutr. J. 43, 1932–1944. doi: 10.1080/03639045.2017.1350702
Csepregi, K., Neugart, S., Schreiner, M., and Hideg, E. (2016). Comparative evaluation of total antioxidant capacities of plant polyphenols. Molecules 21:E208. doi: 10.3390/molecules21020208
de Kok, T. M., van Breda, S. G., and Manson, M. M. (2008). Mechanisms of combined action of different chemopreventive dietary compounds: a review. Eur. J. Nutr. 47(Suppl. 2), 51–59. doi: 10.1007/s00394-008-2006-y
Denat, L., Kadekaro, A. L., Marrot, L., Leachman, S. A., and Abdel-Malek, Z. A. (2014). Melanocytes as instigators and victims of oxidative stress. J. Invest. Dermatol. 134, 1512–1518. doi: 10.1038/jid.2014.65
Enzler, T., Sano, Y., Choo, M. K., Cottam, H. B., Karin, M., Tsao, H., et al. (2011). Cell-selective inhibition of NF-kappaB signaling improves therapeutic index in a melanoma chemotherapy model. Cancer Discov. 1, 496–507. doi: 10.1158/2159-8290.cd-11-0143
Erdenechimeg, C., Guiqide, A., Dejidmaa, B., Chimedragchaa, C., and Purevsuren, S. (2017). Total phenolic, flavonoid, alkaloid and iridoid content and preventive effect of Lider-7-tang on lipopolysaccharide-induced acute lung injury in rats. Braz. J. Med. Biol. Res. 50:e5916. doi: 10.1590/1414-431x20175916
Erel, O. (2004). A novel automated direct measurement method for total antioxidant capacity using a new generation, more stable ABTS radical cation. Clin. Biochem. 37, 277–285. doi: 10.1016/j.clinbiochem.2003.11.015
Frank, C., Sundquist, J., Hemminki, A., and Hemminki, K. (2017). Risk of other cancers in families with melanoma: novel familial links. Sci. Rep. 7:42601. doi: 10.1038/srep42601
Ghorbani, A. (2017). Mechanisms of antidiabetic effects of flavonoid rutin. Biomed. Pharmacother. 96, 305–312. doi: 10.1016/j.biopha.2017.10.001
Gupta, S. C., Sundaram, C., Reuter, S., and Aggarwal, B. B. (2010). Inhibiting NF-κB activation by small molecules as a therapeutic strategy. Biochim. Biophys. Acta 1799, 775–787. doi: 10.1016/j.bbagrm.2010.05.004
Hawk, M. A., McCallister, C., and Schafer, Z. T. (2016). Antioxidant activity during tumor progression: a necessity for the survival of cancer cells? Cancers 8:E92. doi: 10.3390/cancers8100092
Israili, Z. H., and Lyoussi, B. (2009). Ethnopharmacology of the plants of genus Ajuga. Pak. J. Pharm. Sci. 22, 425–462.
Karin, M., Cao, Y., Greten, F. R., and Li, Z. W. (2002). NF-kappaB in cancer: from innocent bystander to major culprit. Nat. Rev. Cancer 2, 301–310. doi: 10.1038/nrc780
Kessler, M., Ubeaud, G., and Jung, L. (2003). Anti- and pro-oxidant activity of rutin and quercetin derivatives. J. Pharm. Pharmacol. 55, 131–142. doi: 10.1211/002235702559
Leon-Gonzalez, A. J., Auger, C., and Schini-Kerth, V. B. (2015). Pro-oxidant activity of polyphenols and its implication on cancer chemoprevention and chemotherapy. Biochem. Pharmacol. 98, 371–380. doi: 10.1016/j.bcp.2015.07.017
Leonti, M., and Casu, L. (2013). Traditional medicines and globalization: current and future perspectives in ethnopharmacology. Front. Pharmacol. 4:92. doi: 10.3389/fphar.2013.00092
Licarete, E., Sesarman, A., Rauca, V. F., Luput, L., Patras, L., and Banciu, M. (2017). HIF-1α acts as a molecular target for simvastatin cytotoxicity in B16.F10 melanoma cells cultured under chemically induced hypoxia. Oncol. Lett. 13, 3942–3950. doi: 10.3892/ol.2017.5928
Luput, L., Licarete, E., Drotar, D. M., Nagy, A. L., Sesarman, A., Patras, L., et al. (2018). In vivo double targeting of C26 colon carcinoma cells and microenvironmental protumor processes using liposomal simvastatin. J. Cancer 9, 440–449. doi: 10.7150/jca.21560
Luput, L., Licarete, E., Sesarman, A., Patras, L., Alupei, M. C., and Banciu, M. (2017). Tumor-associated macrophages favor C26 murine colon carcinoma cell proliferation in an oxidative stress-dependent manner. Oncol. Rep. 37, 2472–2480. doi: 10.3892/or.2017.5466
Madonna, G., Ullman, C. D., Gentilcore, G., Palmieri, G., and Ascierto, P. A. (2012). NF-κB as potential target in the treatment of melanoma. J. Transl. Med. 10:53. doi: 10.1186/1479-5876-10-53
Orfali, G. C., Duarte, A. C., Bonadio, V., Martinez, N. P., de Araújo, M., Priviero, F. B. M., et al. (2016). Review of anticancer mechanisms of isoquercitin. World J. Clin. Oncol. 7, 189–199. doi: 10.5306/wjco.v7.i2.189
Patras, L., Sesarman, A., Licarete, E., Luca, L., Alupei, M. C., Rakosy-Tican, E., et al. (2016). Dual role of macrophages in the response of C26 colon carcinoma cells to 5-fluorouracil administration. Oncol. Lett. 12, 1183–1191. doi: 10.3892/ol.2016.4708
Rasoanaivo, P., Wright, C. W., Willcox, M. L., and Gilbert, B. (2011). Whole plant extracts versus single compounds for the treatment of malaria: synergy and positive interactions. Malar. J. 10(Suppl. 1):S4. doi: 10.1186/1475-2875-10-s1-s4
Rauca, V. F., Licarete, E., Luput, L., Sesarman, A., Patras, L., Bulzu, P., et al. (2018). Combination therapy of simvastatin and 5, 6-dimethylxanthenone-4-acetic acid synergistically suppresses the aggressiveness of B16.F10 melanoma cells. PLoS One 13:e0202827. doi: 10.1371/journal.pone.0202827
Rice-Evans, C. A., Miller, N. J., and Paganga, G. (1996). Structure-antioxidant activity relationships of flavonoids and phenolic acids. Free Radic. Biol. Med. 20, 933–956.
Sadati, N., Jenett-Siems, K., Siems, K., Ardekani, M. R., Hadjiakhoondi, A., Akbarzadeh, T., et al. (2012). Major constituents and cytotoxic effects of Ajuga chamaecistus ssp. tomentella. Z. Naturforsch. C 67, 275–281.
Sesarman, A., Tefas, L., Sylvester, B., Licarete, E., Rauca, V., Luput, L., et al. (2018). Anti-angiogenic and anti-inflammatory effects of long-circulating liposomes co-encapsulating curcumin and doxorubicin on C26 murine colon cancer cells. Pharmacol. Rep. 70, 331–339. doi: 10.1016/j.pharep.2017.10.004
Surowiec, I., Orikiiriza, J., Karlsson, E., Nelson, M., Bonde, M., Kyamanwa, P., et al. (2015). Metabolic signature profiling as a diagnostic and prognostic tool in pediatric plasmodium falciparum malaria. Open Forum Infect. Dis. 2:ofv062. doi: 10.1093/ofid/ofv062
Toiu, A., Mocan, A., Vlase, L., Parvu, A. E., Vodnar, D. C., Gheldiu, A. M., et al. (2018). Phytochemical composition, antioxidant, antimicrobial and in vivo anti-inflammatory activity of traditionally used romanian ajuga laxmannii (Murray) benth. (“Nobleman’s Beard” - Barba Imparatului). Front. Pharmacol. 9:7. doi: 10.3389/fphar.2018.00007
Toiu, A., Vlase, L., Arsene, A., Vodnar, D., and Oniga, I. (2016). LC/UV/MS profile of polyphenols, antioxidant and antimicrobial effects of Ajuga genevensis L. extracts. Farmacia 64:53–57.
Toiu, A., Vlase, L., Gheldiu, A.-M., Vodnar, D., and Oniga, I. (2017). Evaluation of the antioxidant and antibacterial potential of bioactive compounds from Ajuga Reptans extracts. Farmacia 65, 351–355.
Tuorkey, M. J. (2016). Molecular targets of luteolin in cancer. Eur. J. Cancer Prev. 25, 65–76. doi: 10.1097/cej.0000000000000128
Vaiopoulos, A. G., Athanasoula, K., and Papavassiliou, A. G. (2013). NF-kappaB in colorectal cancer. J. Mol. Med. 91, 1029–1037. doi: 10.1007/s00109-013-1045-x
Venditti, A., Frezza, C., Maggi, F., Lupidi, G., Bramucci, M., Quassinti, L., et al. (2016). Phytochemistry, micromorphology and bioactivities of Ajuga chamaepitys (L.) Schreb. (Lamiaceae, Ajugoideae): Two new harpagide derivatives and an unusual iridoid glycosides pattern. Fitoterapia 113, 35–43. doi: 10.1016/j.fitote.2016.06.016
Venza, M., Visalli, M., Beninati, C., De Gaetano, G. V., Teti, D., and Venza, I. (2015). Cellular mechanisms of oxidative stress and action in melanoma. Oxid. Med. Cell Longev. 2015:481782. doi: 10.1155/2015/481782
Vlase, L., Parvu, M., Parvu, E. A., and Toiu, A. (2012). Chemical constituents of three Allium species from Romania. Molecules 18, 114–127. doi: 10.3390/molecules18010114
Weichert, W., Boehm, M., Gekeler, V., Bahra, M., Langrehr, J., Neuhaus, P., et al. (2007). High expression of RelA/p65 is associated with activation of nuclear factor-kappaB-dependent signaling in pancreatic cancer and marks a patient population with poor prognosis. Br. J. Cancer 97, 523–530. doi: 10.1038/sj.bjc.6603878
Wu, D., Wu, P., Zhao, L., Huang, L., Zhang, Z., Zhao, S., et al. (2015). NF-κB expression and outcomes in solid tumors: a systematic review and meta-analysis. Medicine 94:e1687. doi: 10.1097/md.0000000000001687
Xia, Y., Shen, S., and Verma, I. M. (2014). NF-κB, an active player in human cancers. Cancer Immunol. Res. 2, 823–830. doi: 10.1158/2326-6066.cir-14-0112
Yajima, I., Kumasaka, M. Y., Thang, N. D., Goto, Y., Takeda, K., Yamanoshita, O., et al. (2012). RAS/RAF/MEK/ERK and PI3K/PTEN/AKT signaling in malignant melanoma progression and therapy. Dermatol. Res. Pract. 2012:354191. doi: 10.1155/2012/354191
Yan, X., Qi, M., Li, P., Zhan, Y., and Shao, H. (2017). Apigenin in cancer therapy: anti-cancer effects and mechanisms of action. Cell Biosci. 7:50. doi: 10.1186/s13578-017-0179-x
Zhang, L. L., Mu, G. G., Ding, Q. S., Li, Y. X., Shi, Y. B., Dai, J. F., et al. (2015). Phosphatase and tensin homolog (PTEN) represses colon cancer progression through inhibiting paxillin transcription via PI3K/AKT/NF-kappaB pathway. J. Biol. Chem. 290, 15018–15029. doi: 10.1074/jbc.M115.641407
Zhang, X., Lin, D., Jiang, R., Li, H., Wan, J., and Li, H. (2016). Ferulic acid exerts antitumor activity and inhibits metastasis in breast cancer cells by regulating epithelial to mesenchymal transition. Oncol. Rep. 36, 271–278. doi: 10.3892/or.2016.4804
Keywords: Ajuga species, polyphenols, iridoids, antiproliferative activity, nuclear factor – kappa B, oxidative stress
Citation: Rauca V-F, Vlase L, Casian T, Sesarman A, Gheldiu A-M, Mocan A, Banciu M and Toiu A (2019) Biologically Active Ajuga Species Extracts Modulate Supportive Processes for Cancer Cell Development. Front. Pharmacol. 10:334. doi: 10.3389/fphar.2019.00334
Received: 05 December 2018; Accepted: 19 March 2019;
Published: 05 April 2019.
Edited by:
Judit Hohmann, University of Szeged, HungaryReviewed by:
Georg Krupitza, Medical University of Vienna, AustriaGokhan Zengin, Selçuk University, Turkey
Copyright © 2019 Rauca, Vlase, Casian, Sesarman, Gheldiu, Mocan, Banciu and Toiu. This is an open-access article distributed under the terms of the Creative Commons Attribution License (CC BY). The use, distribution or reproduction in other forums is permitted, provided the original author(s) and the copyright owner(s) are credited and that the original publication in this journal is cited, in accordance with accepted academic practice. No use, distribution or reproduction is permitted which does not comply with these terms.
*Correspondence: Laurian Vlase, laurian.vlase@umfcluj.ro