Sentiment-Based Prediction of Alternative Cryptocurrency Price Fluctuations Using Gradient Boosting Tree Model
 Tianyu Ray Li1
  Feng Fu
- 1Department of Mathematics, Dartmouth College, Hanover, NH, United States
- 2Department of Biomedical Data Science, Geisel School of Medicine at Dartmouth, Lebanon, NH, United States
In this paper, we analyze Twitter signals as a medium for user sentiment to predict the price fluctuations of a small-cap alternative cryptocurrency called ZClassic. We extracted tweets on an hourly basis for a period of 3.5 weeks, classifying each tweet as positive, neutral, or negative. We then compiled these tweets into an hourly sentiment index, creating an unweighted and weighted index, with the latter giving larger weight to retweets. These two indices, alongside the raw summations of positive, negative, and neutral sentiment were juxtaposed to ~400 data points of hourly pricing data to train an Extreme Gradient Boosting Regression Tree Model. Price predictions produced from this model were compared to historical price data, with the resulting predictions having a 0.81 correlation with the testing data. Our model's predictive data yielded statistical significance at the p < 0.0001 level. Our model is the first academic proof of concept that social media platforms such as Twitter can serve as powerful social signals for predicting price movements in the highly speculative alternative cryptocurrency, or “alt-coin,” market.
A cryptocurrency (or crypto currency) is a digital asset designed to work as a medium of exchange that uses cryptography to secure its transactions, control the creation of additional cryptocurrencies, and verify the secure transfer of assets [1]. Cryptocurrencies can be classified as types of digital or alternative currencies, distinct from traditional currencies in that they are founded on the principle of decentralized control, compared to the central banking systems that typical currencies rely on [2]. The inception of cryptocurrencies dates back to 2008, when an unknown entity under the pseudonym Satoshi Nakamoto publicly released a paper titled Bitcoin: A Peer-to-Peer Electronic Cash System [3]. In January 2009, Nakamoto implemented the bitcoin software as open source code, releasing it to the public on SourceForge [4]. Nakamoto's contributions galvanized a wave of public attention, spurring others to create alternative cryptocurrencies that relied on the same fundamental technology but were specialized in purpose [5].
This wave of new cryptocurrencies has received much attention by the media and investors alike due to the assets' innovative features, potential capability as transactional tools, and tremendous price fluctuations. In the past 2 years, the total market capitalization of the entire cryptocurrency market has increased 11,600% from $7.4 billion dollars in January 2016 to over $800 billion dollars as of January 2018 [6]. This exponential growth is the result of both increased investor speculation and the introduction of various new cryptocurrencies, with current estimates of the total number of cryptocurrencies topping 1, 400 different coins [7]. Thus, analyzing evolutionary dynamics of the cryptocurrency market is a topic of current interest and can provide useful insight about the market share of cryptocurrencies [5, 8, 9]. Moreover, longitudinal datasets of Bitcoin transactions have been used to identify the socio-economic drivers in cryptocurrency adoption [10].
The speculation behind these digital assets has increased to such magnitudes that even cryptocurrencies with no functionality have surpassed the market value of established companies whose stocks are publicly traded in the equity markets. This rapid and exponential increase in cryptocurrency prices suggests that price fluctuations are driven primarily by retail investor speculation, and that this market exhibiting signs of a financial bubble [11]. In light of this, a recent study quantifies the inefficiency of the Bitcoin market by studying the long-range dependence of Bitcoin return and volatility from 2011 until 2017 [12]. Such dramatic volatility of the cryptocurrency market may be partly due to the inevitable fragility of decentralized systems based on blockchain technology [13]. Noteworthy, there has been increasing attention paid to improving our understanding of cryptocurrency market behavior, for example, by means of field experiments of peer influence (exerted by bots) on human trading decisions [14] and probabilistic modeling of buy and sell orders [15].
Given that the alternative cryptocurrency market is dominated by retail investors, with few large institutional investors, sentiment on social media platforms and online forums may present a viable medium to capture total investor sentiment [16]. More recently, it has been shown that social media data such as Twitter can be used to track investor sentiment, and price changes in the Bitcoin market and other predominant cryptocurrencies [17–20]. In Garcia and Schweitzer [18], the authors demonstrate that Twitter sentiment, alongside economic signals of volume, price of exchange for USD, adoption of the Bitcoin technology, overall trading volume could be used to predict price fluctuations.
As a consequence, investors may have adopted a similar strategy within the Bitcoin market, thereby weakening the correlation between Twitter sentiment and Bitcoin prices. Moreover, the daily trading volume of cryptocurrencies has increased such that conditions are now suitable for high-frequency trading firms to exploit this correlation [21]. For proof of concept, we thus decided that using Twitter sentiment to analyze price fluctuations of nascent alternative cryptocurrencies (commonly known as “alt-coins”) could provide valuable insight, and eventually lead to a viable arbitrage opportunity in other emerging alternative cryptocurrencies. Therefore, we aim to analyze and build a machine learning pricing model for this highly speculative market through gauging investor sentiment via Twitter, a pervasive social network that has been strongly suggested to serve as a powerful social signal for Bitcoin prices [18].
Materials and Methods
We began by researching different alternative cryptocurrencies to ultimately decide which would be best suited within the confines of our analysis. Ultimately, we decided to choose ZClassic (ZCL), a private, decentralized, fast, open-source community driven virtual currency, as the primary target of our academic focus given its unique technological dynamics and suitability of trading volume within the confines of our computational capacity. First off, the technological nature of the ZClassic cryptocurrency lends itself to a high level of predictability via tweet analysis. Specifically, ZClassic is set to “hard fork” into Bitcoin Private on February 28th, 2018. A hardfork is a major change to blockchain protocol which makes previously invalid blocks or transactions valid [22].
As a result, the single cryptocurrency (ZClassic) preceding the hard fork will be split into two, ZClassic and Bitcoin Private [22]. Previous hardforks include Bitcoin Cash and Bitcoin Gold, and the history of each suggests that ZClassic's price fluctuations will be largely based off speculation regarding the future success and accessibility of Bitcoin Private. For example, any news release that is seen by investors as indicative of the possibility that Bitcoin Private will be traded on a major exchange or that the fork will be supported by a certain exchange will exert upwards price pressure on the cryptocurrency's price. As such, real-time tweet analysis serves as a suitable means to gauge investor sentiment following these news releases, and pinpoint spontaneous news releases themselves. Secondly, the relatively lower trading volume of ZCL compared to that of alternative cryptocurrencies suggests that it may be more susceptible to sentiment-based price movement.
To collect the tweets, we decided to base our program in RStudio, given its motley of free Twitter-analysis packages and foundations within data analysis and statistical computing. Specifically, we used the open-sourced rtweet package [23], which accesses Twitter's REST and stream APIs. We were able to use the rtweet package to retrieve, from each of the last 7 days, searching from midnight backwards, tweets that had the terms “ZClassic,” “ZCL,” and “BTCP.” This collection process was repeated 3 times over the course of three and a half weeks to provide sufficient data for our analysis. We then merged all data sets, and eliminated any duplicate tweets given that a single tweet could contain all three of these terms and therefore be accounted for thrice in the final data set. In the end, we garnered a final data set of 130, 000 unique tweets.
We then created an algorithm to classify each tweet as positive, negative, or neutral sentiment using natural language processing. The dictionary, primarily sourced from the Python package “Textblob,” that assigns impactful words and phrases a polarity value (e.g., “top” and “not great” have values of 0.5 and −0.4, respectively), which we view as sentiment. Thus, each tweet is assigned a polarity value between −1 and 1 based on the combinations of keywords and phrases. If the entire tweet string has a positive nonzero polarity value, our program scores the sentiment as positive, or +1. If the entire tweet string has a negative nonzero polarity value, our program scores the sentiment as negative, −1. If the polarity value is zero, then the tweet receives a sentiment value of 0.
Another important aspect to note regarding the character of each tweet is the chained network effect that each retweet creates. It is evident that retweets can cause a chain effect, thereby increasing the dispersion of the initial “tweet.” As such, it is possible that retweeted posts contain new positive or negative information, or may be viewed by the trading community as “insightful.” For this reason, we decided to create a second sentiment index in which retweets would be more heavily weighted than tweets themselves, using it as one of the features in training our model. We respectively assigned a weight of −2 or +2 to every negative and positive retweet because we assumed retweets signify more newsworthy events and have greater credibility than single tweets. Thus, we believe cryptocurrency investors will be more likely to react to retweets than to single tweets. Both the values of our weighted and unweighted sentiment indices were then calculated on an hourly basis by summing the weights of all coinciding tweets, which allowed us to directly compare this index to available ZCL price data.
For model selection, we employed 10-fold cross validation on 589 data points to choose an optimal model framework among linear regression, logistic regression, polynomial regression, exponential regression, tree model, and support vector machine regression. A tree model called the Extreme Gradient Boosting Regression (also known as XGBoost [24]), exhibited the smallest loss, or inaccuracy, and was thus chosen to train the model on our data. The XGBoost model, as well as other tree-based models, is particularly suited for applications on our data for the following reasons:
1. Tree models are not sensitive to the arithmetic range of the data and features. Thus, we do not need to normalize the data and possibly prevent loss due to normalization.
2. Tree models are by far the most scalable machine learning model due to their construction processes—simply adding more children nodes to the pre-existing tree nodes will update the tree and allow our strategy to continue to accurately predict price as our collection of price and tweet data increases into the future. It also makes the model adaptable for currencies with larger daily tweet volumes.
3. On the abstract level, the tree model is a rule-based learning method which, unlike a traditional regression learning method, has more potential to unveil insightful relationships between features.
XGBoost is a tree ensemble model, which outputs a weighted sum of the predictions of multiple regression trees, by weighing mislabeled examples more heavily.
For completeness, we sketch the key ideas behind XGBoost as follows. Let us define
where is the prediction from our model for the i-th observation, ϕ(xi) is our predicting function and each f representing a tree in our regression tree forest, . Our goal is to minimize the objective function , defined below:
where
The function represents a loss function, which in this case is a mean-square function, and the Ω(fk) is a regularization, which penalizes each tree for having too many leaves and to ensure smooth final learned weights. The definition of this regularization follows the above equation where w is the coefficient at each node and is the number of leaves in the tree.
To minimize the above objective function, we employed a greedy Algorithm 1 to create our regression tree forest as originally implemented in Chen and Guestrin [24].
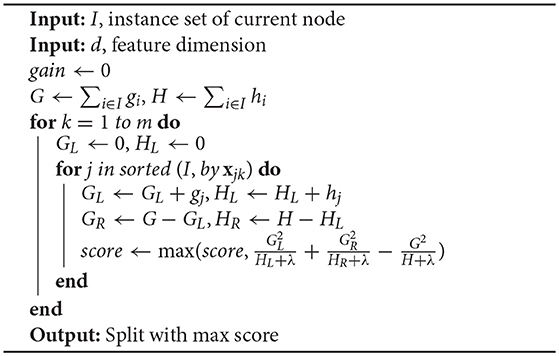
Algorithm 1: Exact greedy algorithm for split finding [24] used in our price prediction model.
One-third of the 589 data points is separated as the testing data, and the remainder is used as the training set as we built our Extreme Gradient Boosting Regression model. The model also tests different lead-lag on the range of [0, 1, 2, 3, 4, 5h] since we do not know how quickly the public would react to the market update or the social media sentiment. Based on the testing result, we decided that there is a 3-h lag effect between social media information and price effects.
Results
To begin, our natural language processing classification algorithm showed significant accuracy in identifying the sentiment of each tweet (see Table 1). Examples of tweets that received positive, neutral, and negative sentiment values are shown in Table 2.
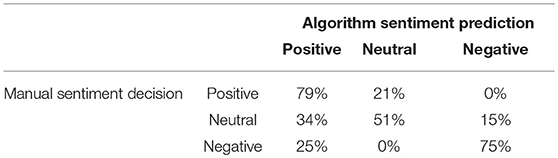
Table 1. Validation analysis of algorithm sentiment prediction by manual inspection.
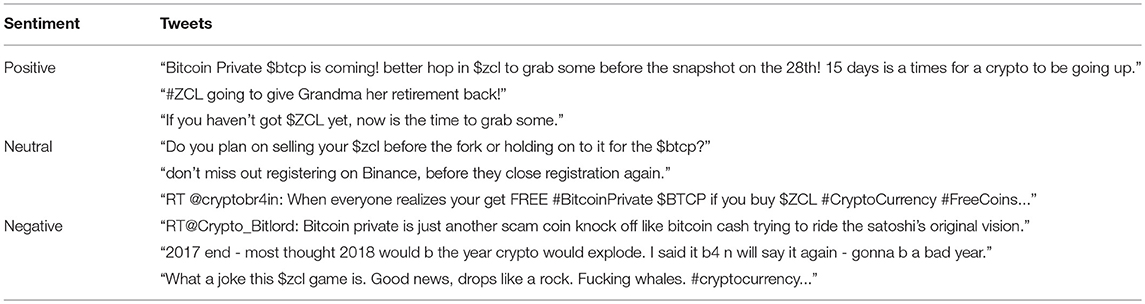
Table 2. Examples of Tweets with positive, neutral and negative sentiment classifications in our dataset.
Upon reviewing our data set of tweets, one major concern we had was the flood of computer-generated bot tweets, which often promote contests and giveaways. In practice, retail investors often ignore these tweets, given their obvious usage as means of commercial promotions. These are often written using positive language; however, the vast majority of these were properly characterized as neutral. To further gauge the accuracy of our algorithm, we manually classified a sample of 100 random tweets, comparing them to our algorithm's classifications to measure false classification rates. Table 1 shows the general distinctions between our algorithm's classifications and manual classifications.
In all three cases we can see that the chance of the algorithm guessing the sentiment correctly is over 50%. The algorithm boasts a near 80% success rate in successfully classifying positive tweets, and correctly characterized 0% of positive tweets as negative in this sample. However, neutral and negative tweets were falsely characterized as positive at a rate of 34% and 25%, respectively. Negative tweets are successfully classified at a rate of 75%. Sarcasm remains very difficult to detect (partially explaining the 25% false positive), but it typically appears in a minority of tweets.
Having set the sentiment classification algorithms in place, we decided to train our model using six different features: Pure Positive Sentiment, Pure Negative Sentiment, Neutral Sentiment, An Unweighted Sentiment index, A Weighted Sentiment Index, and Hourly Trading Volume. These six features proved to be varied enough to train the model effectively on a variety of different trading points and resulted in the best and most accurate overall correlation with the testing data (as shown in Table 3). The detailed co-plots of the different features vs. the price curve over the study period is shown in Figure 1.
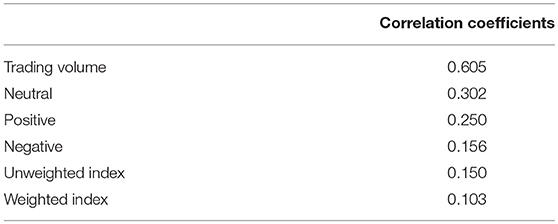
Table 3. 5-factor correlation coefficients between the chosen feature and the price data, respectively.
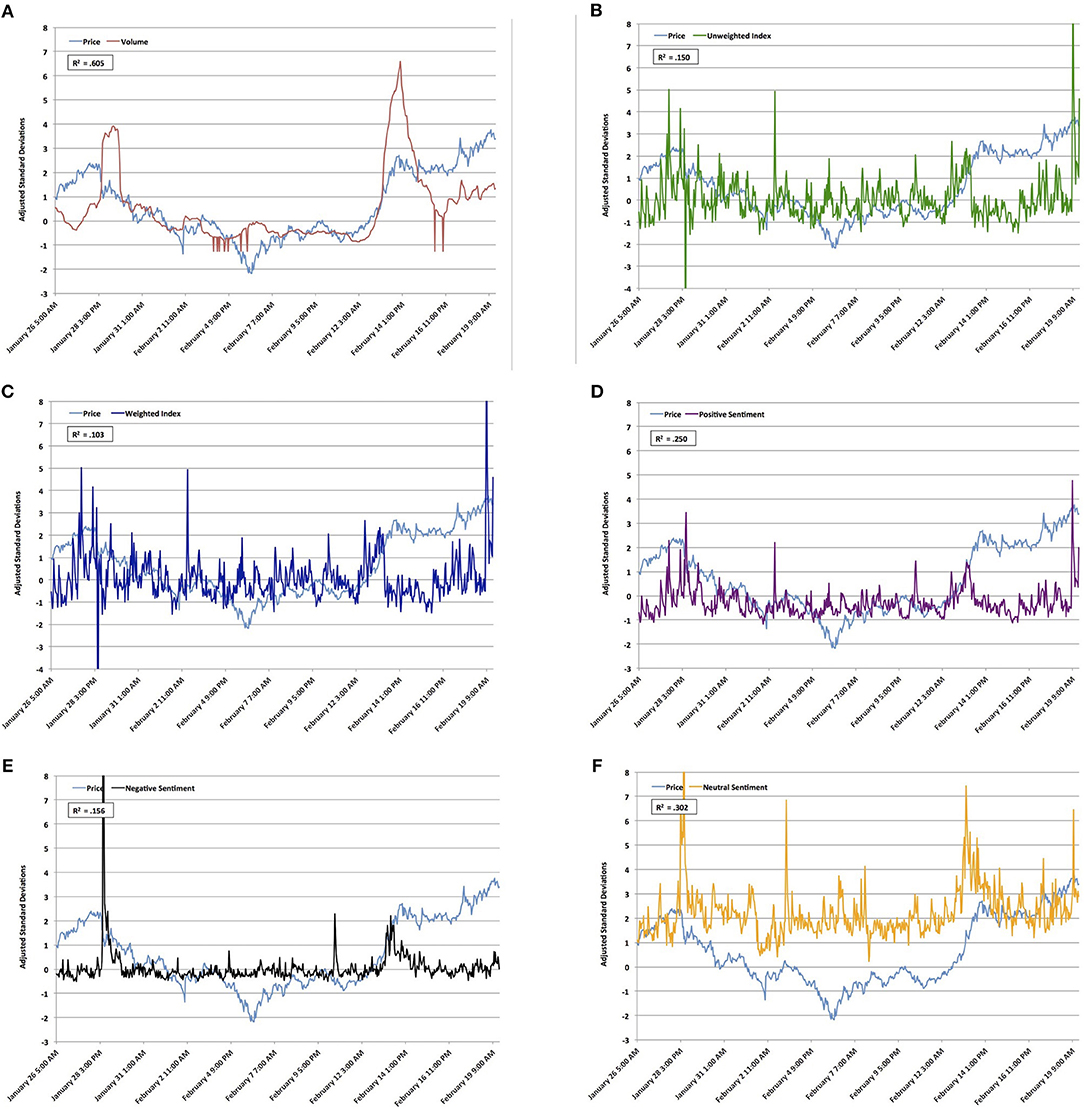
Figure 1. Shown are the price fluctuations vs. our chosen six features, respectively, over the time period under consideration: (A) Price vs. Volume, (B) Price vs. Unweighted Index, (C) Price vs. Weighted Index, (D) Price vs. Pos. Sentiment, (E) Price vs. Neg. Sentiment, and (F) Price vs. Neutral Sentiment. These six features proved to be varied enough to train the model effectively on a variety of different trading points and resulted in the best and most accurate overall correlation with the testing data, as summarized in Table 3.
In testing our model, we were able to produce price data that strongly reflected the actual fluctuations (see Figure 2). In particular, it is significant that our model achieved a Pearson correlation of 0.806 when tested against the actual test data, yielding a statistical significance at the p < 0.0001 level. As such, our model provides a viable method to predict price fluctuations, and also serves as a proof of concept that statistical analyses using Twitter sentiment can also be used to analyze price fluctuations in additional cryptocurrencies. It is also interesting to note that despite the similar directionality between the price model and actual price fluctuations, there appears to be a price gap between the two of around $30 (see Figure 2B). One possible explanation to this gap is the discrepancies between the training and testing data (as summarized in Table 4). First, it is important to note that the model was trained on data that primarily exhibited a negative trend (see Table 4). As such, it is possible that the model became more desensitized to positive stimuli, and more sensitive to negative stimuli. In the testing data, however, the model was exposed to ~ 3% decrease in positive stimuli and ~ 0.5% increase in negative stimuli (Table 4). The number of average tweets per hour also increased by ~ 15% (Table 4). As such, it is possible that the model reacted to the change in these factors by exhibiting a slightly lower price expectation than what the actual market reflected. However, the overall directionality and correlation within the model remained strong, suggesting that if the model were also trained on data that exhibited positive trends, a more accurate set of predictions would have resulted.
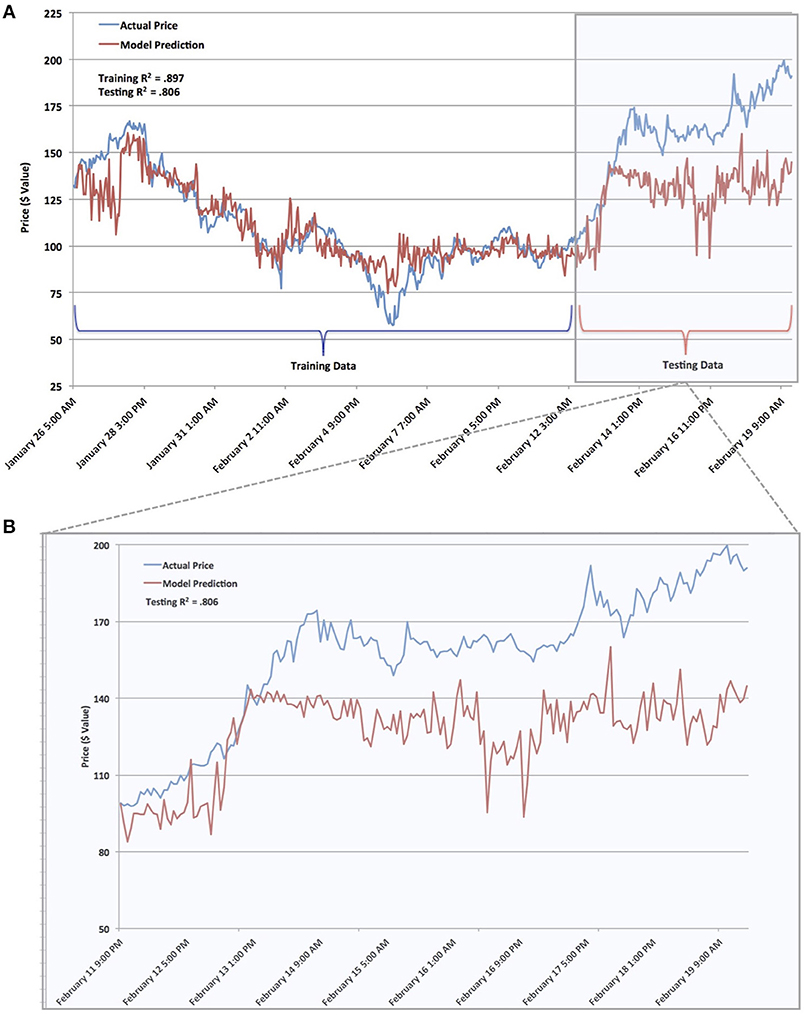
Figure 2. Comparison of model prediction and actual price data. (A) plots the fitted price curve obtained from the training price data and the predicted price curve with respect to the testing data. (B) details the model prediction price data as compared to the testing real price data. By incorporating Twitter sentiment and trading volume, the Extreme Gradient Boosting Regression Tree Model provides a viable means of predicting price fluctuations within the ZClassic cryptocurrency market. Moreover, it serves as a proof of concept that statistical analyses using Twitter sentiment can also be used to analyze price fluctuations in other cryptocurrencies of interest.
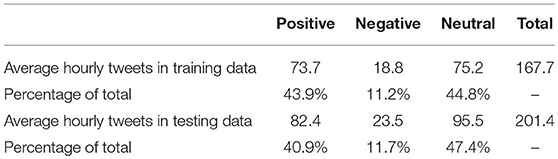
Table 4. Discrepancies of Twitter sentiments between testing and training data.
Discussion and Conclusions
In conclusion, our results suggest that by analyzing Twitter sentiment and trading volume, an Extreme Gradient Boosting Regression Tree Model serves as a viable means of predicting price fluctuations within the ZClassic cryptocurrency market. As such, given the complete lack of research within this academic sphere, our model serves as a proof of concept that social media platforms such as twitter can be used to capture investor sentiment, and that this sentiment is an early signal to future price fluctuations in alternative cryptocurrencies. Of particular interest is seeing whether this approach produces similarly strong results when applied to other alternative cryptocurrencies such as ZCash and Bitcoin Private. However, this discovery sheds light to the possibility of arbitrage opportunities that utilize social media platform sentiment to predict future cryptocurrency prices.
Our pricing model could be further improved by factoring in other social media platforms or data, such as Google Search results, Facebook posts, and Reddit Posts. Recent studies show that Wikipidia queries can also serve a potential signal for quantifying the public interest in cryptocurrency [25]. These parallel platforms can be considered as multiplex networks where the information/behavior spreading process on one layer might impact similar process on another layer [26–28]. Therefore, synthesizing data sources from multiple platforms where individuals may have “multiplex” interactions/influences of different sorts may lead to better price predications. Moreover, the dictionary that we have used in our model could be also be aided by adding investment-specific terms that indicate positive and negative sentiment such as “bull” and “bear” respectively. As seen from our manual vs. algorithm cross-analysis, the algorithm's greatest weakness is in classifying tweets that should otherwise be characterized as “negative” as “positive.” After careful review it is evident that such inaccurate characterizations are due to the algorithm's inability to detect sarcasm, a pervasive language schema in popular social media platforms. As such, further research to enhance our algorithm to detect sarcasm would increase the reliability of the sentiment analysis, and thereby potentially improve the accuracy of our prediction to retail driven price changes.
Lastly, it would be interesting to further train and test our model over a longer time period. Given the confines of the date of our cryptocurrency's fork and our computational capacity, our study was restricted to a data set that covered a time frame of 3.5 weeks. However, our results suggest a necessity to devote further resources and investments that would enable us to implement study our pricing model under a longer time frame and with other cryptocurrencies.
Data Availability
All datasets generated for this study are included in the manuscript/supplementary files.
Author Contributions
All authors performed analyses, discussed the results, and contributed to the text of the manuscript.
Conflict of Interest Statement
The authors declare that the research was conducted in the absence of any commercial or financial relationships that could be construed as a potential conflict of interest.
Acknowledgments
This work is supported by the William H. Neukom Institute for Computational Science at Dartmouth. FF gratefully acknowledges support from the G. Norman Albree Trust Fund, the Dartmouth Faculty Startup Fund, Walter & Constance Burke Research Initiation Award, and NIH Roybal Center Pilot Grant.
References
1. Greenberg A. Crypto currency. (2011, April). Available online at: https://www.forbes.com/forbes/2011/0509/technology-psilocybin-bitcoins-gavin-andresen-crypto-currency.html (accessed April 30, 2018).
2. Allison I. If banks want benefits of blockchains, they must go permissionless. (2015, September). Available online at: https://www.ibtimes.co.uk/nick-szabo-if-banks-want-benefits-blockchains-they-must-go-permissionless-1518874 (accessed April 30, 2018).
3. Nakamoto S. Bitcoin: a peer-to-peer electronic cash system. (2008, October). Available online at: https://bitcoin.org/bitcoin.pdf (accessed April 30, 2018).
4. Davis J. The crypto-currency: bitcoin and its mysterious inventor. The New Yorker. (2014, October). Available online at: https://www.newyorker.com/magazine/2011/10/10/the-crypto-currency (accessed April 30, 2018).
5. ElBahrawy A, Alessandretti L, Kandler A, Pastor-Satorras R, Baronchelli A. Evolutionary dynamics of the cryptocurrency market. R Soc Open Sci. (2017) 4:170623. doi: 10.1098/rsos.170623
6. Chart from CoinMarketCap. Available online at: https://coinmarketcap.com/currencies/zclassic/ (accessed April 30, 2018).
7. Cornish C. Growing number of cryptocurrencies spark concerns. Financial Times. (2018, January). Available online at: https://www.ft.com/content/a6b90a8c-f4b7-11e7-8715-e94187b3017e (accessed April 30, 2018).
8. Sigaki HY, Perc M, Ribeiro HV. Clustering patterns in efficiency and the coming-of-age of the cryptocurrency market. Sci Rep. (2019) 9:1440. doi: 10.1038/s41598-018-37773-3
9. Alessandretti L, ElBahrawy A, Aiello LM, Baronchelli A. Anticipating cryptocurrency prices using machine learning. Complexity. (2018) 2018:8983590. doi: 10.1155/2018/8983590
10. Parino F, Gauvin L, Beiro MG. Analysis of the Bitcoin blockchain: socio-economic factors behind the adoption. arXiv:1804.07657. (2018). doi: 10.1140/epjds/s13688-018-0170-8
11. Macedo JM. Are We in a cryptocurrency bubble? A comparison with the 2000 dotcom bubble. FreeCodeCamp.com. (2017, November 29). Available online at: https://medium.freecodecamp.org/are-we-in-a-cryptocurrency-bubble-a-comparison-with-the-2000-dotcom-bubble-a463d8dd8d8b/ (accessed April 30, 2018).
12. Bariviera AF. The inefficiency of Bitcoin revisited: a dynamic approach. Econ Lett. (2017) 161:1–4. doi: 10.1016/j.econlet.2017.09.013
13. De Domenico M, Baronchelli A. The fragility of decentralised trustless socio-technical systems. EPJ Data Sci. (2019) 8:2. doi: 10.1140/epjds/s13688-018-0180-6
14. Krafft PM, Della Penna N, Pentland A. An experimental study of cryptocurrency market dynamics. arXiv:1801.05831. (2018). doi: 10.1145/3173574.3174179
15. Guo T, Antulov-Fantulin N. Predicting short-term Bitcoin price fluctuations from buy and sell orders. arXiv:1802.04065. (2018).
16. Leinz K. Who is buying bitcoin? This charts reveals the answer money. Time. (2018, January 24). Available online at: time.com/money/5116904/who-is-buying-bitcoin/ (accessed April 30, 2018).
17. Meucci A. 'P' Versus 'Q': differences and commonalities between the two areas of quantitative finance. GARP Risk Professional, 47–50. (2011, February). Available online at: http://ssrn.com/abstract=1717163 (accessed January 22, 2011).
18. Garcia D, Schweitzer F. Social signals and algorithmic trading of Bitcoin. R Soc Open Sci. (2015) 2:150288. doi: 10.1098/rsos.150288
19. Kim YB, Kim JG, Kim W, Im JH, Kim TH, Kang SJ, et al. Predicting fluctuations in cryptocurrency transactions based on user comments and replies. PLoS ONE. (2016) 11:e0161197. doi: 10.1371/journal.pone.0161197
20. Phillips RC, Gorse D. Predicting cryptocurrency price bubbles using social media data and epidemic modelling. In: Computational Intelligence (SSCI), 2017 IEEE Symposium Series on 2017 Nov 27. IEEE (2017). p. 1–7.
21. Williams-Grut O. The cryptocurrency market is now doing the same daily volume as the New York Stock Exchange. Business Insider. (2017, December 20).
22. Hayes A. ‘Hard Fork.' Investopedia. (2017, March, 20). Available online at: www.investopedia.com/terms/h/hard-fork.asp (accessed April 30, 2018).
23. Kearney MW. rtweet: Collecting Twitter Data. (2017). Available online at: https://cran.r-project.org/package=rtweet
24. Chen T, Guestrin C. XGboost: a scalable tree boosting system. In: Proceedings of the 22nd ACM SIG KDD International conference on Knowledge Discovery and Data Mining. San Francisco, CA: ACM (2016). p. 785–94.
25. ElBahrawy A, Alessandretti L, Baronchelli A. Wikipedia and digital currencies: interplay between collective attention and market performance. arXiv:1902.04517. (2019).
26. Szolnoki A, Perc M. Information sharing promotes prosocial behaviour. N J Phys. (2013) 15:053010. doi: 10.1088/1367-2630/15/5/053010
27. Wang Z, Szolnoki A, Perc M. Optimal interdependence between networks for the evolution of cooperation. Sci Rep. (2013) 3:2470. doi: 10.1038/srep02470
Keywords: data science, cryptocurrency, tree-model, Twitter sentiment, social dynamics, data integration and computational methods
Citation: Li TR, Chamrajnagar AS, Fong XR, Rizik NR and Fu F (2019) Sentiment-Based Prediction of Alternative Cryptocurrency Price Fluctuations Using Gradient Boosting Tree Model. Front. Phys. 7:98. doi: 10.3389/fphy.2019.00098
Received: 07 May 2019; Accepted: 21 June 2019;
Published: 10 July 2019.
Edited by:
Matjaž Perc, University of Maribor, SloveniaReviewed by:
Chunyan Zhang, Nankai University, ChinaAttila Szolnoki, Hungarian Academy of Sciences (MTA), Hungary
Copyright © 2019 Li, Chamrajnagar, Fong, Rizik and Fu. This is an open-access article distributed under the terms of the Creative Commons Attribution License (CC BY). The use, distribution or reproduction in other forums is permitted, provided the original author(s) and the copyright owner(s) are credited and that the original publication in this journal is cited, in accordance with accepted academic practice. No use, distribution or reproduction is permitted which does not comply with these terms.
*Correspondence: Feng Fu, feng.fu@dartmouth.edu