Rapid automatic detection of water Ca, Mg elements using laser-induced breakdown spectroscopy
 Yijun Zhu1,2
  Guiyan Yang
 Hongwu Tian
 Daming Dong
- 1School of Mechanical Engineering, Guangxi University, Nanning, China
- 2Research Center of Intelligent Equipment, Beijing Academy of Agriculture and Forestry Sciences, Beijing, China
- 3Key Laboratory of Agricultural Sensors, Ministry of Agriculture and Rural Affairs, Beijing, China
Ca, Mg, as the main components in water, are not only essential nutrients for life but are also an important index of water hardness. Rapid detection of the element content is of great significance for water quality evaluation and nutrient balance in planting and breeding water. Traditional laboratory analysis methods are time consuming and involve complex procedures. Ion cross sensitivity and response drift also limit the application of online sensors. These disadvantages are not in line with the precise control and rapid response required for practical applications. Here, we propose a rapid automatic Ca, Mg ion concentration detection method using Laser-induced breakdown spectroscopy. Based on a cation exchange membrane, an automatic control system integrating water sampling, hybrid reacting, attachment drying and spectra measuring was constructed. The testing time for one sample could be compressed to 5 min. Consequently, it met the requirements of accuracy and timeliness of water element regulation. The proposed system can provide new technical means for large-scale aquaculture, soilless cultivation of facilities and other scenarios aiming at accurate measurement and control of elements in water body.
1 Introduction
Water is the source of all living beings, Ca and Mg are important elements of the water body [1]. The concentration and proportion of these elements have different impacts on water quality, and these influences affect every aspect of human activity through environmental water circulation [2, 3]. For drinking water, the concentration of Ca and Mg ions is an important evaluation index for water hardness. They not only affect the water taste and aroma, but also the heavy metal toxicity in water. Moreover, subacute health effects such as cardiovascular disease (CVD) and muscle spasms have been proved to be associated with water hardness [1, 4]. Particularly, in aquaculture, Ca and Mg are vital components of shrimp and crab bones, scales and carapaces, and the supplement of Ca and Mg during a critical period plays an important role for assurance of survival rate and yield [5]. As the single source of soilless culture, a slight change of nutrient solution element type and concentration has an obvious effect on crop growth, and crops will quickly show symptoms of deficiency and poisoning [6, 7]. Therefore, in terms of both long-term and short-term effects, timely detection of Ca and Mg content in water bodies has important practical value for production and daily life.
Atomic Emission Spectroscopy [8] is regarded as an effective tool for trace metal detection in aqueous solutions. Laboratory analysis methods including Atomic Absorption Spectroscopy (AAS) [9], Inductively Coupled Plasma-Atomic Emission Spectroscopy (ICP-AES) [10], and Inductively Coupled Plasma-Mass Spectrum (ICP-MS) [11]have also been widely used. The methods above have the advantages of high detection accuracy and comprehensive indicators. However, requirements for professional operation and a complex process lead to time-consuming detection cycles which cannot satisfy the necessary fast response for practical applications. An electronical conductivity (EC) sensor combined with a pH sensor can be used for online detection of ions in aqueous solution [12, 13]. However, EC values can only reflect the total ion concentration of soluble salt and cannot distinguish the type of ions. As a result, precise composition control cannot be achieved based on EC and pH alone [14]. As an alternative, an ion-selective electrode (ISE) has good selectivity, and it can be used for specific ion detection in solution. Due to the limitations of measurement principle and electrode material, cross-sensitivity and response drift constitute the major obstacle for Ion-selective electrode widely range application [15]. Therefore, a method that can realize the identification of multiple components and meet the requirements of rapid detection is of great importance for the development of water quality monitoring and regulation technology.
Laser-induced breakdown spectroscopy (LIBS) [16, 17], as a spectral detection technology [18-21], uses a high energy laser to ablate the sample surface and the constituent elements are excited into a high-energy plasma. Element type and content are determined by measuring the emission line of the plasma deexcitation. LIBS has the advantage of non-sample pretreatment and multi-component in situ rapid detection [22, 23], and it has been widely used in geology [24, 25], industry [26, 27], food [28, 29], biomedicine [30, 31] and other fields, which provides the possibility for the realization of rapid detection of water elements [32]. To avoid water sputtering and absorption of laser energy, researchers made good progress toward overcoming these obstacles by converting water to a jet flow, droplet and spray [33, 34], but the measurement stability could not be guaranteed. Although liquid-solid conversion can significantly improve the stability of the measurements, electrospray deposition (ESD) [35], solid-phase extraction (SPE) [36], and solid-phase microextraction (SPME) [37] have also been demonstrated to improve the limit of detection (LOD), the experimental equipment is complicated and not suitable for practical applications. The combination of LIBS and advanced materials including nano-particles [38, 39], graphene [37], and metal-organic frame (MOF) [40, 41] have been demonstrated for the improvement of water trace element detection sensitivity. The selectivity of specific elements can be further realized by material surface modification. Although the above method can realize highly sensitive detection of water elements, it cannot realize online detection, so it cannot meet the application scenarios which are sensitive to changes of water element content (such as aquaculture, or soilless cultivation in facilities).
Herein, we propose a new water Ca2+ and Mg2+ online detection system using LIBS combined with cation exchange membranes (CEM). The integration and automatic control of sampling, reacting, attachment moving, drying, and spectrum measuring procedure was realized and the quantity calibration curves for these two elements were also established. The system can provide technical support for automatic and precise control of water quality in practical production.
2 Materials and methods
2.1 Experimental samples
The sample solutions used in the experiment were CaCl2 and MgCl2 solutions, the concentration of Ca2+ was 160 mg/L and Mg2+ was 48 mg/L. CEM CMI-7000 S (Membrane International Inc., American) was used as an adsorbent with a thickness of 0.42mm, its exchange group was SO3-Na, exchange capacity was 1.6 meq/g, and it was applicable in solution with pH 1–14. Ion exchange is the process of substituting ions between an insoluble solid with exchangeable ions and ions of the same charge in a solution. In this way, CEM can extract other cations from the solution and convert the target ions from liquid to solid state. Therefore, CEM was used as both an adsorbent and spectral-detecting matrix. To ensure the effectiveness of the CEM, it was saturated in 1 mol/L HCl for 24 h and rinsed with deionized water until pH = 7 before it was used. Considering the upper limit of the exchange capacity of CEM, we used 3 cm2 CEM each time to prevent it from reaching the limit during the exchange of Ca2+ and Mg2+.
2.2 Design of automatic measuring system
An automatic device was designed for sample handling and detecting. As shown in Figure 1, the device consisted of an automatic sampling component, an element ion extraction component, a sample cleaning and drying component, and a LIBS spectroscopy measuring system. The workflow of the device is shown in Figure 2. First, the automatic sampling module injected the sample solution directly into the container after the CEM was installed with fixture and started the device. A magnetic stirring device at the bottom of the container ensured that Ca2+ and Mg2+ were uniformly and fully exchanged on the surface of the CEM. Next, the two-dimensional mobile component held the CEM with a fixture in the sample container. After stirring the sample solution for the set time of the program, the two-dimensional mobile component automatically moved the CEM to the cleaning and drying component successively so that the residuals on the CEM surface can be removed and the moisture interference can be minimized. Deionized water was used for CEM cleaning. The target object Ca2+, Mg2+ were absorbed on the CEM surface through covalent bonding which was strong enough that it could not be broken under the water cleaning condition. Therefore, there was no analyte loss during the water cleaning process. At last, the CEM was taken to the detecting position which was precisely the focal plane of the laser. At this point, the LIBS system measured the Ca2+ and Mg2+ on the CEM and the results were displayed on the screen of the control module. The CEM exposed area is round, and the position of the CEM surface coincides precisely with the laser focal plane. The spectral intensity of each sample was obtained by averaging five spectra collected at different positions on the CEM surface. The position switching was realized by the stepper motor to control the vertical movement of CEM in the laser focal plane position.
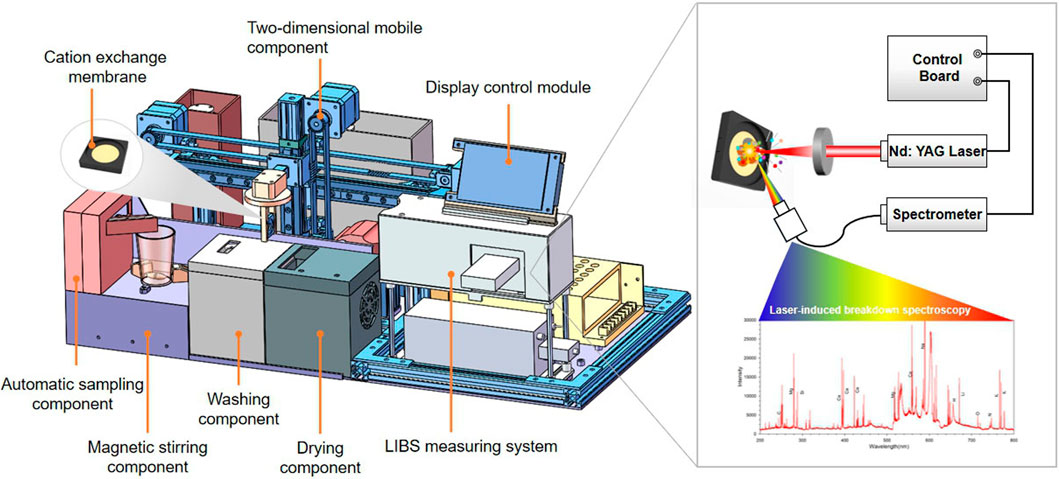
FIGURE 1. General structure of the automatic measuring system.
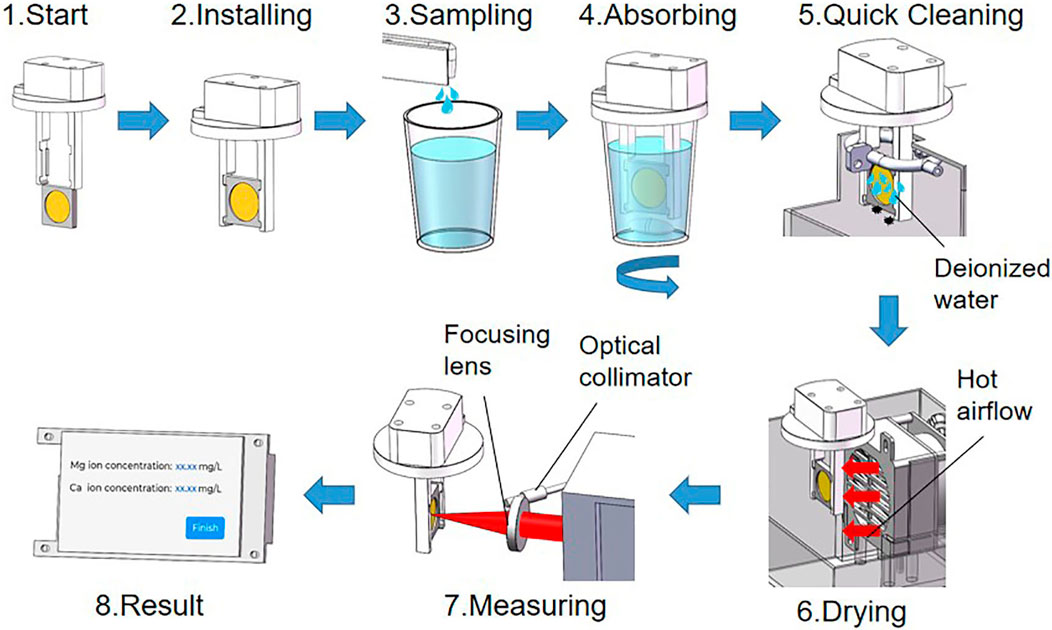
FIGURE 2. Workflow of the system.
The LIBS measuring system, as shown in Figure 1, mainly included a laser, spectrometer and control board. The laser source was a diode pumped solid state laser (LD201B, Lemeng Company, China) with wavelength 1,064 nm, maximum output energy 50 mJ, pulse width 8 ns, and repetition rate 1 Hz. The spectrometer was a USB2000 + fiber optic spectrometer (Ocean Optics, America), which had a spectral response range of 200–1,100 nm, spectral resolution of 0.2 nm, and signal to noise ratio 250:1. In order to obtain the best spectral, the laser energy was set to 50 mJ, the spectrometer CCD integration gate width was set to 1 ms and the detector sampling delay was set to 1 us. The LIBS system worked in paraxial mode, the laser focused on the CEM surface through a focusing lens, and the optic lens collected laser plasma emission spectra from the 45 °direction. The focal length of the laser focusing lens is 30 mm. For the collection of laser plasma, we installed an optical collimator at one end of the optical fiber, and the other end of the optical fiber was connected to the spectrometer. The spectral intensity of each sample was obtained by averaging five spectra collected at different positions on the CEM surface. The position switching was realized by a stepper motor to control the CEM vertical movement in the laser focal plane position.
3 Results and discussion
3.1 LIBS characteristic spectra for Ca and Mg
First, we used the device to detect Ca2+ and Mg2+ in solution and the spectrums are shown in Figure 3. According to the NIST spectrum library, Ca II 393.3 nm and Mg II 279.5 nm were selected for the characteristic peak of Ca and Mg for further analysis. Figure 3 showed that no spectral signal of Ca2+ and Mg2+ elements could be observed on blank CEM. However, when CEM was used for Ca2+ and Mg2+ elements detection, there was no spectral interference near the characteristic peak of Ca and Mg elements. Consequently, it was feasible to use CEM combined with LIBS for Ca and Mg ions determination in solution.
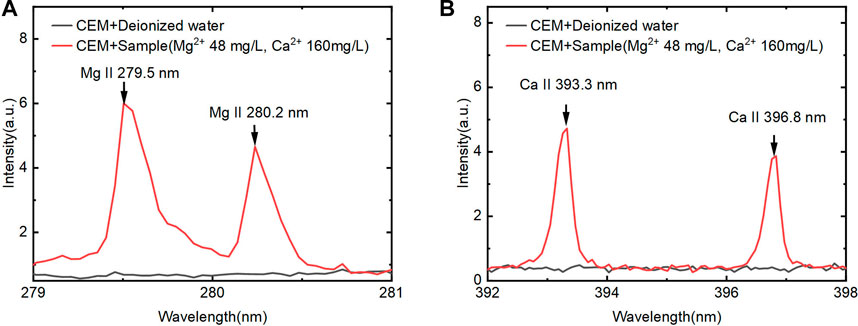
FIGURE 3. Characteristic spectral lines for element (A) Mg. (B) Ca.
3.2 Experimental parameter optimization
The ion extraction of CEM in solution was affected by many factors, including the CEM dosage (size), solution volume, ion concentration, stirring speed and time. In this study, the sample volume was set to 20 mL and CEM size was 3 cm2. In order to achieve optimal working condition, we mainly investigated the effects of magnetic stirring speed and adsorption time on spectral signals. As shown in Figure 4, the spectral intensity of Mg2+ and Ca2+ increased first and then slowly decreased with the stirring speed increased. It indicated that within a certain range of magnetic stirring speed, high speed led to high exchange efficiency between ions on CEM surface and in solution. However, when the magnetic stirring speed exceeded the range, the exchange efficiency reduced. The reason was that excessive speed led to unstable ion exchange reaction and there was not enough time for Ca2+ and Mg2+ formatting stable chemical bonding with CEM matrix. The inadequate reaction also led to weak spectral intensity. Based on above, we chose the magnetic stirring speed of 600 rpm to get good spectrum.
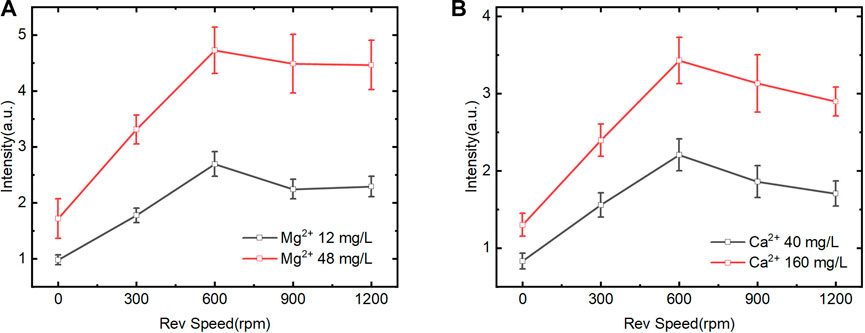
FIGURE 4. Effect of magnetic stirring speed on LIBS spectral intensity of Mg2+ and Ca2+ (CEM exchange at 3 min) (A). Mg2+ on spectral intensity of Mg II 279.5 nm. (B). Ca2+ on spectral intensity of Ca II 393.3 nm.
We further investigated the effect of time on spectral intensity. Figure 5 shows that the spectral intensity of Mg2+ and Ca2+ increased at first and then stabilized gradually with time. It illustrates that the reaction between the exchange group of CEM and the Mg2+ and Ca2+ in the solution progressed gradually from a rapid reaction to a dynamic equilibrium state. Moreover, the exchange efficiency of Mg2+ in different concentrations kept stable from 1–3 min and 3–6 min. In contrast, the CEM exchange efficiency of Ca2+ with different concentrations was high from 1 to 3 min and gradually decreased after 3 min. Within 3–6 min, the Ca2+ exchange reaction rate decreased and was in the transition stage from rapid exchange to exchange equilibrium. After 6 min, the ion exchange reaction reached equilibrium and the spectral intensity kept in a certain range. To achieve quantitative analysis, 3 min was selected as the adsorption time for rapid determination. This time point was in the linear range of ion exchange reaction and the CEM could be prevented from reaching adsorption saturation state at the same time.
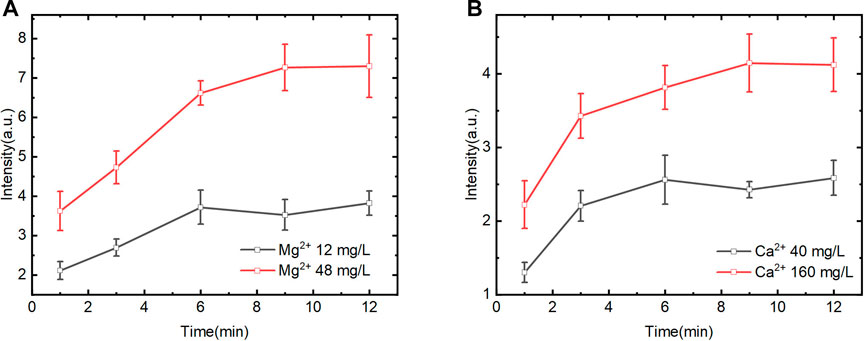
FIGURE 5. Effect of different exchange time on LIBS spectral intensity of Mg2+ and Ca2+ (magnetic stirring speed of 600rpm) (A). Mg2+ on spectral intensity of Mg II 279.5 nm. (B). Ca2+ on spectral intensity of Ca II 393.3 nm.
3.3 Calibration curve construction for element Mg and Ca
Aiming to verify the detection ability of the automatic device for Ca and Mg in solution, the quantification model was established using characteristic spectral lines of Mg II at 279.5 nm and Ca II at 393.6 nm with C I 247.8 nm as the internal standard. The spectrums and calibration curves are shown in Figure 6. The spectral intensity increased with the increase of the Mg2+ and Ca2+ concentrations, but the trend is nonlinear. Inflection points turn out at Mg 5 mg/L and Ca 20 mg/L, and the whole range can be divided into two parts, in which the signal intensity shows linear variety with the concentration gradient change separately. Moreover, the slope in the low concentration part (Mg2+ 0–5 mg/L and Ca2+ 0–20 mg/L) is obviously high than that in high concentration. The reason might be that the ion exchange speed was high in high concentration difference between target ions and exchange groups in the CEM matrix under certain setup parameters including stirring speed and time. Meanwhile, the other part of the curve also shows linear after the inflection point and does not appear nonlinear caused by the self-adsorption effect.
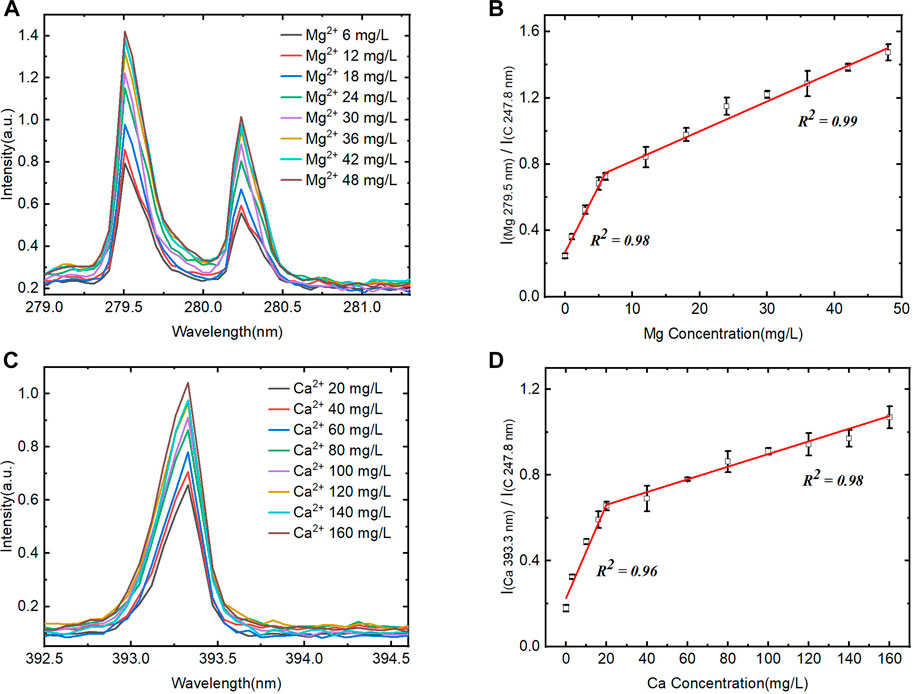
FIGURE 6. Quantification of the system for Mg2+ and Ca2+ detection. (A) and (B) Averaged LIBS spectra for different concentration of Mg2+ and the corresponding calibration curve (0–48 mg/L). (C) and (D) Averaged LIBS spectra for different concentration of Ca2+ and the corresponding calibration curve (0–160 mg/L).
In the calibration curve, the signal intensity is not zero when the Ca2+ and Mg2+ analyte concentrations are zero, which is probably due to the interference of other element lines emitted close to the wavelength. Meanwhile, in the real water sample, the emitted lines intensity of Ca and Mg are much higher than that of interferential element on the CEM matrix, so it does not represent to be a problem for real sample quantitative analysis. Moreover, the purpose of the device and method is to meet the detection needs of Ca2+ and Mg2+ concentrations in the real water sample, and their concentrations are mainly in the linear range of the second part of the calibration curve. Therefore, we choose the second part of the calibration curve for quantitative analysis, and the correlation coefficient R2 for Mg is 0.99 and Ca is 0.98.
We also investigated a new definition for the LOD of a given element in a univariate calibration. We used the linear part of the calibration curve at low concentrations to calculate the LOD by Eqs 1, 2, [42]. The LOD of Mg is 1.63 mg/L and that of Ca is 3.62 mg/L. Then, in the second part of the calibration curve, root-mean-square error (RMSE) was calculated using Eq. 3, and more detailed parameters of the quantitative model are shown in Table.1. Furthermore, we verified the prediction ability of the established mode by calculating the standard recovery rate of samples with and without interfering cations. The results are shown in Table 2. The results demonstrate that the device is applicable for the automatic rapid detection of Mg2+ and Ca2+ in solution.
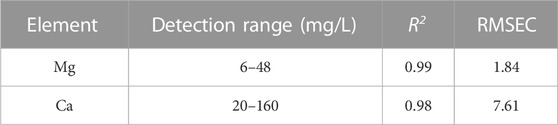
TABLE 1. Parameters of the quantitative model.
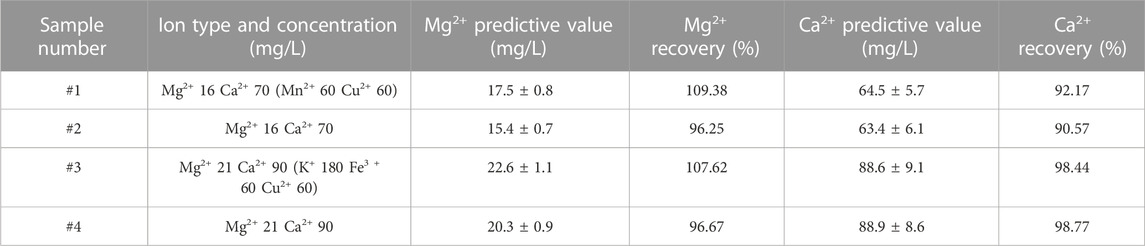
TABLE 2. Determination of Ca2+ and Mg2+ in spiked samples with and without interfering ions.
In Eqs 1, 2, N represents the number of points in the calibration curve, b is the slope of calibration curve.
In Equation 3, n is the number of points in the calibration curve.
4 Conclusion
In this study, an automatic and rapid system for measuring calcium and magnesium in water was developed based on LIBS. The system realized the automation of the detection process through integration of sampling, elements adsorption, attachment moving, and spectrum detection. The system also achieved automatic enrichment and spectral measurement of calcium and magnesium in water within 5 min. Moreover, we analyzed the quantitative ability of this system for Ca and Mg elements. The results showed that there was a good linear relationship between spectrum intensity and concentration of the two elements. In general, a rapid measuring system for calcium and magnesium in water based on LIBS technology is proposed. Errors introduced by manual operation were significantly reduced through establishing standard sample operating process. Furthermore, the combination of LIBS rapid detecting technique and an automatic control system is expected to provide equipment and technology support for Ca and Mg detection in water bodies under large-scale production modes, such as aquaculture and factory farming.
Data availability statement
The raw data supporting the conclusion of this article will be made available by the authors, without undue reservation.
Author contributions
YZ was responsible for the design of the device, the implementation of the experiment, and the visualization of the experimental data. SM wrote the draft and analyzes the experimental data. GY contributed to the analysis of experimental data, experimental implementation and supervision. HT conceived the experimental ideas, proposed the experimental methods, wrote the draft, and modified the final manuscript. DD provided financial support and process supervision. All authors contributed to the article and approved the submitted version.
Funding
This research was financially supported by National Natural Science Foundation of China (32171627), Distinguished Scientist Development Program of Beijing Academy of Agriculture and Forestry Sciences (JKZX202209) and National Agricultural Major Science and Technology Project of China (NK2022180102).
Acknowledgments
We thank Alison McGonagle, from Liwen Bianji (Edanz) (www.liwenbianji.cn), for editing the English text of a draft of this manuscript.
Conflict of interest
The authors declare that the research was conducted in the absence of any commercial or financial relationships that could be construed as a potential conflict of interest.
Publisher’s note
All claims expressed in this article are solely those of the authors and do not necessarily represent those of their affiliated organizations, or those of the publisher, the editors and the reviewers. Any product that may be evaluated in this article, or claim that may be made by its manufacturer, is not guaranteed or endorsed by the publisher.
References
1. Kozisek F. Regulations for calcium, magnesium or hardness in drinking water in the European Union member states. Regul Toxicol Pharmacol (2020) 112:104589. doi:10.1016/j.yrtph.2020.104589
2. Liang W, Wang X, Zhang X, Niu L, Wang J, Wang X, et al. Water quality criteria and ecological risk assessment of lead (Pb) in China considering the total hardness of surface water: A national-scale study. Sci Total Environ (2023) 858:159554. doi:10.1016/j.scitotenv.2022.159554
3. Lopes RH, Silva C, Salvador P, Silva ID, Heller L, Uchoa SAD. Surveillance of drinking water quality worldwide: Scoping review protocol. Int J Environ Res Public Health (2022) 19(15):8989. doi:10.3390/ijerph19158989
4. Monarca S, Donato F, Zerbini I, Calderon RL, Craun GF. Review of epidemiological studies on drinking water hardness and cardiovascular diseases. Eur J Cardiovasc Prev Rehabil (2006) 13(4):495–506. doi:10.1097/01.hjr.0000214608.99113.5c
5. Sathyanarayan SR, Warke VG, Mahajan GB, Annapure US. Soil free nutrient availability to plants. J Plant Nutr (2022) 46(5):801–14. doi:10.1080/01904167.2022.2071736
6. Savvas D, Gruda N. Application of soilless culture technologies in the modern greenhouse industry – a review. Eur J Hortic Sci (2018) 83(5):280–93. doi:10.17660/eJHS.2018/83.5.2
7. Langenfeld NJ, Pinto DF, Faust JE, Heins R, Bugbee B. Principles of nutrient and water management for indoor agriculture. Sustainability (2022) 14(16):10204. doi:10.3390/su141610204
8. Banerjee P, Prasad B. Determination of concentration of total sodium and potassium in surface and ground water using a flame photometer. APPLIED WATER SCIENCE (2020) 10(5):113. doi:10.1007/s13201-020-01188-1
9. Ferreira SLC, Bezerra MA, Santos AS, dos Santos WNL, Novaes CG, de Oliveira OMC, et al. Atomic absorption spectrometry - a multi element Technique. Trac Trends Anal Chem (2018) 100:1–6. doi:10.1016/j.trac.2017.12.012
10. Manousi N, Deliyanni E, Zachariadis G. Multi-element determination of toxic and nutrient elements by ICP-aes after dispersive solid-phase extraction with modified graphene oxide. Appl Sci (2020) 10(23):8722. doi:10.3390/app10238722
11. Wilschefski SC, Baxter MR. Inductively coupled plasma mass spectrometry: Introduction to analytical aspects. Clin Biochem Rev (2019) 40(3):115–33. doi:10.33176/AACB-19-00024
12. Sequeira MD, Castilho A, Tavares AO, Dinis P. The rural fires of 2017 and their influences on water quality: An assessment of causes and effects. Int J Environ Res Public Health (2023) 20(1):32. doi:10.3390/ijerph20010032
13. Edeki PE, Isah EC, Mokogwu N. Assessment of physicochemical and bacteriological quality of drinking water in Sapele local government area of Delta State, South-South, Nigeria. J Water Health (2023) 21:286–98. doi:10.2166/wh.2023.246
14. Lin J-Y, Tsai H-L, Lyu W-H. An integrated wireless multi-sensor system for monitoring the water quality of aquaculture. Sensors (2021) 21(24):8179. doi:10.3390/s21248179
15. Krishnakartik M, Satyaveni S, Machiraju PVS. Serological response to SARS-CoV-2 vaccination in multiple sclerosis patients treated with fingolimod or ocrelizumab: An initial real-life experience. Int J Environ Anal Chem (2022) 102(1):39–43. doi:10.1007/s00415-021-10663-x
16. Radziemski L, Cremers D. A brief history of laser-induced breakdown spectroscopy: From the concept of atoms to LIBS 2012. Spectrochimica Acta B: At Spectrosc (2013) 87:3–10. doi:10.1016/j.sab.2013.05.013
17. Evans EH, Pisonero J, Smith CM, Taylor RN. Atomic spectrometry update: Review of advances in atomic spectrometry and related techniques. J Anal At Spectrom (2020) 35(5):830–51. doi:10.1039/d0ja90015j
18. Guo Z, Chen P, Yosri N, Chen Q, Elseedi HR, Zou X, et al. Detection of heavy metals in food and agricultural products by surface-enhanced raman spectroscopy. Food Rev Int (2023) 39 (3):1440–61. doi:10.1080/87559129.2021.1934005
19. Huang G, Ming YL, Shi W, Chen X, Chen X. Using one-class autoencoder for adulteration detection of milk powder by infrared spectrum. Food Chem (2022) 372:131219. doi:10.1016/j.foodchem.2021.131219
20. Chen R, Huang H, Yu Y, Ren J, Wang P, Zhao H, et al. Rapid detection of multi-QR codes based on multistage stepwise discrimination and a compressed mobilenet. IEEE Internet Things J (2023):1–1. doi:10.1109/JIOT.2023.3268636
21. Yan Y, Ren J, Zhao H, Windmill JFC, Ijomah W, De Wit J, et al. Non-destructive testing of composite fiber materials with hyperspectral imaging—evaluative studies in the EU H2020 fibreEUse project. IEEE Trans Instrum Meas (2022) 71:1–13. doi:10.48550/arXiv.2111.03443
22. Senesi GS, Harmon RS, Hark RR. Field-portable and handheld laser-induced breakdown spectroscopy: historical review, current status and future prospects. Spectrochimica Acta Part B: At Spectrosc (2021) 175:106013. doi:10.1016/j.sab.2020.106013
23. Zhang Y, Zhang T, Li H. Application of laser-induced breakdown spectroscopy (LIBS) in environmental monitoring. Spectrochim Acta B (2021) 1:106218. doi:10.1016/j.sab.2021.106218
24. Botto A, Campanella B, Legnaioli S, Lezzerini M, Lorenzetti G, Pagnotta S, et al. Applications of laser-induced breakdown spectroscopy in cultural heritage and archaeology: A critical review. J cAnal At Spectrom (2019) 34(1):81–103. doi:10.1039/c8ja00319j
25. Li Q, Zhang W, Tang Z, Zhou R, Yan J, Zhu C, et al. Determination of uranium in ores using laser-induced breakdown spectroscopy combined with laser-induced fluorescence. J Anal Spectrom (2020) 35(3):626–31. doi:10.1039/C9JA00433E
26. Legnaioli S, Campanella B, Poggialini F, Pagnotta S, Harith MA, Abdel-Salam ZA, et al. Industrial applications of laser-induced breakdown spectroscopy: A review. Anal Methods (2020) 12(8):1014–29. doi:10.1039/c9ay02728a
27. Sheta S, Afgan MS, Hou ZY, Yao SC, Zhang L, Li Z, et al. Coal analysis by laser-induced breakdown spectroscopy: A tutorial review. J Anal At Spectrom (2019) 34(6):1047–82. doi:10.1039/c9ja00016j
28. Markiewicz-Keszycka M, Cama-Moncunill X, Casado-Gavalda MP, Dixit Y, Cama-Moncunill R, Cullen PJ, et al. Laser-induced breakdown spectroscopy (LIBS) for food analysis: A review. Trends Food Sci Tech (2017) 65:80–93. doi:10.1016/j.tifs.2017.05.005
29. gSingh J, Kumar R, Awasthi S, Singh V, Rai AK. Laser induced breakdown spectroscopy: A rapid tool for the identification and quantification of minerals in cucurbit seeds. Food Chem (2017) 221:1778–83. doi:10.1016/j.foodchem.2016.10.104
30. Moon Y, Han JH, hee CJ, Shin S, Kim YC, Jeong S. Mapping of cutaneous melanoma by femtosecond laser-induced breakdown spectroscopy. JBO (2018) 24(3):031011. doi:10.1117/1.JBO.24.3.031011
31. Gaudiuso R, Melikechi N, Abdel-Salam ZA, Harith MA, Palleschi V, Motto-Ros V, et al. Laser-induced breakdown spectroscopy for human and animal health: A review. Spectrochim Acta B (2019) 152:123–48. doi:10.1016/j.sab.2018.11.006
32. Harmon RS, Senesi GS. Laser-Induced Breakdown Spectroscopy - a geochemical tool for the 21st century. Appl Geochem (2021) 128:104929. doi:10.1016/j.apgeochem.2021.104929
33. Meneses-Nava MA, Rosas-Roman I, Barbosa-García O, Rodriguez M, Maldonado JL. Stability evaluation of water droplets levitated by a TinyLev acoustic levitator for laser induced breakdown spectroscopy. Spectrochim Acta B (2020) 168(1):105855. doi:10.1016/j.sab.2020.105855
34. Maji S, Kumar S, Sundararajan K. Enhanced laser induced breakdown spectroscopy signal intensity in colloids: An application for estimation of Cu and Cr in aqueous solution. Spectrochim Acta B (2021) 175:106010. doi:10.1016/j.sab.2020.106010
35. Ripoll L, Hidalgo M. Electrospray deposition followed by laser-induced breakdown spectroscopy (ESD-LIBS): A new method for trace elemental analysis of aqueous samples. J Anal At Spectrom (2019) 34(10):2016–26. doi:10.1039/c9ja00145j
36. Papai R, Sato RH, Nunes LC, Krug FJ, Gaubeur I. Melted paraffin wax as an innovative liquid and solid extractant for elemental analysis by laser-induced breakdown spectroscopy. Anal Chem (2017) 89(5):2807–15. doi:10.1021/acs.analchem.6b03766
37. Ruiz FJ, Ripoll L, Hidalgo M, Canals A. Dispersive micro solid-phase extraction (DµSPE) with graphene oxide as adsorbent for sensitive elemental analysis of aqueous samples by laser induced breakdown spectroscopy (LIBS). Talanta (2019) 191:162–70. doi:10.1016/j.talanta.2018.08.044
38. Fazio E, Gokce B, De Giacomo A, Meneghetti M, Compagnini G, Tommasini M, et al. Nanoparticles engineering by pulsed laser ablation in liquids: Concepts and applications. Nanomaterials (2020) 10(11):2317. doi:10.3390/nano10112317
39. Dell'Aglio M, Alrifai R, Giacomo A. Nanoparticle enhanced laser induced breakdown spectroscopy (NELIBS), a first review. Spectrochim Acta B (2018) 148:105–12. doi:10.1016/j.sab.2018.06.008
40. Papai R, da Silva Mariano C, Pereira CV, Ferreira da Costa PV, de Oliveira Leme F, Nomura CS, et al. Matte photographic paper as a low-cost material for metal ion retention and elemental measurements with laser-induced breakdown spectroscopy. Talanta (2019) 205:120167. doi:10.1016/j.talanta.2019.120167
41. Liu X, Liu J, Lin Q, Liao W, Yang T, Qian C, et al. Nanoparticle-assisted metal-organic framework (MOF) enhanced laser-induced breakdown spectroscopy for the detection of heavy metal ions in liquid samples. J Anal At Spectrom (2021) 36(10):2173–84. doi:10.1039/d1ja00182e
Keywords: laser-induced breakdown spectroscopy (LIBS), automatic detecting system, water hardness, cation exchange membrane (CEM), precise control
Citation: Zhu Y, Ma S, Yang G, Tian H and Dong D (2023) Rapid automatic detection of water Ca, Mg elements using laser-induced breakdown spectroscopy. Front. Phys. 11:1179574. doi: 10.3389/fphy.2023.1179574
Received: 04 March 2023; Accepted: 31 May 2023;
Published: 09 June 2023.
Edited by:
Jinchang Ren, Robert Gordon University, United KingdomReviewed by:
Guanghui Niu, ETH Zürich, SwitzerlandVincenzo Palleschi, National Research Council (CNR), Italy
Copyright © 2023 Zhu, Ma, Yang, Tian and Dong. This is an open-access article distributed under the terms of the Creative Commons Attribution License (CC BY). The use, distribution or reproduction in other forums is permitted, provided the original author(s) and the copyright owner(s) are credited and that the original publication in this journal is cited, in accordance with accepted academic practice. No use, distribution or reproduction is permitted which does not comply with these terms.
*Correspondence: Hongwu Tian, tianhw@nercita.org.cn, miketian007@163.com