
- 1 Department of Physics and BIOtech, University of Trento, Trento, Italy
- 2 Department of Technologies for Health, Galeazzi Orthopaedic Institute, University of Milan, Milan, Italy
The physiological mechanisms related to cardio-vascular (CV), cardio-pulmonary (CP), and vasculo-pulmonary (VP) regulation may be probed through multivariate time series analysis tools. This study applied an information domain approach for the evaluation of non-linear causality to the beat-to-beat variability series of heart period (t), systolic arterial pressure (s), and respiration (r) measured during tilt testing and paced breathing (PB) protocols. The approach quantifies the causal coupling from the series i to the series j (Cij) as the amount of information flowing from i to j. A measure of directionality is also obtained as the difference between two reciprocal causal couplings (Di,j = Cij − Cji). Significant causal coupling and directionality were detected respectively when the median of Cij over subjects was positive (Cij > 0), and when Di,j was statistically different from zero (Di,j > 0 or Di,j < 0). The method was applied on t, s, and r series measured in 15 healthy subjects (22–32 years, 8 males) in the supine (su) and upright (up) positions, and in further 15 subjects (21–29 years, 7 males) during spontaneous (sp) and paced (pa) breathing. In the control condition (su, sp), a significant causal coupling was observed for Crs, Crt, Cst, and Cts, and significant directionality was present only from r to t (Dr,t > 0). During head-up tilt (up, sp), Crs was preserved, Crt decreased to zero median, and Cst and Cts increased significantly; directionality vanished between r and t (Dr,t = 0) and raised from s to t (Ds,t > 0). During PB (su, pa), Crs increased significantly, Crt and Cts were preserved, and Cst decreased to zero median; directionality was preserved from r to t (Dr,t > 0), and raised from r to s (Dr,s > 0). These results suggest that the approach may reflect modifications of CV, CP, and VP mechanisms consequent to altered physiological conditions, such as the baroreflex engagement and the dampening of respiratory sinus arrhythmia induced by tilt, or the respiratory driving on arterial pressure induced by PB. Thus, it could be suggested as a tool for the non-invasive monitoring of CV and cardiorespiratory control systems in normal and impaired conditions.
Introduction
The heart period (HP), measured from the ECG as the duration of the temporal interval occurring between two consecutive R waves in the ECG (RR interval), and the systolic arterial pressure (SAP), measured from the arterial pressure signal as the maximum pressure value following each R wave (Figure 1A), exhibit spontaneous beat-to-beat fluctuations around their mean value, which are clearly visible in time series recordings of few hundred beats (Figures 1B–D). These fluctuations, generally known as cardio-vascular (CV) variability, are the result of the complex interplay of several physiological mechanisms (Malpas, 2002). It is indeed well known that HP and SAP interact in a closed-loop: HP changes affect SAP variations according to Starling law and arterial Windkessel, while, in turn, SAP changes are sensed by baroreceptors and induce corresponding HP variations through the baroreflex (Baselli et al., 1988; Saul et al., 1991; Taylor and Eckberg, 1996; Mullen et al., 1997; Nollo et al., 2005; Porta et al., 2011b). Besides the reciprocal regulation of HP and SAP, CV variability is continually perturbed by the respiratory activity, in accordance with a number of mechanisms including mechanical effects on intrathoracic pressure and stroke volume (Toska and Eriksen, 1993), Bainbridge reflex (Jones, 1962), and inhibition of central vagal outflow by respiratory neuron firing (Gilbey et al., 1984). As the interaction and/or competition among all these mechanisms is solicited by experimental maneuvers and is altered in the presence of CV diseases, the joint analysis of HP, SAP, and respiratory flow (RF) variability series is widely exploited to non-invasively assess CV, cardio-pulmonary (CP), and vasculo-pulmonary (VP) regulations.
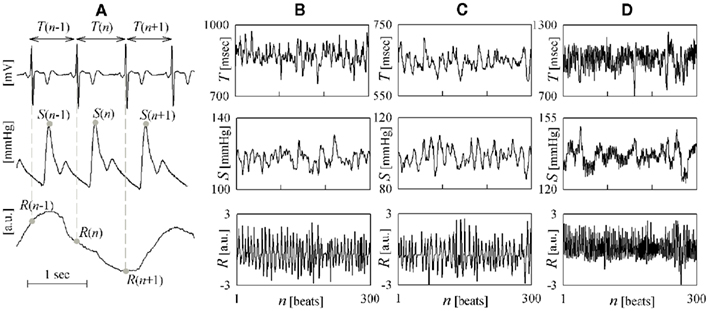
Figure 1. Illustrative example of time series measurement and visualization. (A) Measurement of heart period (T), systolic arterial pressure (S) and respiration (R) variability series from the ECG, arterial blood pressure, and respiratory flow signals; consecutive R waves, representing early depolarization of the ventricles, correspond to the sharp positive deflections of the ECG. Representative examples of the three measured time series are reported for a subject breathing spontaneously in the supine position (B) and in the upright position (C), and undergoing paced breathing in the supine position (D).
Indeed, a variety of time series analysis methods have been proposed in the last decades to quantify CV and cardiorespiratory interactions through the study of simultaneously measured HP, SAP, and RF spontaneous variability. While classical approaches were used to detect the presence of an interaction and quantify its strength, e.g., by means of linear coherence or non-linear coupling measures (De Boer et al., 1985; Taylor and Eckberg, 1996; Hoyer et al., 1998; Pompe et al., 1998; Cooke et al., 1999; Baumert et al., 2005; Bai et al., 2008; Suhrbier et al., 2010; Kabir et al., 2011), recent developments aimed to infer the causal direction along which a given interaction occurs. The assessment of causality in CV, CP, and VP interactions is relevant because it suggests which is the mechanism governing the interaction under analysis. A common approach to quantify the causal coupling between two variability series is the causal coherence (Porta et al., 2002), which quantifies causality from the frequency domain representation of a linear parametric bivariate model fitted to the two considered series. This method has been exploited to study causality between HP and SAP in physiological and impaired conditions (Nollo et al., 2005; Faes et al., 2006). It has been also extended to multivariate models including respiration for the contemporaneous assessment of CV and CP causal couplings both in the time domain (Porta et al., 2011a) and – following the introduction of partial directed coherence (Baccalà and Sameshima, 2001) – even in the frequency domain (Faes and Nollo, 2010). Linear time series analysis methods are well suited for the study of CV, CP, and VP interactions because they lend themselves to spectral representation, so that coupling and causality can be assessed for specific rhythms such as Mayer waves and respiratory frequency oscillations. Notwithstanding this, non-linear approaches are often desired as they may account better than linear methods for the high number and complexity of the mechanisms underlying CV and cardiorespiratory variability. The evaluation of non-linear causal coupling between cardiac, vascular, and respiratory time series has been performed in the past according to approaches based on phase synchronization (Rosenblum et al., 2002), non-linear prediction (Faes and Nollo, 2006; Faes et al., 2008b), non-linear model identification (Faes et al., 2008a; Riedl et al., 2010), symbolic coupling traces (Wessel et al., 2009; Suhrbier et al., 2010), and information theory (Porta et al., 1999; Palus et al., 2004). Among others, methods based on information theory constitute a valid, model-free approach to quantify non-linear causality based on the information amount transferred from one series to the other. In particular, information theoretic tools based on conditional entropy (CE) estimation have been framed in the so-called information domain (Porta et al., 2000b), and have been exploited to detect causal information transfers in the CV loop in a variety of physiological conditions (Nollo et al., 2002; Faes et al., 2011b; Porta et al., 2011b).
A major issue with the approaches to non-linear causality listed above stands in the fact that their application to CV and cardiorespiratory interactions has been limited so far to bivariate analysis involving only two of the available variability series. When more than two variables are expected to contribute to the dynamics under investigation, time series may be linked to each other in a direct or indirect manner. In this case, the use of bivariate analysis to assess causality between two of the series may be misleading. For example, one series may falsely appear to cause another if they are both influenced by a third series but with different delays. This situation is likely occurring in CP and VP analysis, where respiration acts as an exogenous input on both HP and SAP variability. Therefore, there is the need to extend traditional bivariate approaches to multivariate time series analysis able to settle issues of false causalities. In the frame of information theory, such an extension of is not a trivial task because it is hindered by practical aspects like the bias in CE estimation, or the issues of arbitrariness and redundancy related to the choice of the analysis parameters (Vakorin et al., 2009; Angelini et al., 2010; Faes et al., 2011a). To circumvent these problems, we have recently proposed an approach for estimating in the information domain the non-linear causal coupling between two series taken from a multivariate data set (Faes et al., 2011a). The approach, which combines an objective and non-redundant procedure for the selection of the analysis parameters with an efficient estimation of the CE (Porta et al., 1998, 1999), has been validated on several simulation schemes and tested on representative multivariate physiological time series. In the present study, it is exploited to assess the causal coupling between cardiac, vascular, and respiratory variability series in physiological conditions. To this end, HP, SAP, and RF series were measured in a group of healthy subjects during two protocols able to solicit CV, CP, and VP regulatory systems, i.e., tilt testing and paced breathing (PB). The subsequent analysis allowed us to describe the physiological mechanisms involved in the regulation of cardiac, vascular, and respiratory systems, and to track their alterations consequent to modification of the experimental conditions.
Materials and Methods
Experimental Protocols and Data Analysis
We considered 30 young subjects (25.7 ± 2.7 years old), all normotensive and free from any known disease based on anamnesis and physical examination at the time of the study. Experiments were performed at the Cardiology Unit of the S. Chiara Hospital of Trento, Italy. Informed consent was provided by all subjects, and the experimental protocol was approved by the Ethical Committee of the hospital. Fifteen subjects were assigned to the tilt test (TT) protocol, while the remaining 15 subjects participated to the PB protocol. In both protocols, CV and cardiorespiratory signals were acquired in the morning, in comparably comfortable and quiet ambiance conditions with subjects in sinus rhythm. After a period of 10 min allowed for stabilization of the subjects, signals were acquired for 15 min in the resting supine position with spontaneous breathing. In the TT protocol, head-up tilting of the subjects was then achieved passively using a motorized table, and signals were acquired for further 15 min in the 60° upright position. In the PB protocol, the second part of the experiment consisted in signal acquisition for further 15 min with subjects inhaling and exhaling in time with a metronome acting at 15 cycles per minute (forced respiration at 0.25 Hz).
The acquired signals were the surface ECG (lead II), the finger photoplethysmographic arterial blood pressure (Finapres, Ohmeda), and the respiratory nasal flow (by differential pressure transducer). Signals were collected simultaneously and digitized at 1 kHz sampling rate and 12 bit precision. The beat-to-beat variability series of HP, SAP, and RF were then offline measured respectively as outlined in Figure 1A. Specifically, the n-th cardiac interval was identified from the ECG as the temporal interval occurring between the n-th and the (n + 1)-th R waves, and its duration was taken as the n-th HP and denoted as T(n); the corresponding SAP and RF values, denoted as S(n) and R(n), were measured respectively as the local maximum of the pressure signal inside the n-th cardiac interval, and as the sample of the respiratory tracing taken at the onset of the n-th cardiac interval. This measurement convention allows instantaneous (i.e., non-delayed) effects from S(n) to T(n), as well as from R(n) to S(n) and to T(n). The subsequent data analysis was performed on windows of 300 beats, judged as stationary by visual inspection, taken in the two conditions of each protocol, i.e., supine (su) and upright (up) body positions for the TT protocol, and spontaneous (sp) and paced (pa) respiration for the PB protocol (an example is in Figures 1B–D). For each selected window, the measured series T, S, and R were normalized to zero mean and unit variance prior to the execution of non-linear analyses; for each series, normalization was performed by mean subtraction followed by division to the SD, thus obtaining the dimensionless normalized series t(n), s(n), and r(n), n = 1,…,300.
Analysis of Non-Linear Causal Coupling
The assessment of non-linear causal coupling is performed according to the approach proposed in (Faes et al., 2011a). This approach is grounded on the notion of Granger causality (Granger, 1969), that leads to compute the strength of the directional coupling from one series to another, say from x to y, as the improvement in the ability to describe y yielded by incorporating information from x into the considered descriptive scheme. In this study, time series description is framed in the information domain, and causality is quantified exploiting the concept of CE. The CE quantifies the amount of information carried by a time series, conditioned to the knowledge of a so-called conditioning vector formed by properly chosen samples of the available time series. As such, the CE is a measure inversely related to the ability to describe a series, because it drops to zero when the series is fully described by the assigned conditioning vector. Then, the assessment of causality from x to y is based on computing two times the CE of y, using different conditioning vectors: in the first repetition the conditioning vector includes past samples of y only, in the second repetition it includes past samples of both x and y. The difference between the CE computed at the two repetitions is a measure of causality from x to y, because it quantifies the amount of information carried by y that can be explained exclusively by the past of x. This idea is at the basis of the concept of transfer entropy proposed by Schreiber (2000), and is exploited also in the present study. The novelty of the approach used here, which is presented in detail in the next subsections, stands in the procedures followed to define the conditioning vector and to estimate the CE from time series data (Faes et al., 2011a).
Scheme for conditional entropy computation
Entropy computation presupposes to work in a probabilistic framework where, for instance, p(y(n)) is the probability for the process underlying the measured series y to take the value y(n) at the time instant n. Within this framework, the entropy of the series y, H(y), measures the amount of information carried by its most recent sample, y(n), and is defined as H(y) = −Σ p(y(n))·log p(y(n)) (Porta et al., 1998). Then, to compute the CE we need to determine a conditioning vector formed by properly chosen terms of y and of the other available time series. Here a “term” is a time series point identified with respect to the present time sample n: for instance, y(n) is the current term of y, x(n − 1) is the first past term of x, and so on. Formally, the CE of the series y conditioned to the vector V, H(y|V), is defined as the residual amount of information carried by y(n) when the conditioning vector V is assigned, and is commonly computed as an entropy rate: H(y|V) = H(y(n), V) − H(V).
Since the CE is a measure of the degree of unpredictability of a series when the conditioning vector is known, its interpretation depends on how the conditioning vector is formed. For instance, H(y|V) is a measure of irregularity of y when V is composed exclusively by past terms of y (Porta et al., 1998), while – as shown in the next subsection – H(y|V) can be exploited to assess causality from x to y when V incorporates also past terms of x. In either case, conditioning vectors are traditionally formed according to an uniform scheme whereby all past terms up to a maximum lag are selected simultaneously. However, uniform conditioning introduces issues of arbitrariness and redundancy that are likely to hinder CE estimation in many situations (Faes et al., 2011a). To overcome this limitation, we follow here a conditioning scheme based on a non-uniform, sequential procedure that builds progressively the conditioning vector by selecting, from a properly defined set of initial candidate terms, the terms that optimize the description of the observed series; optimization of the description is intended here as minimization of CE. For the generic series y and set of initial candidate terms Y, the procedure starts with an empty conditioning vector V0 and, at the k-th step, tests all the candidate terms z∈Y computing the entropy of y conditioned to the vector [z, Vk − 1], i.e., H(y|[z, Vk − 1]); among all candidates, the selected term is the one which minimizes the CE, i.e., the updated conditioning vector at step k is Vk = [ź, Vk − 1] such that ź = arg min(H(y|[z, Vk − 1])). As stopping criterion for the conditioning scheme, we chose to terminate the procedure when a minimum of the CE is found, i.e., at the step K such that H(y|VK) > H(y|VK − 1); in non-uniform conditioning, the minimum obtained CE is taken as a measure of the information carried by y when the set of initial candidates is assigned, i.e., H(y|Y) = H(y|VK − 1). We note that the criterion for candidate selection is based on information reduction (i.e., CE minimization after testing all candidates at each step) rather than on temporal ordering. Hence, it may happen that a past term is selected before a more recent term; however, this does not affect the resulting measure, as the joint probabilities used in entropy computation are insensitive to the ordering of components within vector variables.
An example illustrating the difference between uniform and non-uniform conditioning is depicted in Figure 2. If we want to compute the entropy for a generic time series y conditioned to its own past, and we choose to include three terms into the conditioning vector, the uniform scheme simply picks up the terms y(n − 1), y(n − 2), and y(n − 3) to form the conditioning vector Vu = [y(n − 1), y(n − 2), y(n − 3)] (Figure 2A); this vector is then used to compute the CE value H(y|Vu) depicted in Figure 2C (red dashed line). On the contrary, the non-uniform procedure first defines a set of candidate terms [Y = {y(n − 1),…,y(n − 10)} in this example, white circles in Figure 2B], then proceeds iteratively, testing at each step all the terms and selecting the one which minimizes the CE: in the example, the first selected term is y(n − 2), the second is y(n − 6), and the third is y(n − 4); the three CE minimum values obtained progressively using the vectors V1 = [y(n − 2)], V2 = [y(n − 2), y(n − 6)], and V3 = [y(n − 2), y(n − 6), y(n − 4)] are depicted as blue squares in Figure 2C, where the final CE value H(y|Y) = H(y|V3) is also indicated (blue dashed line). Note that the non-uniform procedure reaches a lower CE than the uniform one, indicating a higher capability of describing the time series which comes from the purposeful selection of the candidate terms allowed by the repeated exploration of the whole set of candidates.
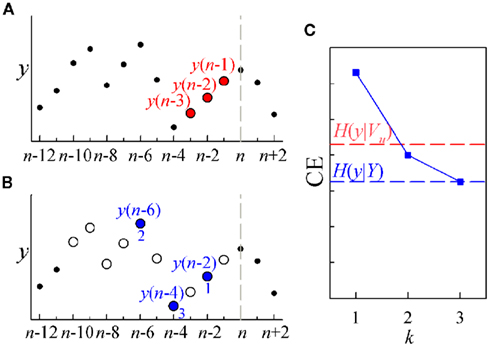
Figure 2. Illustrative example of CE computation for a representative short sequence of a time series y (dots), with overlapped the terms exploited for uniform conditioning [(A), red] and for non-uniform conditioning [(B), blue]; in (B), empty circles denote the set of initial candidate terms, while filled circles denote selected terms, with the number indicating the step k at which selection occurred; the vertical dashed lines mark the current time sample n. (C) CE computed after uniform conditioning [H(y|Vu), red dashed line] and after non-uniform conditioning [H(y|Y), blue dashed line]; the CE computed at each step k of the sequential procedure for non-uniform conditioning is indicated by blue squares.
Conditional entropy-based computation of causal coupling
The assessment of causality between two series taken from a multivariate data set in the information domain is based on performing two times the procedure explained in Section “Scheme for Conditional Entropy Computation,” modifying the conditioning vector used to estimate the CE. Specifically, to assess causality from x to y the procedure is repeated starting from different sets of initial candidates: first, using the set Y1 in which the past samples of the series x are excluded; then, using the set Y2 in which the terms of x are included. The causal coupling from x to y is defined as the normalized difference between the CE minima estimated for the two repetitions of the procedure, i.e., Cx → y = 1 − H(y|Y2)/H(y|Y1). The enlargement of the set of candidates at the second repetition allows the possibility for some terms from x to be included in the conditioning vector describing y. When this happens, the inclusion is interpreted as the existence of causality from x to y; in such a case, the CE decreases compared to the first repetition [H(y|Y2) < H(y|Y1)], and a positive causal coupling Cx → y is measured; in the limit case when the CE decreases to zero, the maximum causal coupling Cx → y = 1 is measured. On the contrary, when no terms from x are selected at the second repetition, the CE is unchanged and Cx → y = 0, indicating the absence of causality. Note that the whole analysis may be performed reversing the roles of the two series, so that the causal coupling from y to x, Cy → x, is estimated. Finally, an index of directionality is defined as the difference of the two causal couplings: Dx,y = Cx → y − Cy → x. With this definition, the directionality index is positive (respectively, negative) when the prevailing causal direction is that from x to y (from y to x).
In this study, the role of the generic series x and y is assumed by two of the available normalized variability series t, s, and r. The sets of initial candidates may include, depending on the specific direction of interaction under analysis, the past values of the normalized HP series, Yt = {t(n − τ),…,t(n − Lτ)}, SAP series, Ys = {s(n − τ),…,s(n − Lτ)}, and RF series, Yr = {r(n − τ),…,r(n − Lτ)}, where L is the number of candidate terms to be included in the initial set for each series (L = 10 in this study). Note that in this application the candidate terms are not immediately subsequent terms of the time series, but are separated in time using a so-called time delay τ; the time delay is introduced to optimize the description of the dynamics of each variable accounting for its peculiar time scale (Small, 2005). In this study, the time delay τ was optimized separately for each series by testing it on the range (1, 20) and taking the lag such that the autocorrelation of the series has first dropped below 1/e (the so-called decorrelation time Small, 2005). Moreover, when appropriate the extended sets  and
and  may be used in place of Yr and Ys as they account for instantaneous causality. Specifically, since the adopted measurement conventions allow for the existence of instantaneous causality from r(n) to s(n) and to t(n), as well as from s(n) to t(n) (see Figure 1A), the extended set
  was used in place of Yr to compute the CE of s and t, while the extended set
  was used in place of Ys to compute the CE of t. With this notation, we define the following indexes of causal coupling and directionality for the VP regulatory loop:
the CP regulatory loop:
and the CV regulatory loop:
Figure 3 reports an illustrative example of estimation of the causal coupling from RF to HP (i.e., from the series r to the series t). In the first repetition of the conditioning procedure (Figure 3A), the series r is excluded from the analysis so that the conditioning vector is formed drawing terms from the set of initial candidates  In the second repetition (Figure 3B), all the three series are used so that the set of initial candidates becomes
  In the representation of Figure 3 we set L = 10, while the optimal time delays for the HP, SAP, and RF series are τt = 2, τs = 3, and τr = 1, respectively. At the first repetition, the terms selected sequentially from Y1 are t(n − 2), s(n − 3), and t(n − 4), then the procedure terminates at the step K = 4 because the CE minimum,
  , is reached at k = 3 (Figure 3C, black). At the second repetition the first selected term is the same as before [i.e., t(n − 2)], but with k = 2 a term from r, r(n), is selected such that a lower CE is estimated; the final conditioning vector is V3 = [t(n − 2), r(n), s(n − 3)] and the corresponding CE minimum,
  is lower than that at the first repetition, so that the resulting causal coupling, Cr → t, is larger than zero.
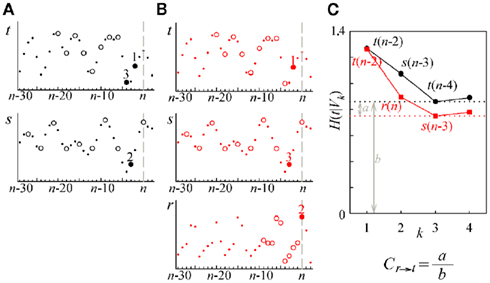
Figure 3. Illustrative example of estimation of causal coupling from respiratory flow to heart period time series. (A,B) Representative short sequences of the three series t, s, and r (dots), plotted together with the sets of initial candidate terms (circles, separated to each other by the lag τ peculiar of each series) for the first repetition (A) and the second repetition (B) of the conditioning scheme followed to estimate the causal coupling from r to t; filled circles denote the selected terms, with the number indicating the step k at which selection occurred; the vertical dashed lines mark the current time sample n. (C) Conditional Entropy computed for the first (black) and second (red) repetitions of the conditioning procedure; the candidate components selected at each step of the procedure are indicated in the plot; horizontal dashed lines mark the resulting entropies  and
and  which, combined as in Eq. 2a, yield the causal coupling Cr → t.
Estimation of conditional entropy
The implementation of the procedure described above for quantifying non-linear causal coupling requires estimation of the CE from time series of finite length, which in turn relies on estimation of entropy for any vector V composed of terms of the analyzed time series (see Scheme for Conditional Entropy Computation). In this study we adopted the estimation strategy proposed in (Porta et al., 1998, 1999), which is based on performing uniform quantization of the available time series to estimate CE in terms of entropy rate, and then on introducing a corrective term to compensate the estimation bias due to shortness of the analyzed time series.
Specifically, each normalized series was coarse grained spreading its dynamics over Q quantization levels, so that a symbol in the range 1,…,Q is associated with each sample. For an assigned vector of k terms, uniform quantization corresponds to partitioning the k-dimensional space, into which the terms may take values, in Qk disjoint hypercubes, such that all vectors falling within the same hypercube are considered as undistinguishable to each other. Once the partition is assigned, entropies may be computed approximating the probabilities with their frequency of occurrence within the hypercubes. In order for this approximation to hold reasonably, a relation should exist between the number of quantization levels Q and the number of time series point N such that N ≈ Qk (Porta et al., 1998). Therefore, we chose Q = 6 in this study where N = 300 and the length of the conditioning vectors, k, is typically equal to 3 or 4. The strategy for CE estimation is illustrated in the example of Figure 4, which makes reference to the estimation of the CE of the series t conditioned to the vector V2 = [t(n − 2), s(n − 3)] [Figure 3A and H(t|V2) in Figure 3C]. Figure 4A refers to the estimation of the entropy H(V2), where the range of all possible values for the past terms t(n − 2) and s(n − 3) is quantized in Q = 6 levels and then entropy is estimated extending the summation to all hypercubes (which have square form in this case with k = 2). In Figure 4B the dimensionality of the space is increased as a consequence of considering the present term t(n), and entropy is computed again. Finally, the CE results as the information increase.
Figure 4. Example of space partitioning for CE computation at the step k = 2 of Figure 3A (first repetition of the procedure). (A) To compute H(V2), all values assumed by the vector V2 = [t(n − 2), s(n − 3)] are assigned to hypercubes resulting from uniform quantization of the two coordinates (gray grid); then, the entropy is computed as H(V2) = −Σp(V2)·logp(V2). (B) The analysis is repeated for all values assumed by the vector [t(n), V2] = [t(n), t(n − 2), s(n − 3)] to compute H(t(n), V2) = −Σp(t(n), V2)·logp(t(n), V2). In both cases, the probability p is estimated for an hypercube as the frequency of occurrence of the points inside each hypercube. Then, the CE is measured as H(t|V2) = H(t(n), V2) − H(V2). The corrected CE is finally computed as Hc(t|V2) = H(t|V2) + n(V2)H(t(n)), where n(V2) is the fraction of V2 values found alone into a hypercube in panel (A) (gray squares, n(V2) = 4/47 in this example). Note that single points in (A) remain always single also in the higher dimensional space in (B), while other single points may arise in (B) (black squares).
A problem with CE estimation consists in the bias due to bad estimation of probabilities in high dimensional spaces and short time series (Porta et al., 1999; Faes et al., 2011a). This bias affects causality estimates, and prevents from reaching a CE minimum to be used as stopping criterion for the sequential procedure of candidate selection. The effect is due to the fact that, letting k increase, an increasing number of vectors V will be found alone within an hypercube of the k-dimensional space (gray squares in the example of Figure 4A). As a consequence, the corresponding vectors [y(n), V] will be also alone inside an hypercube of the (k + 1)-dimensional space (gray squares in Figure 4B), and therefore their contribution to the CE will be null. To counteract this bias, we use the corrected CE defined as (Porta et al., 1999; Faes et al., 2011a): Hc(y|V) = H(y|V) + n(V)·H(y(n)), where n(V) is the fraction of values for V that fall alone inside a hypercube. With the correction, in the presence of a single point inside a hypercube, its null contribution is substituted with the maximal information amount carried by a white noise with the same amplitude distribution of the observed series y [i.e., H(y(n))].
Statistical Analysis
We performed the Kolmogorov–Smirnov normality test for each distribution of causal coupling index C and directionality index D obtained for the various pairs of series in the various experimental conditions. If normality was verified, a paired Student’s t-test was used to check the significance of differences of C and D between experimental conditions (su vs. up for the TT protocol, or sp vs. pa for the PB protocol). The Student’s t-test was used also to assess the significance of the directionality index D, i.e., to test the hypothesis that the data in D come from a distribution with zero mean. If the normality test was not fulfilled, the Wilcoxon signed rank test for paired data was used in place of the Student’s t-test.
We used the McNemar test for paired proportions to check the significance of changes in the number of subjects for which the causal coupling C was larger than zero (i.e., at least one candidate term from x is selected at the second repetition of the conditioning procedure for computation of Cx → y) between experimental conditions. In all tests, a p < 0.05 was considered statistically significant.
Results
Time Domain Analysis
A representative example of HP, SAP, and RF variability series recorded in the different experimental conditions during the TT and PB protocols is reported in Figure 1 (Figure 1B: su, sp; Figure 1C: up, sp; Figure 1D: su, pa). The trends of the time domain CV parameters for the whole population are summarized in Table 1. While in the control condition of spontaneous breathing in the supine position results were averaged over all 30 subjects, the statistical analysis was performed by paired tests involving only the 15 subjects who underwent tilt testing or PB; in the control condition, no differences were observed for the time domain parameters computed between the groups participating to the two protocols. The mean HP decreased significantly moving from the supine to the upright position, and increased significantly moving from spontaneous to PB. The HP variability, measured as the SD of the RR intervals, was unchanged after tilt and increased significantly with PB. While the mean SAP was not modified, its SD increased significantly during tilt testing.
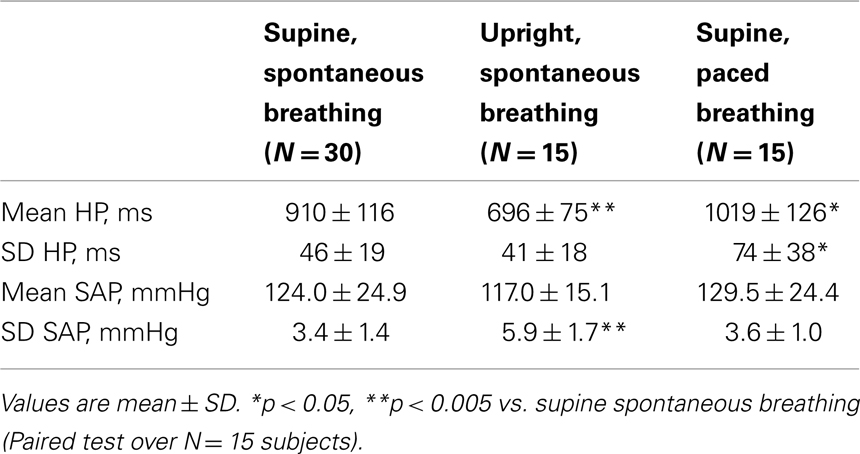
Table 1. Time domain characterization of heart period (HP) and systolic arterial pressure (SAP) variability during tilt test and paced breathing protocols.
The optimal time delay for candidate selection estimated in the supine position during spontaneous breathing, reported in Table 2, was lower for the RF than for the SAP and HP series (N = 30 subjects). When subjects moved to the upright position (TT protocol, N = 15) the time delay increased significantly for RF and HP series, and was stable for the SAP series. During paced breathing (PB protocol, N = 15), the delay values decreased significantly for RF and HP series, while the decrease was not statistically significant for the SAP series.
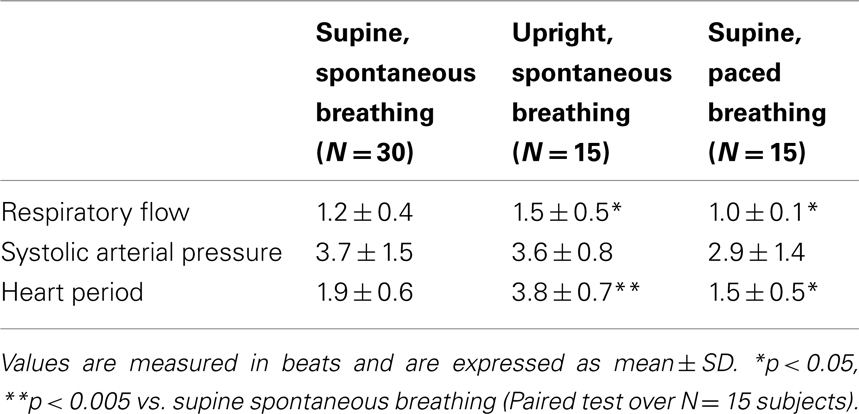
Table 2. Optimal time delay for the selection of candidate terms to be tested in the estimation of conditional entropy.
Causal Coupling and Directionality Analyses
The results of causal coupling and directionality analyses performed during the two considered experimental protocols are summarized in Table 3. A graphical representation of the results and statistical trends for coupling and directionality indexes is reported in Figure 5 for the TT protocol, and in Figure 6 for the PB protocol.
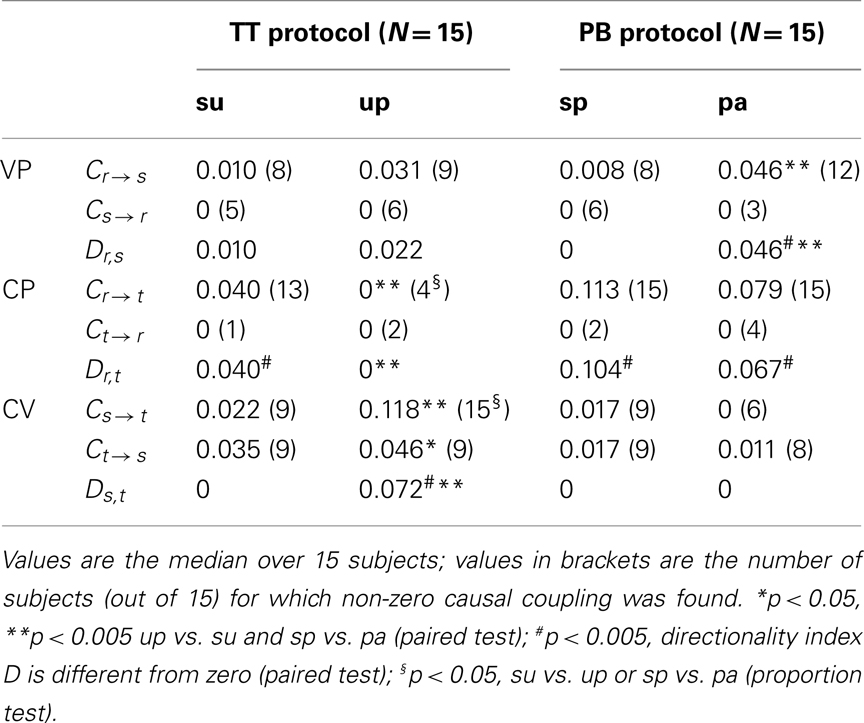
Table 3. Causal coupling index C and directionality index D computed between respiratory flow (r), systolic arterial pressure (s), and heart period (t) time series measured during the tilt test protocol (TT; su: supine position, up: upright position) and during the paced breathing protocol (PB; sp: spontaneous breathing, pa: paced breathing) in the study of vasculo-pulmonary (VP), cardio-pulmonary (CP), and cardio-vascular (CV) coupling.
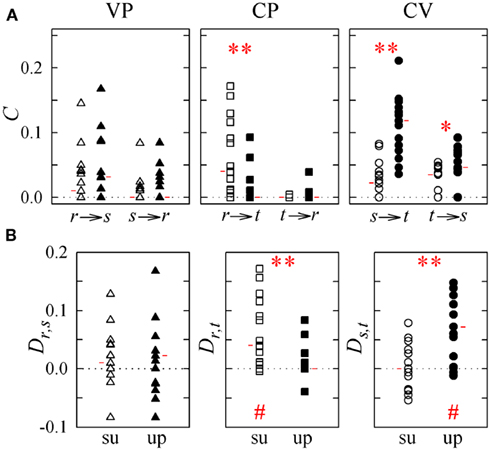
Figure 5. Causal coupling index C (A) and directionality index D (B) computed for subjects in the supine position (su, white symbols) and in the upright position (up, black symbols) in the study of vasculo-pulmonary (VP, triangles), cardio-pulmonary (CP, squares), and cardio-vascular (CV, circles) coupling (r: respiration, s: systolic pressure; t: heart period). Horizontal red marks denote the median of each distribution. *p < 0.05, **p < 0.005 supine vs. upright; #p < 0.005, directionality index D is different from zero.
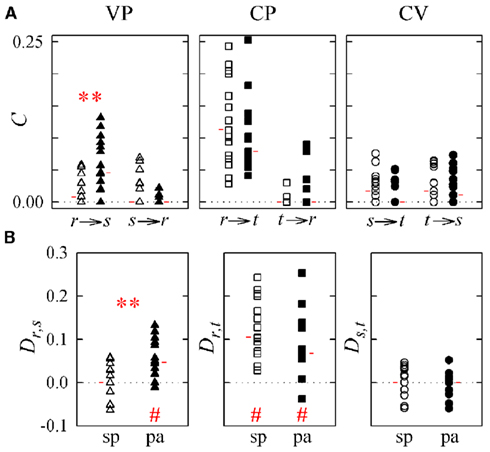
Figure 6. Causal coupling index C (A) and directionality index D (B) computed for subjects during spontaneous breathing (sp, white symbols) and during paced breathing (pa, black symbols) in the study of vasculo-pulmonary (VP, triangles), cardio-pulmonary (CP, squares), and cardio-vascular (CV, circles) coupling (r: respiration, s: systolic pressure; t: heart period). Horizontal red marks denote the median of each distribution. **p < 0.005 spontaneous vs. paced breathing; #p < 0.005, directionality index D is different from zero.
The control condition with subjects in the supine position with spontaneous breathing is described by the distributions of white symbols in Figures 5 and 6, which show agreeing results. Specifically, for VP interactions (Figures 5 and 6, white triangles) the causal coupling distributions have non-zero median from RF to SAP (Cr → s), and zero median from SAP to RF (Cs → r); however, the prevalence of causality from RF to SAP is not marked enough to set statistically significant directionality Dr,s. The causal coupling for CP interactions (Figures 5 and 6, white squares) is clearly unidirectional, as Cr → t is remarkable while Ct → r has zero median; moreover, a statistically significant directionality is set from RF to HP variability. As to the CV loop (Figures 5 and 6, white circles), both Cs → t and Ct → s have non-zero median, but there is no prevalence of one of the two couplings as Ds,t is not significantly different from zero.
When subjects are tilted in the 60° position (Figure 5), causal coupling values do not change substantially between s and r, decrease significantly from r to t, and increase significantly both from s to t and from t to s. As a result, in the upright position directionality is still non-significant for VP interactions, disappears for CP interactions, and is set from s to t in the CV regulatory loop (Figure 5B; Table 3). When subjects undergo PB (Figure 6), the causal coupling increases significantly from r to s and does not change significantly along any other direction compared to spontaneous breathing. As a result, directionality is set from r to s in the VP loop, remains significant from r to t in the CP loop, and remains non-significant in the CV loop (Figure 6B; Table 3).
The results of causal coupling and directionality analysis are reflected by looking at the trends of the proportion of subjects for which the adopted conditioning procedure reveals significant causality. As summarized in Table 3 and depicted in Figure 7A, moving from the supine to the upright position the number of subjects for which at least one term from r is selected to describe t decreases significantly, while the number of subjects for which at least one term from s is selected to describe t increases significantly. During forced respiration, noticeable variations in the number of subjects for which candidate terms from the input series are selected to describe the output series, though not reaching statistical significance, can be observed from r to s, from s to r, and from s to t (Figure 7B). These results suggest that HP variability is driven to a larger extent by SAP and to a lesser extent by RF during TT, and that SAP is more driven by RF during PB.
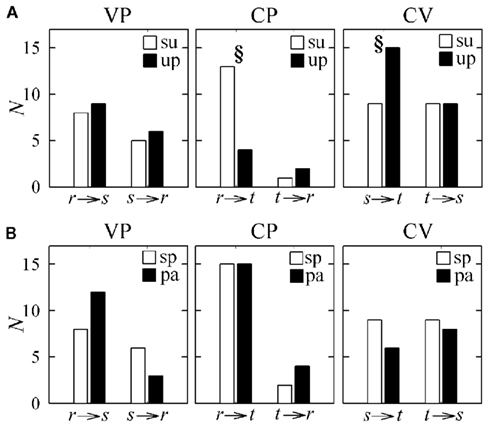
Figure 7. Number of subjects (N) for which at least one candidate term of the input series is selected in the causality analysis (i.e., the causal coupling index is non-zero) during the tilt test protocol [(A); su: supine position; up: upright position] and during the paced breathing protocol [(B); sp: spontaneous breathing; pa: paced breathing] in the study of vasculo-pulmonary (VP), cardio-pulmonary (CP), and cardio-vascular (CV) coupling (r: respiration, s: systolic pressure; t: heart period). §p < 0.05, su vs. up or sp vs. pa.
Discussion
In this study we exploited an information domain approach to characterize directionality in CV and cardiorespiratory interactions. The method is based on quantifying the information transfer from one variability series to another as the (normalized) amount of information carried by the second series that can be explained exclusively by the first series, in agreement with the notion of Granger causality. We remark that our method performs a “black box” analysis in which physiological mechanisms are not directly probed but are tested from time series data, and that it is based on the assessment of the coupling strength along predetermined causal directions. Therefore, it cannot provide deep information about some basic structures of physiological closed-loop systems such as distinguishing between excitatory or inhibitory or, according to the control system theory, between negative or positive closed-loop systems. Nevertheless, the method is quite helpful in the evaluation of closed-loop interactions between time series. This skill was demonstrated for simulated time series in Faes et al. (2011a), and has been exploited in this study to detect the presence of open-loop or closed-loop interactions between two physiological variability series. Indeed, comparing the information transferred along the two causal pathways of the closed-loop interaction between two series we may infer the dominant causal direction: for instance, if the information transfer from SAP to HP is higher than that from HP to SAP, we conclude that causality of CV interactions is set from SAP to HP. The same analysis performed between RF and SAP, and between RF and HP, allowed us to investigate causal couplings and dominant directions of interaction for the VP regulation and the CP regulation, respectively. Moreover, the utilization of paired tests applied between directions of interaction, or between conditions, brought statistical significance respectively to the observed presence of dominant causal directions, or to the observed modifications of coupling mechanisms occurring in the two considered experimental protocols. To favor physiological interpretation of the main findings, a graphical representation of the statistical results is reported in Figure 8.
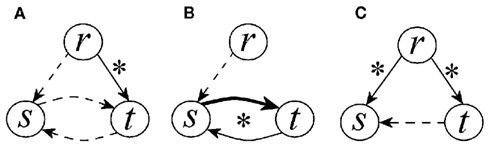
Figure 8. Graphical representation of the results of causality analysis in the three considered conditions: supine position, spontaneous breathing (A), upright position, spontaneous breathing (B), and supine position, paced breathing (C). Arrows between two variability series (r: respiration, s: systolic pressure; t: heart period) are present when the corresponding causal coupling index is non-zero in at least half of the subjects (i.e., the index C has a non-zero median). The style of the arrow is arranged so that to reflect the statistical significance of changes in the index C observed between conditions (i.e., the coupling is significantly stronger for solid arrows than for dashed arrows, and for bold arrows than for solid arrows). Further, the statistical significance between the two causal directions for a given condition (i.e., the significance of the directionality index D) is marked with an asterisk.
Methodological Aspects
The information theoretic approach utilized in this study to assess directional interactions was specifically devised to deal with experimental time series measured from complex physiological systems (Faes et al., 2011a). The proposed method is grounded on the concept of transfer entropy (Schreiber, 2000), and follows a recent generalization of this concept – denoted as partial transfer entropy – dealing with estimation of causal information flow within a network of multiple interacting time series (Vakorin et al., 2009). Despite the appeal of these information-based tools in causality assessment, their utilization in experimental time series analysis is usually a daunting task, because entropy estimation is problematic in the presence of short and noisy time series. With the aim of dealing with this issue, the two main peculiarities of the approach proposed in (Faes et al., 2011a) help to improve the estimation of CE and, consequently, the identification of causality: the sequential procedure for candidate selection overcomes the issues of redundancy and arbitrariness which often lead to detection of spurious directionality, while the utilization of a corrected estimator for the CE (Porta et al., 1998, 1999) compensates the bias otherwise affecting traditional estimates. These methodological improvements allow one to obtain accurate causal coupling estimates, and then to exploit the potential advantages of information domain approaches to the study of time series interactions. For instance, these approaches do not make strong assumptions about the nature of the investigated dynamics (e.g., linear stochastic or non-linear deterministic), so that they can be used for CV and cardiorespiratory analysis where the type of interaction cannot be stated a priori. On the contrary, other very popular indices able to detect causal coupling in bivariate or multivariate time series, i.e., the causal coherence (Porta et al., 2002) and the partial directed coherence (Baccalà and Sameshima, 2001), are devised to deal with linear stochastic autoregressive processes and thus may fail when non-linear causality occurs and, more generally, when the underlying model does not fit the observed data. While limitations related to the linearity assumption are overcame by recently proposed methods such as non-linear autoregressive exogenous models (Faes et al., 2008a; Riedl et al., 2010) or kernel Granger causality (Marinazzo et al., 2008), these methods may suffer from the shortcomings of model misspecification. Model misspecification is a key issue in modeling connectivity, which can be critical when complex parametric models are identified on short and noisy multivariate time series. Working under the information theoretic framework, the method used in this study offers the advantage of not requiring the prior specification of a model for the investigated interactions. We note that similar model-free statistics for causality detection might be developed extending to the multivariate case other suitable frameworks for time series analysis, such as cross-sample entropy (Richman and Moorman, 2000), local non-linear prediction (Faes et al., 2008b) and causal symbolic coupling traces (Wessel et al., 2009).
Information domain approaches have been already proposed for the assessment of causality in CV interactions (Nollo et al., 2002; Palus et al., 2004; Porta et al., 2011b). In particular, Porta et al. (2011b) have recently shown that cross-CE indexes perform better than more traditional approaches relying on the transformation of frequency domain phase shifts into time delays (Taylor and Eckberg, 1996; Pitzalis et al., 1998; Cooke et al., 1999). Though widely used, approaches inferring causality from a phase diagram require prior knowledge to solve the ambiguities related to multiple admissible phase values (e.g., comparison of time lags from SAP to HP with expected baroreflex latency) and, even with that knowledge, may be misleading (Porta et al., 2011b). On the contrary, information domain methods as well as other methods based on the concept of Granger causality (Granger, 1969) are directly linked to the concept of directionality as they incorporate the flow of time in the procedure developed to estimate the causality index. As this property is shared by many methods for causality assessment, ranging from linear and non-linear parametric models (Baccalà and Sameshima, 2001; Faes et al., 2008a) to symbolic coupling traces (Wessel et al., 2009), we expect that also the causality indexes derived through these methods are able solve the ambiguities related to estimation of causality from phase diagrams.
A key property of the information domain approach proposed in this study stands in its multivariate nature, which lets it to outperform the bivariate approaches followed so far for estimation of causality in CV and cardiorespiratory interactions (Nollo et al., 2002, 2009; Faes et al., 2008a; Suhrbier et al., 2010; Kabir et al., 2011; Porta et al., 2011b). Indeed, the consideration of variables other than the two specifying the causal direction under analysis makes it possible to quantify complex interactions between two variables avoiding the confounding effects of the others (Vakorin et al., 2009). This property allows one to elicit the direct causal effects between the two considered variables, i.e., the effects not mediated by the other considered variables. In the context of our application, this is extremely useful to clarify the nature of joint exogenous influences of respiration on cardiac and vascular variability series. In particular, the joint multivariate analysis of RF, SAP, and HP interactions can be used to rule out possible confounding effects of CP and VP couplings on the estimation of CV interactions.
This study exploits a method based on amplitude quantization to assess causality between two variability series. As such, the method works in practice on sequences of symbols obtained after uniform partitioning of the vector coordinates for each time series. Similar coarse graining procedures are followed by cross-approximate entropy and cross-sample entropy methods (Richman and Moorman, 2000), as well as by methods based on symbolization (Baumert et al., 2005; Wessel et al., 2009), which perform a non-uniform partition of the series amplitudes. Therefore, the coupling indexes derived from these approaches capture relationships related to the dominant oscillations in the time series. With reference to our application, these dominant oscillations are likely the Mayer waves in the upright tilting position, the respiration-related waves during PB, and a combination of both waves during spontaneous breathing in the supine position (Malliani, 1999). Thus, although the estimated causal couplings cannot be assessed for specific oscillations as done by linear frequency domain measures (Porta et al., 2002; Faes and Nollo, 2010), they provide an overall information related to the dominant physiological mechanisms in each specific condition, intended as the mechanisms inducing the larger amplitude variations in the time series. The emergence of dominant oscillations during TT and PB protocols (which is also visible in the example of Figure 1) is confirmed indirectly by the analysis of the time delays peculiar of each variability series in the different conditions. Indeed, besides serving in the optimization of the temporal range to be used for candidate selection in non-linear analysis, these delays indicate also the decorrelation time of each series. The reported values suggest that cardiac, vascular, and respiratory dynamics tend to be slower during tilt testing and faster during PB. This presumably reflects the presence of a dominant low frequency oscillation in the upright position, which is enhanced by the sympathetic activation consequent to tilt on one side, and the presence of a dominant, respiration-driven oscillation during PB on the other side.
Analysis of Cardio-Vascular Interactions
The study of the causal coupling along the two directions of the CV loop confirmed that HP and SAP are likely to interact in a closed-loop, according to the possible existence of neural baroreflex feedback mechanisms acting from SAP to HP on one side, and of mechanical feedforward mechanisms acting from HP to SAP on the other side (Saul et al., 1991; Taylor and Eckberg, 1996; Mullen et al., 1997; Nollo et al., 2005; Porta et al., 2011b). With the subjects lying in the supine position and breathing spontaneously, we observed a detectable information transfer through both feedback and feedforward pathways of interaction (Figures 6A, 7A, and 8A). Since the directionality index was not significantly different from zero, we conclude that feedback and feedforward mechanisms are balanced in this resting condition. At variance with this result are the findings of previous studies performing pure bivariate analyses of SAP and HP series, which indicated in supine healthy subjects the prevalence of feedforward mechanisms from HP to SAP over the baroreflex-mediated effects of SAP on HP (Nollo et al., 2005, 2009; Faes et al., 2008a; Porta et al., 2011b). We ascribe the difference to the fact that our analysis of causality between SAP and HP explicitly includes RF, separating its direct contributions to CV variability. Therefore it is likely that, while direct effects between SAP and HP are balanced, bivariate analyses implicitly accounting for indirect effects mediated by respiration detect a stronger coupling over the feedforward branch of the loop. This supposition is also supported by the stronger driving which RF seems to apply on HP than on SAP (Figure 8A).
The causal interactions between SAP and HP variability were substantially modified during the two considered experimental protocols. When subjects were tilted from the supine to the upright position, the reciprocal interaction between the two CV variables was substantially enhanced (Figures 5A and 8B). Specifically, the causal coupling was increased over both pathways of the CV loop, with a particular enhancement over the feedback direction documented by the significant directionality set from SAP to HP. These results agree with bivariate analyses performed in similar protocols (Nollo et al., 2005, 2009; Faes et al., 2008a; Porta et al., 2011b), and document the increased involvement of the baroreflex in controlling heart rate consequent to the tilt-induced activation of the sympathetic nervous system. In this case, the agreement with bivariate measures is likely related to the lower importance of direct effects of respiration on cardiac and vascular variability in the upright position. During PB, direct influences between HP and SAP were not modified substantially (no statistically significant changes are denoted in Figure 6 for CV causal couplings and directionality measures), although a tendency to decreasing of the feedback causal coupling was noticed (Figures 5A and 8C). Since in this condition CP and VP mechanisms seem predominant (Figure 8C), we advocate the necessity of a multivariate approach like ours to properly characterize CV regulation; simple bivariate approaches involving only SAP and HP series in PB protocols (Pitzalis et al., 1998) may indeed be misleading because they tend to reflect more the different strength and latency with which RF affects directly HP and SAP, rather than the true direct coupling between HP and SAP.
Analysis of Cardio-Pulmonary and Vasculo-Pulmonary Interactions
The utilization of a multivariate approach able to elicit direct effects from one series to another allowed us to disambiguate the effects of respiration on the two CV variables, through the separation of CP and VP interactions from CV interactions. Our analysis of CP and VP interactions indicates that, when present, significant causal coupling occurred always from respiration to HP or arterial pressure, and never over the opposite direction (the distributions of Cr → t and Cr → s always have zero median). This result confirms the expected role of respiration acting as an exogenous variable on the CV loop (Cohen and Taylor, 2002). Moreover, since the result is derived without imposing causality from RF to SAP and/or HP as done in open-loop modeling studies (Baselli et al., 1994; Porta et al., 2000a), the result confirms on physiological data the ability of the approach to capture unidirectional causal interactions between variables.
As regards the strength of the unidirectional coupling in CP and VP interactions, we found that, in the supine position with spontaneous breathing, the information transfer originating from respiration variability is detectable toward both CV variables (Figures 6A, 7A, and 8A). The causal coupling from RF to HP quantifies the strength of respiratory influences affecting the heart rate independently of arterial pressure changes. Therefore, this coupling can be taken as a measure of the central effects of the respiratory drive on the cardiac vagal motor neurons, reflecting a central mechanism underlying respiratory related fluctuations in the heart rate (Gilbey et al., 1984). On the other hand, the coupling from RF to SAP is thought as the result of the perturbing action of breathing on intrathoracic pressure, causing fluctuations in stroke volume, cardiac output, and thus blood pressure (Toska and Eriksen, 1993; Triedman and Saul, 1994).
The modifications of these two causal couplings observed during PB (Figures 6 and 8A,C) may be explained considering that voluntary control of respiration is likely to change respiratory parameters, thus affecting SAP and HP variability through both peripheral and central respiratory effects on the basic CV reflexes (Eckberg, 2000; Pinna et al., 2006). In particular, Pinna et al. (2006) found that PB at 0.25 Hz is accompanied by an increased respiratory drive (increased tidal volume and minute respiration), which in turn increases the amplitude of respiratory related oscillations in SAP but not in HP variability. Accordingly, we may interpret the increase of coupling from RF to SAP with the increased mechanical effect of the respiratory drive on intrathoracic pressure, and the absence of significant modifications in the coupling from RF to HP with the negligible effect of tidal volume on respiratory sinus arrhythmia (Cooke et al., 1998; Pinna et al., 2006).
During head-up tilt, the observed absence of causal coupling from RF to HP (Figures 5 and 8A,B) may be explained with regard both to physiological mechanisms and to the adopted methodology. Physiologically, the shift of the sympathovagal balance toward sympathetic activation and vagal withdrawal occurring with the assumption of the upright position decreases the amplitude of respiration-related HP oscillations (Montano et al., 1994; Cooke et al., 1999), and this phenomenon is likely reflected in our study by the decreased causal influence of RF on HP variability. Methodologically, the decrease of respiration-related oscillations and the contemporaneous increase of low frequency, respiration-unrelated HP oscillations consequent to tilt is likely to mask causal effects at the respiratory frequency, which are not detected because the predominant part of the information transfer is that regarding low frequency oscillations. On the contrary, the substantially unaltered causal coupling measured from RF to SAP after the tilting maneuver is in agreement with findings indicating that respiratory fluctuations in arterial pressure are preserved, in their proportion to low frequency fluctuations, in the upright position (Taylor and Eckberg, 1996; Cooke et al., 1999).
Respiratory Fluctuations in Cardiac and Vascular Variability
In the previous section we have discussed the direct mechanisms that may determine respiration-related fluctuations in heart rate and arterial pressure. Here we integrate the discussion exploiting the combined analysis of the causal couplings measured for CP and VP interactions on one side, and for CV interactions on the other side, to compare direct and indirect mechanisms underlying the effects of RF on HP and on SAP.
The effects of RF on HP, commonly denoted as respiratory sinus arrhythmia, are exerted according to two possible – and still debated – driving mechanisms, i.e., the central vagal effects of RF on HP, and the mechanical effects of RF on SAP which are transferred to HP through the baroreflex (Gilbey et al., 1984; Toska and Eriksen, 1993; Eckberg, 2009). According to our results, both these mechanisms seem to be present at rest, with a prevalence of the central mechanism suggested by the strong direct causal coupling from RF to HP (Figure 8A). During head-up tilt the baroreflex-mediated mechanism seems to be predominant, as the coupling is preserved from RF to SAP, is increased from SAP to HP, and is blunted from RF to HP (Figure 8B). On the contrary, respiratory sinus arrhythmia seems to be driven by the direct mechanism from RF to HP during PB, in a way even stronger than during spontaneous breathing (Figure 8C). As to respiratory fluctuations in SAP variability, we found that the direct component representing respiration-induced effects on stroke volume (Innes et al., 1993; Toska and Eriksen, 1993) is detectable in all conditions (Figure 8). Moreover, indirect effects mirroring the transmission of HP fluctuations through mechanical feedforward mechanisms (Taylor and Eckberg, 1996; Mullen et al., 1997) cannot be excluded, especially in the supine position with either spontaneous or PB.
The discussion above reported completes the characterization of the possible mechanisms underlying the generation of cardiac and vascular variability, as can be done by our multivariate approach considering the information transfer between HP, SAP, and RF time series. It is worth noting that our interpretations cannot describe sources of variability due to regulatory mechanisms which do not involve the three observed variables; these mechanisms may possibly include central autonomic effects determining directly HP variability (Cooley et al., 1998), or mechanisms regulating SAP variability via control variables different from HP and RF (Baselli et al., 1988).
Conclusion
The main advantages of the approach applied in this study to assess directional interactions in CV and cardiorespiratory variability can be summarized as: the general applicability (the method captures both linear and non-linear interactions); the possibility to quantify the coupling strength reflecting directional mechanisms, such as baroreflex and CP couplings, which work in physiological, closed-loop conditions; and the multivariate nature that allows one to account for the disturbing action of several variables on the causal interactions between the pair of signals under focus, as done in the characterization of respiration-driven mechanisms. The analysis performed in resting physiological conditions and in response to widely used experimental maneuvers indicated that the approach is able to reflect well known regulatory mechanisms of CV and cardiorespiratory physiology, as well as to support the interpretation of other more debated mechanisms. Hence, the approach may be favorably suggested for the description of mechanism impairment in a wide spectrum of CV and cardiorespiratory pathologies, ranging from heart failure to neurally mediated and breathing disorders.
Conflict of Interest Statement
The authors declare that the research was conducted in the absence of any commercial or financial relationships that could be construed as a potential conflict of interest.
References
Angelini, L., de Tommaso, M., Marinazzo, D., Nitti, L., Pellicoro, M., and Stramaglia, S. (2010). Redundant variables and Granger causality. Physiol. Rev. E Stat. Nonlin. Soft Matter Phys. 81, 037201.
Baccalà, L. A., and Sameshima, K. (2001). Partial directed coherence: a new concept in neural structure determination. Biol. Cybern. 84, 463–474.
Bai, Y., Siu, K. L., Ashraf, S., Faes, L., Nollo, G., and Chon, K. H. (2008). Nonlinear coupling is absent in acute myocardial patients but not healthy subjects. Am. J. Physiol. Heart Circ. Physiol. 295, H578–H586.
Baselli, G., Cerutti, S., Badilini, F., Biancardi, L., Porta, A., Pagani, M., Lombardi, F., Rimoldi, O., Furlan, R., and Malliani, A. (1994). Model for the assessment of heart period and arterial pressure variability interactions and of respiration influences. Med. Biol. Eng. Comput. 32, 143–152.
Baselli, G., Cerutti, S., Civardi, S., Malliani, A., and Pagani, M. (1988). Cardiovascular variability signals: towards the identification of a closed-loop model of the neural control mechanisms. IEEE Trans. Biomed. Eng. 35, 1033–1046.
Baumert, M., Baier, V., Truebner, S., Schirdewan, A., and Voss, A. (2005). Short- and long-term joint symbolic dynamics of heart rate and blood pressure in dilated cardiomyopathy. IEEE Trans. Biomed. Eng. 52, 2112–2115.
Cohen, M. A., and Taylor, J. A. (2002). Short-term cardiovascular oscillations in man: measuring and modelling the physiologies. J. Physiol. 542, 669–683.
Cooke, W. H., Cox, J. F., Diedrich, A. M., Taylor, J. A., Beightol, L. A., Ames, J. E., Hoag, J. B., Seidel, H., and Eckberg, D. L. (1998). Controlled breathing protocols probe human autonomic cardiovascular rhythms. Am. J. Physiol. 274, H709–H718.
Cooke, W. H., Hoag, J. B., Crossman, A. A., Kuusela, T. A., Tahvanainen, K. U. O., and Eckberg, D. L. (1999). Human response to upright tilt: a window on central autonomic integration. J. Physiol. 517, 617–628.
Cooley, R. L., Montano, N., Cogliati, C., van de, B. P., Richenbacher, W., Oren, R., and Somers, V. K. (1998). Evidence for a central origin of the low-frequency oscillation in RR-interval variability. Circulation 98, 556–561.
De Boer, R. W., Karemaker, J. M., and Strackee, J. (1985). Relationships between short-term blood-pressure fluctuations and heart-rate variability in resting subjects: a spectral analysis approach. Med. Biol. Eng. Comput. 23, 352–358.
Eckberg, D. L. (2009). Point: counterpoint: respiratory sinus arrhythmia is due to a central mechanism vs. respiratory sinus arrhythmia is due to the baroreflex mechanism. J. Appl. Physiol. 106, 1740–1742.
Faes, L., and Nollo, G. (2006). Bivariate nonlinear prediction to quantify the strength of complex dynamical interactions in short-term cardiovascular variability. Med. Biol. Eng. Comput. 44, 383–392.
Faes, L., and Nollo, G. (2010). Assessing frequency domain causality in cardiovascular time series with instantaneous interactions. Methods Inf. Med. 49, 453–457.
Faes, L., Nollo, G., and Chon, K. H. (2008a). Assessment of Granger causality by nonlinear model identification: application to short-term cardiovascular variability. Ann. Biomed. Eng. 36, 381–395.
Faes, L., Porta, A., and Nollo, G. (2008b). Mutual nonlinear prediction as a tool to evaluate coupling strength and directionality in bivariate time series: comparison among different strategies based on k nearest neighbors. Physiol. Rev. E Stat. Nonlin. Soft Matter Phys. 78, 026201.
Faes, L., Nollo, G., and Porta, A. (2011a). Information-based detection of nonlinear Granger causality in multivariate processes via a nonuniform embedding technique. Phys. Rev. E Stat. Nonlin. Soft Matter Phys. 83, 051112.
Faes, L., Nollo, G., and Porta, A. (2011b). Non-uniform multivariate embedding to assess the information transfer in cardiovascular and cardiorespiratory variability series. Comput. Biol. Med. doi: 10.1016/j.compbiomed.2011.02.007
Faes, L., Widesott, L., Del Greco, M., Antolini, R., and Nollo, G. (2006). Causal cross-spectral analysis of heart rate and blood pressure variability for describing the impairment of the cardiovascular control in neurally mediated syncope. IEEE Trans. Biomed. Eng. 53, 65–73.
Gilbey, M. P., Jordan, D., Richter, D. W., and Spyer, K. M. (1984). Synaptic mechanisms involved in the inspiratory modulation of vagal cardio-inhibitory neurones in the cat. J. Physiol. 356, 65–78.
Granger, C. W. J. (1969). Investigating causal relations by econometric models and cross-spectral methods. Econometrica 37, 424–438.
Hoyer, D., Bauer, R., Walter, B., and Zwiener, U. (1998). Estimation of nonlinear couplings on the basis of complexity and predictability – a new method applied to cardiorespiratory coordination. IEEE Trans. Biomed. Eng. 45, 545–552.
Innes, J. A., De Cort, S. C., Kox, W., and Guz, A. (1993). Within-breath modulation of left ventricular function during normal breathing and positive-pressure ventilation in man. J. Physiol. 460, 487–502.
Kabir, M. M., Saint, D. A., Nalivaiko, E., Abbott, D., Voss, A., and Baumert, M. (2011). Quantification of cardiorespiratory interactions based on joint symbolic dynamics. Ann. Biomed. Eng. 39, 264–214.
Malliani, A. (1999). The pattern of sympathovagal balance explored in the frequency domain. News Physiol. Sci. 14, 111–117.
Malpas, S. C. (2002). Neural influences on cardiovascular variability: possibilities and pitfalls. Am. J. Physiol. Heart Circ. Physiol. 282, H6–H20.
Marinazzo, D., Pellicoro, M., and Stramaglia, S. (2008). Kernel method for nonlinear Granger causality. Phys. Rev. Lett. 100, 144103.
Montano, N., Gnecchi Ruscone, T., Porta, A., Lombardi, F., Pagani, M., and Malliani, A. (1994). Power spectrum analysis of heart rate variability to assess the change in sympathovagal balance during graded orthostatic tilt. Circulation 90, 1826–1831.
Mullen, T. J., Appel, M. L., Mukkamala, R., Mathias, J. M., and Cohen, R. J. (1997). System identification of closed loop cardiovascular control: effects of posture and autonomic blockade. Am. J. Physiol. 272, H448–H461.
Nollo, G., Faes, L., Antolini, R., and Porta, A. (2009). Assessing causality in normal and impaired short-term cardiovascular regulation via nonlinear prediction methods. Philos. Transact. A Math. Phys. Eng. Sci. 367, 1423–1440.
Nollo, G., Faes, L., Porta, A., Antolini, R., and Ravelli, F. (2005). Exploring directionality in spontaneous heart period and systolic pressure variability interactions in humans. Implications in baroreflex gain evaluation. Am. J. Physiol. Heart Circ. Physiol. 288, H1777–H1785.
Nollo, G., Faes, L., Porta, A., Pellegrini, B., Ravelli, F., Del Greco, M., Disertori, M., and Antolini, R. (2002). Evidence of unbalanced regulatory mechanism of heart rate and systolic pressure after acute myocardial infarction. Am. J. Physiol. Heart Circ. Physiol. 283, H1200–H1207.
Palus, M., Stefanovska, A., and Veber, M. (2004). Causality between the amplitude and frequency of cardiac oscillations. Cardiovasc. Eng. 4, 127–132.
Pinna, G. D., Maestri, R., La Rovere, M. T., Gobbi, E., and Fanfulla, F. (2006). Effect of paced breathing on ventilatory and cardiovascular variability parameters during short-term investigations of autonomic function. Am. J. Physiol. Heart Circ. Physiol. 290, H424–H433.
Pitzalis, M. V., Mastropasqua, F., Massari, F., Passantino, A., Colombo, R., Mannarini, A., Forleo, C., and Rizzon, P. (1998). Effect of respiratory rate on the relationships between RR interval and systolic blood pressure fluctuations: a frequency-dependent phenomenon. Cardiovasc. Res. 38, 332–339.
Pompe, B., Blidh, P., Hoyer, D., and Eiselt, M. (1998). Using mutual information to measure coupling in the cardiorespiratory system. IEEE Eng. Med. Biol. Mag. 17, 32–39.
Porta, A., Baselli, G., Liberati, D., Montano, N., Cogliati, C., Gnecchi-Ruscone, T., Malliani, A., and Cerutti, S. (1998). C measuring regularity by means of a corrected conditional entropy in sympathetic outflow. Biol. Cybern. 78, 71–78.
Porta, A., Baselli, G., Lombardi, F., Montano, N., Malliani, A., and Cerutti, S. (1999). Conditional entropy approach for the evaluation of the coupling strength. Biol. Cybern. 81, 119–129.
Porta, A., Baselli, G., Rimoldi, O., Malliani, A., and Pagani, M. (2000a). Assessing baroreflex gain from spontaneous variability in conscious dogs: role of causality and respiration. Am. J. Physiol. 279, H2558–H2567.
Porta, A., Guzzetti, S., Montano, N., Pagani, M., Somers, V., Malliani, A., Baselli, G., and Cerutti, S. (2000b). Information domain analysis of cardiovascular variability signals: evaluation of regularity, synchronisation and co-ordination. Med. Biol. Eng. Comput. 38, 180–188.
Porta, A., Bassani, T., Bari, V., Tobaldini, E., Takahashi, A. C., Catai, A. M., and Montano, N. (2011a). Model-based assessment of baroreflex and cardiopulmonary couplings during graded head-up tilt. Comput. Biol. Med. doi: 10.1016/j.compbiomed.2011.04.019.
Porta, A., Catai, A. M., Takahashi, A. C., Magagnin, V., Bassani, T., Tobaldini, E., van de, B. P., and Montano, N. (2011b). Causal relationships between heart period and systolic arterial pressure during graded head-up tilt. Am. J. Physiol. Regul. Integr. Comp Physiol. 300, R378–R386.
Porta, A., Furlan, R., Rimoldi, O., Pagani, M., Malliani, A., and van de Borne, P. (2002). Quantifying the strength of the linear causal coupling in closed loop interacting cardiovascular variability signals. Biol. Cybern. 86, 241–251.
Richman, J. S., and Moorman, J. R. (2000). Physiological time-series analysis using approximate entropy and sample entropy. Am. J. Physiol. 278, H2039–H2049.
Riedl, M., Suhrbier, A., Stepan, H., Kurths, J., and Wessel, N. (2010). Short-term couplings of the cardiovascular system in pregnant women suffering from pre-eclampsia. Philos. Transact. A Math. Phys. Eng. Sci. 368, 2237–2250.
Rosenblum, M. G., Cimponeriu, L., Bezerianos, A., Patzak, A., and Mrowka, R. (2002). Identification of coupling direction: application to cardiorespiratory interaction. Phys. Rev. E Stat. Nonlin. Soft Matter Phys. 65, 041909.
Saul, J. P., Berger, R. D., Albrecht, P., Stein, S. P., Hui Chen, M., and Cohen, R. J. (1991). Transfer function analysis of the circulation: unique insights into cardiovascular regulation. Am. J. Physiol. 261, H1231–H1245.
Small, M. (2005). Applied Nonlinear Time Series Analysis: Applications in Physics, Physiology and Finance. Singapore: World Scientific.
Suhrbier, A., Riedl, M., Malberg, H., Penzel, T., Bretthauer, G., Kurths, J., and Wessel, N. (2010). Cardiovascular regulation during sleep quantified by symbolic coupling traces. Chaos 20, 045124.
Taylor, J. A., and Eckberg, D. L. (1996). Fundamental relations between short-term RR interval and arterial pressure oscillations in humans. Circulation 93, 1527–1532.
Toska, K., and Eriksen, M. (1993). Respiration-synchronous fluctuations in stroke volume, heart rate and arterial pressure in humans. J. Physiol. 472, 501–512.
Triedman, J. K., and Saul, J. P. (1994). Blood pressure modulation by central venous pressure and respiration. Buffering effects of the heart rate reflexes. Circulation 89, 169–179.
Vakorin, V. A., Krakovska, O. A., and McIntosh, A. R. (2009). Confounding effects of indirect connections on causality estimation. J. Neurosci. Methods 184, 152–160.
Keywords: arterial pressure variability, baroreflex, causality, conditional entropy, head-up tilt, heart rate variability, paced breathing, respiratory sinus arrhythmia
Citation: Faes L, Nollo G and Porta A (2011) Information domain approach to the investigation of cardio-vascular, cardio-pulmonary, and vasculo-pulmonary causal couplings. Front. Physio. 2:80. doi: 10.3389/fphys.2011.00080
Received: 15 July 2011;
Accepted: 15 October 2011;
Published online: 07 November 2011.
Edited by:
Riccardo Barbieri, Massachusetts Institute of Technology, USAReviewed by:
Silvina Ponce Dawson, Universidad de Buenos Aires, ArgentinaLilianne Rivka Mujica-Parodi, State University of New York at Stony Brook, USA
Andreas Voss, University of Applied Sciences Jena, Germany
Copyright: © 2011 Faes, Nollo and Porta. This is an open-access article subject to a non-exclusive license between the authors and Frontiers Media SA, which permits use, distribution and reproduction in other forums, provided the original authors and source are credited and other Frontiers conditions are complied with.
*Correspondence: Luca Faes, Department of Physics and BIOtech, University of Trento, via delle Regole 101, 38060 Mattarello, Trento, Italy. e-mail: luca.faes@unitn.it