 Elvis de Souza Malta1
 Fabio Santos de Lira2
 Fabiana Andrade Machado3
 Anderson Saranz Zago4Sandra Lia do Amaral4
 Alessandro Moura Zagatto1,4*
- 1Laboratory of Physiology and Sport Performance, Department of Physical Education, School of Sciences, São Paulo State University, Bauru, Brazil
- 2Department of Physical Education, School of Technology and Sciences, São Paulo State University, Presidente Prudente, Brazil
- 3Group of Studies and Research in Exercise Physiology Applied to Humans, Department of Physical Education, State University of Maringá, Maringá, Brazil
- 4Department of Physical Education, School of Sciences, São Paulo State University, Bauru, Brazil
Purpose: The aim of the present study was to investigate the effectiveness of photobiomodulation therapy (PBMT) on muscle recovery based on inflammation (interleukin-10 [IL-10]; tumor necrosis factor-α [TNFα]), muscle damage markers (creatine kinase [CK]; lactate dehydrogenase [LDH]), delay onset muscle soreness (DOMS), and countermovement jump performance (CMJ) after two sprint interval training (SIT) sessions compared with a placebo condition (part-I), as well as to compare the effectiveness of PBMT with active recovery (AR) and cold-water immersion (CWI) (part-II).
Methods: Part-I was conducted as a double-blind, randomized and placebo-controlled study and part-II as a parallel-group study. Thirty-six men participated in the studies (12 participants in part-I and 36 participants in part-II). Volunteers performed two SITs interspaced by 24-h (SIT1 and SIT2) to mimic the effect of accumulating 2 consecutive days of SIT. In part-I, only after SIT2, PBMT [Total energy: 600J (300J per leg in 5 spots); wavelength: 660–850 nm] or placebo interventions were performed, while in part-II PBMT (part-I data), AR (15-min; 50% of the maximal aerobic power), or CWI (10-min; 10°C) were carried out, also after SIT2. Blood samples were collected before (i.e., baseline), and 0.5, 1, 24, 48, and 72-h after SIT2, while CMJ and DOMS were measured before, 24, 48, and 72-h after SIT2.
Results: In part-I, there were no interactions between PBMT and placebo conditions for any blood markers (P ≥ 0.313), DOMS (P = 0.052), and CMJ (P = 0.295). However, an effect of time was found with increases in LDH, CK, and IL-10 (P ≤ 0.043) as well as a decrease in DOMS at 72-h compared with 24-h (P = 0.012). In part-II, there were no interactions between the PBMT, AR, and CWI groups for any markers at the same moments (P ≥ 0.189) and for the peak and integral values (P ≥ 0.193), for DOMS (P = 0.314) and CMJ (P = 0.264). However, an effect of time was found with an increase in CK and IL-10 (P = 0.003), while DOMS decreased at 48 and 72-h compared with 24-h (P = 0.001).
Conclusion: In summary, PBMT had no effect on inflammation, muscle damage, CMJ performance, or DOMS after two consecutive sprint interval training sessions compared to placebo, CWI, and AR strategies.
Introduction
Sprint interval training (SIT) is a time-efficient method of providing cardiorespiratory and muscular adaptations with a lower training volume (Gibala et al., 2012), in addition to which, it has also recently been suggested as an additional tool in the treatment of disease (Gibala et al., 2012). However, execution of this mode of training seems to be associated with a higher possibility of damage and inflammatory processes in muscular tissue, evidenced by increases in systemic biochemical markers and cytokine concentrations (Antosiewicz et al., 2013; Harnish and Sabo, 2016). Considering that during training planning, interest in the monitoring/measurement of the recovery status is growing (i.e., measurement of responses of autonomic nervous system by heart rate variability, training impulse, or RPE-session) with a focus on choosing the ensuring training load/stress (Heidari et al., 2018), the use of recovery modalities after exercise, aiming to speed up the process of tissue repair, may be a valid strategy to associate with SIT sessions (Barnett, 2006).
Traditionally, active recovery (AR) and cold-water immersion (CWI) have been widely used to accelerate muscular recovery after intense exercise sessions (Barnett, 2006). However, despite their popularity, the beneficial effects of CWI and AR have recently been questioned (Barnett, 2006; Roberts et al., 2015). In this way, photobiomodulation therapy (PBMT), a type of light therapy that utilizes non-ionizing and non-thermal light sources in the visible and infrared spectrum, eliciting photophysical and photochemical events on biological tissue (Anders et al., 2015), has attracted attention in the area of sports and health sciences. Some isolated studies have suggested its effects in reducing muscle damage markers (Baroni et al., 2010; De Marchi et al., 2012; de Paiva et al., 2016), attenuating or anticipating inflammatory responses (Amadio et al., 2015; Zagatto et al., 2016), and reducing some symptoms of inflammation such as delayed onset muscle soreness (DOMS) and loss of muscle function (Borges et al., 2013). However, despite these findings, the effects of PBMT on overall human muscle recovery (i.e., considering perceptive, physiological, and functional aspects) are contradictory and the actual effectiveness remains uncertain.
The majority of studies with PBMT have investigated its effects using isolated contractions and exercise-induced muscle damage protocols (Baroni et al., 2010; Borges et al., 2013; de Paiva et al., 2016), and only a few after a common high-intensity exercise session such as SIT. Additionally, some studies have compared the effects of PBMT with cryotherapy methods (de Paiva et al., 2016; De Marchi et al., 2017), however, without precise temperature control, a determinant parameter for its effectiveness (Machado et al., 2016), and no studies have compared PBMT with an AR protocol, a widely used method after exercise sessions. The possible beneficial effects of PBMT on overall muscle recovery may contribute to fortifying this method as an additional tool in the exercise routine.
Therefore, the aim of the present study was to investigate the effectiveness of PBMT on muscle recovery in view of systemic inflammation (interleukin-10 [IL-10] and tumor necrosis factor-α [TNFα]), muscle damage (creatine kinase [CK] and lactate dehydrogenase [LDH]), DOMS, and muscle performance (countermovement jump performance [CMJ]) after SIT, and to compare PBMT with AR and CWI interventions. The hypothesis of the study was that PBMT would decrease CK and LDH blood concentrations, accelerate systemic inflammatory responses, and reduce DOMS and loss in CMJ performance.
Materials and Methods
The study was conducted in two parts. Part-I was performed to compare the PBMT with the placebo (PLA) condition in a double-blind design, while part-II aimed to compare PBMT with AR and CWI with parallel groups.
Participants
The minimum sample size for a statistical power of 90 % (alpha: 0.05; allocation ratio: 1) was 10 participants in each group. The sample size was calculated based on the findings of De Oliveira et al. (2018), using the TNFα results and assuming an effect size of 1.4 (d value). Thus, a total of thirty-six healthy men participated in the present investigation, of which twelve participated in both part-I and part-II, with an addition of twenty-four volunteers in part-II (i.e., total of thirty-six in part-II, allocated into three groups of twelve participants each).
Prior to beginning the study, volunteers were informed about the procedures, risks, and benefits involved in the tests and then signed the consent form. All experimental procedures were approved by the Human Research Ethics Committee from the School of Sciences, São Paulo State University – UNESP (protocol number: 1.139.070) and conducted in accordance with the Declaration of Helsinki.
Participants were untrained, healthy individuals, without any vascular disease, metabolic disorders, recent muscle-skeletal or joint injuries (i.e., in the previous 6 months), and had not used nutritional or pharmacological substances for at least 3 months. Volunteers who were regularly absent from the trials, initiated the use of nutritional and/or pharmacological substances during the evaluations, or presented muscle injury were excluded from the study.
Experimental Design
Participants arrived at the laboratory in the morning after fasting (≈8-h). One hour before the evaluations an individual breakfast was offered to the volunteers composed of 30% of daily caloric expenditure (Mifflin et al., 1990).
The graded exercise test (GXT) and SIT were performed on an electromagnetic cycle ergometer (Excalibur Sport, Lode, Netherlands). Before all tests, a 5-min warm-up at 30% of the maximal aerobic power (MAP) reached in the GXT was performed.
The study was divided into two sequenced and dependent parts (I and II).
Part-I was conducted in a double-blind, randomized, and placebo-controlled design. Firstly, a GXT was performed to determine the peak oxygen uptake ( O2peak) and the MAP. Five days after the GXT, two SIT sessions (SIT1 and SIT2) were performed, interspaced by 24-h of recovery (double SIT), to potentiate the stress on active muscle. The double SIT (i.e., set of 2 SIT sessions) was performed twice before each experimental condition (i.e., PBMT and placebo), separated by 5-days. Immediately after the double SIT (i.e., only post the SIT2), PBMT was applied in mode on (PBMT condition – CPBMT) or off (PLA condition – CPLA) in randomized and counterbalanced order. To ensure blinding in each experimental condition, participants were blindfolded and wore headphones to eliminate light and sound signals. A person not involved in any parts of the study applied the PBMT and randomization.
Part-II was conducted as a parallel-group trial, with GXT and SIT sessions identical to those reported in part-I; however, immediately after the double SIT (i.e., only post SIT2), the recovery interventions were composed of active recovery (AR; group AR – GAR) or cold-water immersion (CWI; group CWI- GCWI). Posteriorly, the CPBMT data recorded from part-I were used to compare with GAR and GCWI in part-II.
Venous blood sample collections were realized in the medial cubital vein at rest (i.e., baseline) and 0.5, 1, 24, 48, and 72-h after each recovery condition (part-I) or intervention (part-II) using vacutainer tubes of 10 and 4 mL (BD, Juiz de Fora, MG, Brazil) for inflammatory and muscle damage marker measurements. Capillary blood samples (25 μL) were collected from the earlobe 3, 5, and 7-min after GXT, and before, between intervals (i.e., 3rd-min after each Wingate test) and 5 and 7-min after each SIT session for measurement of lactate concentrations.
In parts I and II, CMJ performance and DOMS were evaluated at rest (i.e., baseline), and 24, 48, and 72-h after interventions.
Figure 1 presents the experimental design of studies-I and II.
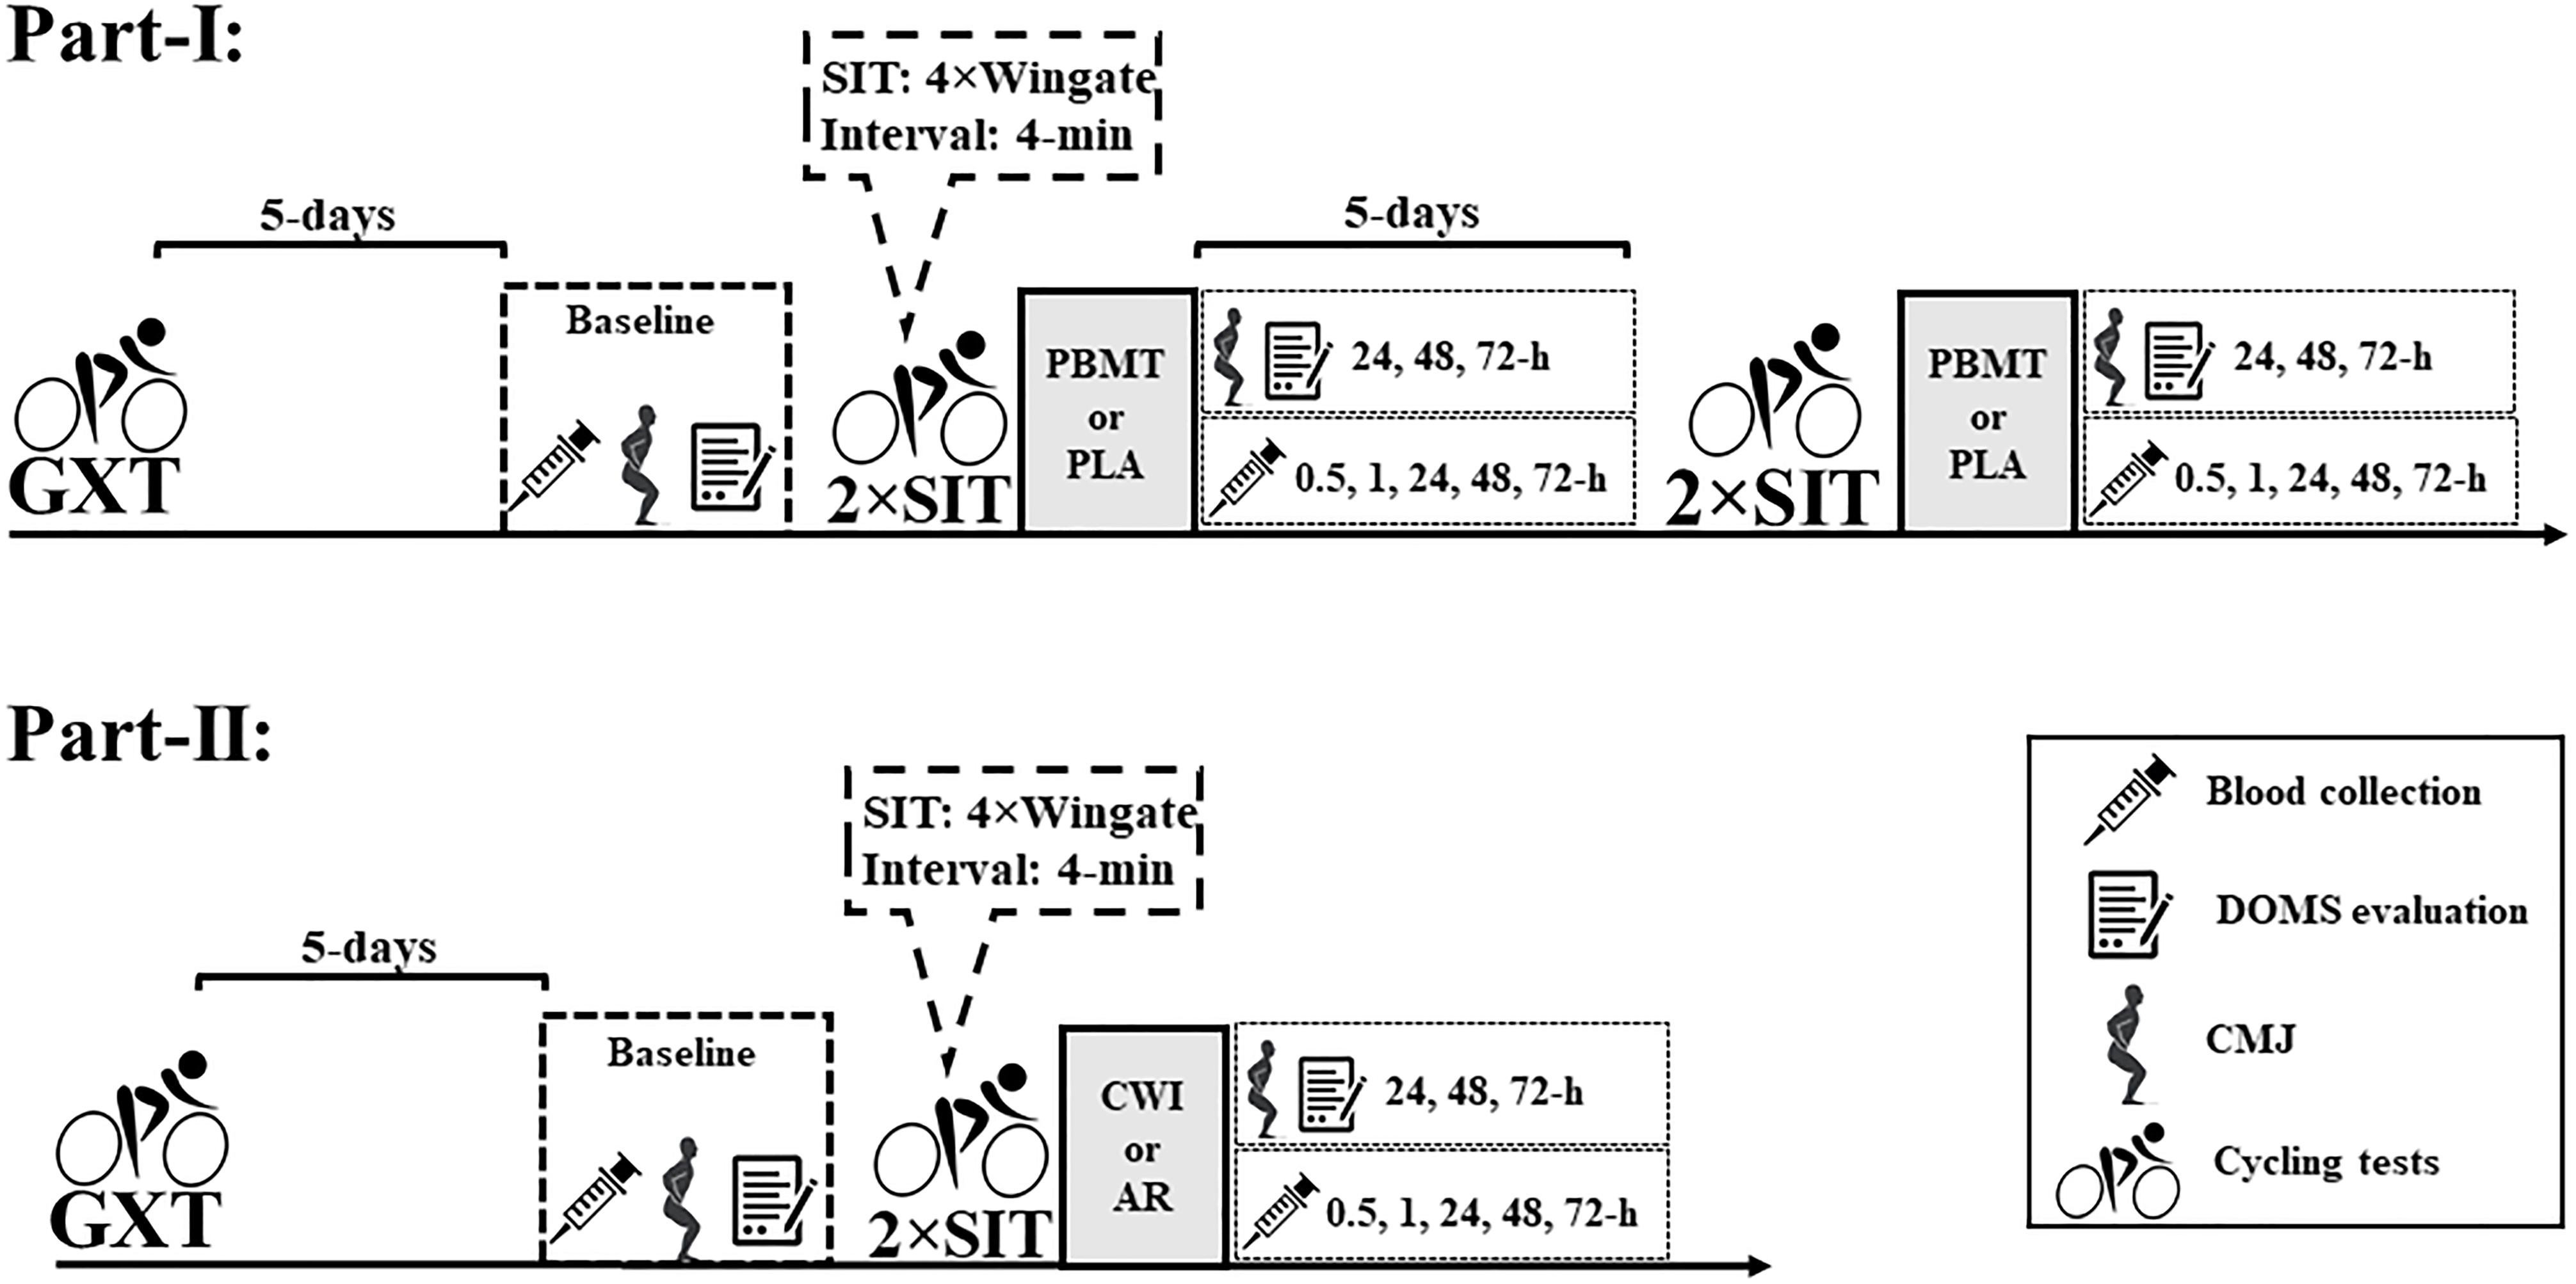
Figure 1. Experimental design of studies I and II. DOMS, delay onset muscle soreness; CMJ, countermovement jump; PBMT, photobiomodulation therapy; CWI, cold-water immersion; AR, active recovery; PLA, placebo; GXT, graded exercise test; 2 × SIT, double sprint interval training.
Graded Exercise Test
Graded exercise test was performed to determine the O2peak and MAP, starting at 75 W, with a 25 W increment every 2-min until exhaustion (Howley et al., 1995; Ozyener et al., 2001), measured at 670-m above sea level. During GXT, respiratory responses were registered breath-by-breath using a gas analyzer (Quark CPET, COSMED, Italy), previously calibrated in accordance with the manufacturer’s instructions. Data were smoothed every 10-points and interpolated every 1-s using the software OriginPro 8.0 (OriginLab Corporation, United States). For O2peak determination, the oxygen uptake (O2) mean of the final 20-s of each stage was determined and the O2peak was assumed as the highest O2 mean reached in the GXT. MAP was recorded and considered the highest exercise power performed during the test.
Sprint Interval Training Session
The double SIT comprised two SIT sessions interspaced by 24-h, mimicking the accumulated effects of two consecutive training days. Each SIT constituted four Wingate tests (i.e., 30-s at 0.7 Nm⋅kg-1) with a 4-min recovery between bouts (Burgomaster et al., 2005). In the first minute of recovery time an active recovery at 30% of MAP and ≈75–80 rpm was performed to minimized is comfort, while the additional recovery time (i.e., 3-min) was composed of passive recovery (Gibala et al., 2012). The SIT protocol was controlled using Wingate 1.11 software (Lode, Netherlands) which enabled measurement of bout work (BW), peak power (PP), and mean power (MP). Workload performed during the double SIT was assumed as the sum of all work performed during the Wingate tests (total work – TT). In a previous study performed in our laboratory, the SIT showed good reliability of TT 7-days after a first session (ICC = 0.89) (Malta et al., 2018). The SIT performance parameters were measured to ensure that the volunteers were submitted to the same exercise effort in both study parts.
CMJ and DOMS Measurements
To evaluate the symptoms of inflammation (i.e., muscle functional limitation and DOMS), the CMJ and DOMS were measured. CMJ was composed of 3 maximal jump trials interspaced by 1-min of passive recovery. Volunteers were instructed to remain with hands on hips and flex the knees quickly to 90° to jump. To assess the jump height, a jump platform was used (Jump test, Cefise, Brazil) and the highest jump was considered. This configuration of CMJ test was chosen as it does not influence blood cytokines or muscle damage markers. In addition, DOMS perception was assessed using a VAS consisting of a 100 mm line, on which the “0” represents “no pain” and “100” “very painful” (Carlsson, 1983). For greater leg pain perception, the scale was applied during low-intensity pedaling (Borges et al., 2013). In the present study, CMJ and DOMS values are presented as change related to baseline (Δ), being described using the variable acronym plus the “Δ” (i.e., CMJΔ and DOMSΔ).
Recovery Methods
Photobiomodulation therapy was applied using a cluster multi-diode containing 104 LED (THOR-LX2, THOR Photomedicine Ltd., United Kingdom). The PBMT protocol had an overall duration of 2.5-min, with application in both legs simultaneously. LED irradiation was performed in two regions of the quadriceps muscle, two regions of the biceps femoris, and one region between the soleus and gastrocnemius muscles, following the distribution axis of the muscle fibers. The interventions were performed using the spot method, with direct contact (i.e., 90° angle) of the equipment on the skin surface. The technical parameters of PBMT and location of LED irradiation are shown in Figure 2.
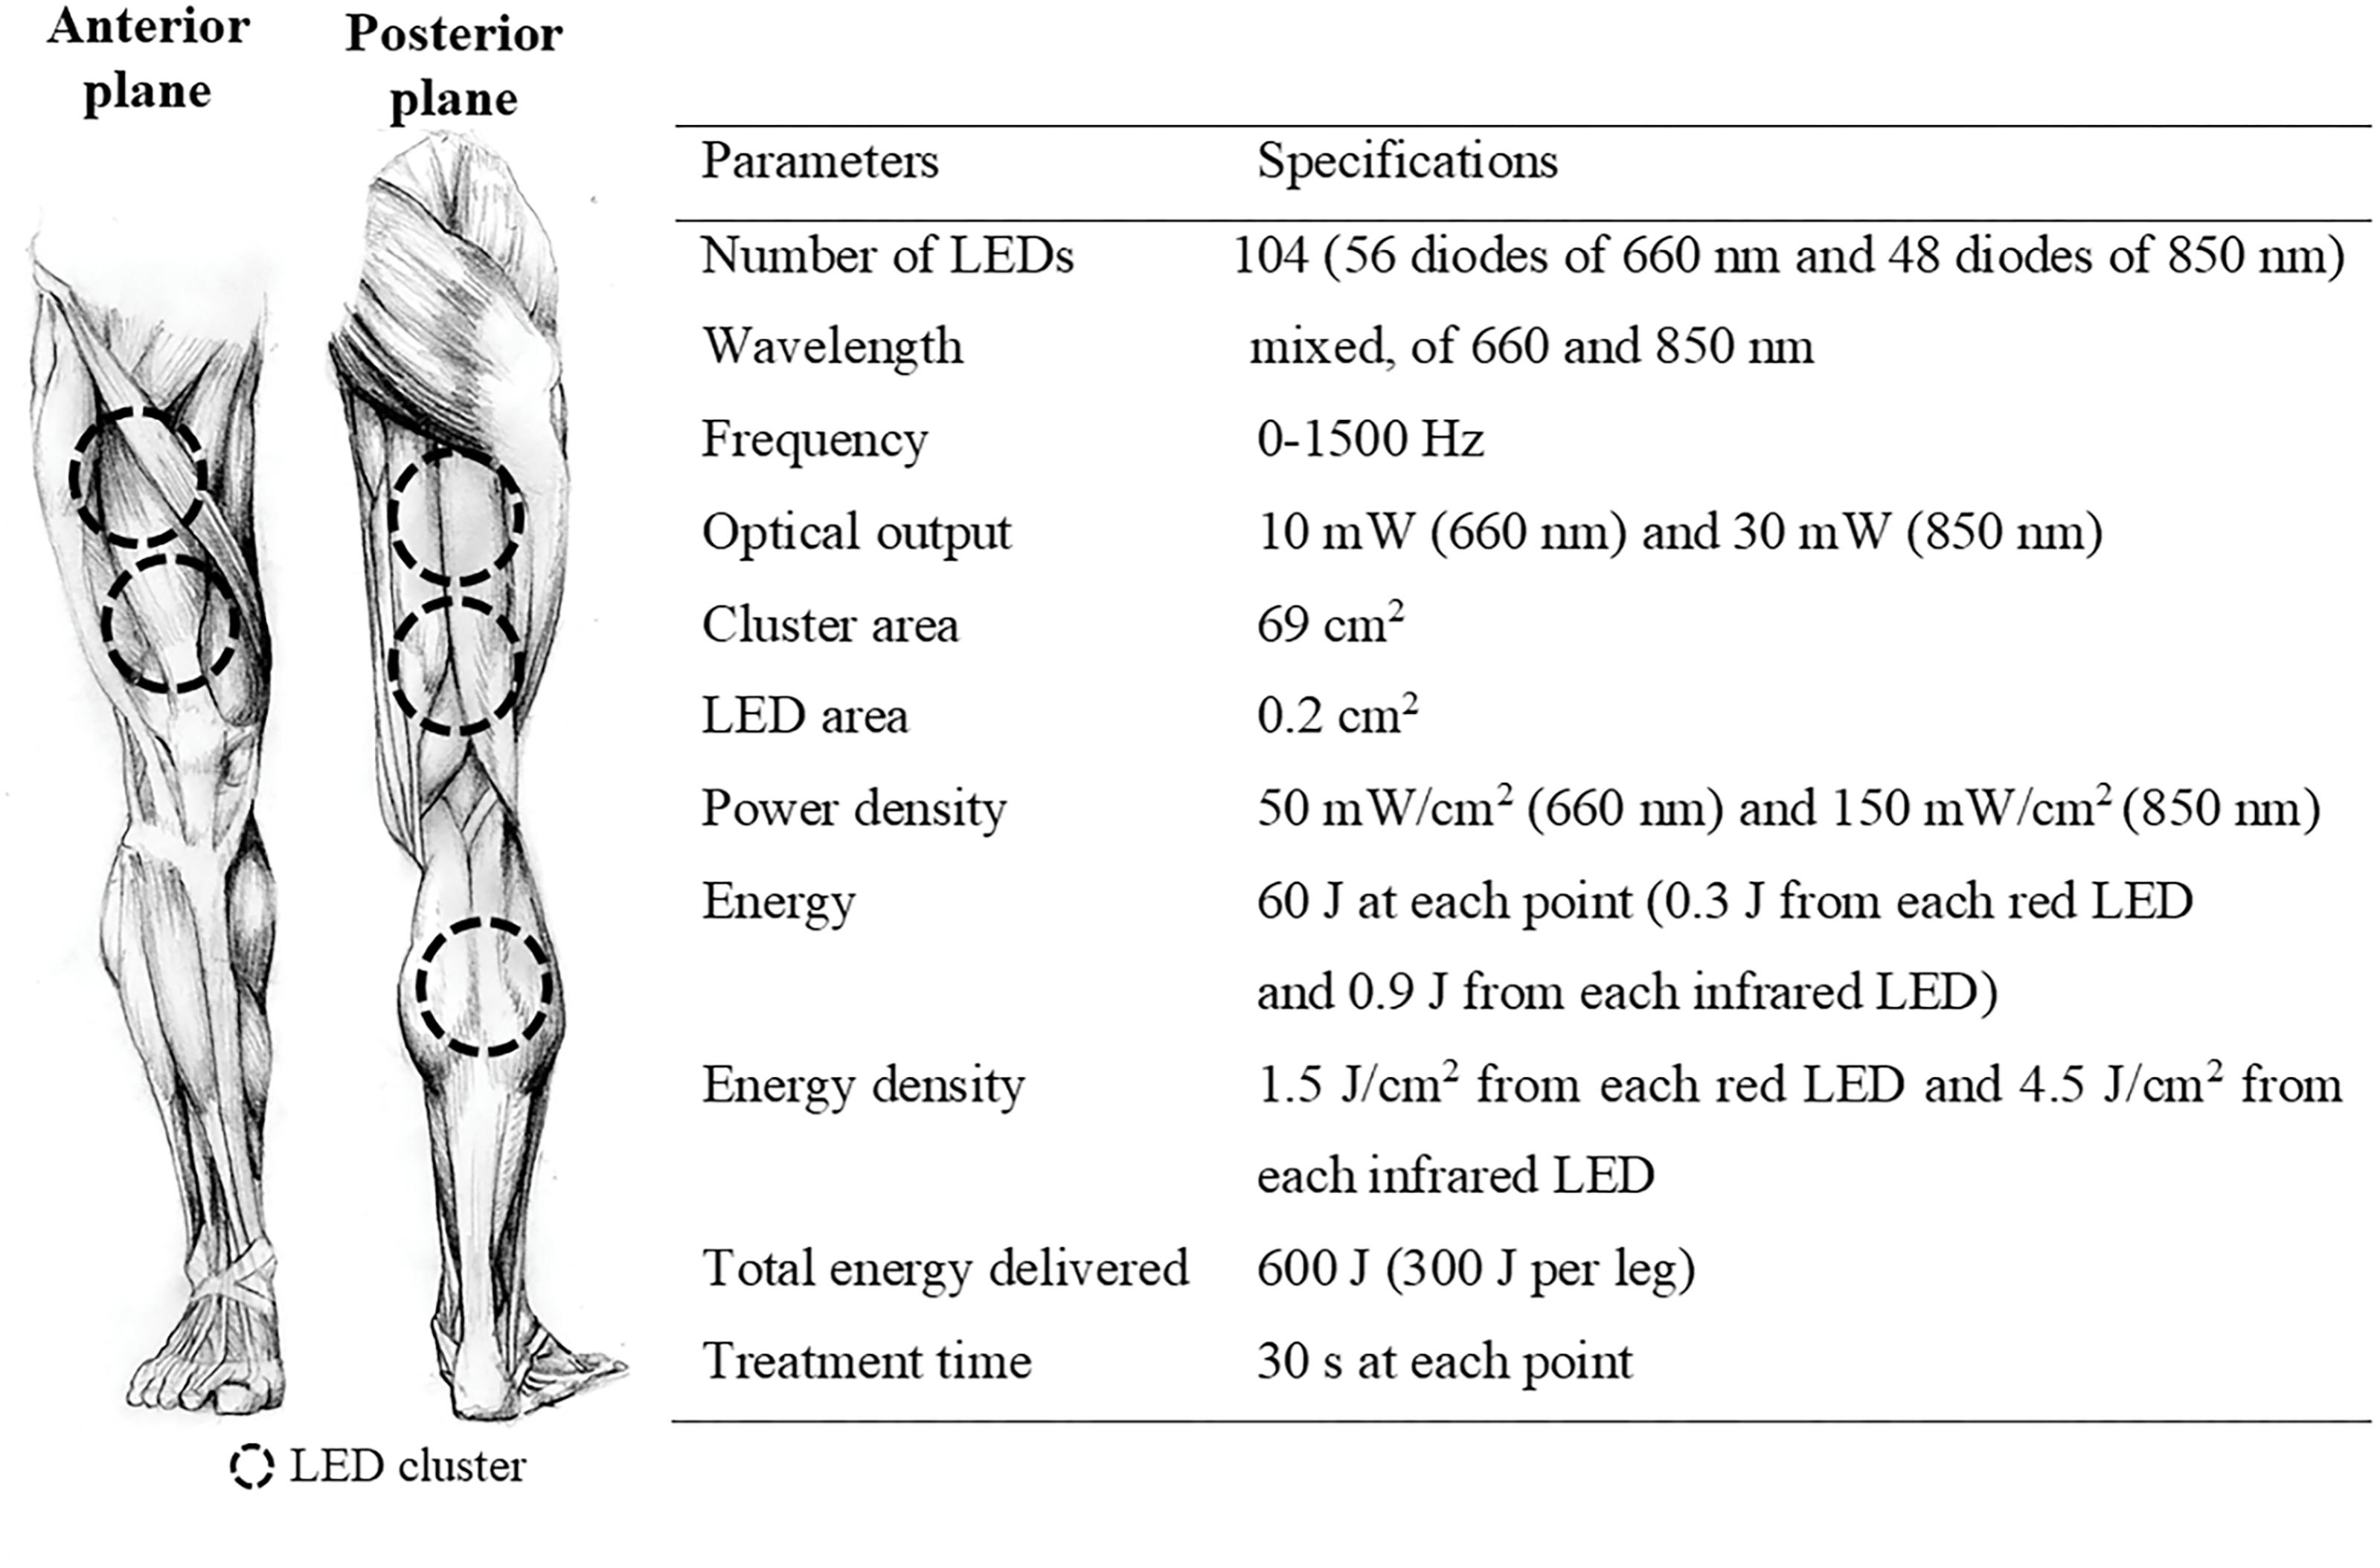
Figure 2. Technical parameters of PBMT and location of LED irradiation. LED, light emitting diode.
Active recovery and CWI were applied only in part-II. AR was performed on a cycle ergometer, immediately after the double SIT, with a duration of 15-min and intensity corresponding to 50% of MAP (Wigernaes et al., 2001). During AR, a cadence of ≈75 rpm was maintained. The partial CWI, to the waist, was performed immediately after the double SIT with the volunteers sitting in an immersion bath containing 200 L of water, at 10°C for 10-min (Machado et al., 2016). The temperature was set using an auto-cooling system, controlled by a digital thermostat (TIC17RGTi, ES Full Gauge, United States), triggered when the water temperature increased 0.1°C.
Blood Sample Analysis
Capillary blood samples were deposited into microtubes containing 50 μL of sodium fluoride at 1% and analyzed in an electrochemical analyzer (YSI 2300 Stat Plus, Yellow Springs Instruments, United States) for determination of lactate concentrations. According to the manufacturer, the equipment has a measurement error of ±2%.
Venous blood samples were centrifuged for 10-min at 1306 g and 4°C (Vision scientific, VS-15000FNII, SKR) for extraction of plasma and serum. Plasmatic cytokines (IL-10 and TNFα) were assessed using ELISA commercial kits (Affymetrix, eBioscience, United States; Lot: IL-10 4295480; TNFα 4298657). Plates were read using a spectrophotometer, SpectraMax Plus 384 (Molecular Devices, United States). Serum CK and LDH concentrations were assessed through a kinetic method using a random-access analyzer (A-15, Biosystems S.A., Spain) and commercial kits (Biosystems S.A., Spain; Lot: CK 13869; LDH 09998).
Considering the great individual variation in CK, LDH, IL-10, and TNFα blood concentrations, in the present study the blood markers are presented as percentage difference to baseline (Δ%), being described using the variable abbreviation plus the “Δ%” (i.e., CKΔ%, LDHΔ%, IL-10Δ%, and TNFαΔ%). The integrals of CK, LDH, IL-10, and TNFα (i.e., area under the curve considering its concentration and the evaluation time) were calculated using the software OriginPro 8.0 (OriginLab Corporation, United States) to test whether exposure to inflammation and muscle damage were affected by recovery methods (Krzanowski and Hand, 2009). In addition, peak concentration of CK, LDH, IL-10, and TNFα (i.e., highest value obtained between 0.5 and 72-h) were calculated to measure the magnitude of increase.
Statistical Analysis
Statistical analyses were performed using the software package SPSS version 23.0 (IBM Corp., Armonk, NY, United States). Data are presented as means and standard deviations (mean ± SD). The normality of the data was confirmed using the Shapiro-Wilk test. In both parts (e.g., I and II), to compare the CKΔ%, LDHΔ%, IL-10Δ%, and TNFαΔ% blood concentrations, DOMSΔ and CMJΔ performance between moments (i.e., main time effect) and between and within-conditions and groups (i.e., interaction time∗groups) a two-way repeated measure ANOVA was used and a SIDAK post hoc was applied when necessary. Mauchly’s sphericity test was used in all ANOVA analyzes, and in cases of sphericity violation, the F and significance corrected by Greenhouse-Geisser were assumed. Only in part-I, the paired t-test was used to compare the means of SIT total work, integral, and peak blood concentration of CKΔ%, LDHΔ%, IL-10Δ%, and TNFαΔ% (i.e., CPBMT × CPLA). In addition, the t-test was also used to compare peak lactate concentrations which were measured two times for each condition (i.e., CPBMT SIT1 × SIT1 CPLA and CPBMT SIT2 × SIT2 CPLA). In part-II, the ANOVA one-way test was used to compare peak lactate concentrations, MAP, O2peak, and integral and peak blood markers between groups (i.e., CPBMT, GAR, and GCWI). In both parts (e.g., I and II), SIT total work and peak lactate concentration were compared to verify similar exercise-induced workload and metabolic stress. In all cases, a significance level of 5% was assumed.
Results
Part-I and II: GXT and SIT Outcomes
In part-I, the O2peak and MAP reached in the GXT were 40.0 ± 5.7 mL⋅kg-1⋅min-1 and 210.4 ± 29.1 W, respectively. The double SIT total work (i.e., SIT1 and SIT2 work sum) for CPBMT and CPLA were 96.4 ± 13.4 and 99.5 ± 13.9 kJ, respectively. In addition, the peak lactate concentrations reached in SIT for CPBMT and CPLA were 14.1 ± 2.7 and 14.4 ± 2.0 (SIT1), 13.9 ± 2.9, and 14.2 ± 2.0 mmol⋅L-1 (SIT2), respectively. No differences between CPLA and CPBMT were verified in double SIT total work [P = 0.941, t(11) = -0.075] or peak lactate concentration reached after SIT sessions [SIT1: P = 0.479, t(9) = -0.738; SIT2: P = 0.666; t(11) = -0.444].
In part-II, there were no significant differences between the anthropometric characteristics of the volunteers [P ≥ 0.136; F(2,33) ≤ 2.123] (Table 1). The O2peak reached in GXT for GAR and GCWI were 41.9 ± 5.0, 38.1 ± 6.5 mL⋅kg-1⋅min-1, while MAP values were 218.8 ± 45.4 and 214.6 ± 45.8 W, respectively. No significant differences were verified between groups (i.e., CPBMT, GAR, and GCWI) in O2peak [P = 0.306; F(2,33) = 1.229] and MAP [P = 0.883; F(2,33) = 0.125] reached in the GXT. The SIT total work for GAR and GCWI were 103.1 ± 25.8, and 99.6 ± 21.8 kJ. In addition, the peak lactate concentrations reached in SIT for GAR and GCWI were 14.7 ± 1.2 and 14.3 ± 0.9 mmol⋅L-1 (SIT1), and 14.0 ± 1.4 and 13.5 ± 1.4 mmol⋅L-1 (SIT2), respectively. No differences between CPBMT, GAR, and GCWI were verified in double SIT total work [P = 0.874; F(2,33) = 135] and peak lactate concentration reached after the SIT session [SIT1: P = 0.859; F(2,31) = 0.152 and SIT2: P = 0.889; F(2,33) = 0.118].
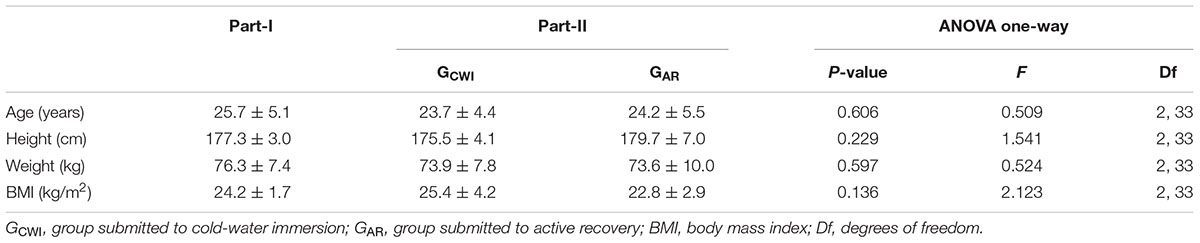
Table 1. Anthropometric characteristics of the volunteers.
Additional performance parameters (i.e., BW, PP, and MP) and lactate kinetics before and during, and the peak reached after double SIT sessions for parts I and II are shown in Supplementary Figures S1, S2, respectively.
Part-I: Recovery Outcomes
There was a time effect showing kinetic changes in some blood markers, independent of the treatment, but no effect for TNFαΔ% blood concentration [P = 0.668; F(4,32) = 0.324]. The LDHΔ% increased at 0.5-h compared to 24, 48, and 72-h [P = 0.000; F(4,36) = 7.035; post hoc P ≤ 0.030]. The CKΔ% decreased over time at 72-h compared with 0.5-h [P = 0.043; F(4,40) = 2.716; post hoc P = 0.021]. The IL-10Δ% also decreased over time at 24 and 72-h compared with 1-h [P = 0.035; F(4,40) = 3.944; post hoc P ≤ 0.048]. Contrarily, there were no interactions (i.e., interaction time∗groups) between CPBMT and CPLA for any blood markers [P ≥ 0.313; F(4,32) ≤ 1.327] (Figure 3). The part-I absolute values of CK, LDH, IL-10, and TNFα blood concentrations are presented in Supplementary Table S1.
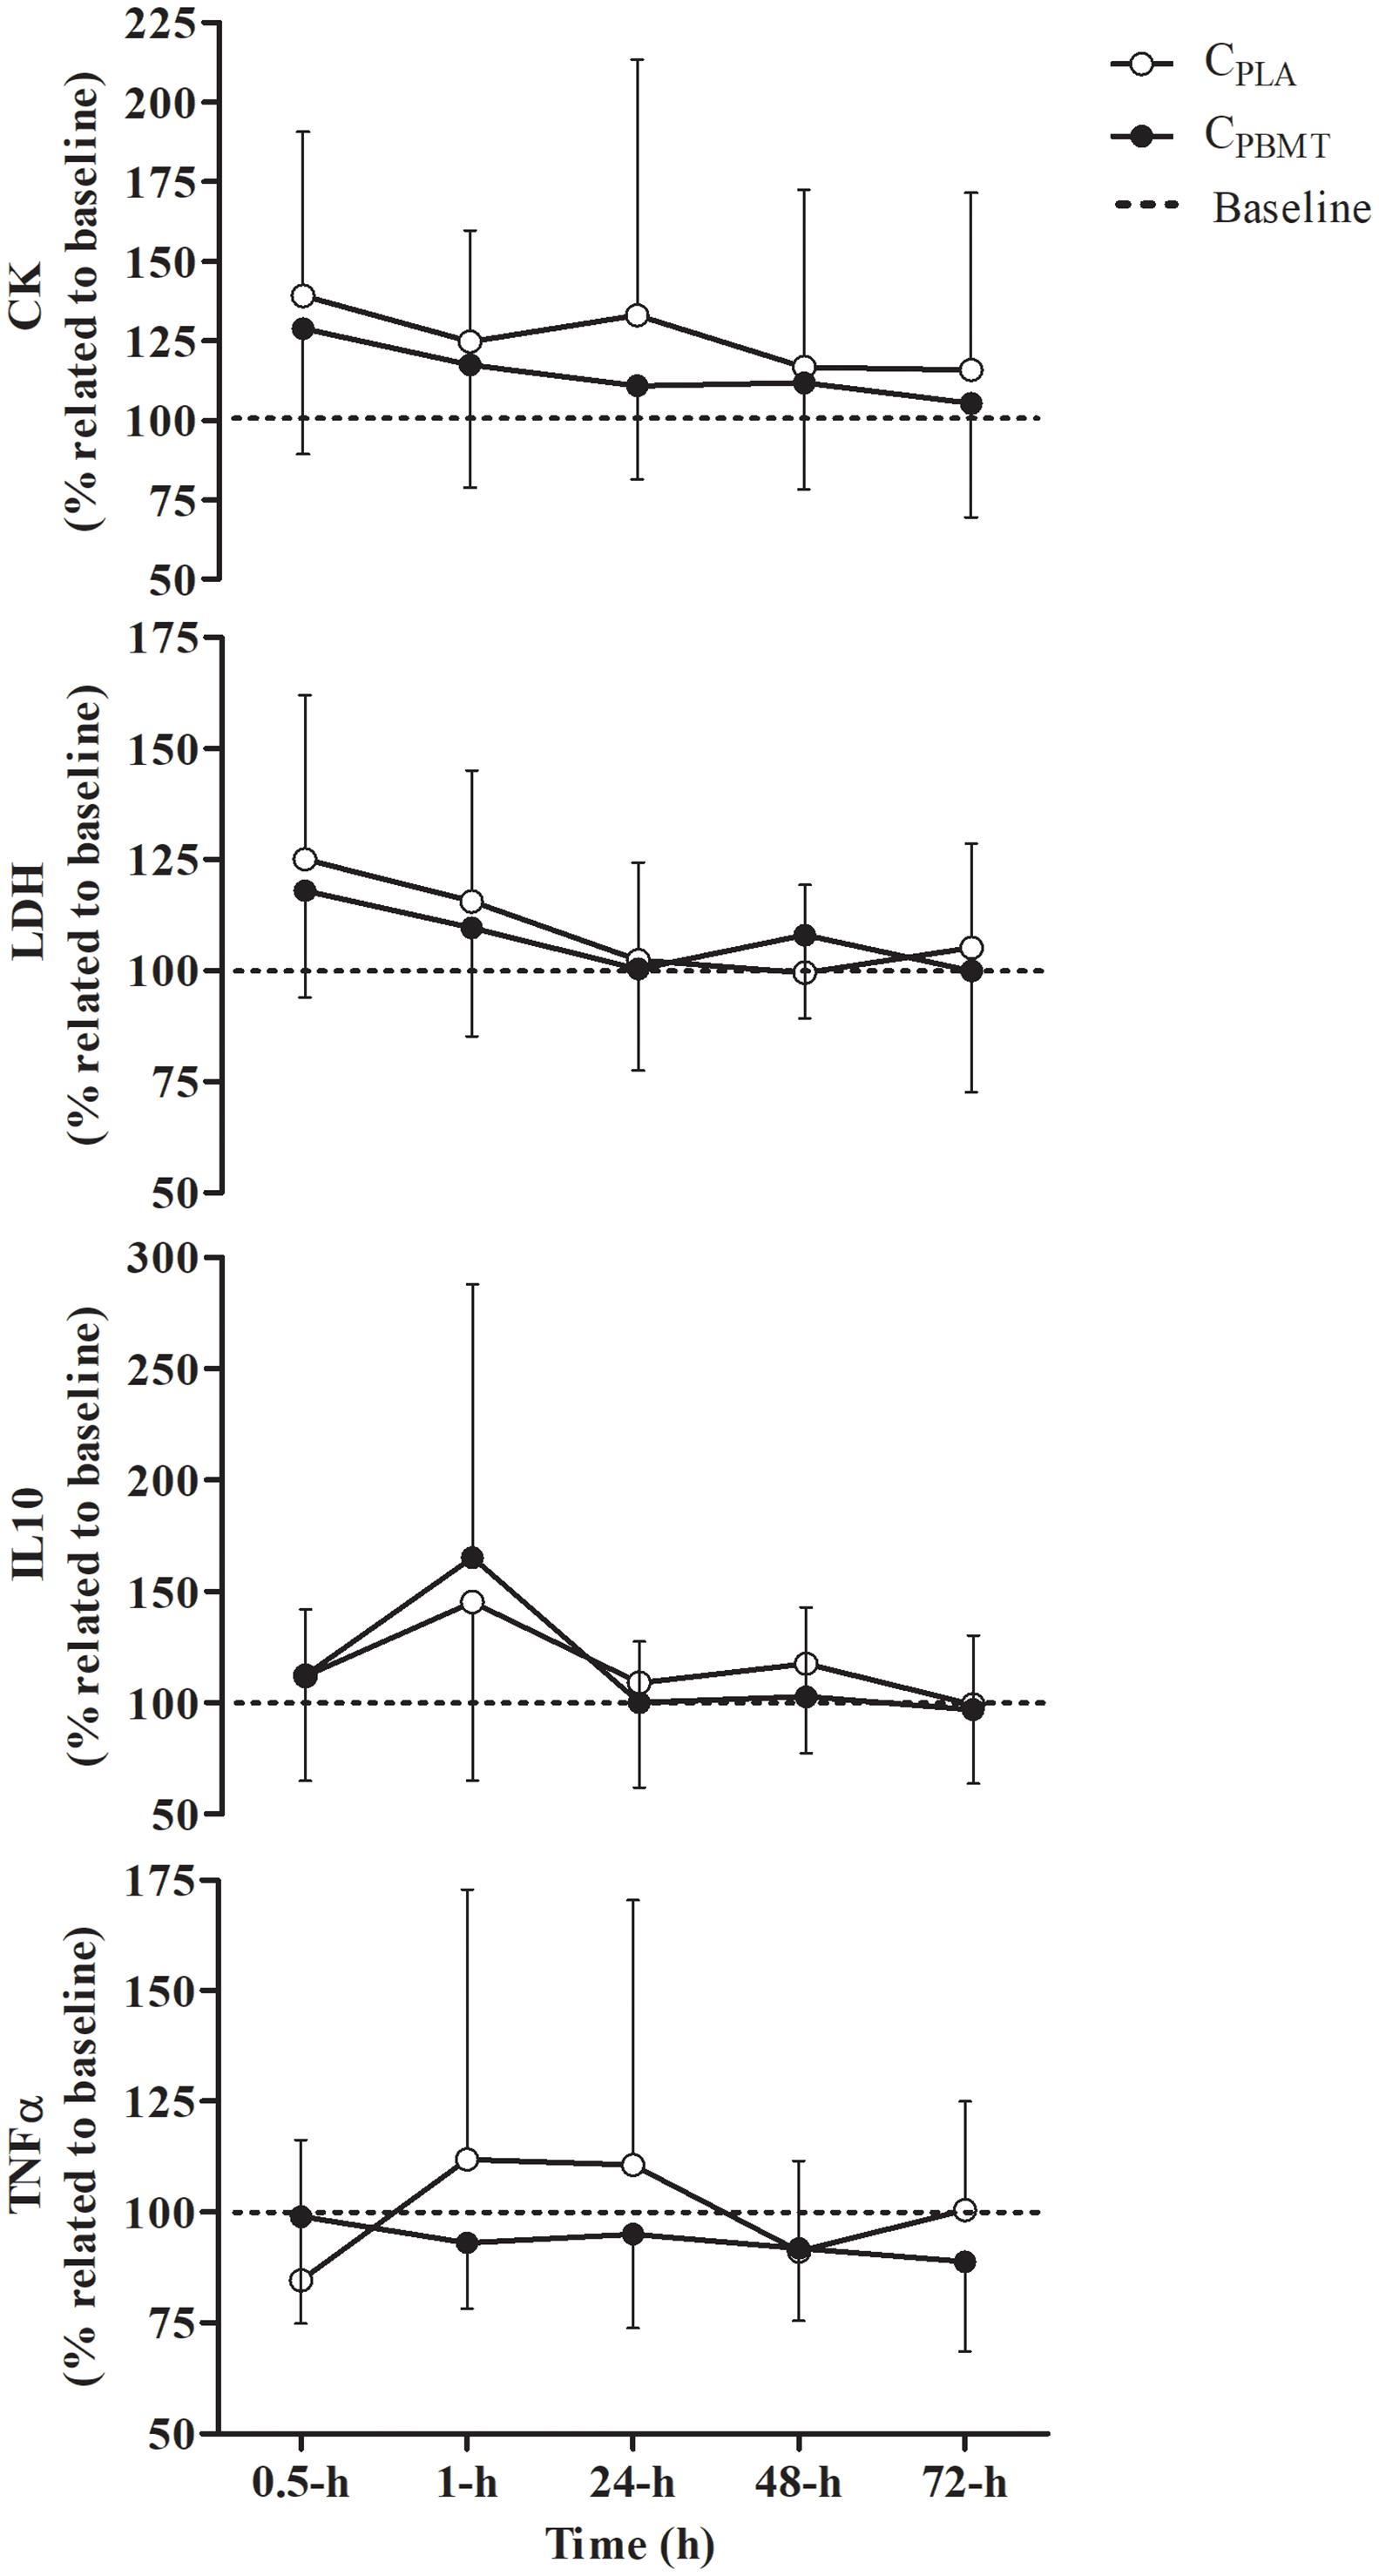
Figure 3. Blood concentration of IL-10Δ%, TNFαΔ%, CKΔ%, and LDHΔ% (mean ± SD) for CPBMT and CPLA. IL-10Δ%, interleukin 10 expressed as percentage difference to baseline; TNFαΔ%, tumor necrosis factor alpha expressed as percentage difference to baseline; CKΔ%, creatine kinase expressed as percentage difference to baseline; LDHΔ%, lactate dehydrogenase expressed as percentage difference to baseline; CPBMT, photobiomodulation therapy condition; CPLA, placebo condition.
Table 2 presents the peak and integral values of CKΔ%, LDHΔ%, IL-10Δ%, and TNFαΔ% reached in CPBMT and CPLA. For all blood markers, there were no significant differences between CPBMT and CPLA for peak [P ≥ 0.104; t(11) = -1.774] or integral values [P ≥ 0.370; t(8) = -0.950].
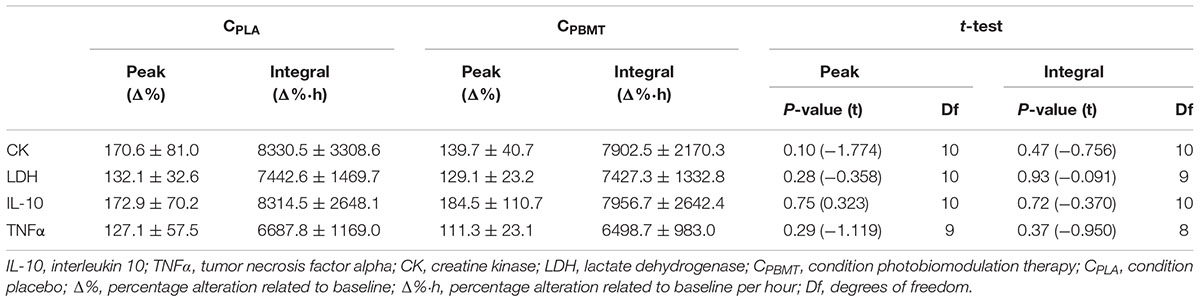
Table 2. Comparison between CPBMT and CPLA for peak and integral values of CK, LDH, IL-10, and TNFα.
For DOMSΔ, a time effect was found for DOMSΔ that decreased at 72-h compared with 24-h [P = 0.012; F(2,22) = 7.263; post hoc P = 0.043], however, there were no interactions (i.e., interaction time∗groups) between CPBMT and CPLA at the same moments as for DOMSΔ [P = 0.052; F(2,22) = 4.298] and for CMJΔ [P = 0.295; F(2,22) = 1.289] (Figure 4).
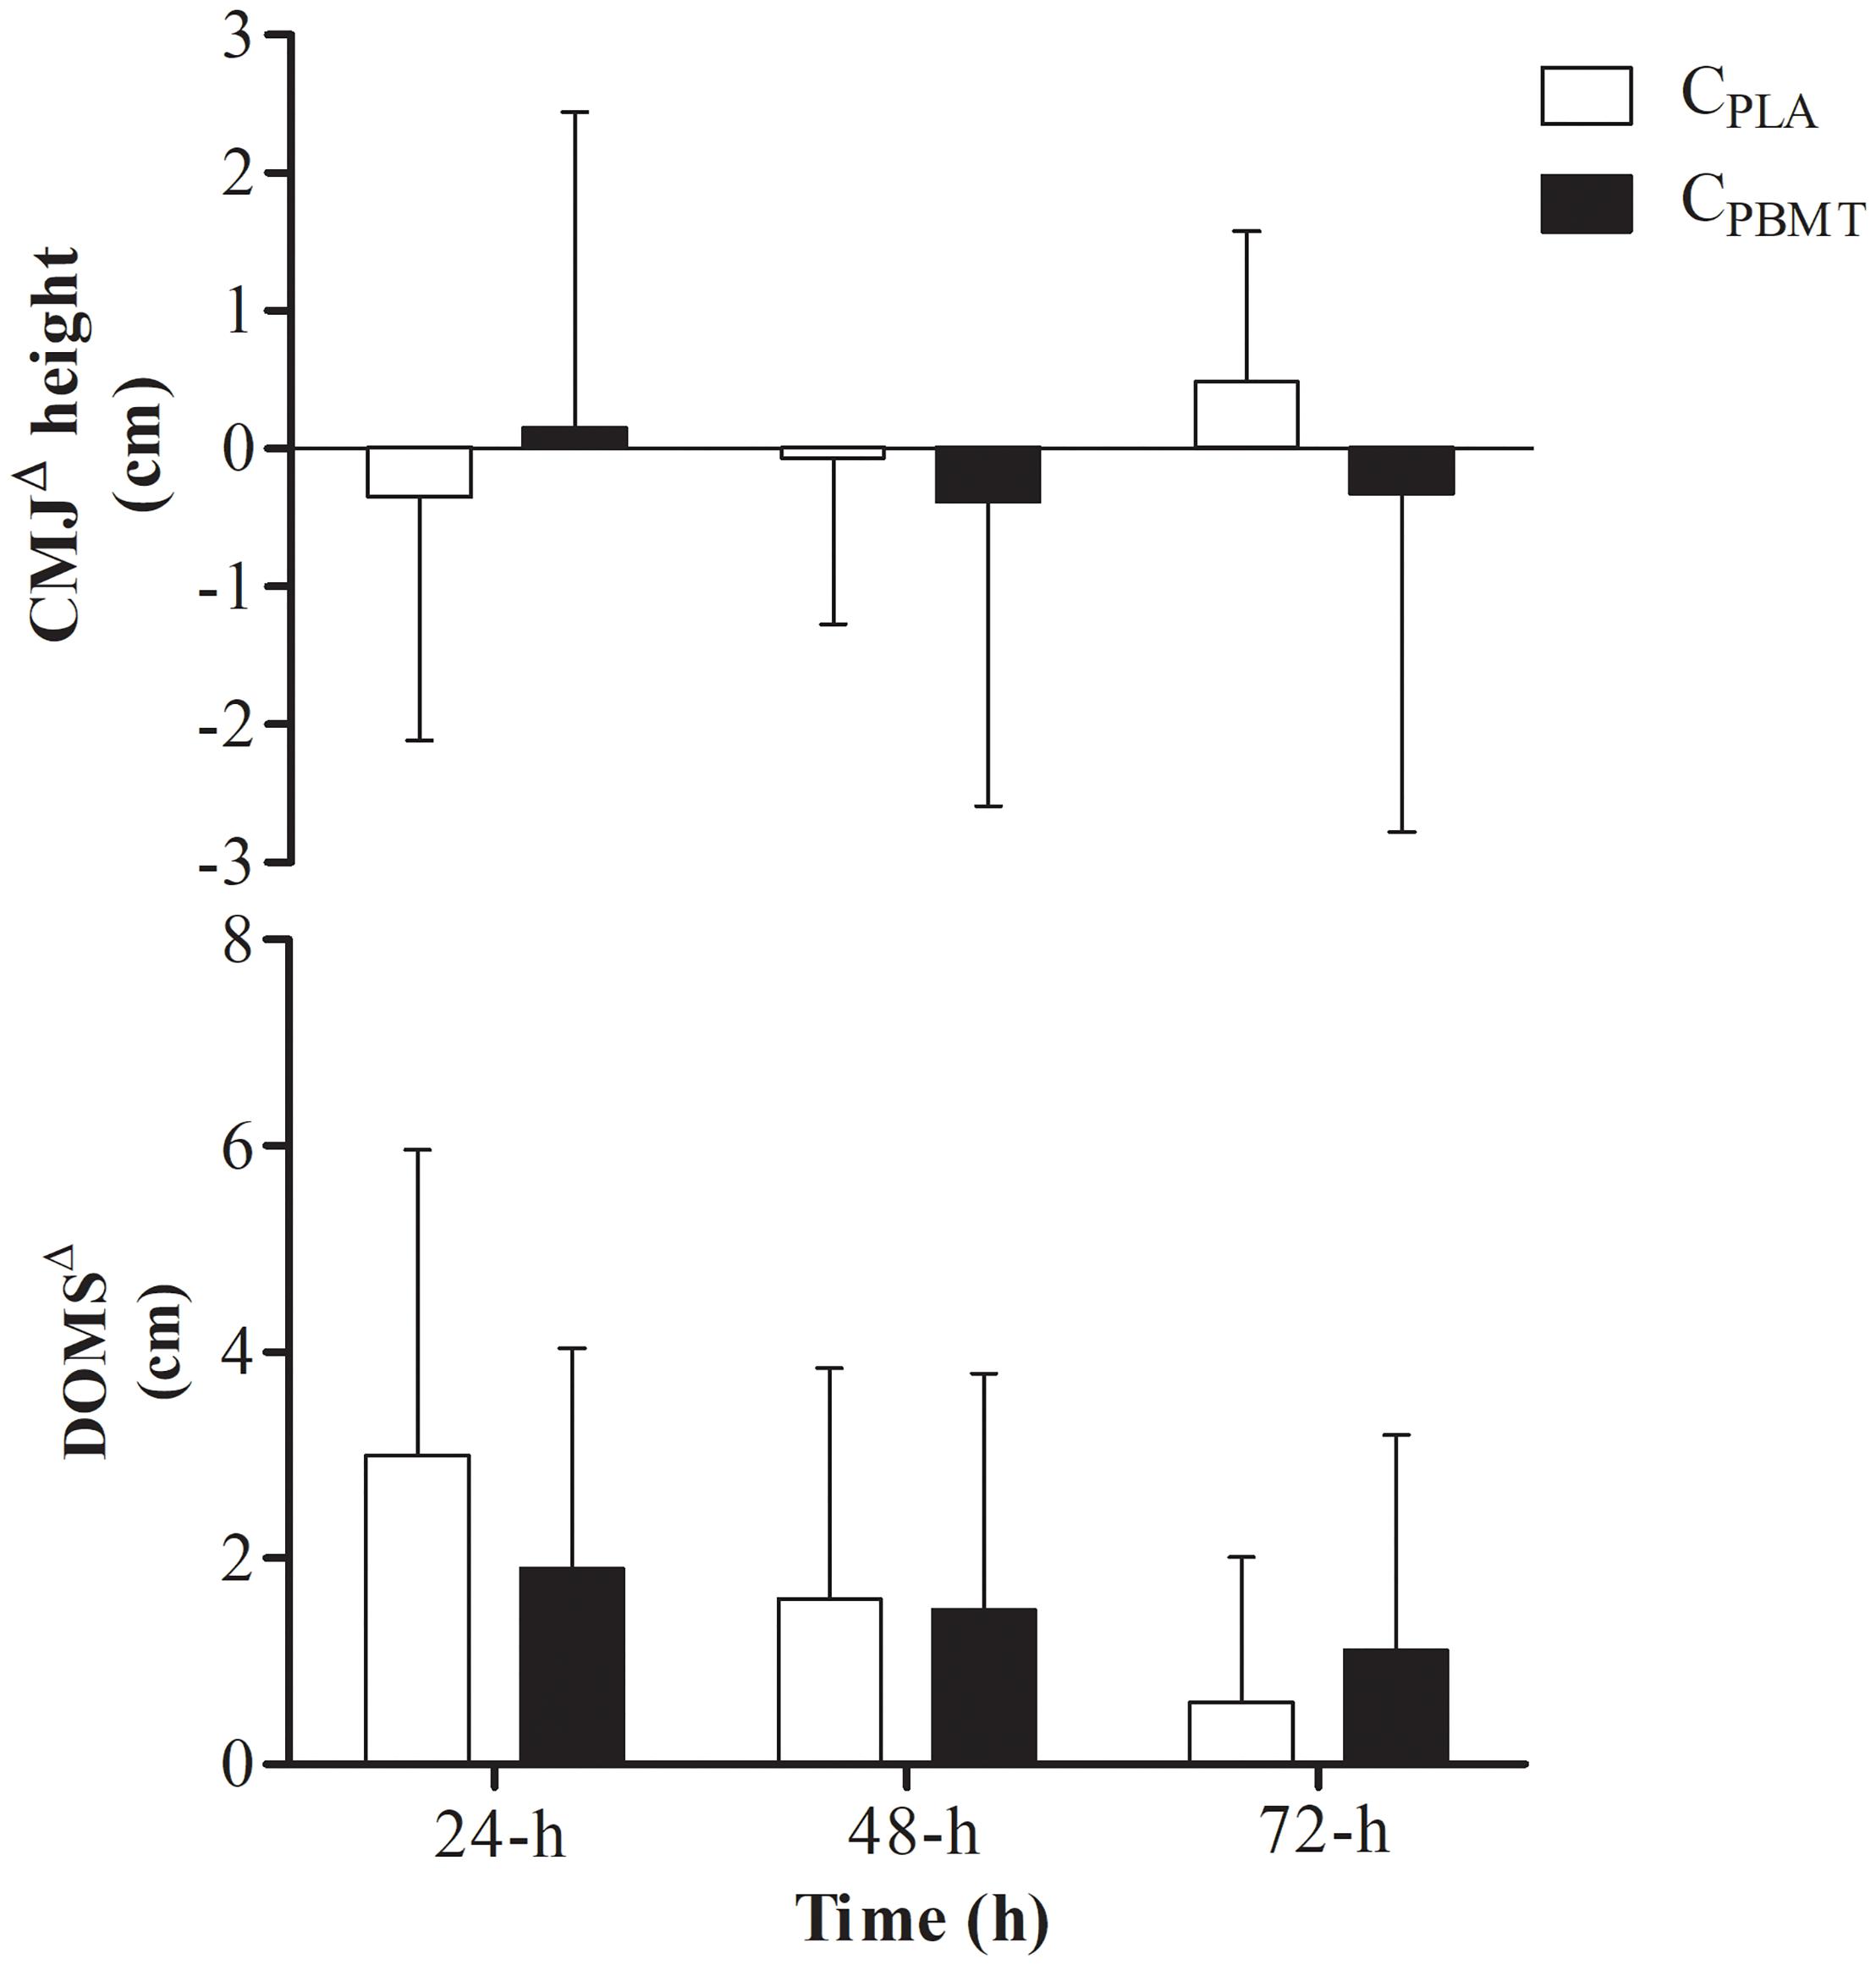
Figure 4. DOMSΔ performance and DOMSΔ for GPBMT and GPLA at 24, 48, and 72-h after double SIT session. DOMSΔ, delay onset muscle soreness expressed as difference to baseline; CMJΔ, countermovement jump performance expressed as difference to baseline; CPBMT, condition photobiomodulation therapy; CPLA, condition placebo.
Part-II: Recovery Outcomes
A time effect was found for CKΔ% and IL-10Δ%, but not for LDHΔ% and TNFαΔ% blood concentrations. CKΔ% increased at 0.5, 1, and 48-h compared with 72-h, and increased at 0.5-h compared with 24-h [P = 0.003; F(8,104) = 5.393; post hoc P ≤ 0.023]. In addition, IL-10Δ% increased over time at 1-h compared with 24 and 48-h [P = 0.003; F(8,108) = 7.568; post hoc P = 0.048]. However, there were no interactions (i.e., interaction time∗groups) between CPBMT, GAR, and GCWI for all markers at the same moments [P ≥ 0.189; F(8,80) ≤ 1.568] (Figure 5). The part-II absolute values of CK, LDH, IL-10, and TNFα blood concentrations are presented in Supplementary Table S2.
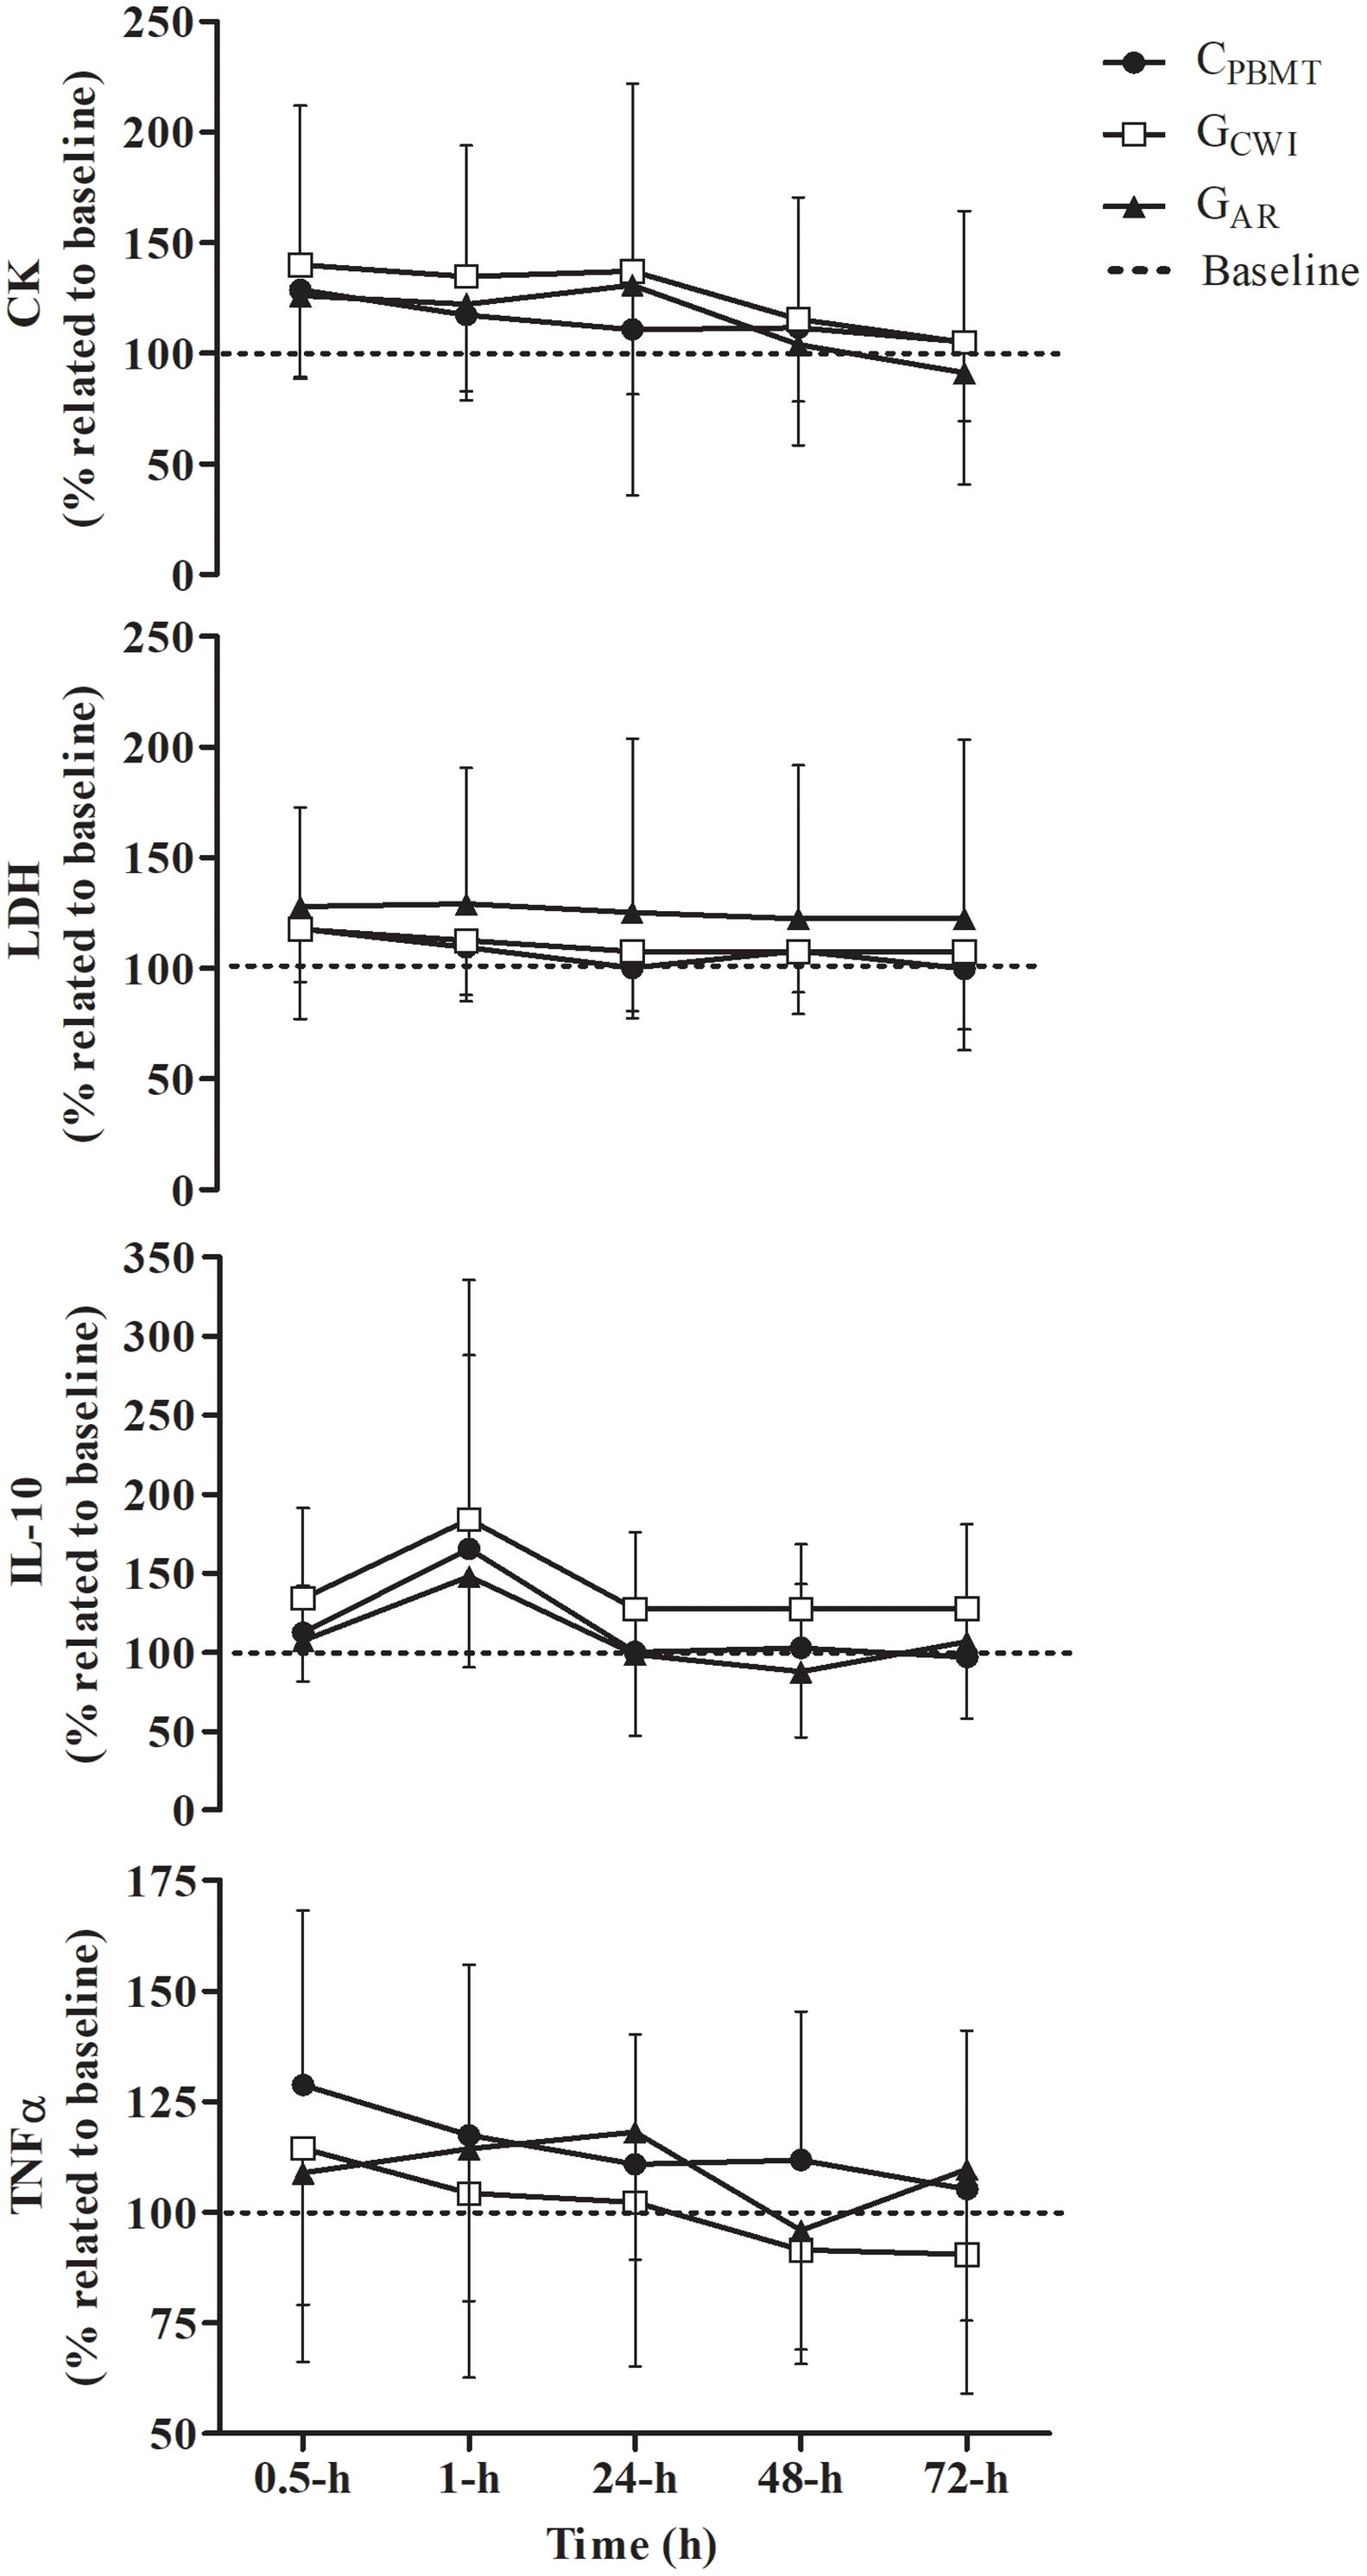
Figure 5. Blood concentration of IL-10Δ%, TNFαΔ%, CKΔ%, and LDHΔ% (mean ± SD) for CPBMT, GAR, and GCWI. IL-10Δ%, interleukin 10 expressed as percentage difference to baseline; TNFαΔ%, tumor necrosis factor alpha presented as percentage difference to baseline; CKΔ%, creatine kinase expressed as percentage difference to baseline; LDHΔ%, lactate dehydrogenase expressed as percentage difference to baseline; CPBMT, condition photobiomodulation therapy; GCWI, group submitted to cold-water immersion; GAR, group submitted to active recovery.
Table 3 presents the peak and integral values of CKΔ%, LDHΔ%, IL-10Δ%, and TNFαΔ% reached in CPBMT, GAR, and GCWI. For all blood markers, there were no significant differences between CPBMT, GAR, and GCWI for peak [P ≥ 0.193; F(2,31) ≤ 1.734] and integral values [P ≥ 0.224; F(2,28) ≤ 1.578].
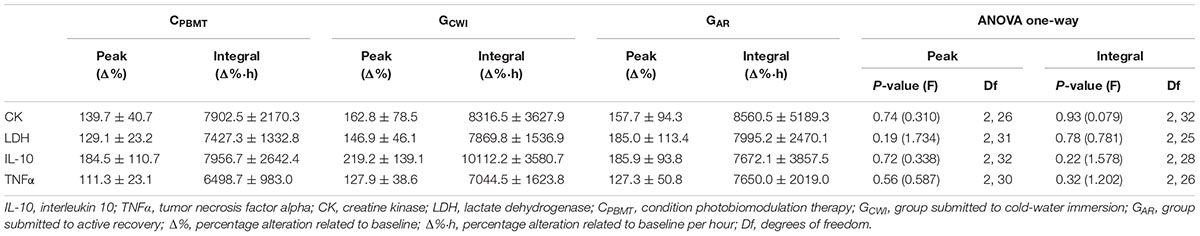
Table 3. Comparison between CPBMT, GCWI, and GAR for peak and integral values of CK, LDH, IL-10, and TNFα.
Similar results were found for DOMSΔ and CMJΔ. There was a time effect for DOMSΔ [i.e., DOMSΔ decreased at 48 and 72-h compared with 24-h] [P = 0.001; F(4,62) = 11.478; post hoc P ≤ 0.005], but not for CMJΔ [P = 0.253; F(4,62) = 1.404], while no interaction was found between groups for either parameter [P = 0.314; F(4,62) = 1.215 and P = 0.264; F(4,62) = 1.343, respectively] (Figure 6).
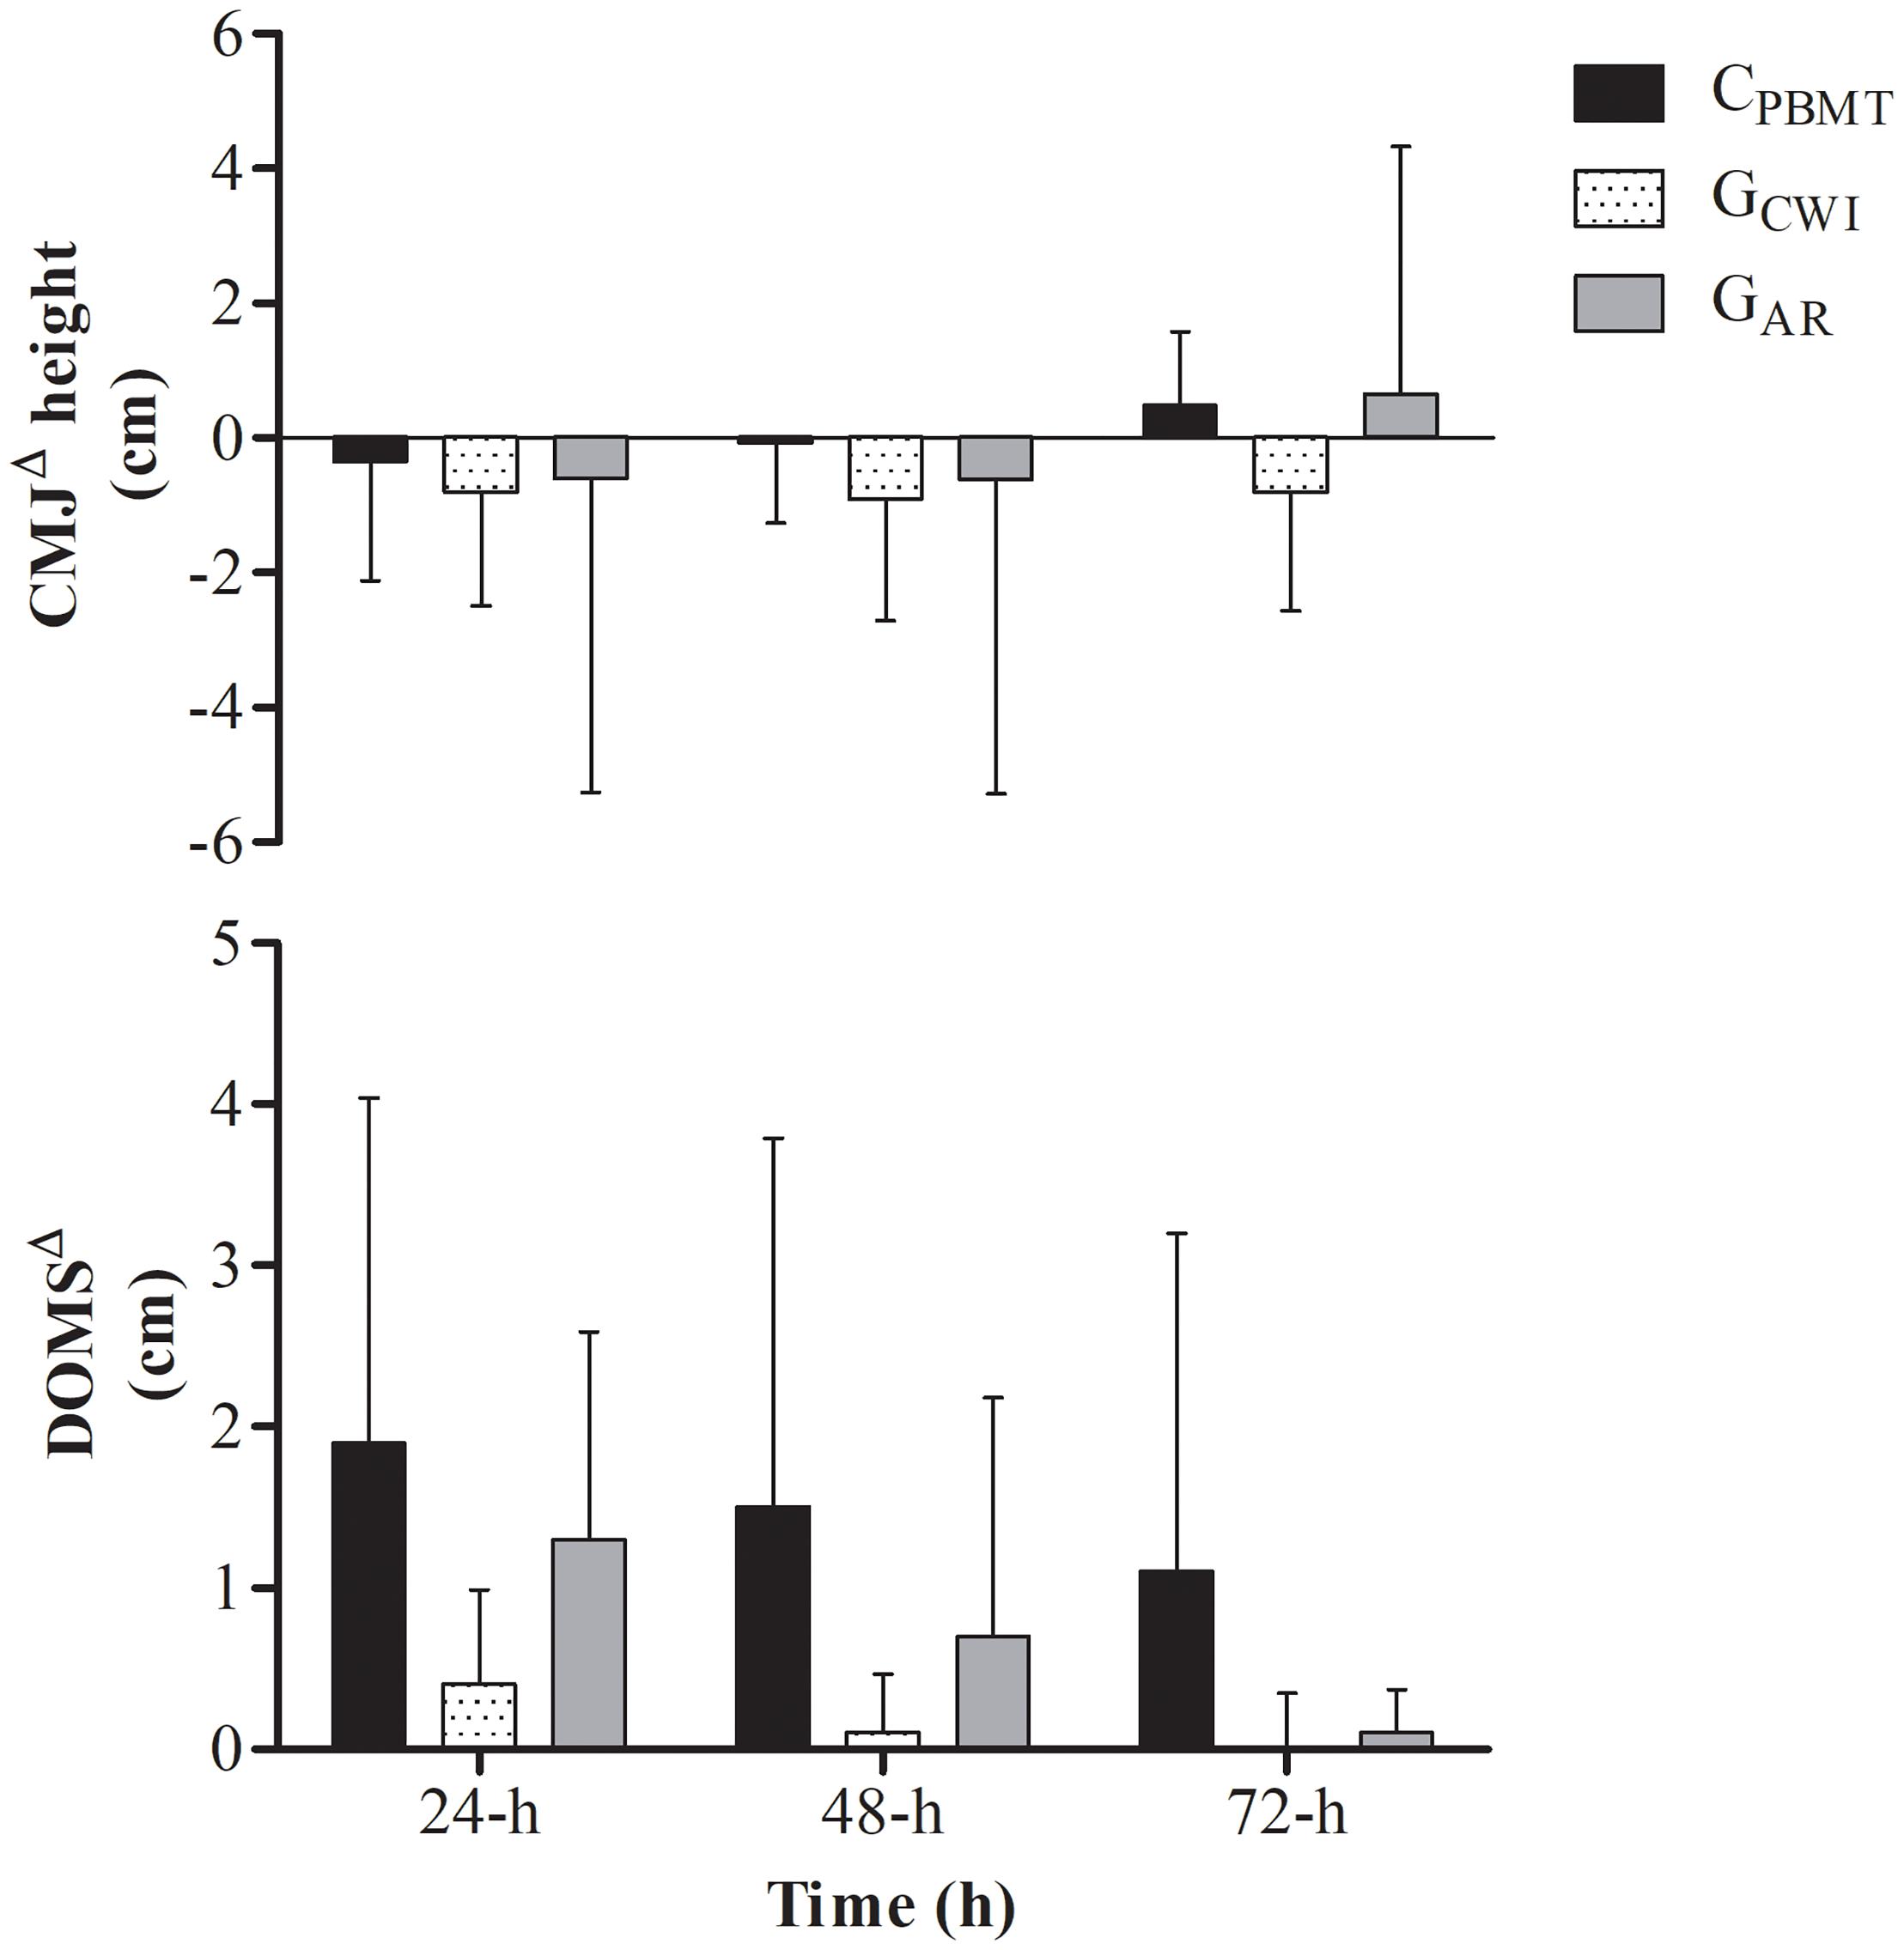
Figure 6. DOMSΔ performance and DOMSΔ for CPBMT, GAR, and GCWI at 24, 48, and 72-h after double SIT session. DOMSΔ, delay onset muscle soreness expressed as difference to baseline; CMJΔ, countermovement jump performance expressed as difference to baseline; CPBMT, condition photobiomodulation therapy; GCWI, group submitted to cold-water immersion; GAR, group submitted to active recovery.
All raw data of inflammation and muscle damage markers, delayed onset muscle soreness, and countermovement jump performance are shown in Supplementary Data Sheet S1.
Discussion
Some recovery strategies have been used to accelerate muscle recovery in sport routines (Barnett, 2006), however, despite their wide use, several doubts remain in the literature about the effectiveness of these methods. To the best of our knowledge, this is the first study to investigate the effects of PBMT on muscle recovery before SIT sessions using systemic blood markers, muscle performance, and DOMS, and compare it with CWI and AR. The main finding of the current study was the lack of effect of PBMT on muscle recovery compared with CPLA, as well as the fact that PBMT did not demonstrate better effects than AR or CWI. Therefore, our initial hypothesis was refuted. The time effects found (Supplementary Figures S3, S4) in the current study only show changes in variable behavior independent of the experimental treatment and therefore do not demonstrate effectivity of any isolated intervention.
Initially, it should be mentioned that there were no differences in workload or metabolic stress induced by the double SIT session in both studies (I and II), indicating that all volunteers presented similar damage induction in all conditions. Consequently, the double SIT elicited increases in CK (≈57%), LDH (≈42%), IL-10 (≈86%), and TNFα (≈24%) blood concentrations in both studies and this increase was not different between conditions.
The process of muscle recovery may be monitored through systemic inflammatory marker kinetics such as cytokines (e.g., interleukins), and is usually accompanied by a decrease in muscle exercise performance and an increase in DOMS (Peake et al., 2017). Interleukins such as IL-10 and TNFα play an important role in the muscle recovery process and their concentration may give an indication of the inflammatory status (Petersen and Pedersen, 2005). In this way, it has been hypothesized that PBMT applied before or after exercise sessions may alter these inflammatory responses due to a decreased effect of reactive oxygen and nitrogen species on cell membranes (Powers and Jackson, 2008), increased activity of satellite cells (Ben-Dov et al., 1999; Shefer et al., 2002), and increased ATP levels (Ferraresi et al., 2015), resulting in better inflammation control and resolution.
Ferraresi et al. (2012) reported evidence of the supposed effect of PBMT on inflammation, which is supported mainly by animal model studies and in vitro assay results, focusing predominantly on rehabilitation. Among the few studies that investigated systemic inflammation after exercise with humans, Zagatto et al. (2016) verified only trivial to moderate effect sizes of PBMT on IL-10, IL-1β, and TNFα in young athletes after water polo training sessions, while Aver Vanin et al. (2016) verified a reduction only in IL-6 blood concentration after exercise-induced muscle damage. Therefore, it is clear that there is little evidence to support the beneficial effect of PBMT on inflammation triggered by exercise in humans and our findings indicate that when performed after high-intensity efforts, PBMT as applied in the present investigation has no significant effect on systemic inflammation (see Figure 2).
Decreases in blood CK concentration through PBMT is well reported in the literature (Aver Vanin et al., 2016; De Marchi et al., 2017) while its effect on LDH has been little investigated. Although there is no specific evidence that this mechanism actually occurs, decreases in blood CK and LDH concentrations are often related to the supposed effect of PBMT on hydroxyl radical production in muscle cells, thus reducing the damage caused in the sarcolemma and extravasation of intracellular content to the blood flow (Ferraresi et al., 2012). However, in the present study, PBMT was not able to decrease CK and LDH blood concentrations, and neither were the CWI and AR which presented similar results to PBMT. It should be noted that our results were consistent (i.e., neither damage marker changed) and corroborate with other investigations that also did not verify changes in LDH concentration using PBMT (De Marchi et al., 2012; Zagatto et al., 2016).
The conflicting results in the literature may be explained by the different doses or energy used (Ferraresi et al., 2012). In this way, many authors have made efforts to clarify the dose response effect of PBMT on exercise performance (Dellagrana et al., 2018) and muscle recovery indices (Aver Vanin et al., 2016), however, the optimal dose is still unclear. In the present investigation a dose of 600 J was applied, which is higher than other recent studies (Aver Vanin et al., 2016; Zagatto et al., 2016). However, considering that several lower limb muscles are active during cycling (Hug and Dorel, 2009), and that several application points were required to radiate the entire area, our doses were high mainly due to the application area. Therefore, when the dose per diode irradiation area was relativized the values were ≈ 1.5–4.5 J/cm2, close to the dose proposed by Ferraresi et al. (2012) for decreasing muscle damage (≈ 1.0–2.5 J/cm2).
Recent studies have observed beneficial effects of PBMT on lower and upper limb isometric maximum voluntary contraction (Aver Vanin et al., 2016; De Marchi et al., 2017) and upper limb one-repetition maximum tests (Felismino et al., 2014) after exercise-induced damage protocols. However, in the present study there were no significant effects of PBMT on CWJ performance compared to CPLA, GCWI, and GAR. These results are in agreement with our inflammatory marker findings, which may produce loss in muscle performance (Peake et al., 2017). In the present study CMJ was used due to its efficacy to detect performance loss after high-intensity exercise sessions (Claudino et al., 2017) and the insignificant effect of the jump, a brief effort, on muscle damage parameters.
In the present study, PBMT was not able to decrease DOMS after the double SIT while CWI and AR were not better than PBMT. Therefore, the results of the present study agree with our findings on inflammation, muscle damage, and performance. However, our results do not corroborate with recent studies that verified beneficial effects using PBMT or when associating PBMT with cryotherapy (de Paiva et al., 2016; De Marchi et al., 2017). It is worth mentioning that the cryotherapy method performed by these authors had no accurate temperature control (ice bag intervention). Machado et al. (2016) in a recent review verified that CWI effectiveness on DOMS is dependent on the temperature (≈ 11–15°C). Therefore, more studies with humans and a well-controlled CWI temperature are necessary to clarify these conflicting results.
The main limitation of the present study is that muscle biopsies were not performed to determine intramuscular recovery parameters. However, in view of the number of blood collections (i.e., 11 in part-I and 6 in part-II) this type of procedure proved unfeasible.
Therefore, our results indicate that PBMT use after acute high-intensity efforts has no effect on muscle recovery. In addition, although the literature suggests the potential changes generated by CWI on muscle recovery mainly due to decreased DOMS (Machado et al., 2016), in the present investigation the CWI was not different to PBMT in any recovery index. Similarly, although AR is a popular recovery method in sports routines (Barnett, 2006), this method also was not different from PBMT, which had no effect on recovery. However, it should be mentioned that some findings of the present study do not agree with previous studies, providing evidence that further studies on this same theme are needed to elucidate the real effects of PBMT.
In summary, PBMT had no effect on inflammation, muscle damage, CMJ performance, or DOMS and was not better than CWI or AR on these recovery indices.
Author Contributions
EM, FSL, FM, and AMZ conceived and designed the experiments. EM and AMZ performed the experiments. EM, FSL, ASZ, and AMZ analyzed the data. All authors contributed to reagents, materials, and analysis tools and wrote the manuscript.
Funding
The present study was financed by the São Paulo Research Foundation – FAPESP (Process No. 2015/05012-2).
Conflict of Interest Statement
The authors declare that the research was conducted in the absence of any commercial or financial relationships that could be construed as a potential conflict of interest.
Supplementary Material
The Supplementary Material for this article can be found online at: https://www.frontiersin.org/articles/10.3389/fphys.2018.01948/full#supplementary-material
FIGURE S1 | Performance parameters and lactate kinetics concentration before, during and after the double SIT session. SIT, sprint interval training; BW, bout work; PP, peak power; Wingate test; TW, total work; PP, peak power; MP, mean power; CPBMT, photobiomodulation therapy condition; CPLA, placebo condition.
FIGURE S2 | Performance parameters and lactate kinetics concentration before, during and after the double SIT session. SIT, sprint interval training; BW, bout work; PP, peak power; Wingate test; TW, total work; PP, peak power; MP, mean power; CPBMT, condition photobiomodulation therapy; GCWI, group submitted to cold-water immersion; GAR, group submitted to active recovery.
FIGURE S3 | Main time effect of blood concentration of IL-10Δ%, TNFαΔ%, CKΔ%, and LDHΔ% (mean ± SD) in part-I and part-II. IL-10Δ%, interleukin 10 expressed as percentage difference to baseline; TNFαΔ%, tumor necrosis factor alpha expressed as percentage difference to baseline; CKΔ%, creatine kinase expressed as percentage difference to baseline; LDHΔ%, lactate dehydrogenase expressed as percentage difference to baseline. ap < 0.05 compared with 0.5-h. cp < 0.05 compared with 24-h. dp < 0.05 compared with 48-h. ep < 0.05 compared with 72-h.
FIGURE S4 | Main time effect of DOMSΔ performance and CMJΔ (mean ± SD) in part-I and part-II. DOMSΔ, delay onset muscle soreness expressed as difference to baseline; CMJΔ, countermovement jump performance expressed as difference to baseline. dp < 0.05 compared with 48-h. ep < 0.05 compared with 72-h.
TABLE S1 | Blood concentration of IL-10, TNFα, CK, and LDH (mean ± SD) expressed in absolute values for CPBMT and CPLA. IL-10, interleukin 10; TNFα, tumor necrosis factor alpha; CK, creatine kinase; LDH, lactate dehydrogenase; CPBMT, photobiomodulation therapy condition; CPLA, placebo condition; Df, degrees of freedom.
TABLE S2 | Blood concentration of IL-10, TNFα, CK, and LDH (mean ± SD) expressed in absolute values and the effect size of CPBMT, GAR, and GCWI at baseline, 30 min, 1, 24, 48, and 72 h. L-10, interleukin 10; TNFα, tumor necrosis factor alpha; CK, creatine kinase; LDH, lactate dehydrogenase; CPBMT, photobiomodulation therapy condition; GCWI, group submitted to cold-water immersion intervention; GAR, group submitted to active recovery; Df, degrees of freedom.
DATA SHEET S1 | Raw data of inflammation and muscle damage markers, delayed onset muscle soreness, and countermovement jump performance.
Abbreviations
Δ%, percentage of difference to baseline; AR, active recovery; BW, bout work; CK, creatine kinase; CKΔ%, creatine kinase concentration percentage of difference to baseline; CMJ, countermovement jump; CMJΔ, countermovement jump height normalized by baseline; CPBMT, photobiomodulation therapy condition; CPLA, placebo condition; CWI, cold-water immersion; DOMS, delay onset muscle soreness; DOMSΔ, delay onset muscle soreness perception normalized by baseline; GAR, active recovery group; GCWI, cold-water immersion group; GXT, graded exercise test; IL-10, interleukin-10; IL-10Δ%, interleukin-10 concentration percentage of difference to baseline; LDH, lactate dehydrogenase; LDHΔ%, lactate dehydrogenase concentration percentage of difference to baseline; LED, light emitting diode; MAP, maximal aerobic power; MP, mean power; PBMT, photobiomodulation therapy; PP, peak power; SIT, sprint interval training; TNFα, tumor necrosis factor-α; TNFαΔ%, tumor necrosis factor-αconcentration percentage of difference to baseline; TT, total work; VAS, visual analog scale; O2, oxygen uptake;O2peak, peak oxygen uptake.
References
Amadio, E. M., Serra, A. J., Guaraldo, S. A., Silva, J. A., Antônio, E. L., Silva, F., et al. (2015). The action of pre-exercise low-level laser therapy (LLLT) on the expression of IL-6 and TNF-α proteins and on the functional fitness of elderly rats subjected to aerobic training. Lasers Med. Sci. 30, 1127–1134. doi: 10.1007/s10103-015-1713-x
Anders, J. J., Lanzafame, R. J., and Arany, P. R. (2015). Low-level light/laser therapy versus photobiomodulation therapy. Photomed. Laser Surg. 33, 183–184. doi: 10.1089/pho.2015.9848
Antosiewicz, J., Kaczor, J. J., Kasprowicz, K., Laskowski, R., Kujach, S., Luszczyk, M., et al. (2013). Repeated “all out” interval exercise causes an increase in serum hepcidin concentration in both trained and untrained men. Cell. Immunol. 283, 12–17. doi: 10.1016/j.cellimm.2013.06.006
Aver Vanin, A., De Marchi, T., Silva Tomazoni, S. S., Tairova, O., Leão Casalechi, H., de Tarso Camillo de Carvalho, P., et al. (2016). Pre-exercise infrared low-level laser therapy (810 nm) in skeletal muscle performance and postexercise recovery in humans, what is the optimal dose? A randomized, double-blind, placebo-controlled clinical trial. Photomed. Laser Surg. 34,473–482. doi: 10.1089/pho.2015.3992
Barnett, A. (2006). Using recovery modalities between training sessions in elite athletes: does it help? Sports Med. 36, 781–796. doi: 10.2165/00007256-200636090-00005
Baroni, B. M., Leal Junior, E. C. P., De Marchi, T., Lopes, A. L., Salvador, M., and Vaz, M. A. (2010). Low level laser therapy before eccentric exercise reduces muscle damage markers in humans. Eur. J. Appl. Physiol. 110, 789–796. doi: 10.1007/s00421-010-1562-z
Ben-Dov, N., Shefer, G., Irintchev, A., Wernig, A., Oron, U., Halevy, O., et al. (1999). Low-energy laser irradiation affects satellite cell proliferation and differentiation in vitro. Biochim. Biophys. Acta 1448, 372–380.
Borges, L. S., Cerqueira, M. S., Rocha, J. A. S., Conrado, L. A. L., Machado, M., Pereira, R., et al. (2013). Light-emitting diode phototherapy improves muscle recovery after a damaging exercise. Lasers Med. Sci. 29, 1139–1144. doi: 10.1007/s10103-013-1486-z
Burgomaster, K. A., Hughes, S. C., Heigenhauser, G. F., Bradwell, S. N., and Gibala, M. J. (2005). Six sessions of sprint interval training increases muscle oxidative potential and cycle endurance capacity in humans. J. Appl. Physiol. 98, 1985–1990. doi: 10.1152/japplphysiol.01095.2004
Carlsson, A. M. (1983). Assessment of chronic pain. I. Aspects of the reliability and validity of the visual analogue scale. Pain 16, 87–101. doi: 10.1016/0304-3959(83)90088-X
Claudino, J. G., Cronin, J., Mezêncio, B., McMaster, D. T., McGuigan, M., Tricoli, V., et al. (2017). The countermovement jump to monitor neuromuscular status: a meta-analysis. J. Sci. Med. Sport 20, 397–402. doi: 10.1016/j.jsams.2016.08.011
De Marchi, T., Leal, E. C. Jr., Bortoli, C., Tomazoni, S. S., Lopes-Martins, R. Á., and Salvador, M. (2012). Low-level laser therapy (LLLT) in human progressive-intensity running: effects on exercise performance, skeletal muscle status, and oxidative stress. Lasers Med. Sci. 27, 231–236. doi: 10.1007/s10103-011-0955-5
De Marchi, T., Schmitt, V. M., Machado, G. P., de Sene, J. S., de Col, C. D., Tairova, O., et al. (2017). Does photobiomodulation therapy is better than cryotherapy in muscle recovery after a high-intensity exercise? A randomized, double-blind, placebo-controlled clinical trial. Lasers Med. Sci. 32, 429–437. doi: 10.1007/s10103-016-2139-9
De Oliveira, H. A., Antonio, E. L., Silva, F. A., Carvalho, P. T. C., Feliciano, R., Yoshizaki, A., et al. (2018). Protective effects of photobiomodulation against resistance exercise-induced muscle damage and inflammation in rats. J. Sports Sci. 36, 2349–2357. doi: 10.1080/02640414.2018.1457419
de Paiva, P. R. V., Tomazoni, S. S., Johnson, D. S., Vanin, A. A., Albuquerque-Pontes, G. M., Machado, C. D., et al. (2016). Photobiomodulation therapy (PBMT) and/or cryotherapy in skeletal muscle restitution, what is better? A randomized, double-blinded, placebo-controlled clinical trial. Lasers Med. Sci. 31, 1925–1933. doi: 10.1007/s10103-016-2071-z
Dellagrana, R. A., Rossato, M., Sakugawa, R. L., Lazzari, C. D., Baroni, B. M., and Diefenthaeler, F. (2018). Dose-response effect of photobiomodulation therapy on neuromuscular economy during submaximal running. Lasers Med. Sci. 33, 329–336. doi: 10.1007/s10103-017-2378-4
Felismino, A. S., Costa, E. C., Aoki, M. S., Ferraresi, C., Lemos, T. A. M., Vieira, W. H. B., et al. (2014). Effect of low-level laser therapy ( 808 nm ) on markers of muscle damage: a randomized double-blind placebo-controlled trial. Lasers Med. Sci. 29, 933–938. doi: 10.1007/s10103-013-1430-2
Ferraresi, C., Hamblin, M. R., and Parizotto, N. A. (2012). Low-level laser (light) therapy (LLLT) on muscle tissue: performance, fatigue and repair benefited by the power of light. Photonics Lasers Med. 1, 267–286. doi: 10.1515/plm-2012-0032
Ferraresi, C., Kaippert, B., Avci, P., Huang, Y. Y., de Sousa, M. V. P., Bagnato, V. S., et al. (2015). Low-level laser (light) therapy increases mitochondrial membrane potential and ATP synthesis in C2C12 myotubes with a peak response at 3-6 h. Photochem. Photobiol. 91, 411–416. doi: 10.1111/php.12397
Gibala, M. J., Little, J. P., Macdonald, M. J., and Hawley, J. A. (2012). Physiological adaptations to low-volume, high-intensity interval training in health and disease. J. Physiol. 590, 1077–1084. doi: 10.1113/jphysiol.2011.224725
Harnish, C. R., and Sabo, R. T. (2016). Comparison of two different sprint interval training work-to-rest ratios on acute inflammatory responses. Sports Med. Open 2:20. doi: 10.1186/s40798-016-0044-1
Heidari, J., Beckmann, J., Bertollo, M., Brink, M., Kallus, W., Robazza, C., et al. (2018). Multidimensional Monitoring of Recovery Status and Implications for Performance. Int. J. Sports Physiol. Perform. doi: 10.1123/ijspp.2017-0669 [Epub ahead of print].
Howley, E. T., Bassett, D. R., and Welch, H. G. (1995). Criteria for maximal oxygen uptake: review and commentary. Med. Sci. Sports Exerc. 27, 1292–1301. doi: 10.1249/00005768-199509000-00009
Hug, F., and Dorel, S. (2009). Electromyographic analysis of pedaling: a review. J. Electromyogr. Kinesiol. 19, 182–198. doi: 10.1016/j.jelekin.2007.10.010
Krzanowski, W. J., and Hand, D. J. (2009). ROC Curves for Continuous Data. Boca Raton, FL: Chapman & Hall/CRC.
Machado, A. F., Ferreira, P. H., Micheletti, J. K., de Almeida, A. C., Lemes,ÍR., Vanderlei, F. M., et al. (2016). Can water temperature and immersion time influence the effect of cold water immersion on muscle soreness? A systematic review and meta-analysis. Sports Med. 46, 503–514. doi: 10.1007/s40279-015-0431-7
Malta, E. S., Brisola, G. M. P., de Poli, R. A. B., Dutra, Y. M., Franchini, E., and Zagatto, A. M. (2018). Metabolic profile and performance responses during two consecutive sessions of sprint interval training. J. Strength Cond. Res. doi: 10.1519/JSC.0000000000002789 [Epub ahead of print].
Mifflin, M. D., St Jeor, S. T., Hill, L. A., Scott, B. J., Daugherty, S. A., and Koh, Y. O. (1990). A new predictive equation for resting energy expenditure in healthy individuals. Am. J. Clin. Nutr. 51, 241–247. doi: 10.1093/ajcn/51.2.241
Ozyener, F., Rossiter, H. B., Ward, S. A., and Whipp, B. J. (2001). Influence of exercise intensity on the on- and off-transient kinetics of pulmonary oxygen uptake in humans. J. Physiol. 533, 891–902. doi: 10.1111/j.1469-7793.2001.t01-1-00891.x
Peake, J. M., Neubauer, O., Della Gatta, P. A., and Nosaka, K. (2017). Muscle damage and inflammation during recovery from exercise. J. Appl. Physiol. 122, 559–570. doi: 10.1152/japplphysiol.00971.2016
Petersen, A. M. W., and Pedersen, B. K. (2005). The anti-inflammatory effect of exercise. J. Appl. Physiol. 98, 1154–1162. doi: 10.1152/japplphysiol.00164.2004
Powers, S. K., and Jackson, M. J. (2008). Exercise-induced oxidative stress: cellular mechanisms and impact on muscle force production. Physiol. Rev. 88,1243–1276. doi: 10.1152/physrev.00031.2007
Roberts, L. A., Raastad, T., Markworth, J. F., Figueiredo, V. C., Egner, I. M., Shield, A., et al. (2015). Post-exercise cold water immersion attenuates acute anabolic signalling and long-term adaptations in muscle to strength training. J. Physiol. 593, 4285–4301. doi: 10.1113/JP270570
Shefer, G., Partridge, T. A., Heslop, L., Gross, J. G., Oron, U., and Halevy, O. (2002). Low-energy laser irradiation promotes the survival and cell cycle entry of skeletal muscle satellite cells. J. Cell Sci. 115, 1461–1469.
Wigernaes, I., Høstmark, A. T., Strømme, S. B., Kierulf, P., and Birkeland, K. (2001). Active recovery and post-exercise white blood cell count, free fatty acids, and hormones in endurance athletes. Eur. J. Appl. Physiol. 84, 358–366. doi: 10.1007/s004210000365
Zagatto, A. M., Ramos, S. P., Nakamura, F. Y., Lira, F. S., Lopes-Martins, R. ÁB., and Carvalho, R. L. P. (2016). Effects of low-level laser therapy on performance, inflammatory markers, and muscle damage in young water polo athletes: a double-blind, randomized, placebo-controlled study. Lasers Med. Sci. 31, 511–521. doi: 10.1007/s10103-016-1875-1
Keywords: low-level light therapy, high-intensity interval training, inflammation, interleukin-10, tumor necrosis factor-alpha, creatine kinase, L-lactate dehydrogenase
Citation: Malta ES, Lira FS, Machado FA, Zago AS, Amaral SL and Zagatto AM (2019) Photobiomodulation by Led Does Not Alter Muscle Recovery Indicators and Presents Similar Outcomes to Cold-Water Immersion and Active Recovery. Front. Physiol. 9:1948. doi: 10.3389/fphys.2018.01948
Received: 22 September 2018; Accepted: 22 December 2018;
Published: 14 January 2019.
Edited by:
Martin Burtscher, University of Innsbruck, AustriaReviewed by:
Joana M. Gaspar, Universidade Federal de Santa Catarina, BrazilLeonardo Alexandre Peyré-Tartaruga, Universidade Federal do Rio Grande do Sul (UFRGS), Brazil
Copyright © 2019 Malta, Lira, Machado, Zago, Amaral and Zagatto. This is an open-access article distributed under the terms of the Creative Commons Attribution License (CC BY). The use, distribution or reproduction in other forums is permitted, provided the original author(s) and the copyright owner(s) are credited and that the original publication in this journal is cited, in accordance with accepted academic practice. No use, distribution or reproduction is permitted which does not comply with these terms.
*Correspondence: Alessandro Moura Zagatto, azagatto@yahoo.com.br