 Karolina Can1,2†
 Christiane Menzfeld1,2†Lena Rinne2Peter Rehling3
 Sebastian Kügler1,4Gocha Golubiani2,5
 Jan Dudek3
 Michael Müller1,2*
- 1Center for Nanoscale Microscopy and Molecular Physiology of the Brain, University Medical Center Göttingen, Georg-August-University Göttingen, Göttingen, Germany
- 2Zentrum Physiologie und Pathophysiologie, Institut für Neuro- und Sinnesphysiologie, Universitätsmedizin Göttingen, Georg-August-Universität Göttingen, Göttingen, Germany
- 3Zentrum Biochemie und Molekulare Zellbiologie, Institut für Zellbiochemie, Universitätsmedizin Göttingen, Georg-August-Universität Göttingen, Göttingen, Germany
- 4Klinik für Neurologie, Universitätsmedizin Göttingen, Georg-August-Universität Göttingen, Göttingen, Germany
- 5Institute of Chemical Biology, Ilia State University, Tbilisi, Georgia
Rett syndrome (RTT), an X chromosome-linked neurodevelopmental disorder affecting almost exclusively females, is associated with various mitochondrial alterations. Mitochondria are swollen, show altered respiratory rates, and their inner membrane is leaking protons. To advance the understanding of these disturbances and clarify their link to redox impairment and oxidative stress, we assessed mitochondrial respiration in defined brain regions and cardiac tissue of male wildtype (WT) and MeCP2-deficient (Mecp2-/y) mice. Also, we quantified for the first time neuronal redox-balance with subcellular resolution in cytosol and mitochondrial matrix. Quantitative roGFP1 redox imaging revealed more oxidized conditions in the cytosol of Mecp2-/y hippocampal neurons than in WT neurons. Furthermore, cytosol and mitochondria of Mecp2-/y neurons showed exaggerated redox-responses to hypoxia and cell-endogenous reactive oxygen species (ROS) formation. Biochemical analyzes exclude disease-related increases in mitochondrial mass in Mecp2-/y hippocampus and cortex. Protein levels of complex I core constituents were slightly lower in Mecp2-/y hippocampus and cortex than in WT; those of complex V were lower in Mecp2-/y cortex. Respiratory supercomplex-formation did not differ among genotypes. Yet, supplied with the complex II substrate succinate, mitochondria of Mecp2-/y cortex and hippocampus consumed more O2 than WT. Furthermore, mitochondria from Mecp2-/y hippocampus and cortex mediated an enhanced oxidative burden. In conclusion, we further advanced the molecular understanding of mitochondrial dysfunction in RTT. Intensified mitochondrial O2 consumption, increased mitochondrial ROS generation and disturbed redox balance in mitochondria and cytosol may represent a causal chain, which provokes dysregulated proteins, oxidative tissue damage, and contributes to neuronal network dysfunction in RTT.
Introduction
Rett syndrome (RTT) is a progressive neurodevelopmental disorder. It primarily affects females, who show the first obvious symptoms within 6–18 months after birth. Among the characteristics are a regression of mental and physical development as well as severe disabilities such as breathing disturbances, loss of speech, autistic features, cognitive impairment, and epilepsy (Rett, 1966; Hagberg et al., 1983; Chahrour and Zoghbi, 2007). In the majority of cases, RTT is caused by spontaneous mutations in the X-chromosomal MECP2 gene encoding for the transcriptional regulator MeCP2 (Amir et al., 1999).
Patient and rodent studies confirm that mitochondria are morphologically and functionally affected in RTT (Eeg-Olofsson et al., 1990; Belichenko et al., 2009; Großer et al., 2012; Gold et al., 2014; Park et al., 2014; Valenti et al., 2014; Shulyakova et al., 2017). Human skeletal muscle and frontal lobe biopsy samples revealed swollen mitochondria with vacuolizations and granular inclusions (Ruch et al., 1989; Eeg-Olofsson et al., 1990; Cornford et al., 1994). In male Rett mice carrying a knockout mutation of the Mecp2 gene (Mecp2-/y mice), we previously observed that hippocampal mitochondria show less negative membrane potentials and increased FAD/NADH baseline-ratios, which indicates an intensified degree of oxidation and increased levels of ROS (Großer et al., 2012; Müller and Can, 2014). Also, brain ATP content is affected. Higher resting ATP levels with increased ATP turnover rates were reported for neonatal hippocampal Mecp2-/y neurons (Toloe et al., 2014), whereas whole brain studies on adult symptomatic male and female Rett mice detected reduced ATP concentrations (Saywell et al., 2006; De Filippis et al., 2015; Valenti et al., 2017).
In view of these findings, also specific changes in mitochondrial respiration are to be expected. The mitochondrial respiratory chain consists of four complexes, CI, CII, CIII, and CIV, which are transporting electrons from reducing equivalents (NADH+H+, FADH2) to molecular oxygen. This electron transport extrudes protons across the inner membrane, and the resulting membrane potential then drives ATP synthesis by the F1Fo-ATP synthase (CV) (Mitchell, 1961). Indeed, Rett patients show lower expression levels of cytochrome c oxidase subunit I as well as reduced enzymatic activities of cytochrome c oxidase and succinate cytochrome c reductase (Coker and Melnyk, 1991; Gibson et al., 2010). Also in Rett mice, lowered enzymatic activities of the respiratory complexes are evident in brain and skeletal muscle (Kriaucionis et al., 2006; Gold et al., 2014; De Filippis et al., 2015; Valenti et al., 2017). In concert with altered O2 consumption rates (Kriaucionis et al., 2006) these changes may easily culminate in reduced brain ATP contents (Saywell et al., 2006; De Filippis et al., 2015; Valenti et al., 2017).
Nevertheless, detailed information on the very brain regions affected and on the exact time course of mitochondrial changes in RTT is sparse. Another issue still to be addressed, is whether besides differential protein levels and activities also altered protein/protein interactions may contribute to the mitochondrial dysfunction in RTT. The mitochondrial respiratory chain forms large supercomplexes in which CI binds to a dimer of CIII and several copies of CIV (Schägger and Pfeiffer, 2000; Lenaz and Genova, 2012; Wu et al., 2016). This supercomplex formation guarantees an efficient energy transduction within the respiratory chain, prevents energy leakage, and dampens ROS production. Pathological changes in supercomplex structure were reported for many disease models (Wallace, 1999; DiMauro and Schon, 2003; Pacheu-Grau et al., 2015; Dudek et al., 2016) – but at present it is unclear whether this may be the case also in RTT.
Another aspect is that mitochondria are a prominent source of ROS. During electron transport from CI to CIV approximately 2–5% of electrons escape and diffuse directly to O2, thereby generating superoxide (Boveris and Chance, 1973; Votyakova and Reynolds, 2001; Brand, 2010). Hence, the increased mitochondrial activity and ATP turnover in Rett mice (Kriaucionis et al., 2006; Großer et al., 2012; Toloe et al., 2014) should be associated with increased ROS generation. Indeed, an intensified H2O2 production was observed in isolated mitochondria of female Rett mouse brains (De Filippis et al., 2015; Valenti et al., 2017). It appears to contribute to the systemic oxidative burden and the oxidative tissue damage in RTT (De Felice et al., 2009; De Felice et al., 2014), which is assumed to drive the disease progression in RTT (De Felice et al., 2012; Großer et al., 2012; Müller and Can, 2014; Müller, 2019). Yet again, these studies were performed on full brain and do not provide any brain region-specific or even subcellular insights. Furthermore, it still has to be clarified in detail, how the mitochondrial alterations are mechanistically linked to redox-imbalance, oxidative stress, and neuronal network dysfunction in RTT.
Therefore, we took a closer look at redox balance specifically in neurons, and we quantified redox conditions in their cytosolic and mitochondrial compartment, by using the advanced, genetically encoded redox sensor roGFP1. Furthermore, we assessed multiple aspects of mitochondrial physiology in defined brain regions of Rett mice to unravel the interplay of mitochondrial alterations and cellular redox balance in this neurodevelopmental disorder. In particular, we focused on hippocampal and cortical tissue, as these brain areas are metabolically highly demanding, very vulnerable to oxidative stress, and essentially underlie complex cognitive functions. By means of quantitative redox imaging and comprehensive biochemical protein analyzes, we confirm that the redox impairment in RTT affects neuronal cytosol as well as mitochondrial matrix. Only moderate decreases in the expression of respiratory complex constituents were evident in mitochondria of Mecp2-/y hippocampus and cortex. Nevertheless, their O2 consumption rate was increased in the presence of CII substrates. Also, an intensified ROS generation was confirmed for mitochondria of Mecp2-/y hippocampus and cortex.
Materials and Methods
As a mouse model for RTT, we chose Mecp2 knockout mice [B6.129P2(C)-Mecp2tm1.1Bird] (Guy et al., 2001). In order to ensure uniform conditions, i.e., a total lack of MeCP2 in each single cell studied by our cell-based and tissue analyzes, only male Rett mice (Mecp2-/y) were used. They develop symptoms earlier, present a more severe phenotype, and were compared with their male WT siblings. Optimized breeding of Rett mice could be achieved with WT (NMRI line) foster mice only, which took better care of the offspring than the female Rett mice (Mecp2+/-). All experiments were in accordance with German regulations and authorized by the Office of Animal Welfare of the University Medical Center Göttingen as well as by the Lower Saxony State Office for Consumer Protection and Food Safety. Mouse genotypes were disclosed only after data collection and analysis. Yet, for Mecp2-/y mice, the genotype eventually became obvious due to their characteristic phenotype and behavior.
Solutions
Unless stated differently, all chemicals were obtained from Sigma-Aldrich. Growth medium used for organotypic slice cultures consisted of minimum essential medium (MEM, Invitrogen) supplemented with 5% FCS, 0.5 mM L-glutamine, 20 μl/ml B27 50× supplement (Invitrogen), 2 μM cytosine arabinoside, and 100 μg/ml penicillin-streptomycin (Biochrom). ACSF contained 130 mM NaCl, 3.5 mM KCl, 1.25 mM NaH2PO4, 24 mM NaHCO3, 1.2 mM CaCl2, 1.2 mM MgSO4 and 10 mM dextrose, and was aerated constantly with 95% O2 plus 5% CO2 (carbogen) to ensure a stable pH of 7.4 as well as a proper O2 supply of the tissue under investigation. The redox stimulants H2O2 (30% aqueous stock solution), DEDTC, and 1,4-dithio-DL threitol (DTT, Fluka) were added to the ACSF immediately before use. AMC was first dissolved as 20 mM stock solution in absolute ethanol and stored at -20°C. The oxidation-sensitive dyes H2DCFDA (2′,7′-dichlorodihydrofluorescein diacetate, Invitrogen) and Amplex UltraRed (Invitrogen) were dissolved in dimethyl sulfoxide as 100 mM and 10 mM stock solutions, respectively, and stored at -20°C.
Hippocampal Slice Cultures
Organotypic slice cultures were prepared from neonatal male mice at PD 3–5, as described earlier (Stoppini et al., 1991; Großer et al., 2012). After decapitation, the brain was removed and placed in ice-cold Hanks’ balanced salt solution. Isolated hippocampi were cut into 350 μm-thick slices (McIlwain tissue chopper, Stoelting Co.), placed on the membranes of six-well culture plates (Transwell Permeable Support, Corning), and incubated under interface conditions at 37°C in a 5% CO2-atmosphere. Each well contained 1 ml growth medium, half of which was replaced every 2–3 days.
Optical Recordings and Transduction Procedures
Cellular redox conditions were monitored with a CCD-camera imaging system. It was controlled by TILLvisION 4.0.1 software (TILL Photonics) and consisted of a xenon light source (Polychrome II; Till Photonics), a sensitive CCD camera (Imago QE; PCO Imaging), and an upright fluorescence microscope (Axioskop I; Zeiss) with a 63× 1.0 NA water immersion objective (Plan-Apochromat; Zeiss). For the imaging experiments, slice cultures were placed with their support membranes in a submersion-style chamber and superfused with pre-warmed ACSF (37°C, 4.5 ml/min).
Neuronal redox balance was quantified with the excitation-ratiometric optical redox sensor roGFP1 (Dooley et al., 2004; Hanson et al., 2004). This optical probe does not detect a particular reactive oxygen or nitrogen species, but rather reports thiol redox balance, and it responds reversibly to redox modulation. Hence, roGFP1 senses – similar to numerous other cellular proteins (Weerapana et al., 2010) – the subcellular thiol redox conditions. In detail, oxidation increases light absorption at 390 nm and decreases absorption at 470 nm; reduction causes opposite responses. Therefore, we excited roGFP1 alternatingly at 395 and 470 nm, and calculated the resulting fluorescence ratio R (Funke et al., 2011; Großer et al., 2012); as optical filters we chose a 460–480 nm bandpass excitation filter, a 495 nm dichroic mirror, and a 525–550 nm bandpass emission filter. Among the advantages of this excitation-ratiometric approach are highly stable recordings as well as improved response dynamics, and the ratiometric redox responses obtained are independent of the expression level of the redox sensor. Nevertheless, quantitative analyses demand that those roGFP1 ratios are determined which correspond to full oxidation (Rox) and full reduction (Rred), as induced by saturating doses of H2O2 (5 mM), and DTT (10 mM), respectively (Hanson et al., 2004; Funke et al., 2011; Wagener et al., 2016). Once calibrated, the relative degree of oxidation OxDroGFP1 can be determined for the respective experimental conditions [see (Meyer and Dick, 2010)]:
Based on OxDroGFP1 and the standard redox potential of roGFP1 (E0′ = -291 mV), the Nernst equation then yields the corresponding roGFP1 redox potentials (Hanson et al., 2004; Meyer and Dick, 2010; Wagener et al., 2016):
After confirming reliable responses of roGFP1 in hippocampal cells and slices (Funke et al., 2011; Großer et al., 2012), we developed viral constructs (AAV6) and placed roGFP1 under the human synapsin 1 promoter, to optimize the transduction efficiency and to ensure a neuron-specific expression. Without further targeting sequences, roGFP1 is expressed in the cytosol (cyto-roGFP1). Its reliable expression in mitochondrial matrix (mito-roGFP1) is guaranteed by the included mitochondrial targeting sequence of subunit VIII of cytochrome c oxidase (Can et al., 2017). Slice cultures were transduced on DIV 3–4, by applying 2.5 μl of the vector (1:50 dilution in PBS; undiluted titer 1.3 × 10⁸ particles/μl) onto each slice. Redox imaging experiments were then performed between DIV 9–15.
Tissue Preparation From Adult Mice
Adult male mice (PD43-49) were ether anesthetized, decapitated, and the brain removed as described earlier (Fischer et al., 2009). The heart was isolated as well, and the collected tissue was processed further to prepare mitochondrial suspensions. Excess tissue was cryopreserved in liquid N2 and stored at -80°C for later use.
Mitochondrial Suspensions
Mitochondrial isolation was performed as described before, with some modifications (Argan et al., 1983). The rigid cardiac tissue was first sliced into small pieces, transferred into 1 ml isolation buffer and minced in a blender (Ultra Thurax T8, IKA Labortechnik). Hippocampal and cortical tissue was transferred into isolation buffer (20 mM HEPES pH 7.6, 220 mM mannitol, 70 mM sucrose, 1 mM 2,2′,2′′,2′′′-(1,2-ethanediyldinitrilo)-tetraacetic acid (EDTA), 0.5 mM PMSF, and homogenized (Potter S, Sartorius) at 1 × 300, 1 × 500, and 25 × 700 rpm. After removing cell debris by centrifugation (800 g, 15 min, 4°C) supernatants were pooled and centrifuged again for 30 min to remove remaining debris. Part of the supernatant was cryopreserved as whole-cell lysate for later protein analyzes. Remaining supernatant was centrifuged at 10,000 g (10 min, 4°C) to spin down the mitochondrial fraction, and the pellets were resuspended in isolation buffer. Final volume and protein amounts were determined by Bradford assay.
Protein Analysis
Proteins of whole cellular lysates were separated by SDS-PAGE (12.5% SDS-PAGE), loading 10–20 μg/lane protein. Blue native (BN) gel electrophoresis was performed as reported earlier (Wittig et al., 2006; Vukotic et al., 2012). For Western blot analysis 30 μg/lane of isolated mitochondria were used. In-gel activity staining required higher protein amounts (CI: 50 μg/lane, CIV: 100 μg/lane, and CV: 150 μg/lane). Mitochondrial membranes were solubilized in lysis buffer [20 mM Tris/HCl pH7.4, 0.1 mM EDTA, 50 mM NaCl, 10% (v/v) glycerol, 1% (w/v) digitonin, 1 mM PMSF] and incubated for 30 min at 4°C while shaking constantly. Non-solubilized material was removed by centrifugation (Eppendorf 5415R, 16,000 g, 5 min, 4°C). Supernatants were transferred into a new sample tube and mixed with 10× loading buffer [5% (w/v) Coomassie Brilliant Blue G-250, 500 mM 𝜀-amino-n-caproic acid diluted in 100 mM Bis-Tris pH7.0]. Samples were separated on a 4–14% poly-acrylamide gradient gel, using a cathode buffer (50 mM Tricine pH7.0, 15 mM Bis-Tris, 0.02% Coomassie G-250) and an anode buffer (50 mM Bis-Tris/HCl pH7.0) (Dekker et al., 1997).
For Western blots, standard methods were used to transfer proteins to polyvinylidene fluoride membranes. After blocking (5% skimmed milk diluted in TBS containing 0.1% Tween), membranes were probed with primary antibodies. Anti-NADH dehydrogenase (ubiquinone) 1 beta subcomplex 8 (NDUFB8), anti-succinate dehydrogenase A (SDHA, Cell Signaling Technology), anti-ubiquinol-cytochrome c reductase, Rieske iron-sulfur polypeptide 1 (Rieske), anti-cytochrome c oxidase subunit I (COX1), ATP synthase subunit beta (AtpB, Antikoerper-online), and anti-VDAC3 were produced in rabbit. Anti-glyceraldehyde-3-phosphate dehydrogenase (GAPDH, 5G4-6C5, Biotrend) was produced in mice. Secondary antibodies were coupled to horseradish peroxidase (Dianova). Chemiluminescence (ECLTM Western blot detection reagent, GE or ClarityTM Western ECL substrate, BioRad) was detected using films (Medix XBU Medical X-Ray Film, Foma Bohemia) or imaged with a camera (Image Reader LAS-1000, Fujifilm). Signal intensities were analyzed by Aida Image Analyzer V.3.10.
In-gel catalytic activity of native respiratory chain complexes separated by BN-PAGE was rated as reported earlier (Zerbetto et al., 1997; Wittig et al., 2007). CI activity was visualized with 2.5 mg/ml NTB in staining solution (0.1 mg/ml NADH and 5 mM Tris, pH 7.4) at 37°C until staining became visible. For CIV staining, cytochrome c, reduced with 15 mg/ml Na-dithionite, was added at a concentration of 1 mg/ml to the staining solution containing 0.5 mg/ml diaminobenzidine in 50 mM KPi, pH 7.4. CV staining was performed in 35 mM Tris–HCl pH 8.3, 270 mM glycine, 14 mM MgSO4 0.2% Pb(NO3)2, and 8 mM ATP. Band intensities were quantified by ImageQuant TL 1D Version 7.0 (GE Health Care).
Mitochondrial O2 Consumption
For quantitative analysis of O2 consumption, a Seahorse XF96 Extracellular Flux Analyzer (Seahorse Bioscience) was used. Isolated mitochondria were resuspended in assay buffer (MAS, 70 mM sucrose, 220 mM mannitol, 2 mM HEPES, 10 mM KH2PO4, 5 mM MgCl2, 1 mM EGTA, and 0.2% BSA, pH 7.4), and loaded to a 96-well sample plate. A centrifugation step (2,000 g, 20 min, 4°C, Allegra X-15R, Beckman Coulter) ensured that mitochondria adhered to the bottom of the wells. Basal respiration was measured at 37°C, in 180 μl MAS containing 2 mM malate + 10 mM pyruvate or 4 mM succinate as substrate. Subsequent consecutive measurements were performed after reoxygenation and automated administration of 12 mM ADP, 1.5 μM oligomycin, 4 μM FCCP, and 4 μM antimycin A + 2 μM rotenone. Data were analyzed with the XF96 Software (Version 1.3.0.79).
ROS Formation by Isolated Mitochondria
Mitochondrial ROS formation was probed with the oxidation-sensitive dyes H2DCFDA (100 μM) and Amplex UltraRed (10 μM). These cuvette assays are standard approaches, which define ROS formation in response to mitochondrial challenges and/or in transgenic mouse models (Mattiasson, 2004; Rönnbäck et al., 2016). In the case of AmplexRed, H2O2 is detected in a coupled reaction with horseradish peroxidase (1 U/ml) (Zhou et al., 1997; Komary et al., 2010). Isolated mitochondria (40 μg) were resuspended in MAS buffer for native conditions or in a denaturing buffer (20 mM Tris, 150 mM NaCl, 0.1% Triton, pH 7.4). The oxidation of H2DCFDA and Amplex UltraRed is irreversible. Accordingly, accumulation of the oxidized dye results in a continuous increase in fluorescence emission. For H2DCFDA it was monitored with a fluorescence spectrophotometer (Hitachi F-7000) at 495 nm excitation and 525 nm emission wavelengths, and for Amplex UltraRed a multimode spectrophotometer (flx-Xenius XM, SAFAS Monaco) with 555 nm excitation and 581 nm emission wavelengths was used.
Body Temperature Measurements
The core body temperature of mice was determined with a rectal probe (MLT451) and a temperature controller (TC1000, ADInstruments) on three consecutive days. The first day served to adapt the mice to the procedure; the temperatures measured on the second and third day were averaged for each mouse.
Statistics
Throughout the manuscript, data are presented as mean ± standard deviation. For each diagram it is indicated whether the number of experiments (n) equals the number of cells analyzed (optical imaging) or the number of mice studied (biochemical assays, tissue samples). Significance of the differences observed was determined by unpaired two tailed student’s t-test. Genotype-related differences are marked by asterisks (∗∗∗p < 0.001, ∗∗p < 0.01, ∗p < 0.05) and genotype-matched differences among cell compartments are identified by crosshatches (###p < 0.001, ##p < 0.01, #p < 0.05). In the case of normalized data, a one-sample t-test served to compare the observed changes to control conditions (defined as unity, i.e., 1.0 or 100%) (Bailey, 1992).
Results
Redox Balance in Mitochondrial Matrix and Cytosol
Our previous analyses revealed a cytosolic redox-imbalance in Mecp2-/y hippocampus (Großer et al., 2012). To compare in detail the redox conditions in mitochondria and cytosol of Mecp2-/y neurons in organotypic hippocampal slice cultures, we analyzed the resting-baseline (steady-state) redox conditions in both cell compartments, and recorded also their dynamic responses to various acute redox-stimuli. For these tasks, we used our recently established viral constructs. They express roGFP1 under the control of the synapsin 1 promoter, mediating a neuron specific expression, and proper subcellular targeting to either cytosol (cyto-roGFP1) or mitochondrial matrix (mito-roGFP1) (Can et al., 2017). RoGFP1 enables quantitative analyses of subcellular redox conditions, but this requires detailed response calibrations for each cell-compartment. Therefore, with saturating doses of H2O2 (5 mM) and DTT (10 mM) we defined those ratiometric values which correspond to full roGFP1 oxidation and reduction, respectively (Figure 1A). H2O2 (7 min) increased the mito-roGFP1 ratio to 1.52 ± 0.16, and DTT decreased it to 0.68 ± 0.02 (n = 12, Figure 1B). As cyto-roGFP1 responded more promptly, the redox-stimulants were applied for 5 min only, but very similar calibration values were obtained as in mitochondria (n = 20; Figure 1B).
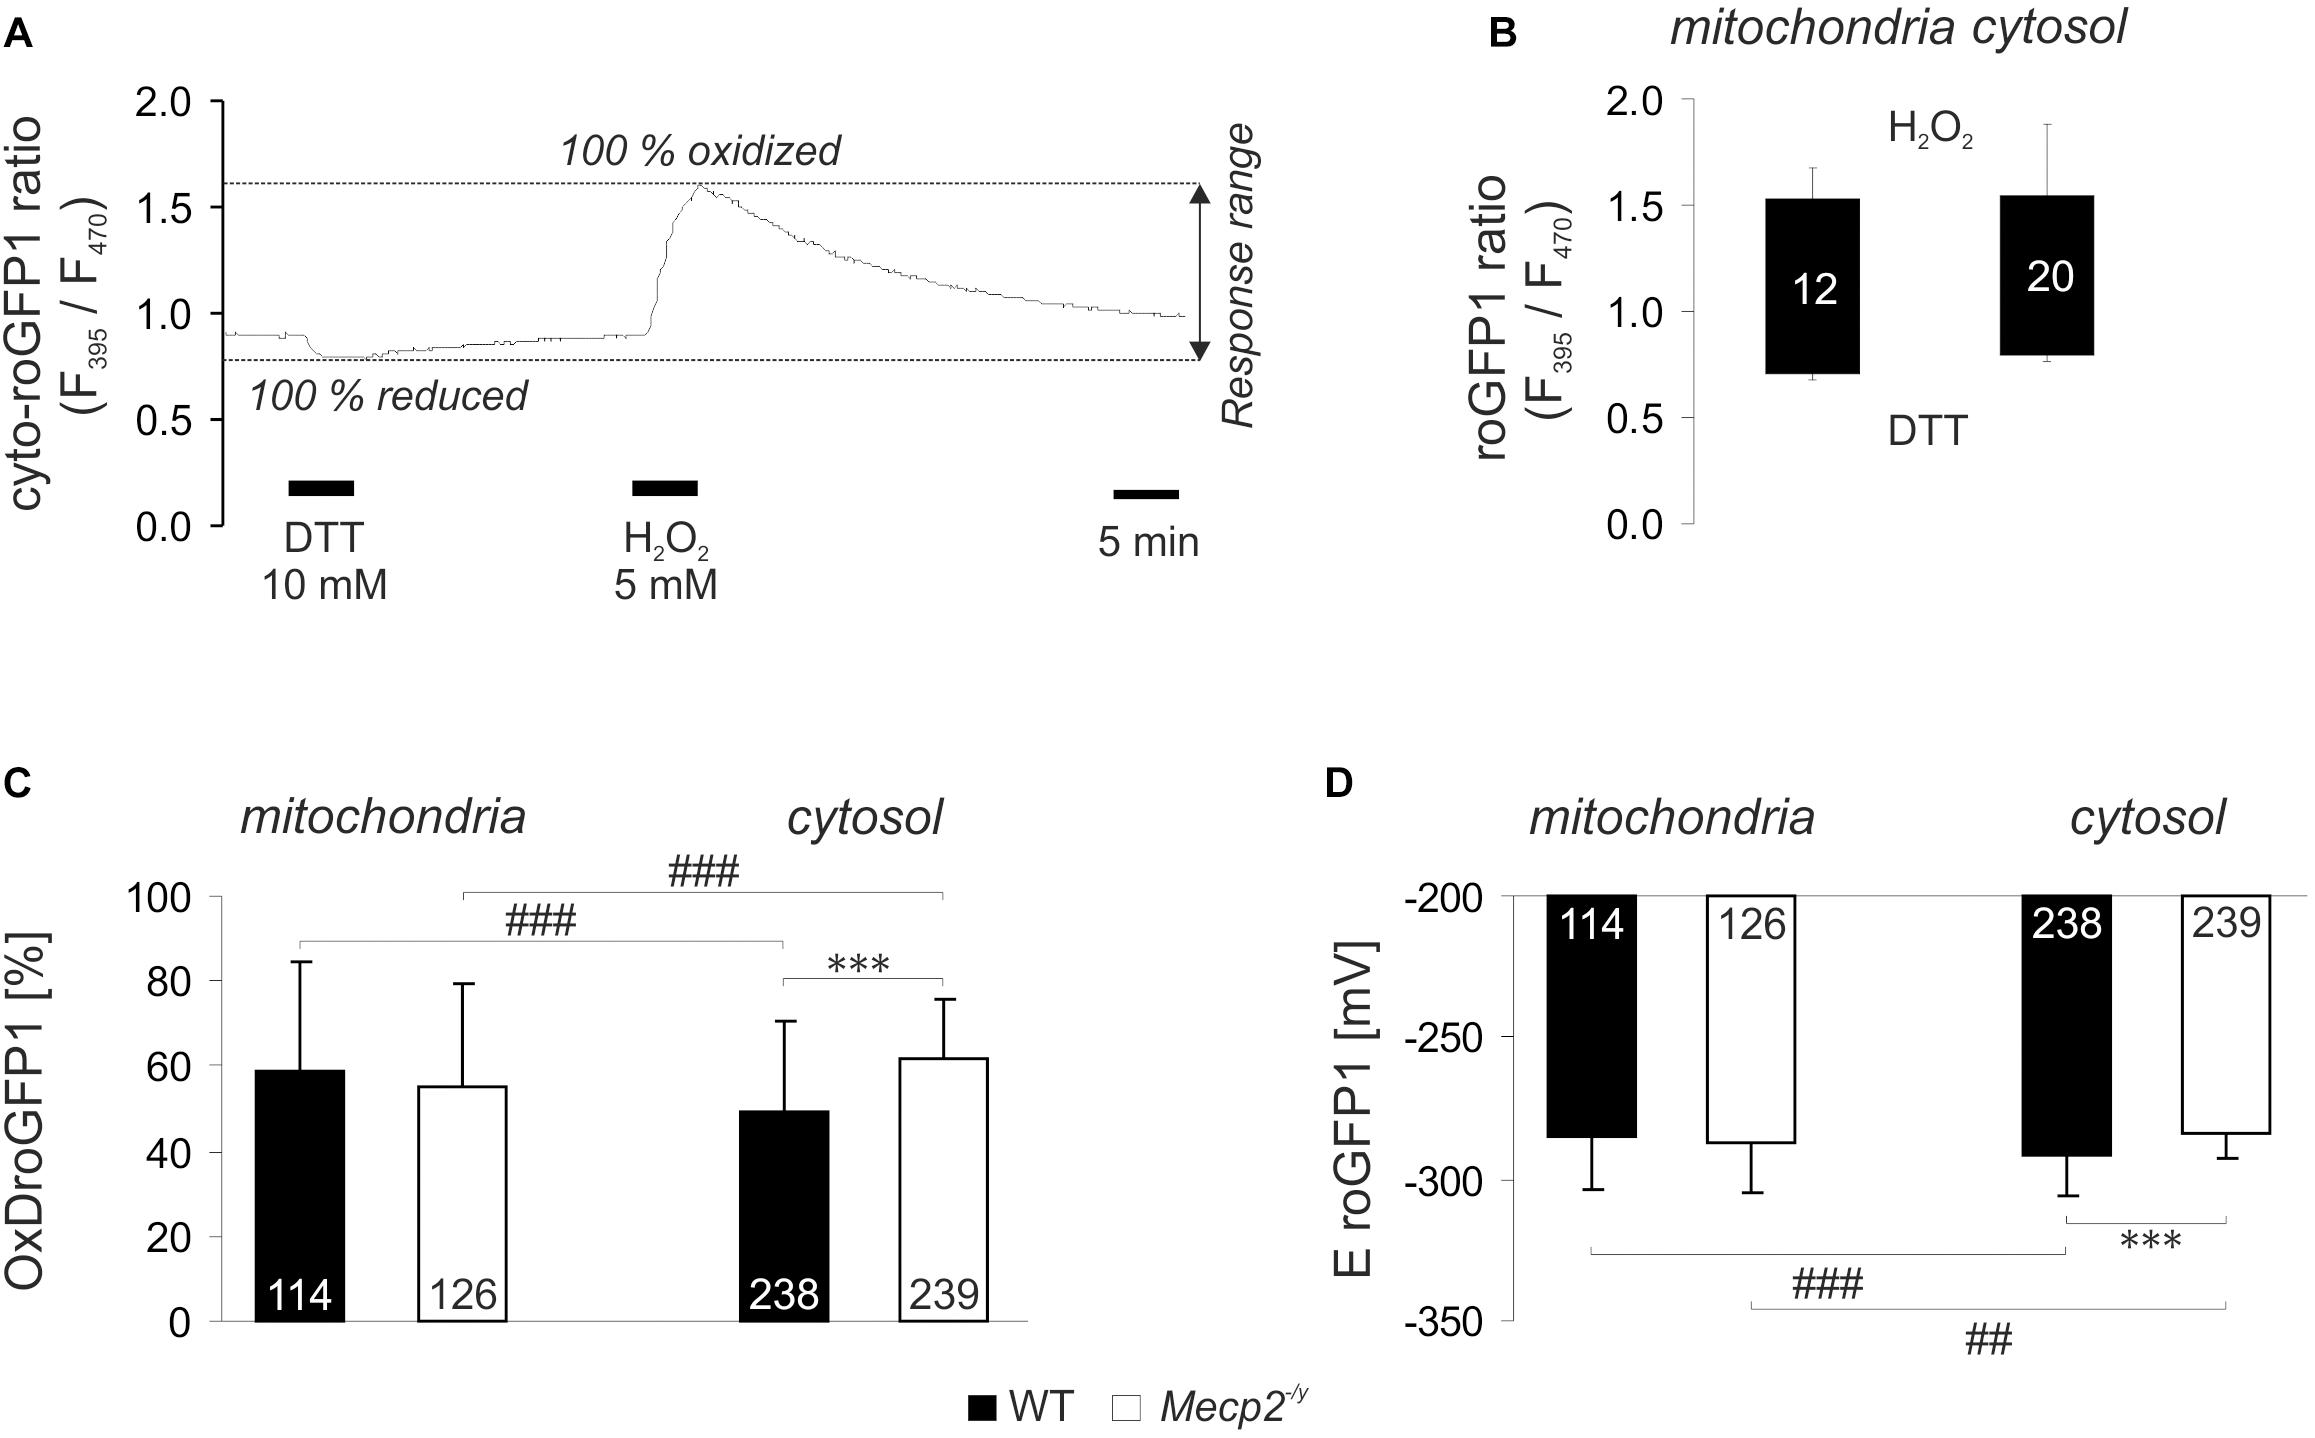
Figure 1. Reduction-oxidation sensitive green fluorescent protein 1 (roGFP1) response calibration reveals genotypic and compartmental redox differences at baseline resting conditions. (A) Dynamic response of cyto-roGFP1 to saturating oxidation and reduction, as recorded from a WT slice culture. (B) The box plot summarizes the response ranges of mito-roGFP1 and cyto-roGFP1 determined during the calibration experiments. The bottom of each box represents the fully reduced state evoked by 10 mM DTT, the ceiling indicates the fully oxidized level induced by 5 mM H2O2. Error bars in this and all other figures are standard deviations; the number of cells analyzed is reported for each bar. The similarity of the determined response ranges confirms that roGFP reliably functions in both, cytosol and mitochondrial matrix. (C) OxDroGFP1 confirms more oxidized baseline conditions in the cytosol of Mecp2-/y hippocampal neurons than in WT neurons. Mitochondrial redox baselines did not differ among genotypes. Statistically significant differences between WT and Mecp2-/y neurons are indicated by asterisks (∗∗∗p < 0.001). Genotype-matched differences among mitochondria and cytosol are indicated by crosshatches (###p < 0.001). Pairwise comparisons were run as unpaired two-tailed t-tests; the number of cells studied is included in each bar. (D) These genotypic and compartmental redox differences are also evident from the calculated roGFP1 reduction potentials (EroGFP1; ##p < 0.01).
Based on these calibrations, the relative degrees of roGFP1 oxidation (OxDroGFP1) and EroGFP1 were calculated for steady-state resting baseline conditions. To define genotype-related differences, the respective cell compartments were compared among WT and Mecp2-/y slices. Furthermore, to identify subcellular, i.e., compartment-specific differences in a given genotype, cytosol and mitochondrial matrix were compared to each other. This revealed that in WT neurons, mitochondrial matrix was more oxidized than their cytosol. Yet, mitochondrial redox baselines did not differ among WT and Mecp2-/y slices. In contrast, cytosolic redox balance was more oxidized in Mecp2-/y than in WT neurons (Figure 1C). As a result, the cytosol of Mecp2-/y neurons was even more oxidized than their mitochondria. These compartmental and genotypic differences are also reflected by the EroGFP1 (Figure 1D).
Next, we assessed the dynamic redox responses of both cell compartments to defined challenges. As irregular respiration with intermittent hypoxia is a hallmark of RTT, the effect of O2 shortage was determined. O2 withdrawal (N2/CO2-aerated ACSF, 10 min), evoked a reducing shift in roGFP1 ratio, which was more intense in Mecp2-/y mitochondria and Mecp2-/y cytosol than in the WT compartments (Figures 2A,E,F). Oxidant challenge was induced by low-dose H2O2 or by inhibition of the scavenging enzyme SOD1 (Cu/Zn SOD). H2O2 (200 μM, 3–5 min) elicited an oxidizing shift in roGFP1 ratio, which was more pronounced in Mecp2-/y than in WT mitochondria, but did not differ among Mecp2-/y, and WT cytosol (Figures 2B,E,F). Blocking SOD1 by DEDTC (Iqbal and Whitney, 1991; Dumay et al., 2006) (5 mM, 5 min) induced an oxidation of roGFP1, which was consistently more pronounced in WT mitochondria and cytosol than in the respective Mecp2-/y compartments (Figures 2C,E,F). Mitochondrial impairment was mimicked by the CIII-blocker AMC (20 μM, 10 min), and it evoked a slow oxidizing shift, which was more intense in Mecp2-/y mitochondria and cytosol as compared to the WT compartments (Figures 2D–F).
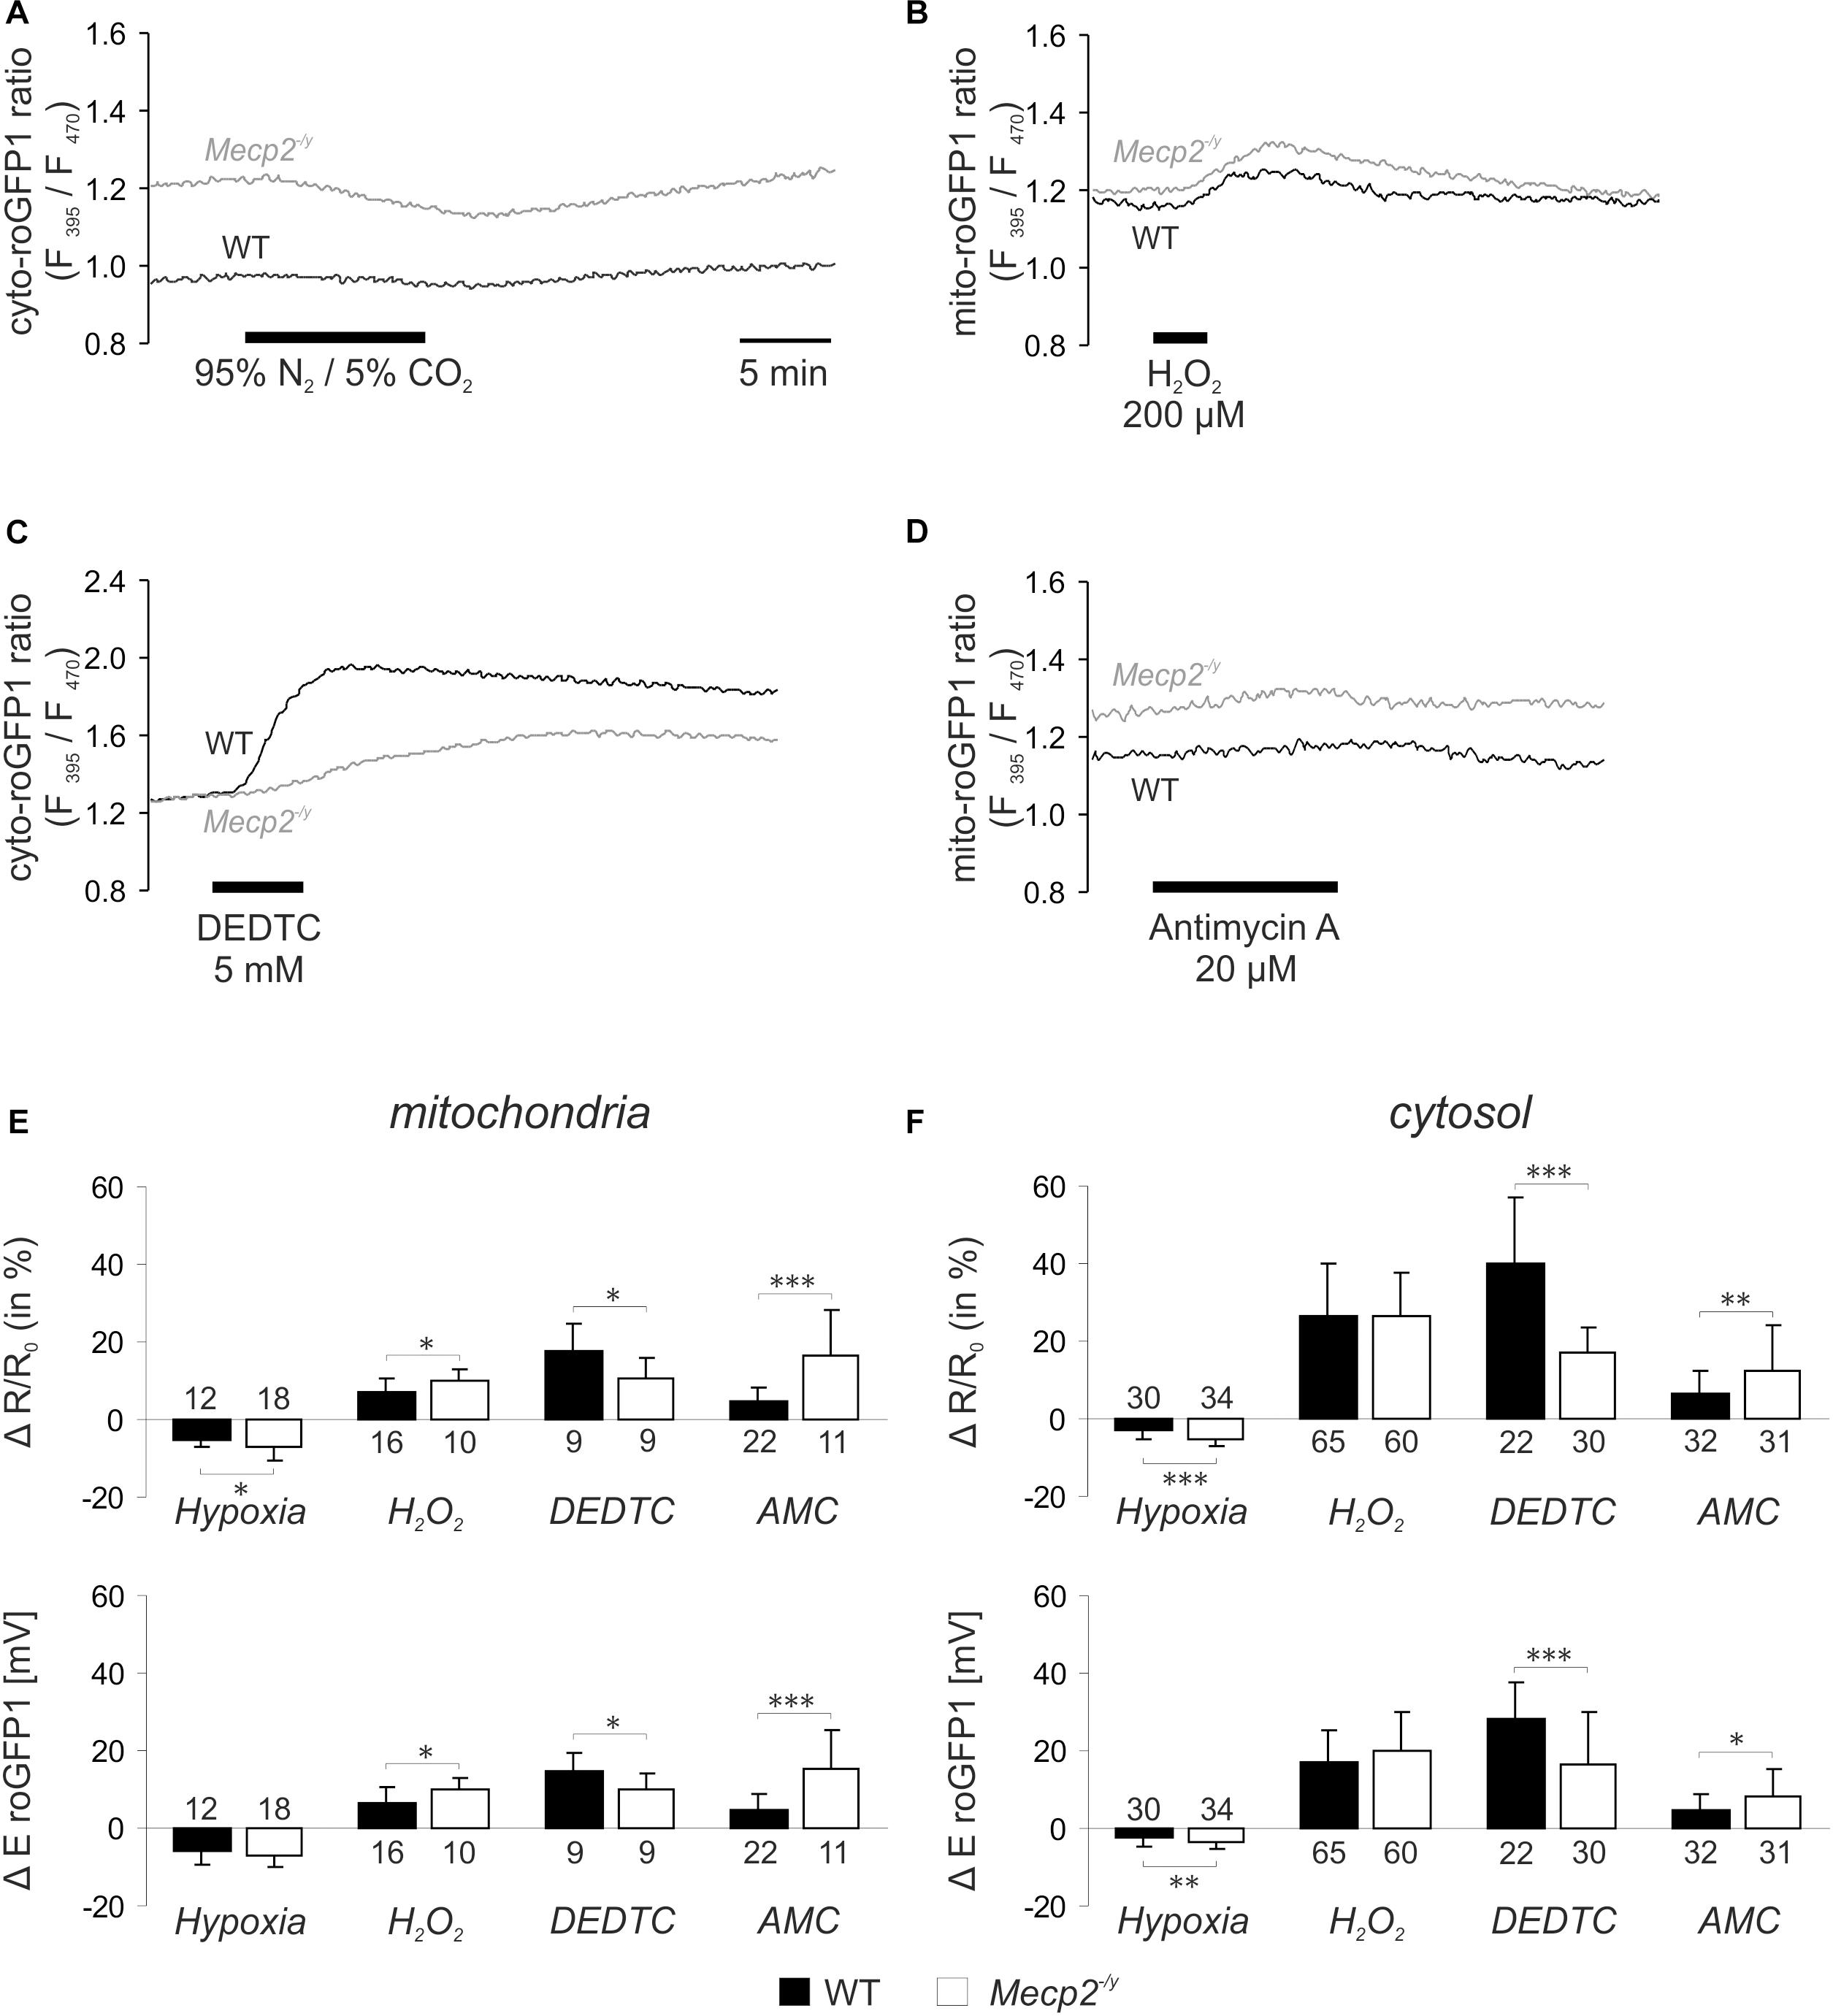
Figure 2. Acute redox challenge uncovers a more fragile redox homeostasis in mitochondrial matrix and cytosol of Mecp2-/y hippocampal neurons. (A) As revealed by the imaging of subcellular redox dynamics, O2 withdrawal evoked a reducing shift in the cytosolic roGFP1 fluorescence ratio, which was more intense in Mecp2-/y neurons. Time scaling also applies to the following traces. (B) Low-dose H2O2 induced a more pronounced oxidation in Mecp2-/y mitochondria. (C) The cytosol of Mecp2-/y neurons responded less intensely to DEDTC, a blocker of SOD1. (D) Block of CIII by AMC elicited a more pronounced oxidation in Mecp2-/y mitochondria. (E) Summary of the redox alterations in mitochondrial matrix. Plotted are changes in mito-roGFP1 ratio and in the mito-roGFP1 reduction potential. Asterisks indicate statistically significant differences as compared to WT in unpaired two-tailed t-tests (∗∗∗p < 0.001, ∗∗p < 0.01, ∗p < 0.05). The number of cells studied is reported for each bar. (F) Summarized redox responses of the cytosolic compartment (cyto-roGFP1).
Mitochondrial Mass and Expression Levels of Respiratory Complexes
An increased cellular density of mitochondria may be a potential cause of the oxidative burden in RTT. Therefore, we asked whether mitochondrial mass differs in WT and Mecp2-/y mice. As mitochondrial marker we chose VDAC3, an integral membrane protein of the outer mitochondrial membrane; the cytosolic protein GAPDH served as loading control. Clear cellular lysates of hippocampus, cortex and heart (n = 5 each genotype) were separated by SDS-PAGE, and both proteins detected in the same sample by Western blot analysis (Figure 3A). Normalizing the expression of VDAC3 to GAPDH, did not reveal any differences in mitochondrial mass of adult Mecp2-/y hippocampus or cortex as compared to WT. Only a trend toward increased mitochondrial mass was evident in Mecp2-/y heart, which did, however, not reach the level of significance (p = 0.101; Figure 3B).
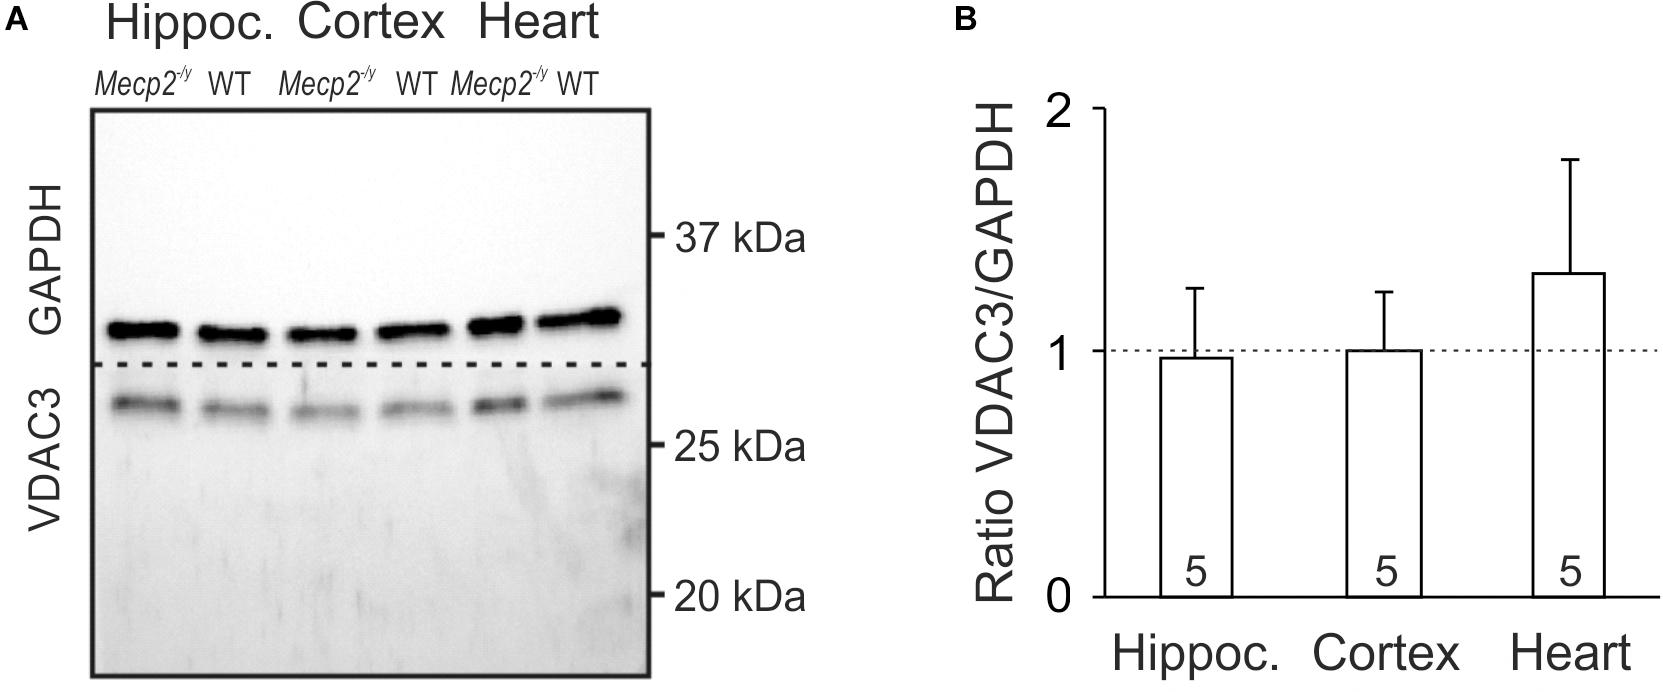
Figure 3. Mitochondrial mass is not altered in Mecp2-/y hippocampus and cortex. (A) In Western blot analyses, VDAC3 served as mitochondrial marker. Its expression was referred to GAPDH, and tissue lysates of hippocampus, cortex, and heart were compared among WT and Mecp2-/y siblings. Dashed line indicates the membrane cut after protein blotting. (B) In densitometric analyzes genotypic differences for hippocampus and cortex were not found. Mitochondrial mass tended to be higher though in Mecp2-/y heart (n = 5 mice each). Plotted VDAC3/GAPDH ratios are normalized to WT conditions (defined as unity, see dashed line), statistical significance was assessed by one-sample t-tests.
As a reduced enzymatic activity of key mitochondrial functions is evident in RTT (Coker and Melnyk, 1991; Kriaucionis et al., 2006; Gibson et al., 2010; Gold et al., 2014; De Filippis et al., 2015; Valenti et al., 2017), we analyzed steady state levels of constituents of the mitochondrial respiratory chain. Tissue lysates were separated by SDS-PAGE and protein levels of core constituents of the respiratory chain were analyzed by Western blotting (Figure 4A). All complexes were detectable in the WT and Mecp2-/y samples, but normalization to GAPDH content did not reveal any genotypic differences in the protein levels of CII, CIII, and CIV (Figure 4B). In Mecp2-/y hippocampus and cortex, however, CI protein levels (NDUFB8) were slightly lower than in WT. Furthermore, ATP-synthase (CV, ATP5B) was slightly less expressed in Mecp2-/y cortex (Figure 4B).
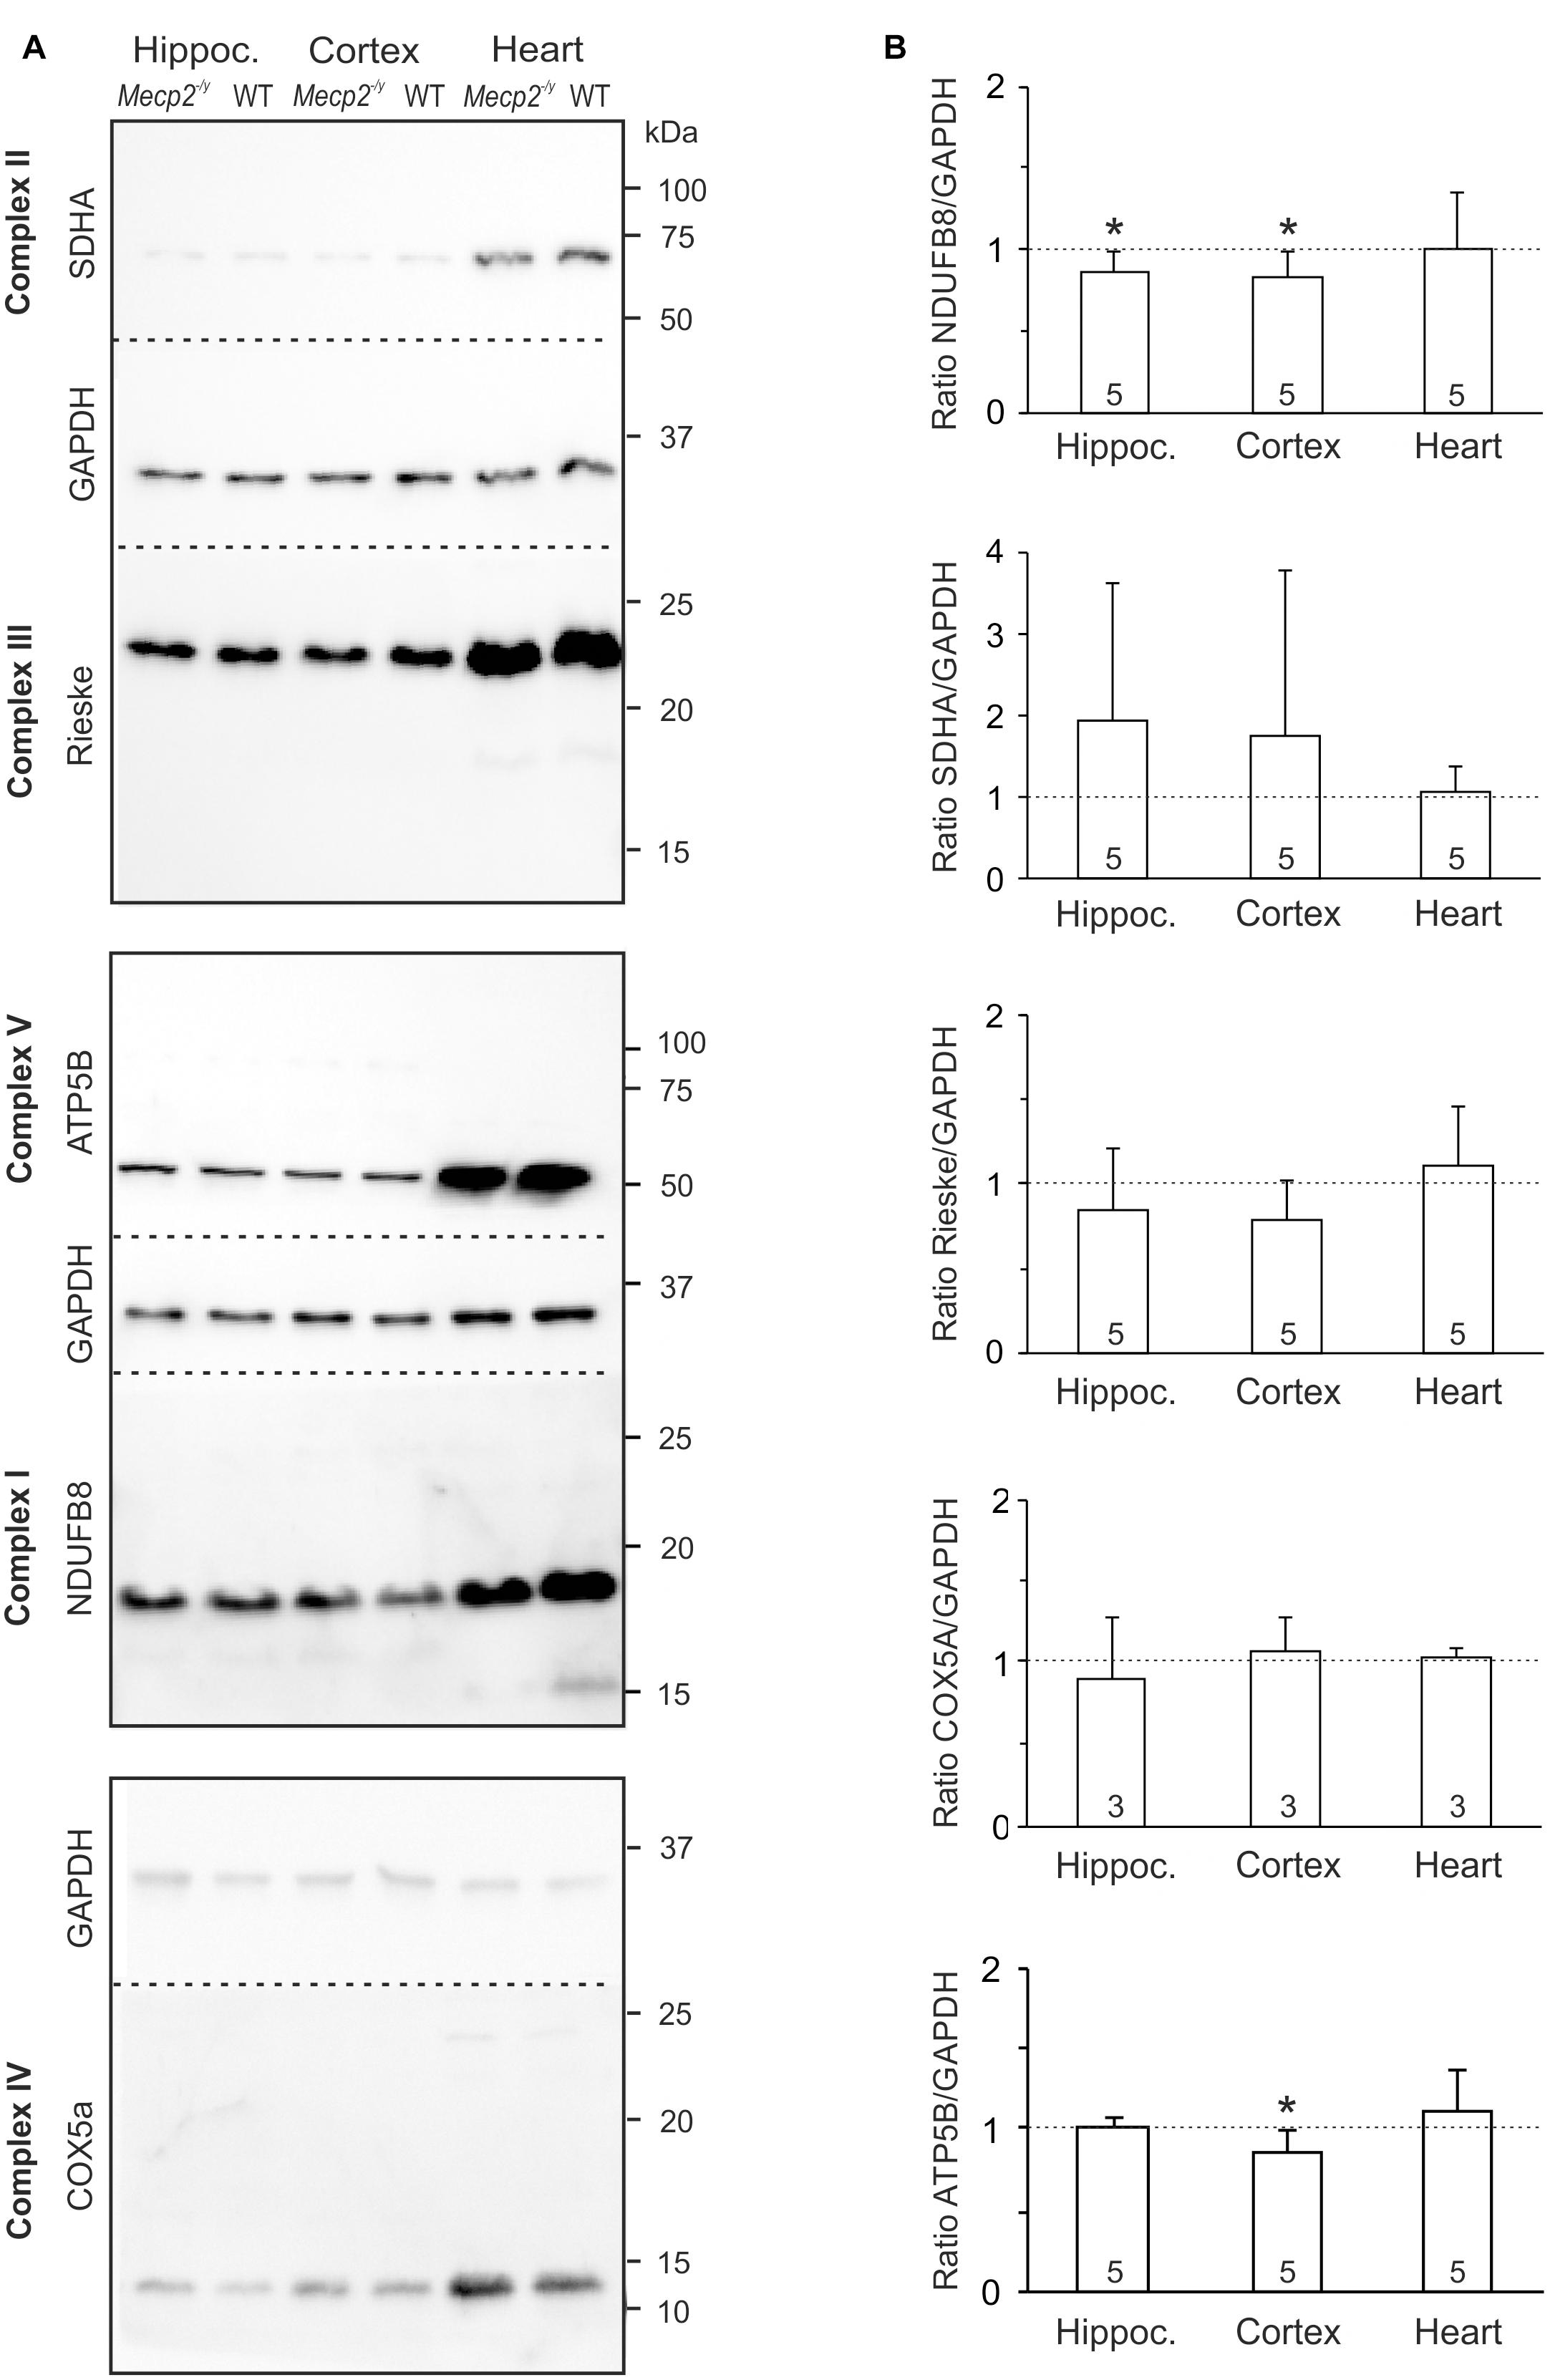
Figure 4. Protein expression levels of NDUFB8 and ATP5B differ only slightly between Mecp2-/y and WT mice. (A) Protein lysates were separated by SDS gel electrophoresis and analyzed by Western blotting, using antibodies specific against NDUFB8 (CI), SDHA (CII), Rieske (CIII), COX5A (CIV), ATP5B (CV), and GAPDH. Dashed lines indicate the membrane cut after protein blotting. The displayed blots of CII and CIII are from the same experiment and therefore share a common loading control; this also applies to CV and CI. (B) Expression levels of the proteins of interest were quantified by densitometry, normalized to GAPDH within the same tissue sample and then referred to the WT samples (defined as unity, see dashed line). The number of samples (mice) analyzed is reported; asterisks mark statistically significant differences as compared to WT in one sample t-tests (∗p < 0.05).
Structure of Mitochondrial Respiratory Chain Complexes
Structural changes of the mitochondrial respiratory chain may provoke the generation of ROS (Chen et al., 2012; Vukotic et al., 2012). As roGFP1 imaging revealed exaggerated redox shifts of Mecp2-/y mitochondria in response to hypoxia and AMC, we screened for potential structural changes of the mitochondrial respiratory chain. We isolated mitochondria from hippocampus, cortex, and heart by differential centrifugation of tissue lysates (Argan et al., 1983; Dudek et al., 2016) and solubilized the isolated mitochondria in the mild detergent digitonin to preserve the supercomplex association. Solubilized protein complexes were then separated by native gel electrophoresis (BN-PAGE) and detected using antibodies against the core component of the complexes. CI was exclusively integrated in supercomplexes and the CI + CIII complex, which was visualized using antibodies against the CI subunit NDUFB8 in the high molecular range of the native gel. CIII and CIV were detected clearly in supercomplexes but were also present as smaller complexes (Figure 5A). ATPase was found in two complexes representing the monomeric VM and the dimeric form VD. Obvious differences in the supercomplex-assembly among WT and Mecp2-/y tissues were not identified.
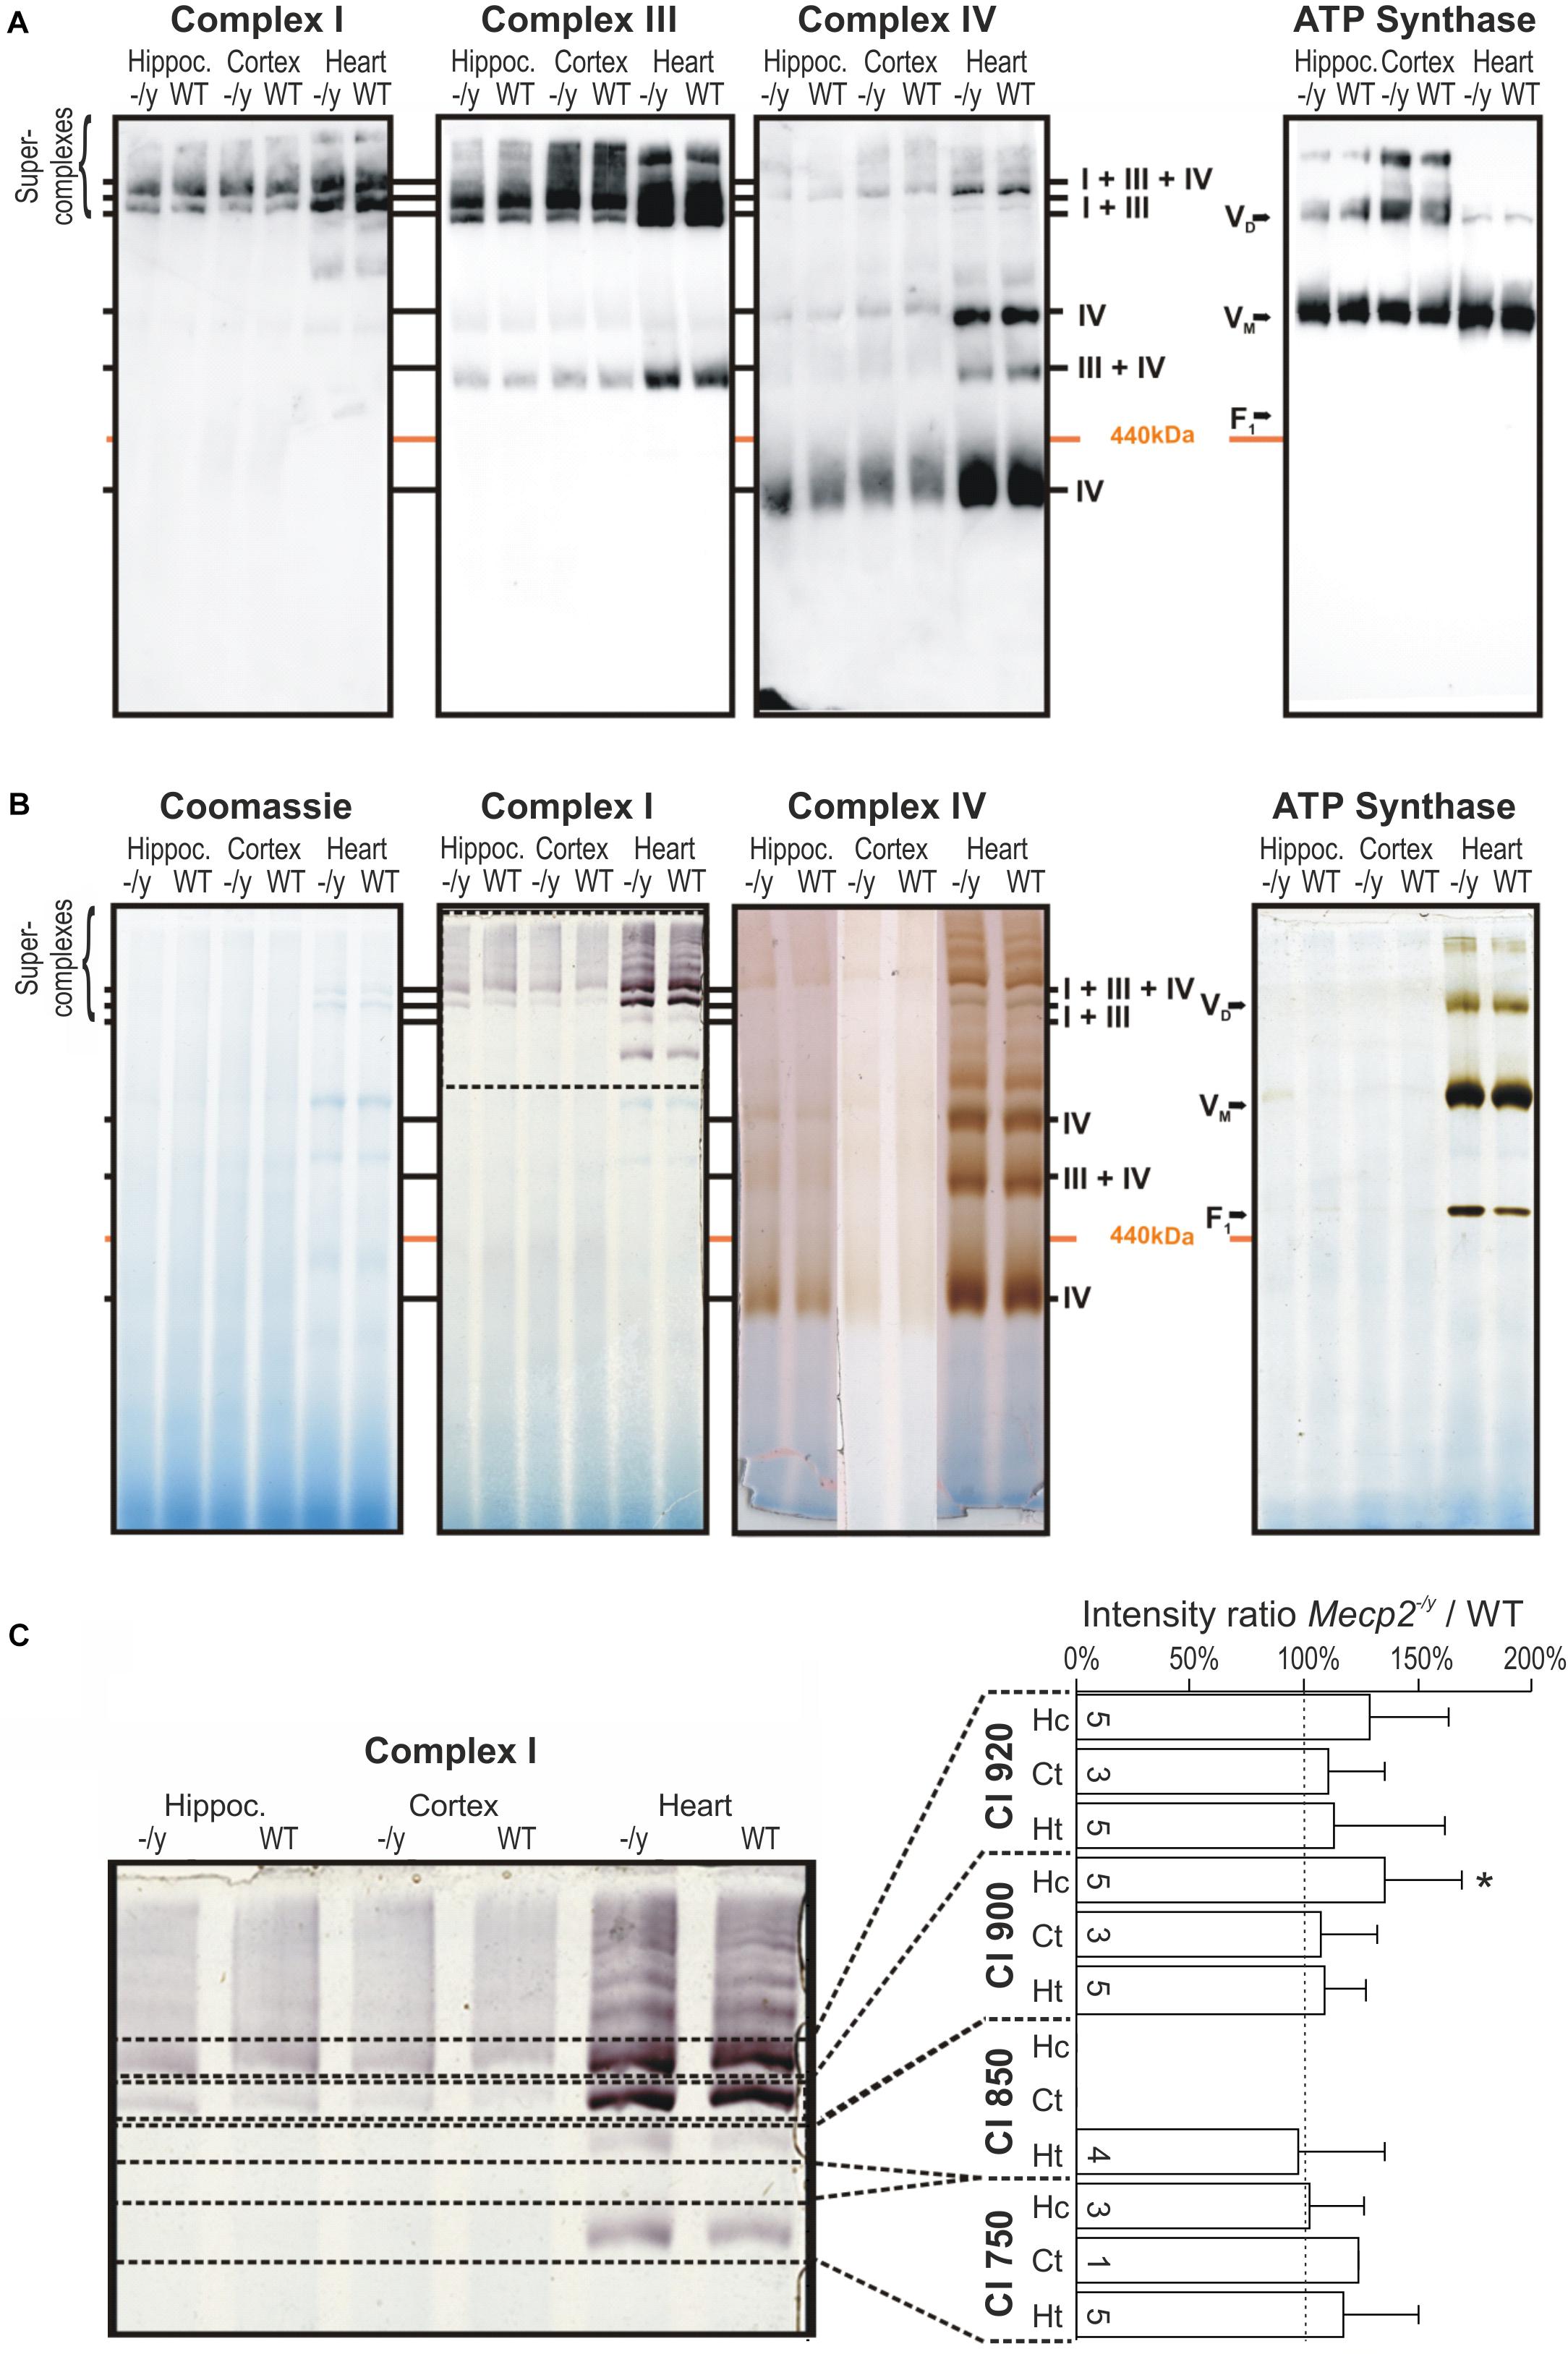
Figure 5. Pathological remodeling of the respiratory chain supercomplexes in mitochondria of Mecp2-/y mice is not evident. (A) Isolated mitochondria were solubilized in digitonin, separated by native gel electrophoresis (BN-PAGE), and respiratory chain complexes were analyzed by Western blotting. Due to limited space, Mecp2-/y tissue is denoted here as “-/y”. (B) Respiratory chain complexes were separated by BN-PAGE and stained for enzymatic activity of CI, CIV, and CV. Marked alterations for the respective respiratory complexes were not found. The section of the gel flanked by the dashed lines was analyzed in more detail in panel C. (C) Quantitative analysis of CI activity staining by densitometry does not reveal marked genotypic differences among WT and Mecp2-/y hippocampus. Dashed line indicates WT conditions, the number of samples (mice) analyzed is indicated (∗p > 0.05, one sample t-test).
Therefore, we next analyzed the activity of the respiratory chain. The complexes were separated by BN-PAGE and subsequently their enzymatic activity visualized by in-gel activity staining. This method allows a direct correlation of their enzymatic activity with their position on the BN-PAGE gel. Specific staining for CI, CIV, and ATP synthase activity corresponded well with their positions in Western blot analyses, confirming specificity of the chosen antibodies (Figures 4, 5A). Activity staining showed most intense signals for heart, which also corresponds well to stronger signals in the Western blot approach (Figure 5B). Also for brain, prominent CI signals were obtained consistently. As CI showed a well distinguishable pattern, the individual bands (750, 850, 900, and 950 kDa) were specifically analyzed by densitometry and normalized to the respective WT pattern; pronounced differences were, however, not found (Figure 5C). Hence, despite detailed analyses of brain and heart tissues, the in-gel activities of CI, CIV, and CV did not markedly differ among WT and Mecp2-/y mice.
Mitochondrial O2 Consumption Rates
Potential defects of the energy transmission in between complexes of the respiratory chain can be assessed only by quantifying the consumption of molecular oxygen. Isolated mitochondria from hippocampus, cortex and heart of WT, and Mecp2-/y mice therefore underwent real-time respirometry (Figure 6A). Mitochondrial suspensions were supplied with CI substrates (2 mM malate, 10 mM pyruvate) to define the O2 consumption rate of basal respiration. Adding ADP (12 mM) then markedly increased O2 consumption (state 3 respiration) to a similar extent in WT and Mecp2-/y samples (Figure 6A). Subsequent inhibition of ATP synthase (1.5 μM oligomycin) largely diminished O2 consumption in all samples, but did not reveal any genotype-related differences. FCCP application (4 μM) then evoked the maximal uncoupler-stimulated respiratory state, again, without revealing genotypic differences. Finally, mitochondrial respiration was blocked by AMC (4 μM) plus rotenone (2 μM), which almost completely abolished O2 consumption. The remaining fraction of residual O2 consumption did not differ either among Mecp2-/y and WT samples.
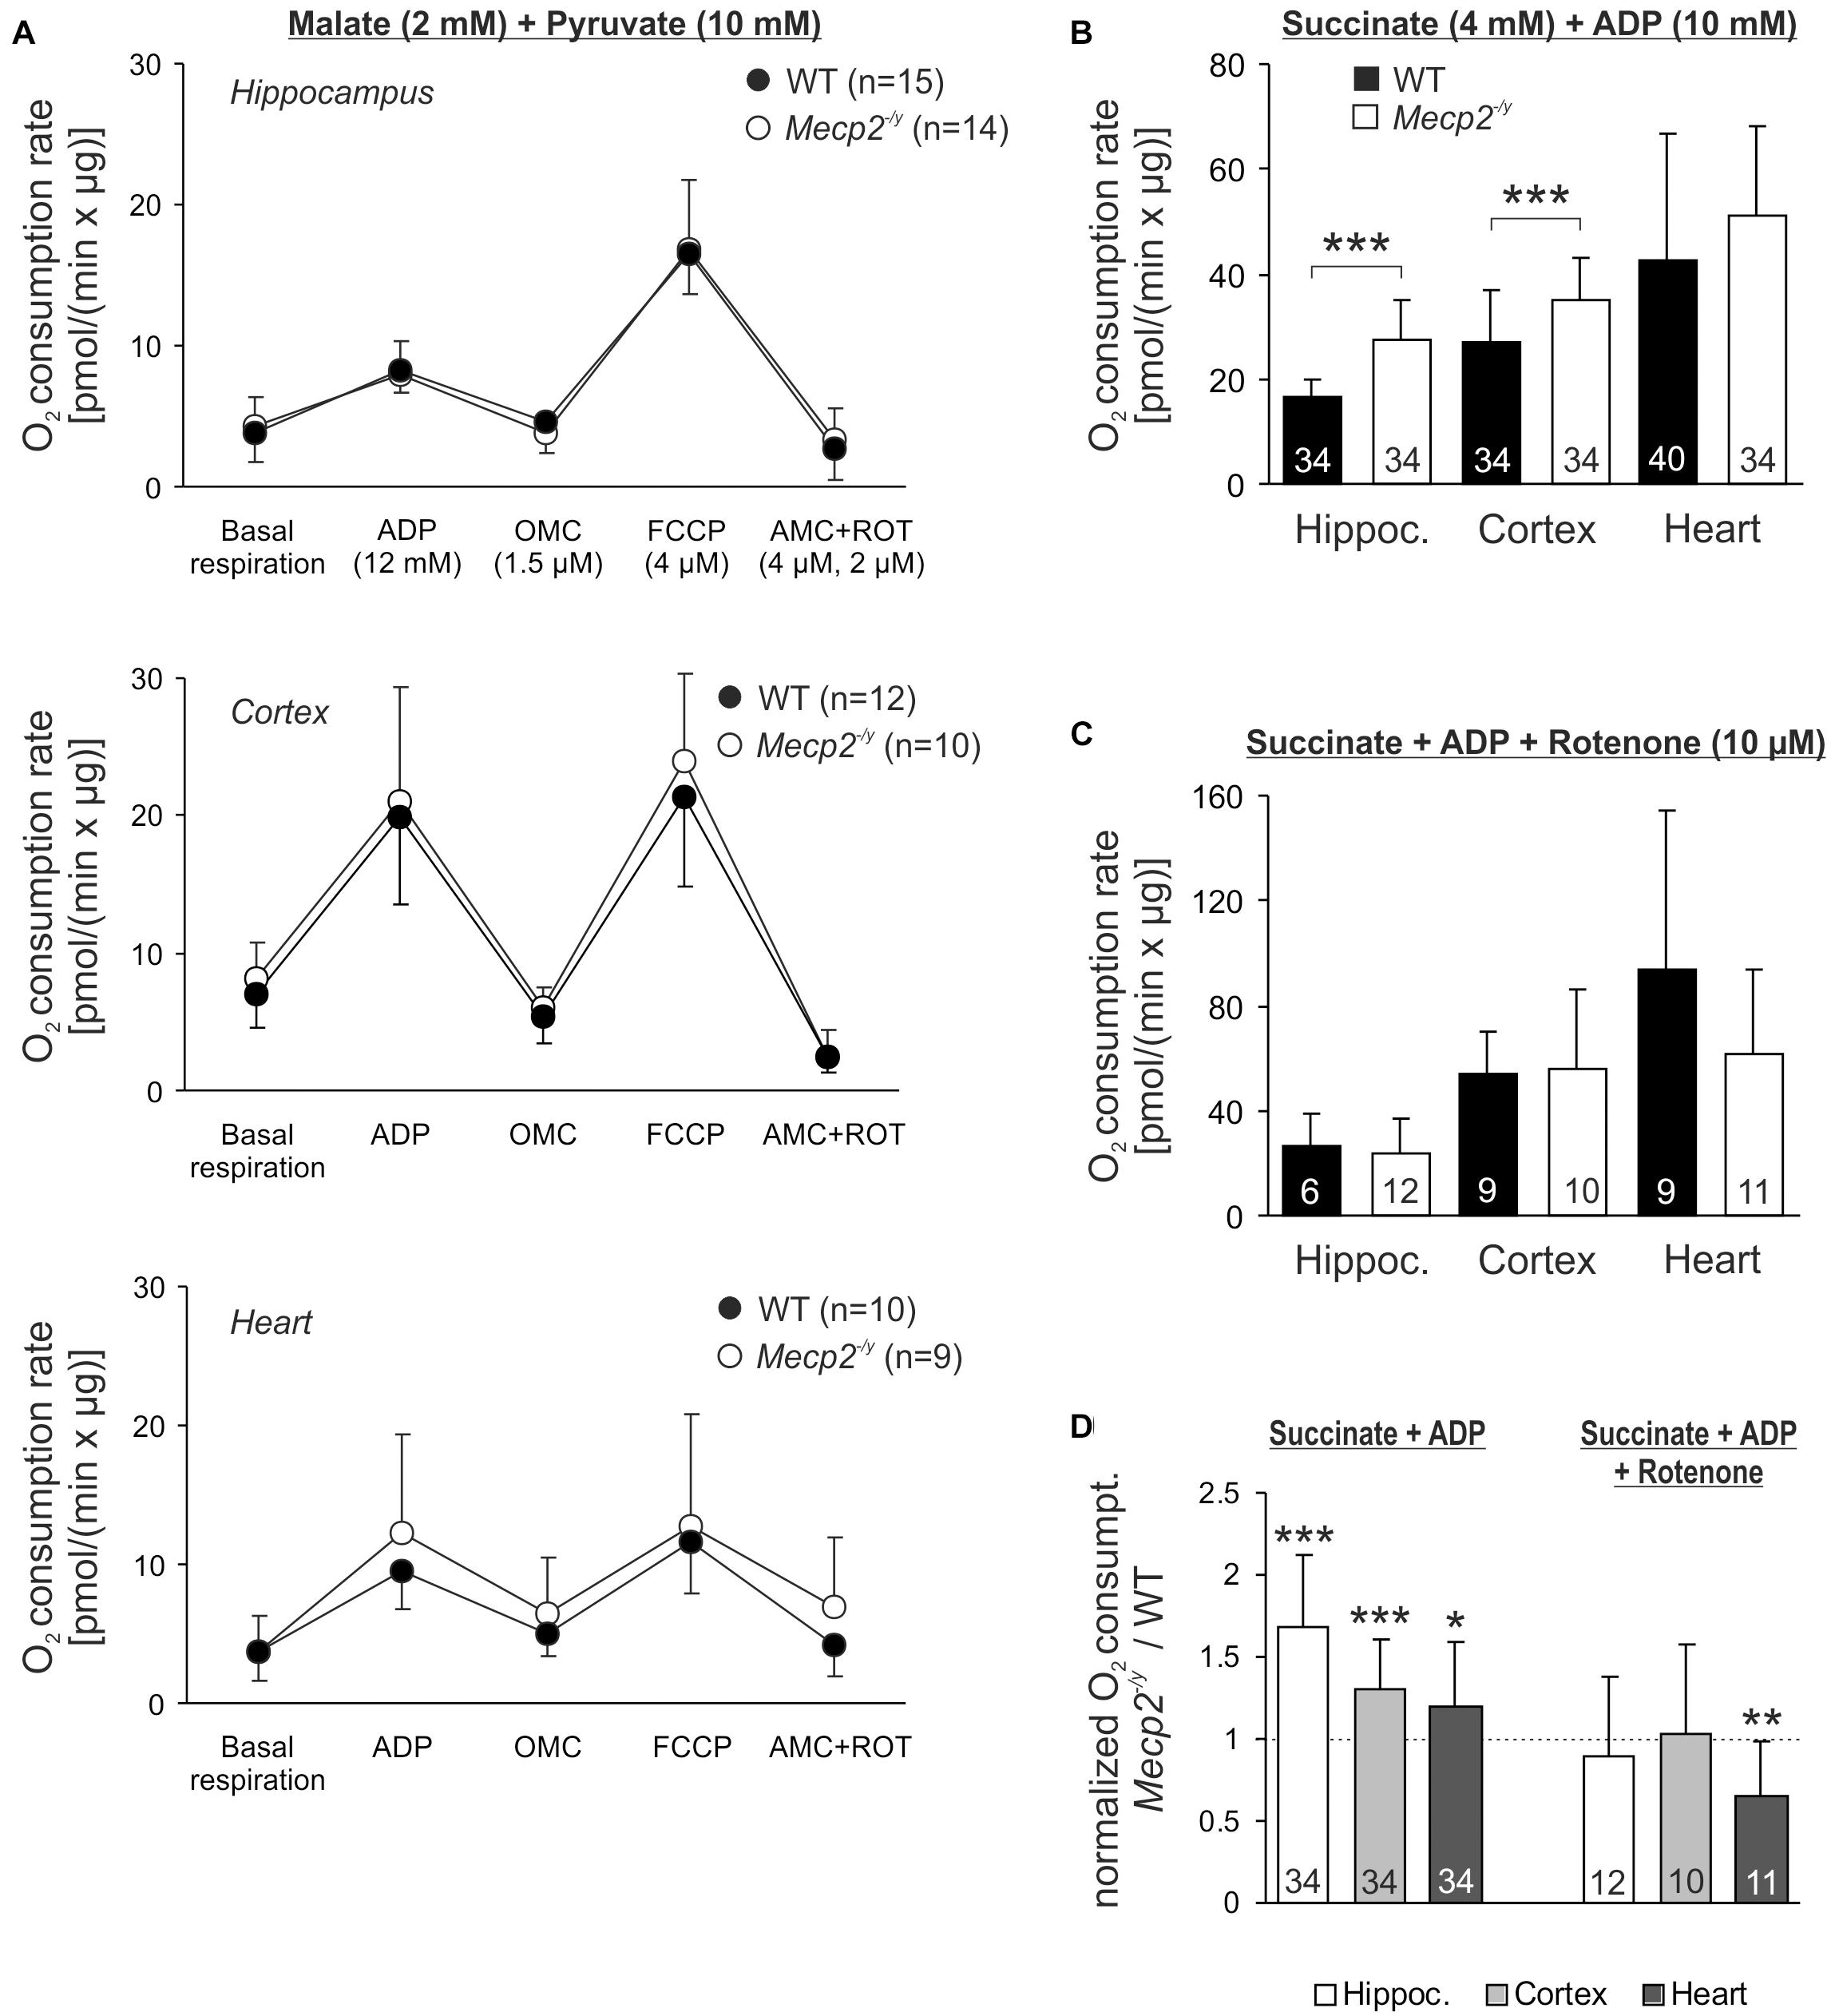
Figure 6. Intensified O2 consumption by mitochondria of Mecp2-/y brain in the presence of CII substrates. (A) O2 consumption rates of isolated mitochondria were measured at basal conditions in the presence of CI substrates. Subsequent measurements were performed after administration of ADP, the uncoupler FCCP and AMC plus rotenone. Neither basal respiration nor the other respiration states differed among WT and Mecp2-/y tissues. The number of samples (mice) analyzed is shown in the legend of each plot. (B) In the presence of ADP and the CII substrate succinate, O2 consumption was increased in Mecp2-/y hippocampal and cortical mitochondria as compared to WT (∗∗∗p < 0.001, unpaired two-tailed t-test). In heart, no changes were found. (C) Rotenone abolished the genotypic differences, suggesting that reverse electron flow from succinate into CI contributes to the increased O2 consumption of mitochondria from Mecp2-/y hippocampus and cortex. (D) The rotenone effect is especially clear, when the mitochondrial O2 consumption rates of Mecp2-/y samples are normalized to the respective WT conditions (∗p < 0.05, ∗∗p < 0.01, ∗∗∗p < 0.001; one sample t-tests).
Recently, a dysfunction of CII was reported for female Rett mice (De Filippis et al., 2015). Therefore, we quantified mitochondrial O2 consumption also in the presence of the CII substrate succinate (4 mM). Indeed, respiration after addition of ADP (10 mM) was increased in Mecp2-/y hippocampus and cortex as compared to WT samples (Figure 6B). In heart, this genotypic difference was not evident. As reverse electron flux through complex I is one of the major mechanisms of mitochondrial ROS production (McLennan and Degli Esposti, 2000; Dröse, 2013), we included rotenone (10 μM) into the assay buffer. Under these conditions, which prevent a reverse electron transport from succinate, the increased O2 consumption rates in Mecp2-/y cortex and hippocampus were no longer evident (Figure 6C). This is in particular evident, when the normalized respiration rates (Mecp2-/y referred to WT) are plotted (Figure 6D).
Mitochondrial ROS Production
To assess whether the altered mitochondrial activities in Mecp2-/y hippocampus and cortex may give rise to an increased oxidative burden, we monitored the ROS generation of mitochondrial suspensions in a spectrofluorometric assay with the oxidation-sensitive dyes H2DCFDA and Amplex UltraRed. The extent and time course of dye oxidation depend on the amount of ROS generated, and were compared for isolated mitochondria from adult WT and Mecp2-/y brains. As both dyes may be prone to photo- and auto-oxidation, we also analyzed control cuvettes containing buffer plus dye but no mitochondria. Monitoring H2DCFDA fluorescence over 20 minutes showed a pronounced oxidation only in the native mitochondria-containing samples and a more intense ROS formation by Mecp2-/y mitochondria (Figure 7A). In contrast, in denaturing buffer (Triton X-100), we did not observe a marked oxidation of H2DCFDA nor any genotypic differences, confirming their dependence on native mitochondria with fully functional respiratory complexes as well as intact mitochondrial membranes (Figure 7B). For verification, we ran this assay also for native mitochondria in the presence of CI plus CII substrates (2 mM malate, 10 mM pyruvate, 4 mM succinate), and again observed a more intense ROS formation in Mecp2-/y than in WT hippocampal and cortical mitochondria (Figure 7C). For further confirmation, mitochondrial ROS formation was then rated also with the more reliable reagent Amplex UltraRed. This again verified a more intense ROS generation in native, energized mitochondria from Mecp2-/y hippocampus and cortex (Figure 7C).
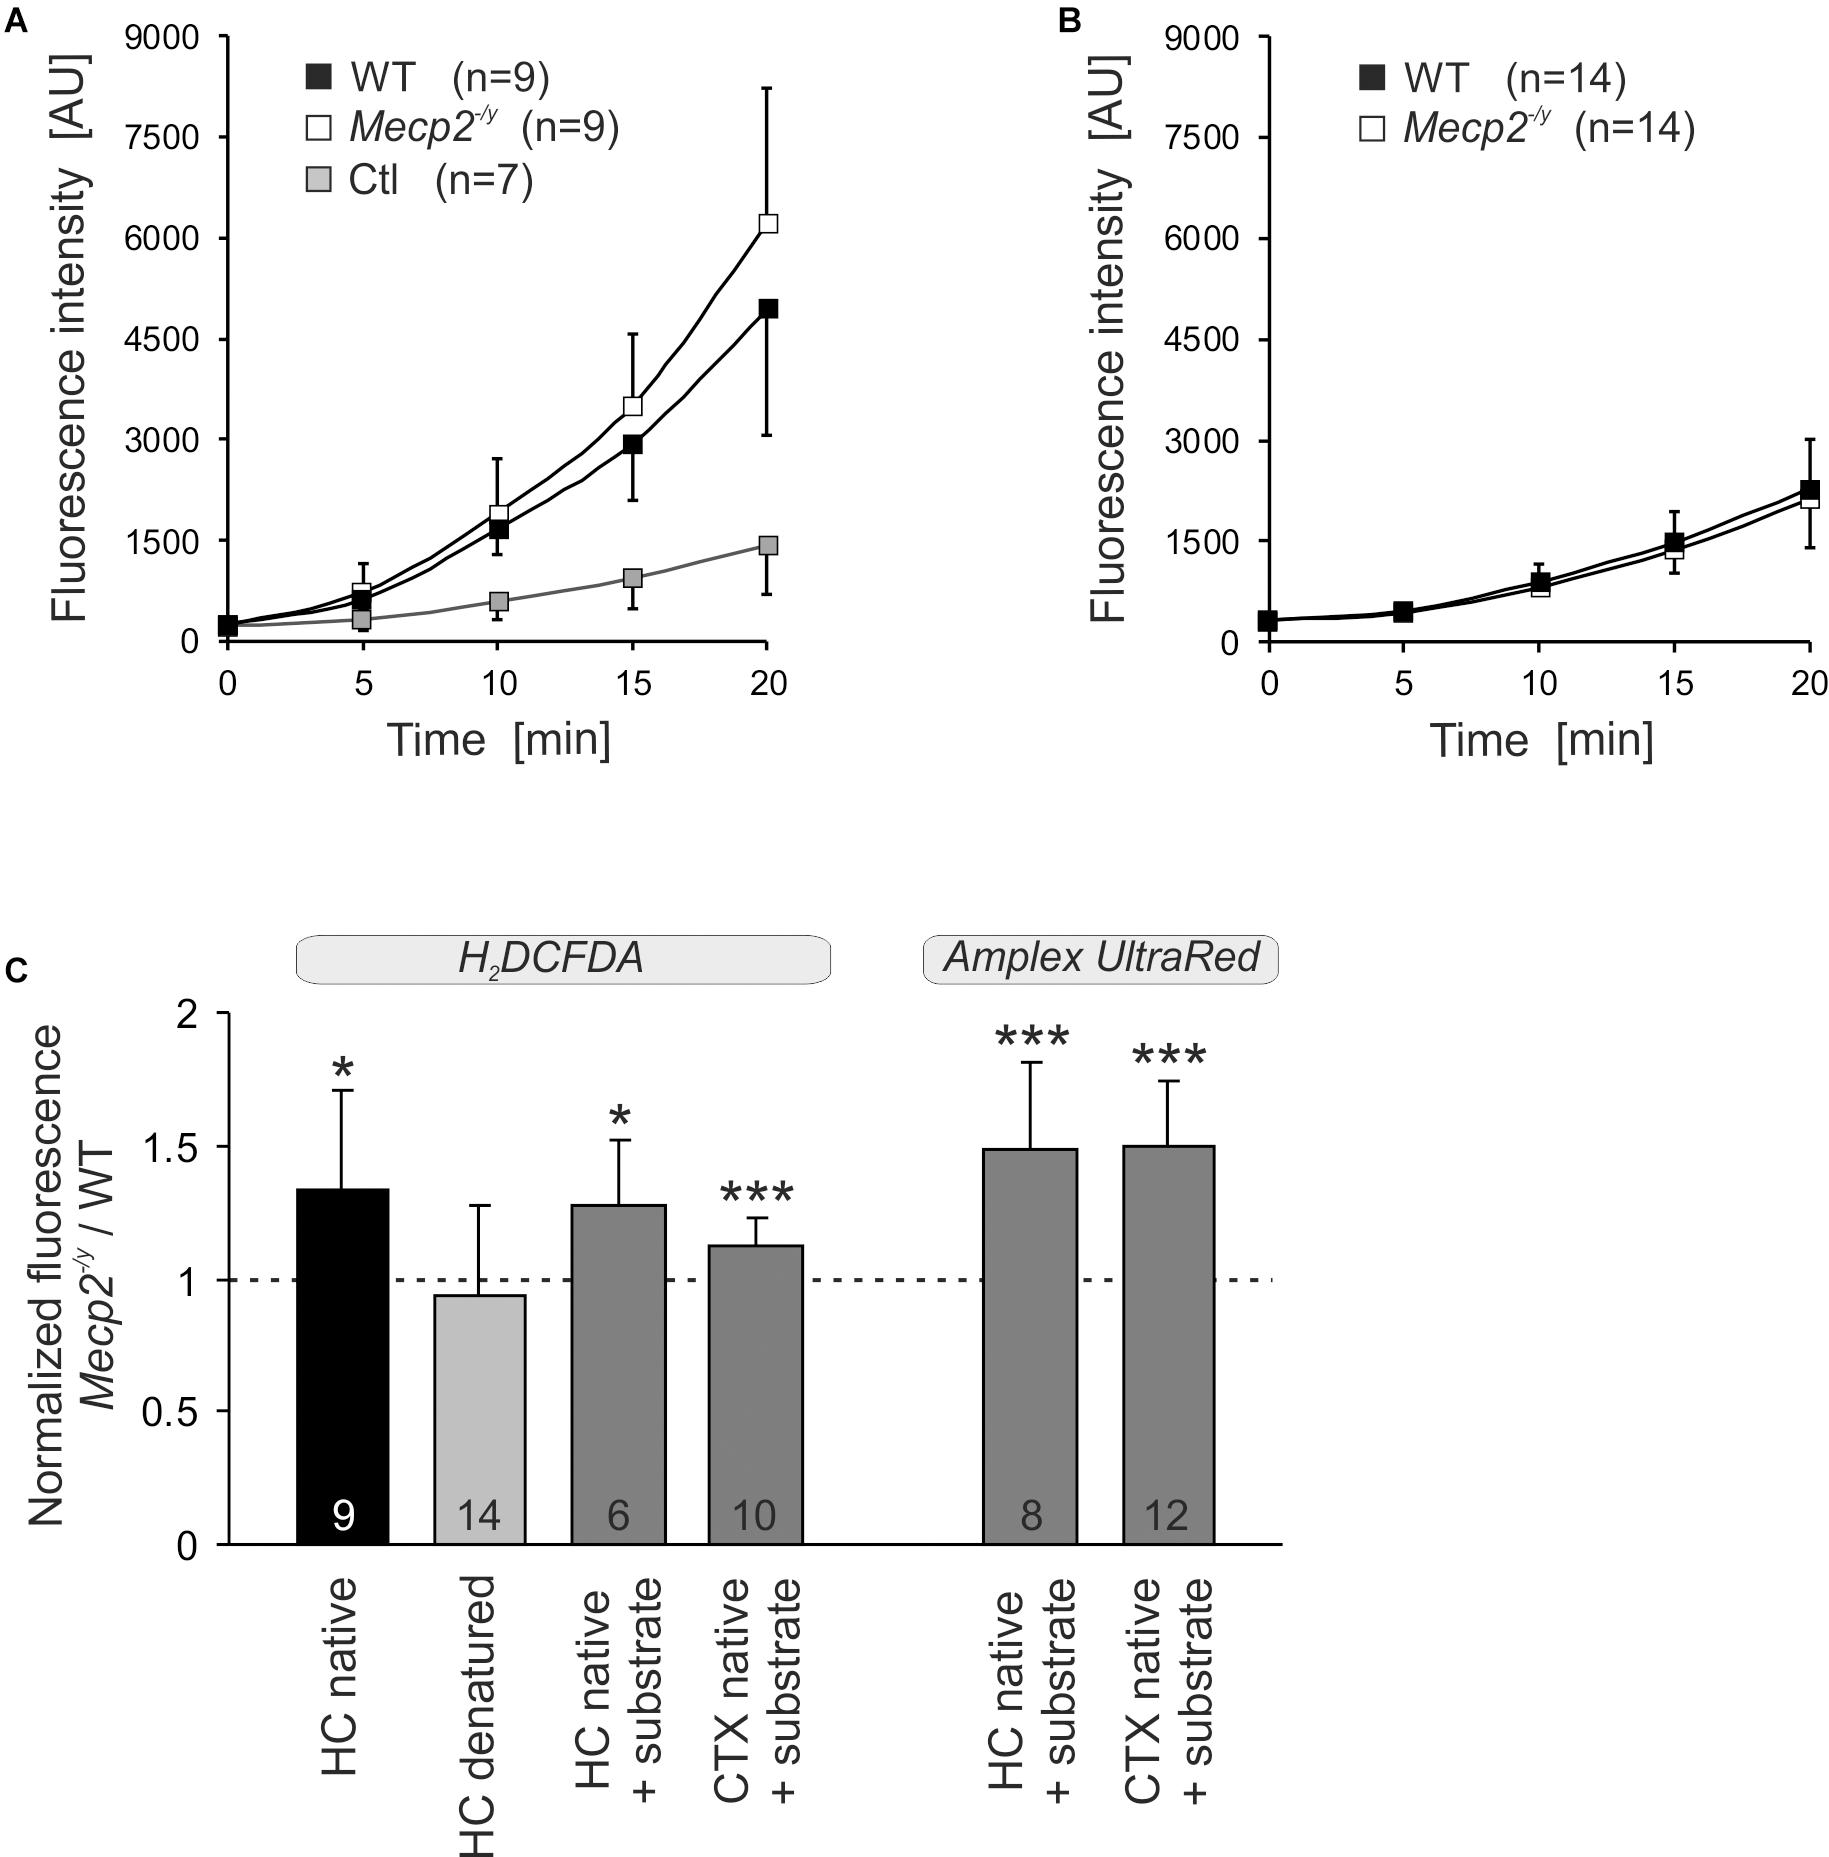
Figure 7. Increased ROS release from mitochondria of Mecp2-/y hippocampus and cortex. (A) ROS generation was quantified in mitochondrial suspensions under native conditions (assay buffer without substrates) using the oxidation-sensitive dye H2DCFDA. Genotypic comparison reveals an increased ROS formation by mitochondria from Mecp2-/y hippocampus. The control cuvettes (Ctl) contain buffer plus dye only and report the extent of photo- and autoxidation of H2DCFDA during the course of this assay. (B) In contrast, under denaturing conditions, neither a pronounced oxidation of H2DCFDA nor a genotypic difference among WT and Mecp2-/y hippocampus was observed. This confirms that it is indeed the native mitochondria, which mediate the marked oxidation of H2DCFDA in this cuvette assay. (C) Also with the substrates malate, pyruvate, and succinate included into the assay buffer, mitochondria from Mecp2-/y hippocampus (HC) and cortex (CTX) released higher amounts of ROS than WT mitochondria (dashed line). This was confirmed unequivocally also with the more reliable reagent Amplex UltraRed. For comparison of the different conditions tested, the normalized fluorescence ratios are plotted, by referring Mecp2-/y responses to the respective WT conditions. The number of samples (mice) analyzed is reported; asterisks mark statistically significant differences as compared to WT (one sample t-tests; ∗p < 0.05, ∗∗∗p < 0.001).
Body Temperature Measurements
Intensified mitochondrial metabolism may result in an increased body temperature, as part of the energy resting in the proton gradient may be converted into heat by regulated uncoupling (Nicholls and Locke, 1984; Ricquier and Bouillaud, 2000). Therefore, we measured the core body temperatures of WT and Mecp2-/y mice (∼PD50). On average, WT males had a body temperature of 37.4 ± 0.6°C (n = 11), whereas it was lower in Mecp2-/y males (35.7 ± 1.1°C, n = 12). Hence, a direct effect of the detected mitochondrial alterations on body temperature can be excluded, and the lower temperature of Mecp2-/y mice is likely a consequence of their markedly reduced body weights (WT 21.5 ± 1.2 g; Mecp2-/y 12.4 ± 2.1 g).
Discussion
In the present study we quantified subcellular redox changes in hippocampal neurons, and assessed molecular changes of the individual respiratory complexes, their enzymatic activities, and their O2 consumption rates in brain and heart tissue. For these analyzes it was essential to ensure a complete lack of MeCP2 in each single cell being studied. Therefore, the heterozygous condition in female Mecp2+/- mice – which would have resulted in a mixed population of cells expressing and lacking MeCP2 – was circumvented by running all experiments on tissue isolated from male mice. Of course, RTT affects mostly females, but here disease mechanisms were studied on the (sub)cellular level. For a later in vivo assessment of redox-balance based therapies, it would of course be essential to include also female mice in the experiments, as only they truthfully represent the clinically relevant heterozygous condition.
Redox Conditions in Mitochondrial Matrix and Cytosol
Subcellular redox conditions were imaged using the genetically encoded roGFP1 sensor (Dooley et al., 2004; Hanson et al., 2004). Whereas our previous studies still relied on lipofection (Großer et al., 2012; Bebensee et al., 2017), we now took advantage of our recently developed viral constructs (Can et al., 2017), to assure a highly neuron-specific expression of roGFP1. With this marked improvement, we specifically addressed redox balance in neurons of Mecp2-/y hippocampus, and obtained for the very first time a functional readout of redox conditions in living MeCP2-deficient cells at subcellular resolution. Clear compartmental differences became apparent. In WT neurons, mitochondria were more oxidized than the cytosol, which corresponds to smooth muscle (Waypa et al., 2010), and our findings in excitatory hippocampal neurons of adult redox-indicator mice (Wagener et al., 2016). Furthermore, in Mecp2-/y neurons, the cytosol was more oxidized than in WT, and it was even more oxidized than the mitochondrial matrix of Mecp2-/y neurons. In RTT, it therefore seems to be especially the cytosolic compartment, which is affected by an impaired and more oxidized redox balance.
In mitochondrial matrix, genotypic differences in redox resting baseline levels were not obvious. Nevertheless, mitochondria may challenge cytosolic redox balance by releasing oxidants. Superoxide is generated especially at CI and CIII (Boveris and Chance, 1973; Votyakova and Reynolds, 2001; Brand, 2010) and it accumulates not only in the matrix but also in the intermembrane space (Brand, 2010), from where it then may reach the cytosol. Indeed, earlier studies on isolated full brain and cerebellar mitochondria demonstrated by homovanillic acid/horseradish peroxidase-based spectrophotometric assays that mitochondria of female Rett mice generate larger amounts of H2O2 than those of WT mice (De Filippis et al., 2015; Valenti et al., 2017).
In line with these reports we observed a more intense oxidation of H2DCFDA and Amplex UltraRed by native Mecp2-/y hippocampal and cortical mitochondria. Despite being a common approach, H2DCFDA-assays need to be interpreted carefully, especially when applied in complex systems such as isolated tissues or intact cells. In contrast to Amplex UltraRed, H2DCFDA is not specific for H2O2 but responds also to hydroxyl radicals, peroxynitrite, and carbonate anion radicals. Furthermore, it may be oxidized by heme proteins or via Fenton chemistry by transition metals, and the enzymatic deacetylation of H2DCFDA as well as the oxidation of H2DCF may intrinsically generate ROS (Rota et al., 1999; Bonini et al., 2006; Wardman, 2007; Kalyanaraman et al., 2012). Therefore, we conducted the H2DCFDA assay in the simplified preparation of isolated mitochondria under native as well as denatured conditions and included respective controls.
In mitochondria-free buffers, an only slight oxidation of H2DCFDA occurred, ruling out transition metal contaminations of assay solutions or pronounced autoxidation. In denatured mitochondria (Triton-X100) a partial oxidation of H2DCFDA but no genotypic differences were seen. Therefore, some transition metal- or heme protein-mediated oxidation of H2DCFDA may have occurred in a genotype-independent manner. As most intense H2DCFDA oxidation and clear genotypic differences were evident in native mitochondria only, they can be assumed to depend largely on an intact inner mitochondrial membrane, a functional respiratory chain and mitochondrial membrane potential, and hence the ROS-formation inherent to mitochondrial (patho)physiology. Quantification or identification of the very oxidants involved is of course not possible with this assay for the above mentioned problems; also the obtained oxidation rates might be overestimated in view of the autocatalytic nature of the fluorescence dye used. For unequivocal confirmation, we therefore ran the Amplex UltradRed assay which specifically detects H2O2 (Zhou et al., 1997; Komary et al., 2010), and verified a more intense H2O2 release for native Mecp2-/y hippocampal and cortical mitochondria. In view of genotype-related differences, it therefore can be concluded that isolated native Mecp2-/y hippocampal and cortical mitochondria mediate a higher oxidative burden than WT mitochondria, which also includes the release of intensified amounts of ROS.
In addition to the differing steady-state redox baselines, acute redox challenges confirmed also a less stable redox homeostasis in Mecp2-/y cytosol and mitochondria. Blocking of CIII elicited more intense oxidizing responses in Mecp2-/y cytosol and mitochondria. Upon O2 withdrawal, both compartments showed more pronounced reducing shifts than those in WT neurons. In contrast, inhibiting SOD1 evoked less intense oxidations in Mecp2-/y cytosol and mitochondria than in WTs, which matches the dampened SOD1 activity found in RTT patient blood samples (Sierra et al., 2001). The cerebral redox-imbalance in RTT is, however, not limited to neurons. Just recently, we found the cytosol of Mecp2-/y hippocampal astrocytes to be more oxidized than in WTs (Bebensee et al., 2017).
The roGFP1 redox sensor contains exposed thiols, which adjust to ambient redox conditions. Therefore, it does not detect a particular oxidant, but rather reports general thiol redox balance, and it behaves as other cell-endogenous redox-sensitive proteins, which are controlled by redox-sensing thiols (Hanson et al., 2004; Meyer and Dick, 2010). Such redox regulation of protein function/activity was estimated to affect >800 (human) proteins (Weerapana et al., 2010). Accordingly, the redox imbalance in cytosol and mitochondria of Mecp2-/y hippocampus may tremendously disturb protein function via either too reducing or too oxidizing conditions. This would already suffice to provoke neuronal dysfunction and distort neuronal network properties, long before oxidative tissue damage occurs.
Mitochondrial Mass and Protein Expression Levels
A crucial aspect, in which our mitochondrial assays differ from most earlier studies is that no sample pooling or full brain analyzes were performed. Instead, to detect subtle differences among Mecp2-/y and WT mice, we analyzed defined brain samples of individual mice. Also, we included heart tissue to assess mitochondrial function in another organ as well. Nevertheless, it is important to recall that even isolated from specified tissues of individual mice, mitochondrial suspensions derive from mixed cell populations, i.e., various neurons and glial cells in the case of brain samples.
Our Western blot analyses on hippocampus and cortex did not indicate any changes in mitochondrial mass. This is in line with MeCP2-deficient mouse fibroblasts and MECP2 mutant human embryonic stem cells differentiated into neurons (Li et al., 2013; Shulyakova et al., 2017). Yet, we saw a trend toward increased mitochondrial mass in Mecp2-/y heart, and cell culture studies found higher mitochondrial contents in microglia (Jin et al., 2015) and hippocampal astrocytes of juvenile Rett mice (Bebensee et al., 2017). In part, an increased mitochondrial mass may serve to compensate the mitochondrial underperformance in RTT. However, this seems to be cell- and tissue-specific, and limited to certain developmental stages or experimental preparations. It certainly cannot explain in general the redox imbalance in RTT.
Rett mouse brains and patient-derived tissues present a heterogeneous spectrum of mitochondrial alterations (Müller and Can, 2014; Valenti et al., 2014; Shulyakova et al., 2017). Seemingly contradictory results arose especially from gene-arrays. An overall upregulation of the subunits of various respiratory complexes was found in blood (lymphomonocytes) of RTT patients (Pecorelli et al., 2013), whereas a genome-wide transcriptional repression, including various mitochondrial proteins, was evident in an embryonic stem cell model of RTT (Li et al., 2013). This emphasizes the importance of standardized procedures and the need of analyzing not only differential transcription, but also final protein levels. Fact is that despite potential candidate genes, details on actual changes in mitochondrial protein expression are still sparse. In late symptomatic male Rett mice, a downregulation of CI was seen in full brain mitochondria (Kriaucionis et al., 2006), and a lower expression of CIV was found in skeletal muscle (Gold et al., 2014). More recent whole brain studies on female MeCP2-308 mice did not reveal any obvious alterations of the individual mitochondrial complexes (De Filippis et al., 2015; Valenti et al., 2017). Instead, alterations were region specific, affecting the striatum in which CI and CIII showed lowered protein expression levels (De Filippis et al., 2015).
This regional specificity corroborates our results from symptomatic Mecp2-/y mice. CI (NDUFB8) was slightly less expressed in Mecp2-/y hippocampus and cortex than in WT, and CV (ATP5B) was slightly less expressed in Mecp2-/y cortex. Interesting in view of the CII-related intensified O2 consumption in Mecp2-/y hippocampus and cortex may be the trend toward an increased CII expression (SDHA) in these areas. Evidence for a lowered expression of CIV, as reported for post mortem frontal cortex of patients (Gibson et al., 2010), was not found in our mouse samples. Interestingly, in heart tissue no genotypic differences in the expression of the respiratory complexes were detected.
Functionality and Stability of Respiratory Supercomplexes
The intensified mitochondrial ROS generation in Rett mice and the associated oxidative stress could aggravate mitochondrial dysfunction by destabilizing individual subunits of the supercomplex, abolishing facilitated electron channeling and releasing further ROS. However, steady state protein levels of the core components of the respiratory chain did not reveal noticeable changes. Neither were any obvious genotypic differences in the organization or enzymatic activity of mitochondrial supercomplexes detected in hippocampus, cortex and heart. Thus, a structural remodeling of the highly energy efficient supramolecular assemblies cannot be a cause for the limited mitochondrial performance in RTT.
This does not rule out, however, that the altered metabolic rate of isolated mitochondria may arise from a differential expression or altered enzymatic activities of some smaller regulatory subunits of these supercomplexes. Along this line, protein kinase A-dependent phosphorylation of CI (NDUFS4), which controls respiratory capacity and mitochondrial ROS formation, is decreased in the cerebellum of female Rett mice (De Filippis et al., 2015). Also elevated expression of the adenine nucleotide transporter 1 (ANT1) was proposed to cause an enhanced basal H+ leak of the inner mitochondrial membrane, followed by a compensatory increase of mitochondrial respiration (Shulyakova et al., 2017).
In-gel activity staining revealed no obvious genotype-specific defects in the enzymatic activities of CI, CIV, and CV. This suggests that at least in hippocampus, cortex and heart of Mecp2-/y mice, enzymatic activities of mitochondrial complexes are mostly intact. In line with this is also the unaltered ATP content we detected in the hippocampus of symptomatic Mecp2-/y mice (Fischer et al., 2009). Earlier studies on full brains mostly found reduced mitochondrial activities. Heterozygous female Rett mice (MeCP2-308) show lower CII and CV enzyme activities (De Filippis et al., 2015), whereas in Mecp2+/- mice CI, CII, and CV are less active (Valenti et al., 2017). In contrast, for Mecp2-/y mice a reduced CIV activity and an enhanced CIII activity were reported (Kriaucionis et al., 2006). Also skeletal muscle analyses revealed dampened enzyme activities of CII, CIII, and CIV in male MeCP2-deficient mice (Gold et al., 2014). Similarly, in patient muscle, succinate cytochrome c reductase (CII–CIII) and CIV activities are diminished (Coker and Melnyk, 1991). Analyzing cardiac muscle, we did not detect any changes in the enzyme activities of the respiratory complexes.
Mitochondrial O2 Consumption Rates
Quantifying mitochondrial O2 consumption revealed no changes for Mecp2-/y heart, but increased rates for Mecp2-/y hippocampus and cortex fueled by CII substrates. This genotypic difference vanished in the presence of rotenone, which suggests that reverse electron flow into CI may be a contributing factor. As CII is not integrated structurally into the respiratory chain supercomplexes, we did not expect to observe any corresponding structural differences in the native gel electrophoresis. Others determined the O2 consumption rates of mitochondria from whole Mecp2-/y brain with polarographic O2 electrodes, and observed elevated rates for all respiration states (Kriaucionis et al., 2006). Also in Mecp2-/y microglia the O2 consumption is increased (Jin et al., 2015). In female Rett mice (MeCP2-308), increased respiratory rates were found in full brain-derived mitochondria fueled by complex II substrates (De Filippis et al., 2015; Valenti et al., 2017), indicating that mitochondrial defects also extend to the milder heterozygous genotype. In contrast, MECP2 mutant human neurons, derived from stem cells, showed a lower basal O2 consumption, and reduced maximal respiration rate (Li et al., 2013), but these data were normalized to cell count and not to protein content.
As the observed reverse electron flow into CI may provoke maximal mitochondrial ROS production – especially with succinate as substrate (Votyakova and Reynolds, 2001) – this may well explain the more oxidized redox balance in Mecp2-/y hippocampal neurons, and similar conditions can be expected for cortical neurons. Others report intensified H2O2 formation by isolated brain mitochondria (De Filippis et al., 2015; Valenti et al., 2017) and elevated oxidative stress markers in blood, muscle and brain of Rett mice (De Felice et al., 2014; Gold et al., 2014).
A potential impact of the detected redox- and metabolic alterations on mitochondrial morphology remains to be elucidated. Our current focus was on functional aspects; nevertheless, this structural/functional interaction may be of interest as the RTT–related alterations in mitochondrial function may not necessarily be accompanied by gross alterations in their morphology (Kriaucionis et al., 2006).
Conclusion
Our study confirms by quantitative subcellular redox imaging that the redox imbalance in RTT affects neurons and involves their cytosol and mitochondria. Major changes in the expression and enzyme activity of the respiratory complexes were not found, and a dissociation of mitochondrial supercomplexes was ruled out. Accordingly, massive mitochondrial defects and/or marked dysfunction of entire respiratory complexes can be excluded, which matches the observation that a pronounced neurodegeneration does not occur in RTT (Armstrong et al., 1995). Instead, only moderate alterations in mitochondrial function and/or mitochondrial regulation are to be expected, which may result in an inefficient electron flow within the respiratory chain, but do not threaten cellular viability. In line with this concept, mitochondria from Mecp2-/y hippocampus and cortex consumed more O2. This confirms the earlier proposed intensified mitochondrial respiration rates (Kriaucionis et al., 2006; Großer et al., 2012) and supports the concept that the mitochondrial underperformance in RTT may be considered an “energy wasting state” with increased O2 consumption but lowered ATP production (Jin et al., 2015). In view of these changes and the increased mitochondria mediated oxidative stress and ROS formation detected by us and others (De Filippis et al., 2015; Valenti et al., 2017), a causal chain appears more than likely. It spans from increased mitochondrial activity and O2 consumption, over exaggerated mitochondrial ROS release and cytosolic/mitochondrial redox imbalance to disturbed neuronal network function and a facilitation of disease progression.
Interestingly, alterations in mitochondrial morphology and metabolism with closely associated oxidative stress have also been confirmed for autism-spectrum disorders, Down syndrome and fragile X syndrome, which suggests that these alterations may be common to a broad array of genetic disorders with are closely associated with intellectual disabilities [see: (Rossignol and Frye, 2012; Valenti et al., 2014)]. Hence, a chain of common disease mechanisms may have to be considered, which emphasizes the importance of clarifying the detailed interrelation of mitochondrial alterations, redox imbalance and symptom severity.
In human neuroblastoma cells, a direct causal link of MeCP2 availability and mitochondrial function was proven by MeCP2 knockdown, which resulted in a diminished cytochrome c oxidase activity (Gibson et al., 2010). Accordingly, a therapeutic targeting of mitochondria appears promising. Indeed treating female Rett mice with the serotonin receptor 7 agonist LP-211 or the bacterial protein CNF1 (cytotoxic necrotizing factor 1) improved mitochondrial function and dampened their ROS production (De Filippis et al., 2015; Valenti et al., 2017). Therefore, it will be crucial now to define in detail the exact time course of mitochondrial impairment as well as the particular brain areas affected by these alterations and the downstream redox-imbalance. Only then, it will be possible to assess and judge reliably the potential merits of mitochondria- and redox-directed treatments in RTT.
Ethics Statement
All experiments were in accordance with German regulations and authorized by the Office of Animal Welfare of the University Medical Center Göttingen as well as by the Lower Saxony State Office for Consumer Protection and Food Safety.
Author Contributions
KC planned and conducted the redox-imaging experiments, analyzed the data and generated the figures, and contributed to writing of the manuscript. CM, LR, and GG planned and conducted the biochemical mitochondria-analyzes, analyzed the data and generated the figures, and contributed to writing of the manuscript. PR supervised all mitochondrial analyzes and commented data and manuscript. SK designed and generated the viral expression vectors and commented data and manuscript. JD co-supervised and planned the biochemical analyzes, commented data and manuscript, and contributed to manuscript writing. MM planned and supervised the entire project, finalized the data analyzes and data presentations, and prepared the final version of the manuscript. All authors read and agreed to the final version of the manuscript.
Funding
This study was supported by the Cluster of Excellence and DFG Research Center Nanoscale Microscopy and Molecular Physiology of the Brain (CNMPB), the International Rett Syndrome Foundation (IRSF, research grant #2817), and the SFB1286. GG was supported by a fellowship of the Carl Friedrich Lehman-Haupt International Doctoral Program (Volkswagen Stiftung and Shota Rustaveli Science Foundation of Georgia). The publication costs of this article were covered by the Open Access Publishing Programme of the DFG.
Conflict of Interest Statement
The authors declare that the research was conducted in the absence of any commercial or financial relationships that could be construed as a potential conflict of interest.
Acknowledgments
We are grateful to Belinda Kempkes for her expert technical assistance and to Prof. S. James Remington (Institute of Molecular Biology, University of Oregon, Eugene, OR, United States) for making available to us the plasmids expressing roGFP1 redox-sensitive proteins as well as their sequences.
Abbreviations
ACSF, artificial cerebrospinal fluid; AMC, antimycin A; ATP5B, ATP synthase subunit beta; BN-PAGE, blue native polyacrylamide gel electrophoresis; CI complex I, NADH dehydrogenase; CII complex II, succinate dehydrogenase; CIII complex III, coenzyme Q-cytochrome c reductase; CIV complex IV, cytochrome c oxidase; CV complex IV, ATP synthase F1Fo-ATPase; DEDTC, diethyldithiocarbamic acid; DIV, days in vitro; DTT, 1,4-dithio-DL-threitol; EroGFP1, roGFP1 reduction potential; FCCP, carbonyl cyanide 4-(trifluoromethoxy)phenylhydrazone; F1Fo-ATPase, ATP synthase, complex V; GAPDH, glyceraldehyde-3-phosphate dehydrogenase; GSH, reduced glutathione; H2DCFDA, 2′,7′-dichlorodihydrofluorescein diacetate; HBSS, Hanks’-balanced salt solution; HEPES, 4-(2-hydroxyethyl)piperazine-1-ethanesulfonic acid; MAS, mitochondrial assay solution; MeCP2, methyl-CpG binding protein 2, protein; MECP2, methyl-CpG binding protein 2, encoding gene (human); Mecp2, methyl-CpG binding protein 2, encoding gene (mouse); Mecp2-/y, MeCP2-deficient male mouse (hemizygous); Mecp2+/-, MeCP2-deficient female mouse (heterozygous); NDUFB8, NADH dehydrogenase (ubiquinone) 1 beta subcomplex 8; NTB, nitrotetrazolium blue; OxDroGFP1, relative degree of roGFP1 oxidation; PD, postnatal day; PMSF, phenylmethyl-sulfonyl fluoride; roGFP1, reduction-oxidation sensitive green fluorescent protein 1; ROS, reactive oxygen species; R, fluorescence ratio (F395/F470); Rox, ratio corresponding to full oxidation; Rred, ratio corresponding to full reduction; RTT, Rett syndrome; SDHA, succinate dehydrogenase subunit A; SDS-PAGE, sodium dodecyl sulfate polyacrylamide gel electrophoresis; SOD1, Cu/Zn superoxide dismutase; TBS, Tris-buffered saline; WT, wildtype; VDAC3, voltage-dependent anion channel 3.
References
Amir, R. E., Van Den Veyver, I. B., Wan, M., Tran, C. Q., Francke, U., and Zoghbi, H. Y. (1999). Rett syndrome is caused by mutations in X-linked MECP2, encoding methyl-CpG-binding protein 2. Nat. Genet. 23, 185–188. doi: 10.1038/13810
Argan, C., Lusty, C. J., and Shore, G. C. (1983). Membrane and cytosolic components affecting transport of the precursor for ornithine carbamyltransferase into mitochondria. J. Biol. Chem. 258, 6667–6670.
Armstrong, D., Dunn, J. K., Antalffy, B., and Trivedi, R. (1995). Selective dendritic alterations in the cortex of Rett syndrome. J. Neuropathol. Exp. Neurol. 54, 195–201. doi: 10.1097/00005072-199503000-00006
Bailey, N. T. J. (ed.) (1992). Statistical Methods in Biology. New York, NY: Cambridge University Press.
Bebensee, D. F., Can, K., and Müller, M. (2017). Increased mitochondrial mass and cytosolic redox imbalance in hippocampal astrocytes of a mouse model of Rett syndrome: subcellular changes revealed by ratiometric imaging of JC-1 and roGFP1 fluorescence. Oxid Med. Cell Longev. 2017:3064016.
Belichenko, P. V., Wright, E. E., Belichenko, N. P., Masliah, E., Li, H. H., Mobley, W. C., et al. (2009). Widespread changes in dendritic and axonal morphology in Mecp2-mutant mouse models of Rett syndrome: evidence for disruption of neuronal networks. J. Compar. Neurol. 514, 240–258. doi: 10.1002/cne.22009
Bonini, M. G., Rota, C., Tomasi, A., and Mason, R. P. (2006). The oxidation of 2′,7′-dichlorofluorescin to reactive oxygen species: a self-fulfilling prophesy? Free Radic. Biol. Med. 40, 968–975. doi: 10.1016/j.freeradbiomed.2005.10.042
Boveris, A., and Chance, B. (1973). The mitochondrial generation of hydrogen peroxide. General properties and effect of hyperbaric oxygen. Biochem. J. 134, 707–716. doi: 10.1042/bj1340707
Brand, M. D. (2010). The sites and topology of mitochondrial superoxide production. Exp. Gerontol. 45, 466–472. doi: 10.1016/j.exger.2010.01.003
Can, K., Kügler, S., and Müller, M. (2017). “Live imaging of mitochondrial ROS production and dynamic redox balance in neurons,” in Techniques to Investigate Mitochondrial Function in Neurons, eds S. Strack and Y. M. Usachev (Berlin: Springer), 179–197. doi: 10.1007/978-1-4939-6890-9_9
Chahrour, M., and Zoghbi, H. Y. (2007). The story of Rett syndrome: from clinic to neurobiology. Neuron 56, 422–437. doi: 10.1016/j.neuron.2007.10.001
Chen, Y.-C., Taylor, E. B., Dephoure, N., Heo, J.-M., Tonhato, A., Papandreou, I., et al. (2012). Identification of a protein mediating respiratory supercomplex stability. Cell Metab. 15, 348–360. doi: 10.1016/j.cmet.2012.02.006
Coker, S. B., and Melnyk, A. R. (1991). Rett syndrome and mitochondrial enzyme deficiencies. J. Child Neurol. 6, 164–166. doi: 10.1177/088307389100600216
Cornford, M. E., Philippart, M., Jacobs, B., Scheibel, A. B., and Vinters, H. V. (1994). Neuropathology of Rett syndrome: case report with neuronal and mitochondrial abnormalities in the brain. J. Child Neurol. 9, 424–431. doi: 10.1177/088307389400900419
De Felice, C., Ciccoli, L., Leoncini, S., Signorini, C., Rossi, M., Vannuccini, L., et al. (2009). Systemic oxidative stress in classic Rett syndrome. Free Radic. Biol. Med. 47, 440–448. doi: 10.1016/j.freeradbiomed.2009.05.016
De Felice, C., Della Ragione, F., Signorini, C., Leoncini, S., Pecorelli, A., Ciccoli, L., et al. (2014). Oxidative brain damage in Mecp2-mutant murine models of Rett syndrome. Neurobiol. Dis. 68, 66–77. doi: 10.1016/j.nbd.2014.04.006
De Felice, C., Signorini, C., Leoncini, S., Pecorelli, A., Durand, T., Valacchi, G., et al. (2012). The role of oxidative stress in Rett syndrome: an overview. Ann. N. Y. Acad. Sci. 1259, 121–135. doi: 10.1111/j.1749-6632.2012.06611.x
De Filippis, B., Valenti, D., De Bari, L., De Rasmo, D., Musto, M., Fabbri, A., et al. (2015). Mitochondrial free radical overproduction due to respiratory chain impairment in the brain of a mouse model of Rett syndrome: protective effect of CNF1. Free Radic. Biol. Med. 83, 167–177. doi: 10.1016/j.freeradbiomed.2015.02.014
Dekker, P. J., Martin, F., Maarse, A. C., Bömer, U., Müller, H., Guiard, B., et al. (1997). The Tim core complex defines the number of mitochondrial translocation contact sites and can hold arrested preproteins in the absence of matrix Hsp70-Tim44. EMBO J. 16, 5408–5419. doi: 10.1093/emboj/16.17.5408
DiMauro, S., and Schon, E. A. (2003). Mitochondrial respiratory-chain diseases. N. Engl. J. Med. 348, 2656–2668.
Dooley, C. T., Dore, T. M., Hanson, G. T., Jackson, W. C., Remington, S. J., and Tsien, R. Y. (2004). Imaging dynamic redox changes in mammalian cells with green fluorescent protein indicators. J. Biol. Chem. 279, 22284–22293. doi: 10.1074/jbc.m312847200
Dröse, S. (2013). Differential effects of complex II on mitochondrial ROS production and their relation to cardioprotective pre- and postconditioning. Biochim. Biophys. Acta 1827, 578–587. doi: 10.1016/j.bbabio.2013.01.004
Dudek, J., Cheng, I. F., Chowdhury, A., Wozny, K., Balleininger, M., Reinhold, R., et al. (2016). Cardiac-specific succinate dehydrogenase deficiency in Barth syndrome. EMBO Mol. Med. 8, 139–154. doi: 10.15252/emmm.201505644
Dumay, A., Rincheval, V., Trotot, P., Mignotte, B., and Vayssiere, J. L. (2006). The superoxide dismutase inhibitor diethyldithiocarbamate has antagonistic effects on apoptosis by triggering both cytochrome c release and caspase inhibition. Free Radic. Biol. Med. 40, 1377–1390. doi: 10.1016/j.freeradbiomed.2005.12.005
Eeg-Olofsson, O., Al-Zuhair, A. G., Teebi, A. S., Daoud, A. S., Zaki, M., Besisso, M. S., et al. (1990). Rett syndrome: a mitochondrial disease? J. Child Neurol. 5, 210–214.
Fischer, M., Reuter, J., Gerich, F. J., Hildebrandt, B., Hägele, S., Katschinski, D., et al. (2009). Enhanced hypoxia susceptibility in hippocampal slices from a mouse model of Rett syndrome. J Neurophysiol. 101, 1016–1032. doi: 10.1152/jn.91124.2008
Funke, F., Gerich, F. J., and Müller, M. (2011). Dynamic, semi-quantitative imaging of intracellular ROS levels and redox status in rat hippocampal neurons. Neuroimage 54, 2590–2602. doi: 10.1016/j.neuroimage.2010.11.031
Gibson, J. H., Slobedman, B., K. N. H., Williamson, S. L., Minchenko, D., El-Osta, A., et al. (2010). Downstream targets of methyl CpG binding protein 2 and their abnormal expression in the frontal cortex of the human Rett syndrome brain. BMC Neurosci. 11:53. doi: 10.1186/1471-2202-11-53
Gold, W. A., Williamson, S. L., Kaur, S., Hargreaves, I. P., Land, J. M., Pelka, G. J., et al. (2014). Mitochondrial dysfunction in the skeletal muscle of a mouse model of Rett syndrome (RTT): implications for the disease phenotype. Mitochondrion 15, 10–17. doi: 10.1016/j.mito.2014.02.012
Großer, E., Hirt, U., Janc, O. A., Menzfeld, C., Fischer, M., Kempkes, B., et al. (2012). Oxidative burden and mitochondrial dysfunction in a mouse model of Rett syndrome. Neurobiol. Dis. 48, 102–114. doi: 10.1016/j.nbd.2012.06.007
Guy, J., Hendrich, B., Holmes, M., Martin, J. E., and Bird, A. (2001). A mouse Mecp2-null mutation causes neurological symptoms that mimic Rett syndrome. Nat. Genet. 27, 322–326. doi: 10.1038/85899
Hagberg, B., Aicardi, J., Dias, K., and Ramos, O. (1983). A progressive syndrome of autism, dementia, ataxia, and loss of purposeful hand use in girls: Rett’s syndrome: report of 35 cases. Ann. Neurol. 14, 471–479. doi: 10.1002/ana.410140412
Hanson, G. T., Aggeler, R., Oglesbee, D., Cannon, M., Capaldi, R. A., Tsien, R. Y., et al. (2004). Investigating mitochondrial redox potential with redox-sensitive green fluorescent protein indicators. J. Biol. Chem. 279, 13044–13053. doi: 10.1074/jbc.m312846200
Iqbal, J., and Whitney, P. (1991). Use of cyanide and diethyldithiocarbamate in the assay of superoxide dismutases. Free Radic. Biol. Med. 10, 69–77. doi: 10.1016/0891-5849(91)90023-v
Jin, L. W., Horiuchi, M., Wulff, H., Liu, X. B., Cortopassi, G. A., Erickson, J. D., et al. (2015). Dysregulation of glutamine transporter SNAT1 in Rett syndrome microglia: a mechanism for mitochondrial dysfunction and neurotoxicity. J. Neurosci. 35, 2516–2529. doi: 10.1523/jneurosci.2778-14.2015
Kalyanaraman, B., Darley-Usmar, V., Davies, K. J., Dennery, P. A., Forman, H. J., Grisham, M. B., et al. (2012). Measuring reactive oxygen and nitrogen species with fluorescent probes: challenges and limitations. Free Radic. Biol. Med. 52, 1–6. doi: 10.1016/j.freeradbiomed.2011.09.030
Komary, Z., Tretter, L., and Adam-Vizi, V. (2010). Membrane potential-related effect of calcium on reactive oxygen species generation in isolated brain mitochondria. Biochim. Biophys. Acta 1797, 922–928. doi: 10.1016/j.bbabio.2010.03.010
Kriaucionis, S., Paterson, A., Curtis, J., Guy, J., Macleod, N., and Bird, A. (2006). Gene expression analysis exposes mitochondrial abnormalities in a mouse model of Rett syndrome. Mol. Cell. Biol. 26, 5033–5042. doi: 10.1128/mcb.01665-05
Lenaz, G., and Genova, M. L. (2012). Supramolecular organisation of the mitochondrial respiratory chain: a new challenge for the mechanism and control of oxidative phosphorylation. Adv. Exp. Med. Biol. 748, 107–144. doi: 10.1007/978-1-4614-3573-0_5
Li, Y., Wang, H., Muffat, J., Cheng, A. W., Orlando, D. A., Loven, J., et al. (2013). Global transcriptional and translational repression in human-embryonic-stem-cell-derived Rett syndrome neurons. Cell Stem Cell 13, 446–458. doi: 10.1016/j.stem.2013.09.001
Mattiasson, G. (2004). Analysis of mitochondrial generation and release of reactive oxygen species. Cytometry A 62, 89–96. doi: 10.1002/cyto.a.20089
McLennan, H. R., and Degli Esposti, M. (2000). The contribution of mitochondrial respiratory complexes to the production of reactive oxygen species. J. Bioenergy Biomembr. 32, 153–162.
Meyer, A. J., and Dick, T. P. (2010). Fluorescent protein-based redox probes. Antioxid. Redox Signal. 13, 621–650. doi: 10.1089/ars.2009.2948
Mitchell, P. (1961). Coupling of phosphorylation to electron and hydrogen transfer by a chemi-osmotic type of mechanism. Nature 191, 144–148. doi: 10.1038/191144a0
Müller, M. (2019). Disturbed redox homeostasis and oxidative stress: potential players in the developmental regression in Rett syndrome. Neurosci. Biobehav. Rev. 98, 154–163. doi: 10.1016/j.neubiorev.2018.12.009
Müller, M., and Can, K. (2014). Aberrant redox homoeostasis and mitochondrial dysfunction in Rett syndrome. Biochem. Soc. Trans. 42, 959–964. doi: 10.1042/bst20140071
Nicholls, D. G., and Locke, R. M. (1984). Thermogenic mechanisms in brown fat. Physiol. Rev. 64, 1–64. doi: 10.1152/physrev.1984.64.1.1
Pacheu-Grau, D., Bareth, B., Dudek, J., Juris, L., Vögtle, F. N., Wissel, M., et al. (2015). Cooperation between COA6 and SCO2 in COX2 maturation during cytochrome c oxidase assembly links two mitochondrial cardiomyopathies. Cell Metab. 21, 823–833. doi: 10.1016/j.cmet.2015.04.012
Park, M. J., Aja, S., Li, Q., Degano, A. L., Penati, J., Zhuo, J., et al. (2014). Anaplerotic triheptanoin diet enhances mitochondrial substrate use to remodel the metabolome and improve lifespan, motor function, and sociability in MeCP2-null mice. PLoS One 9:e109527. doi: 10.1371/journal.pone.0109527
Pecorelli, A., Leoni, G., Cervellati, F., Canali, R., Signorini, C., Leoncini, S., et al. (2013). Genes related to mitochondrial functions, protein degradation, and chromatin folding are differentially expressed in lymphomonocytes of Rett syndrome patients. Mediat. Inflamm. 2013:137629.
Rett, A. (1966). Über ein eigenartiges hirnatrophisches syndrom bei hyperammonämie im Kindesalter. Wien Med. Wochenschr. 116, 723–726.
Ricquier, D., and Bouillaud, F. (2000). Mitochondrial uncoupling proteins: from mitochondria to the regulation of energy balance. J. Physiol. 529, 3–10. doi: 10.1111/j.1469-7793.2000.00003.x
Rönnbäck, A., Pavlov, P. F., Mansory, M., Gonze, P., Marlière, N., Winblad, B., et al. (2016). Mitochondrial dysfunction in a transgenic mouse model expressing human amyloid precursor protein (APP) with the Arctic mutation. J. Neurochem. 136, 497–502. doi: 10.1111/jnc.13410
Rossignol, D. A., and Frye, R. E. (2012). Mitochondrial dysfunction in autism spectrum disorders: a systematic review and meta-analysis. Mol. Psychiatry 17, 290–314. doi: 10.1038/mp.2010.136
Rota, C., Chignell, C. F., and Mason, R. P. (1999). Evidence for free radical formation during the oxidation of 2′-7′-dichlorofluorescin to the fluorescent dye 2′-7′-dichlorofluorescein by horseradish peroxidase: possible implications for oxidative stress measurements. Free Radic. Biol. Med. 27, 873–881. doi: 10.1016/s0891-5849(99)00137-9
Ruch, A., Kurczynski, T. W., and Velasco, M. E. (1989). Mitochondrial alterations in Rett syndrome. Pediatr. Neurol. 5, 320–323. doi: 10.1016/0887-8994(89)90027-1
Saywell, V., Viola, A., Confort-Gouny, S., Le Fur, Y., Villard, L., and Cozzone, P. J. (2006). Brain magnetic resonance study of Mecp2 deletion effects on anatomy and metabolism. Biochem. Biophys. Res. Commun. 340, 776–783. doi: 10.1016/j.bbrc.2005.12.080
Schägger, H., and Pfeiffer, K. (2000). Supercomplexes in the respiratory chains of yeast and mammalian mitochondria. EMBO J. 19, 1777–1783. doi: 10.1093/emboj/19.8.1777
Shulyakova, N., Andreazza, A. C., Mills, L. R., and Eubanks, J. H. (2017). Mitochondrial dysfunction in the pathogenesis of Rett syndrome: implications for mitochondria-targeted therapies. Front. Cell. Neurosci. 11:58. doi: 10.3389/fncel.2017.00058
Sierra, C., Vilaseca, M. A., Brandi, N., Artuch, R., Mira, A., Nieto, M., et al. (2001). Oxidative stress in Rett syndrome. Brain Dev. 23(Suppl. 1), S236–S239.
Stoppini, L., Buchs, P. A., and Muller, D. (1991). A simple method for organotypic cultures of nervous tissue. J. Neurosci. Methods 37, 173–182. doi: 10.1016/0165-0270(91)90128-m
Toloe, J., Mollajew, R., Kügler, S., and Mironov, S. L. (2014). Metabolic differences in hippocampal ‘Rett’ neurons revealed by ATP imaging. Mol. Cell. Neurosci. 59C, 47–56. doi: 10.1016/j.mcn.2013.12.008
Valenti, D., De Bari, L., De Filippis, B., Henrion-Caude, A., and Vacca, R. A. (2014). Mitochondrial dysfunction as a central actor in intellectual disability-related diseases: an overview of Down syndrome, autism, Fragile X and Rett syndrome. Neurosci. Biobehav. Rev. 46(Pt 2), 202–217. doi: 10.1016/j.neubiorev.2014.01.012
Valenti, D., De Bari, L., Vigli, D., Lacivita, E., Leopoldo, M., Laviola, G., et al. (2017). Stimulation of the brain serotonin receptor 7 rescues mitochondrial dysfunction in female mice from two models of Rett syndrome. Neuropharmacology 121, 79–88. doi: 10.1016/j.neuropharm.2017.04.024
Votyakova, T. V., and Reynolds, I. J. (2001). ΔΨm-dependent and -independent production of reactive oxygen species by rat brain mitochondria. J. Neurochem. 79, 266–277. doi: 10.1046/j.1471-4159.2001.00548.x
Vukotic, M., Oeljeklaus, S., Wiese, S., Vogtle, F. N., Meisinger, C., Meyer, H. E., et al. (2012). Rcf1 mediates cytochrome oxidase assembly and respirasome formation, revealing heterogeneity of the enzyme complex. Cell Metab. 15, 336–347. doi: 10.1016/j.cmet.2012.01.016
Wagener, K. C., Kolbrink, B., Dietrich, K., Kizina, K. M., Terwitte, L. S., Kempkes, B., et al. (2016). Redox-indicator mice stably expressing genetically-encoded neuronal roGFP: versatile tools to decipher subcellular redox dynamics in neuropathophysiology. Antioxid. Redox Signal. 25, 41–58. doi: 10.1089/ars.2015.6587
Wallace, D. C. (1999). Mitochondrial diseases in man and mouse. Science 283, 1482–1488. doi: 10.1126/science.283.5407.1482
Wardman, P. (2007). Fluorescent and luminescent probes for measurement of oxidative and nitrosative species in cells and tissues: progress, pitfalls, and prospects. Free Radic. Biol. Med. 43, 995–1022. doi: 10.1016/j.freeradbiomed.2007.06.026
Waypa, G. B., Marks, J. D., Guzy, R., Mungai, P. T., Schriewer, J., Dokic, D., et al. (2010). Hypoxia triggers subcellular compartmental redox signaling in vascular smooth muscle cells. Circ. Res. 106, 526–535. doi: 10.1161/circresaha.109.206334
Weerapana, E., Wang, C., Simon, G. M., Richter, F., Khare, S., Dillon, M. B., et al. (2010). Quantitative reactivity profiling predicts functional cysteines in proteomes. Nature 468, 790–795. doi: 10.1038/nature09472
Wittig, I., Karas, M., and Schagger, H. (2007). High resolution clear native electrophoresis for in-gel functional assays and fluorescence studies of membrane protein complexes. Mol. Cell. Proteom. 6, 1215–1225. doi: 10.1074/mcp.m700076-mcp200
Wu, M., Gu, J., Guo, R., Huang, Y., and Yang, M. (2016). Structure of mammalian respiratory supercomplex I1III2IV1. Cell 167:e1510.
Zerbetto, E., Vergani, L., and Dabbeni-Sala, F. (1997). Quantification of muscle mitochondrial oxidative phosphorylation enzymes via histochemical staining of blue native polyacrylamide gels. Electrophoresis 18, 2059–2064. doi: 10.1002/elps.1150181131
Zhou, M., Diwu, Z., Panchuk-Voloshina, N., and Haugland, R. P. (1997). A stable nonfluorescent derivative of resorufin for the fluorometric determination of trace hydrogen peroxide: applications in detecting the activity of phagocyte NADPH oxidase and other oxidases. Anal. Biochem. 253, 162–168. doi: 10.1006/abio.1997.2391
Keywords: oxidative stress, reactive oxygen species, disease progression, methyl-CpG binding protein 2 encoding gene (mouse), hippocampus, cortex, heart, reduction-oxidation sensitive green fluorescent protein 1
Citation: Can K, Menzfeld C, Rinne L, Rehling P, Kügler S, Golubiani G, Dudek J and Müller M (2019) Neuronal Redox-Imbalance in Rett Syndrome Affects Mitochondria as Well as Cytosol, and Is Accompanied by Intensified Mitochondrial O2 Consumption and ROS Release. Front. Physiol. 10:479. doi: 10.3389/fphys.2019.00479
Received: 04 June 2018; Accepted: 05 April 2019;
Published: 30 April 2019.
Edited by:
Gareth Davison, Ulster University, United KingdomReviewed by:
Richard Eugene Frye, Phoenix Children’s Hospital, United StatesYeong-Renn Chen, Northeast Ohio Medical University, United States
Marcos Lopez, The University of Chicago, United States
Copyright © 2019 Can, Menzfeld, Rinne, Rehling, Kügler, Golubiani, Dudek and Müller. This is an open-access article distributed under the terms of the Creative Commons Attribution License (CC BY). The use, distribution or reproduction in other forums is permitted, provided the original author(s) and the copyright owner(s) are credited and that the original publication in this journal is cited, in accordance with accepted academic practice. No use, distribution or reproduction is permitted which does not comply with these terms.
*Correspondence: Michael Müller, mmuelle7@gwdg.de
†These authors have contributed equally to this work