 Sebastian Klich1*
 Krzysztof Ficek2,3
 Igor Krymski4Andrzej Klimek5
 Adam Kawczyński1
 Pascal Madeleine6Cesar Fernández-de-las-Peñas7,8
- 1Department of Paralympic Sport, University School of Physical Education in Wrocław, Wrocław, Poland
- 2Department of Physiotherapy, Academy of Physical Education in Katowice, Katowice, Poland
- 3Galen Orthopedic Center, Bieruń, Poland
- 4Polish Cycling Federation, Pruszków, Poland
- 5Biomedical Science Institute, University School of Physical Education in Kraków, Kraków, Poland
- 6Department of Health Science and Technology, Sport Sciences—Performance and Technology, Aalborg University, Aalborg, Denmark
- 7Department of Physical Therapy, Occupational Therapy, Rehabilitation, and Physical Medicine, Universidad Rey Juan Carlos, Alcorcón, Spain
- 8Cátedra Institucional en Docencia, Clínica e Investigación en Fisioterapia: Terapia Manual, Punción Seca y Ejercicio Terapéutico, Universidad Rey Juan Carlos, Alcorcón, Spain
Track cyclists are required to perform short- and long-term efforts during sprint and endurance race events, respectively. The 200 m flying sprint races require maximal power output and anaerobic capacity, while the 4,000 m pursuit cyclists demand a high level of aerobic capacity. Our goal was to investigate spatial changes in morphological and mechanical properties displayed using 3D topographical maps of the quadriceps muscle and tendons after 200 m flying start and 4,000 m individual pursuit race in elite track cyclists. We hypothesized a non-uniform distribution of the changes in the quadriceps muscle stiffness (QMstiff), and acute alterations in quadriceps tendon (QTthick) and patellar tendon (PTthick) thickness. Fifteen men elite sprint and 15 elite men endurance track cyclists participated. Sprint track cyclists participated in a 200 m flying start, while endurance track cyclists in 4,000 m individual pursuit. Outcomes including QTthick (5–10–15 mm proximal to the upper edge of the patella), PTthick (5–10–15–20 mm inferior to the apex of the patella)—using ultrasonography evaluation, QMstiff, and quadriceps tendon stiffness (QTstiff) were measured according to anatomically defined locations (point 1–8) and patellar tendon stiffness (PTstiff)—using myotonometry, measured in a midway point between the patella distal and the tuberosity of tibial. All parameters were assessed before and after (up to 5 min) the 200 m or 4,000 m events. Sprint track cyclists had significantly larger QTthick and PTthick than endurance track cyclists. Post-hoc analysis showed significant spatial differences in QMstiff between rectus femoris, vastus lateralis, and vastus medialis in sprint track cyclists. At before race, sprint track cyclists presented significantly higher mean QTthick and PTthick, and higher QMstiff and the QTstiff, as compared with the endurance track cyclists. The observed changes in PTThick and QTThick were mostly related to adaptation-based vascularity and hypertrophy processes. The current study suggests that assessments using both ultrasonography and myotonometry provides crucial information about tendons and muscles properties and their acute adaptation to exercise. Higher stiffness in sprint compared with endurance track cyclists at baseline seems to highlight alterations in mechanical properties of the tendon and muscle that could lead to overuse injuries.
Introduction
Track cycling can be divided into two main categories: sprint (≤ 1,000 m) and endurance (>1,000 m) events. The most popular individual races, in those categories, are 200 m flying start and 4,000 m pursuit, that last on average 10 s and >4 min, respectively (Craig and Norton, 2001). Sprint and endurance track cyclists have different anthropometric characteristics, muscle's mechanical properties, and fiber type composition. For instance, sprinters exhibit greater thigh girths but shorter thigh lengths (Van Der Zwaard et al., 2019) and their quadriceps muscle contains predominantly fast-twitch fibers (Loturco et al., 2015). Cyclists are more exposed to tendon injuries (i.e., patellar quadriceps tendinopathies) than muscle sprains (Wanich et al., 2007). Further, sprint track cyclists have also a higher risk of tendinopathy than endurance cyclists (Craig and Norton, 2001; Klich et al., 2020). Penailillo et al. (2015) showed that 25% of cyclists suffer from patellar tendon (PT) pain. Quadriceps tendon (QT) pain also appears frequently in cyclists, particularly in sprinters, as a result of overuse syndrome on the lateral side of the knee (Wanich et al., 2007).
Quadriceps and patellar tendinopathy should be diagnosed by noninvasive, real-time methods based on measures of thickness and mechanical properties of PT and QT tendons (Loturco et al., 2015; Klich et al., 2018, 2020). Mechanical loadings within thigh muscles can affect QT and PT thickness as well as stiffness (Loturco et al., 2015; Klich et al., 2018). Thus, the assessment of thigh muscles and tendons using ultrasonography and myotonometry could be used to assess the effects of muscle loading during cycling competitions. Diagnostic ultrasound imaging and myotonometry have been proposed as reliable research and clinical instruments to evaluate morphological and mechanical properties of skeletal muscles (Bizzini and Mannion, 2003; Klich et al., 2019). Diagnostic ultrasound imaging has been previously used to assess the reliability and magnitude of QT and PT characteristics in volleyball players (Kulig et al., 2013; Visnes et al., 2015). Kulig et al. (2013) demonstrated an increase in proximal PT thickness (PTThick) in symptomatic volleyball players when compared with those without symptoms. Visnes et al. (2015) have reported a relationship between QT and PT thickness and symptoms of jumper's knee (a common syndrome related to morphological alterations in tendon thickness and increased vascularity).
Myotonometry has been also used to assess the stiffness of quadriceps muscle (QMstiff) and PT (PTstiff) in individual and team sport athletes (Young et al., 2018; Chen et al., 2019; Klich et al., 2020) and also after acute injury (Liang et al., 2017). Young et al. (2018) have shown higher PTstiff in break-dancers compared with a control group, as a sign of adaptation after training. Klich et al. (2020) found an increase in QMstiff after 200 m flying start and sprints in a case study. Among soccer players compared with healthy sedentary participants, both increased rectus femoris and lower PT and QT stiffness have been recently reported (Taş et al., 2019). Chino et al. (2018) showed lower stiffness of rectus femoris muscle in athletes, compared with non-athletes. The application of those ultrasonic and myotonometric measurements may help detect acute changes following flying sprint or sprint race.
Field investigations are needed in professional sport to assess changes in muscle and tendon load in real-time during training and competitions (Elliott and Alderson, 2007). Moreover, ultrasound imaging and myotonometry are needed to indicate the development of soft tissue thickness and stiffness. To the best of our knowledge, no study has assessed tendon thickness and stiffness of QT and PT before and after cycling events in the elite sprint and endurance track cyclists. These outcomes may provide a better understanding of QT and PT changes that could help to understand better tendinopathy mechanisms. Thus, the current study was designed to quantify changes in QTthick and PTthick as well as changes in QMstiff, QTstiff, and PTstiff at several locations of the dominant lower limb before and after sprint and endurance race competition on 200 m flying start and 4,000 m individual pursuit, respectively. Furthermore, to ensure that such assessments are reliable, we also reported the test-retest reliability of tendons thickness and stiffness among elite track cyclists. Therefore, we aimed to investigate changes in morphological and mechanical properties in a real-time competition of elite track cyclists. The secondary aim was to assess cross-sectional comparisons between sprint and endurance cyclists at baseline. We have hypothesized a non-uniform distribution of the changes in the QMstiff, and acute alterations in QTthick and PTthick, in both sprint and endurance track cyclists.
Materials and Methods
Participants
We tested a group of 15 sprint track cyclists (all men, mean ± SD age 26 ± 4 years, body height 183 ± 5.4 cm; body mass 88 ± 4.5 kg; BMI: 25.3 ± 0.7 kg/m2; thigh length 54.4 ± 2.8 cm) and 15 endurance track cyclists (all men, mean age 23 ± 1.8 years, body height 191 ± 3.6 cm; body mass 76 ± 3.5 kg; BMI: 21.1 ± 0.7 kg/m2; thigh length 61.1 ± 1.7 cm). The thigh length was defined as distance from the anterior superior iliac spine to medial joint line (Goyal et al., 2020). All subjects were tested to identify the dominant leg during pedaling (Watanabe et al., 2016). All (n = 30) subjects responded that they used their right leg during the down-stroke phase of the pedaling cycle. All measurements were conducted on the dominant side (right side). The track cyclists were competitors of the Polish national team specialized in either sprint or endurance events with a mean training experience of 11.5 ± 1.4 years. Twenty-two participants (73%) were professional track cyclists, including four winners of world cups. Participants were competing at the international-level track races (World Cup, European Championship, and World Championship). The exclusion criteria for both groups included: (1) current or previous thigh and knee injury or symptoms; and (2) prior history of surgery in the lower extremity.
Study Design
This study cross-sectional used a repeated-measures design performed during sports competition. The assessments were made in situ, on a velodrome. Sprint track cyclists participated in 200 m flying start, while endurance track cyclists in 4,000 m individual pursuit. The test-retest relative and absolute reliability was also investigated for thickness and stiffness measurements collected twice before the races. The thickness (PTthick and QTthick) and stiffness of the (QM, QT, and PT) were measured at several locations before and after (up to 5 min) 200 and 4,000 m races, respectively. The total time of preparing all measurements took ~1–1.5 min per each participant (including myotonometry, e.g., 30 s and US, e.g., 30 s −1 min). The study was conducted following STROBE guidelines (Von Elm et al., 2008).
Ultrasound Assessment
Ultrasonography was performed using an ultrasound scanner (HS-2200, Honda, Toyohashi, Japan) with a 7.5 (6.0–11.0) MHz and 40 mm linear array transducer (HLS-584 M, Honda, Toyohashi, Japan) in gray scale B-mode. The settings of the ultrasound system were standardized for all participants and kept identical for all measures. The scan depth was set to 1.8 mm, in agreement with Skou and Aalkjaer (2013). The axial resolution of ultrasound images was found to be 0.068 mm per pixel. Measurements of PTthick and QTthick were performed according to recommendations of the European Society of Musculoskeletal Radiology (Beggs et al., 2016).
Participants were lying in a supine position with their right knee (dominant side) flexed at ~30° (Giombini et al., 2013). A pillow was placed under the popliteal space during the assessments. This knee position avoids possible anisotropy related to the concave profile as a result of posterior thigh muscles and PT extension (Skou and Aalkjaer, 2013). For QT, the transducer was placed in the long axis of this tendon, proximal to the upper edge of the patella. Thickness was assessed on three points along the QT located at 5–10–15 mm lateral to the reference point (hyperechoic region of the patella). The QT borders were defined inferiorly as the first hyperechoic region between superficial and deep layers. The three measures (5–10–15 mm) were averaged for a single measure of tendon thickness. For PT, the linear transducer was placed longitudinally distal to the patella. The thickness of the PT was assessed on four locations, set at 5–10–15–20 mm inferior to the apex of the patella. Tendon borders were defined inferiorly as the first hyperechoic region between the subcutaneous tissue and the deep fascia layer. The four measures (5–10–15–20 mm) were averaged for a single measure of tendon thickness (Figure 1).
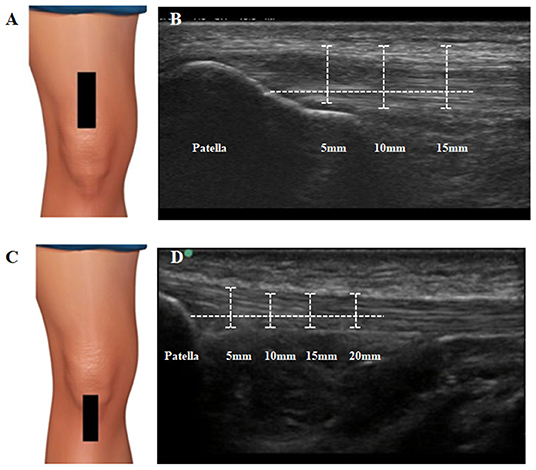
Figure 1. Ultrasound assessment and measurement of quadriceps and patellar tendon. (A) Transducer placement for quadriceps tendon. The transducer was placed in the long axis of this tendon, proximal to the upper edge of the patella. (B) Measurement procedures for quadriceps tendon thickness. Thickness was assessed on three points along the QT located at 5–10–15 mm lateral to the reference point (hyperechoic region of the patella). The QT borders were defined inferiorly as the first hyperechoic region between superficial and deep layers. (C) Transducer placement for patellar tendon. The linear transducer was placed longitudinally distal to the patella. (D) Measurement procedures for patellar tendon thickness. Thickness was assessed on four locations, set at 5–10–15–20 mm inferior to the apex of the patella. Tendon borders were defined inferiorly as the first hyperechoic region between the subcutaneous tissue and the deep fascia layer.
The data collection for reliability assessment took place 2 days before the main procedure. Sprint and endurance track cyclists were asked to avoid physical effort and had none training session before the reliability data collection. A single examiner (SK) took two US images for each tendon (QT and PT). To avoid a learning effect, all subjects were coded by assigning an individual ID number. The data measurements for QT and PT thickness were performed 1 week later. The order in which the images were assessed was randomized, however, the examiner was blinded to each measurements and the group (sprint and endurance) to which the subject was assigned. The measured QT and PT thickness were averaged and used for further statistical analysis.
During the experimental protocol two images were taken for each tendon, and were averaged for data analysis. The topographical maps of the PT and QT were generated using Matlab (version R2017b, The Mathworks, Natick MA, United States of America) by means of an inverse distance weighted interpolation of the averaged values of each location (5–10–15 mm and 5–10–15–20 mm) to obtain a 3D graphical representation (Binderup et al., 2010; Fernández-Carnero et al., 2010) of the changes in tendon thickness. Of note, the 3D graphical representation are only used for visualization purposes.
Myotonometric Assessment
A hand-held myotonometer device (MyotonPro, Myoton Ltd., Estonia) was used to measure QMstiff (including QTstiff) and PTstiff at several locations. Muscle stiffness is defined as the property that characterizes resistance to the contraction of the external stretching force that deforms the initial shape of the tissue. Stiffness (N/m) was computed as S = amax.mprobe/Δl, where a is the acceleration of the damped oscillation; mprobe is the mass of the measurement mechanism and Δl is the probe displacement (Klich et al., 2019). The examiner located the probe perpendicular to the tested area. Then, the probe generated three impulses exerted on the testing area.
Participants were lying in a supine position with feet on the massage table. The QMstiff measurements were made on the dominant lower extremity over eight reference points, including rectus femoris (RF) (no. 1–2); tensor fasciae latae (TFL) (no. 3); vastus lateralis (VL) (no. 4-6), vastus medialis (VM) (no. 7) and quadriceps tendon (QT) (no. 8) in line with previous studies (Domínguez-Martín et al., 2013; Kawczynski et al., 2014). The reference points for RF were musculotendinous points located distal from the initial attachment (no. 1) and terminal attachment (no. 2); TFL was placed in line between anterior superior iliac spine and greater trochanter; VL includes three points on the muscle belly in three equal parts; VM was marked in the middle of the muscle belly. The QTstiff (no. 8) was assessed in the 1/3 proximal between the upper edge of patella and point 2 (RF) (Figure 2), while PTstiff was measured at a midway point between the patella distal and the tuberosity of tibial when the knee was flexed at 90° (Chen et al., 2019).
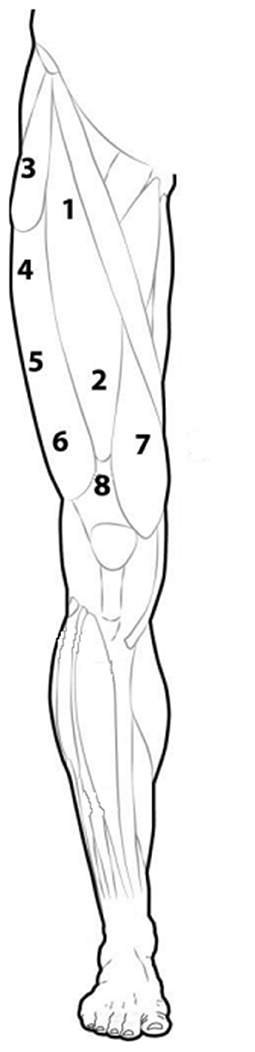
Figure 2. Schematic representation of the eight points for the quadriceps muscle and tendon stiffness measure.
The data collection for reliability assessment took place 2 days before the main procedure. Sprint and endurance track cyclists were asked to avoid physical effort and had none training session before the reliability data collection. A single examiner (IK) took the measurement of muscle stiffness. The stiffness values of a each point of the quadriceps muscle were measured twice. The data was used to assess absolute and relative reliability for each group of cyclists.
Stiffness measurements were also used to obtain 3D graphical representation of the spatial distribution of the stiffness (Domínguez-Martín et al., 2013; Kawczynski et al., 2014). Similar to the thickness maps, the 3D graphical representation of stiffness were only used for visualization purposes.
Statistical Analysis
The G*Power software (version 3.1.9.2; Kiel University, Kiel, Germany) (Faul et al., 2007) was used to estimate the required sample size setting a minimum expected effect size (Cohen's f ) of 0.6, an α level of 0.05, and a power (1–β) of 0.8. The procedure returned a minimum number of 12 participants per group.
The SPSS 18 statistical software (SPSS Inc., Chicago, Illinois, USA) was used for data analysis. Mean values ± standard deviation (SD) are reported. Group differences (track and endurance track cyclists) in anthropometric characteristics were assessed using the independent t-test. The relative reliability was calculated using intra-class correlation coefficients (ICCs) using a two-way random effect, absolute agreement (ICC2, 1) for both groups. Reliability was classified as poor (ICC < 0.50), moderate (0.50 < ICC < 0.69), good (0.70 < ICC < 0.89) or excellent (ICC ≥ 0.90) (Landis and Koch, 1977). The absolute reliability was evaluated by computing the standard error of measurement (SEM) and the minimal detectable change (MDC) (Weir, 2005).
Two-way analysis of variance with repeated measures (RM-ANOVA) with time (pre-post) and location (5–10–15 mm for QTthick, 5–10–15–20 mm for PTthick, 1–2–3–4–5–6–7–8 for QMstiff and PTstiff) as within-group factors were conducted for each group. Post-hoc tests with Bonferroni corrections were applied when needed. Moreover, a one-way ANOVA was used to assess between-group differences in tendons thickness and stiffness at baseline, as well as, in relative changes in tendons thickness and stiffness [i.e., difference (Δ) between post- and pre-values]. Post-hoc tests with Bonferroni corrections were also applied. A p ≤ 0.05 was considered as statistically significant. Effect size was estimated using partial eta square (η2), classified as small (0.20 < η2 < 0.49), medium (0.50 < η2 < 0.79), or large (η2 >≥ 0.80) (Richardson, 2011).
Results
Anthropometric Characteristics
Subjects were not statistically different with respect to age (p = 0.07). Sprint track cyclists had significantly higher body mass [t(15) = 3.8; p = 0.002] and BMI [t(15) = 28.2; p = 0.003]. On the contrary, endurance track cyclists had significantly higher body height [t(15) = −3.7; p = 0.001] and thigh length [t(15) = −20.7; p = 0.001].
Reliability
The relative reliability was excellent for QTthick (ICC2, 1 0.91, 95%CI: 0.50–0.94) and good for PTthick (ICC2, 1 0.87, 95%CI: 0.35–0.95) in sprint track cyclists. Likewise, the relative reliability was excellent for QTthick (ICC2, 1 0.90, 95%CI: 0.55–0.92) and good for PTthick (ICC2, 1 0.84, 95%CI: 0.40–0.91) in endurance track cyclists. The absolute reliability showed that SEMs and MDCs were lower among the sprinters than among endurance track cyclists. For QTthick and PTthick, the SEMs were 0.04 and 0.02 mm in sprint track cyclists, while 0.08 and 0.06 mm in endurance track cyclists. The MDCs were 1.1 and 0.7 mm in sprinters, while 1.5 and 1.0 mm in endurance track cyclists. Moreover, the relative reliability was excellent for stiffness in sprint (ICC2, 1 0.92, 95%CI: 0.50–0.97) and endurance track cyclists (ICC2, 1 0.94, 95%CI: 0.55–0.95). The SEMs and MDCs were 18.20 and 48.16 N/m in sprinters and 17.8 and 45.4 N/m in endurance track cyclists.
Ultrasound
Table 1 provides the mean (SD) and statistical analysis of QTthick and PTthick in sprint and endurance track cyclists. The two-way RM-ANOVAs revealed a statistically significant Time × Location interaction effect on averaged QTthick [F(2,36) = 31.9, p = 0.009, η2 = 0.69] and PTthick [F(2,38) = 99.2, p = 0.001, η2 = 0.70] in sprint track cyclists, as well as, QTthick [F(2,36) = 6.7, p = 0.02, η2 = 0.44] and PTthick [F(2,38) = 101.2, p = 0.02, η2 = 0.55] in endurance track cyclists. The analysis of within-group differences showed an increase in QTthick [F(1,28) = 4.7, p = 0.001, η2 = 0.71] and PTthick [F(1,32) = 7.3, p ≤ 0.001, η2 = 0.86] in sprint track cyclists after 200 m flying start. Similarly, an increase in QTthick [F(1,32) = 3.5, p = 0.01, η2 = 0.62] and PTthick [F(1,32) = 7.5, p ≤ 0.001, η2 = 0.86) was reported in endurance track cyclists after 4,000 m individual pursuit race. Moreover, the analysis revealed significant within-group differences compared to location placed at 5 mm (for 10 and 15 mm) in QTthick in sprint (both p = 0.001) and endurance track cyclists (p = 0.001 and 0.01, respectively; Table 1, Figures 3, 4).
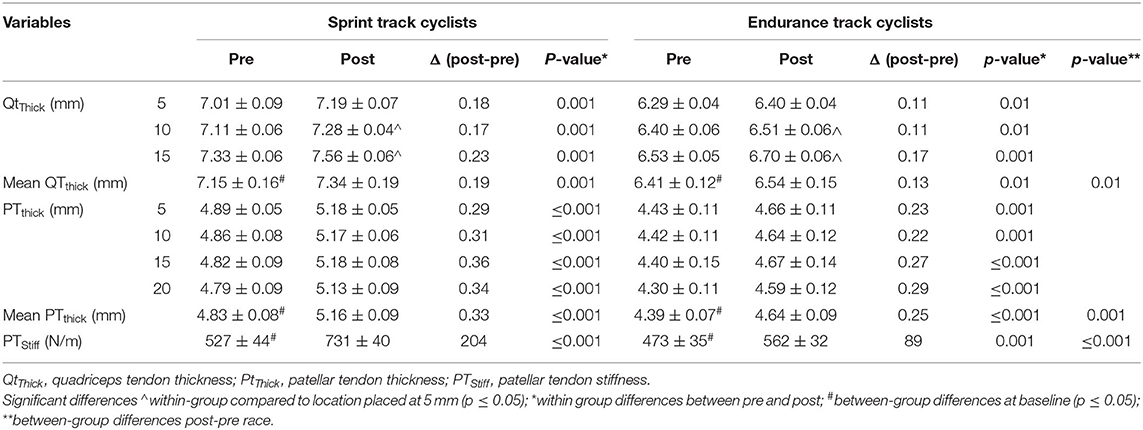
Table 1. Pre- and post-start QTThick and PTThick (mm) and PTStiff (N/m) in both groups using three-way analysis of variance.
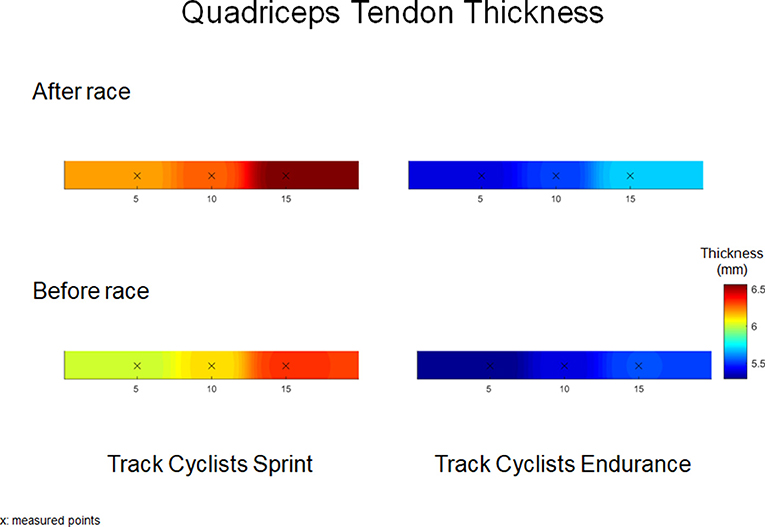
Figure 3. Quadriceps tendon thickness (mm) maps before and after 200 m flying start (Track Cyclists Sprint) and 4,000 m individual pursuit race (Track Cyclists Endurance).
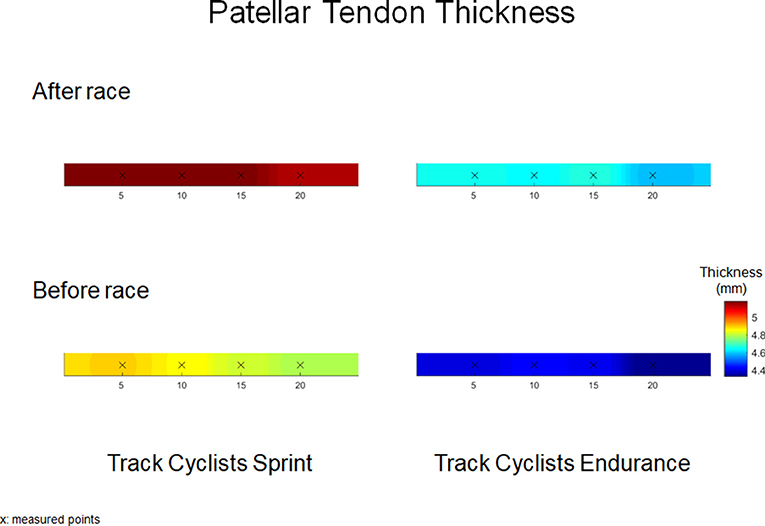
Figure 4. Patellar tendon thickness (mm) maps before and after 200 m flying start (Track Cyclists Sprint) and 4,000 m individual pursuit race (Track Cyclists Endurance).
At baseline, the one-way ANOVA showed significant higher averaged QTthick [F(1,15) = 98.1, p = 0.001, η2 = 0.82] and PTthick [F(1,14) = 73.5, p ≤ 0.001, η2 = 0.78] in sprinters compared with endurance track cyclists. Moreover, the post-pre race difference showed larger increase in QTthick [F(1,15) = 78.3, p = 0.01, η2 = 0.61] and PTthick [F(1,15) = 118.9, p ≤ 0.001, η2 = 0.75] in sprint compared with endurance track cyclists (Table 1).
Myotonometry
The two-way RM-ANOVAs revealed a statistically significant Time × Location interaction effect on averaged QTstiff [F(5,59) = 133.5, p = 0.001, η2 = 0.72], PTstiff [F(5,59) = 81.5, p = 0.002, η2 = 0.72] and QMstiff [F(6,36) = 62.9, p = 0.005, η2 = 0.70] in sprint track cyclists, as well as, QTstiff [F(1,56) = 37.0, p = 0.01, η2 = 0.40], PTstiff [F(13, 60) = 86.7, p = 0.001, η2 = 0.62] and QMstiff [F(6,223) = 10.4, p = 0.01, η2 = 0.58] in endurance track cyclists. The analysis of within-group differences showed an increase in QTstiff [F(1,30) = 15.9, p ≤ 0.001, η2 = 0.82], PTstiff [F(1,32) = 22.3, p ≤ 0.001, η2 = 0.86], mean RF stiffness [F(1,30) = 7.8, p = 0.04, η2 = 0.62], mean VL stiffness [F(1,31) = 7.8, p ≤ 0.001, η2 = 0.83], QMstiff [F(1,32) = 7.5, p = 0.001, η2 = 0.80] in sprint track cyclists after 200 m flying start. Similarly, an increase in QTstiff [F(1,32) = 8.9, p = 0.001, η2 = 0.78], PTstiff [F(1,32) = 10.1, p = 0.001, η2 = 0.79] and mean RF stiffness [F(1,31) = 8.4, p = 0.04, η2 = 0.64] was observed in endurance track cyclists after 4,000 m individual pursuit race (Tables 1, 2).
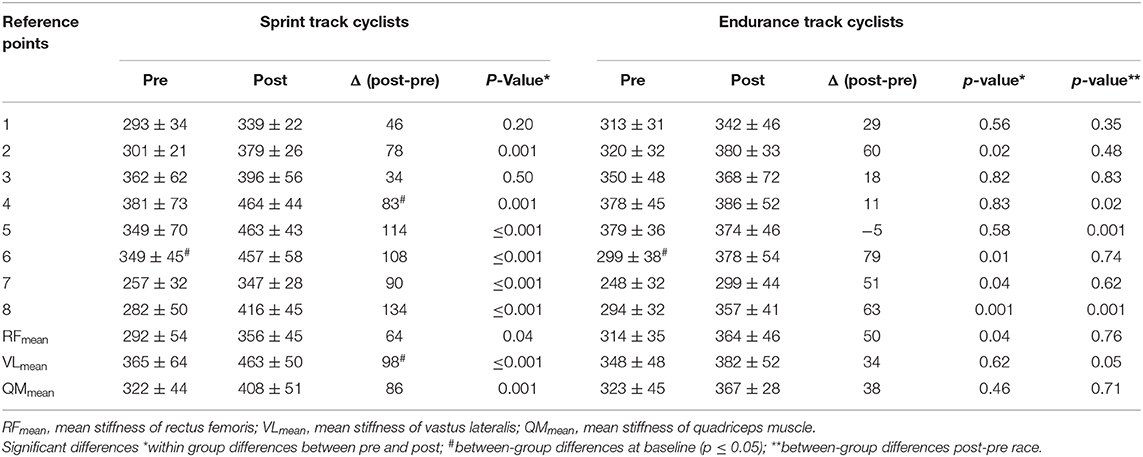
Table 2. Pre- and post-start QMStiff (N/m) at the seven measurement points using three-way analysis of variance.
At baseline, the one-way ANOVA showed significantly higher PTstiff [F(1,14) = 6.9, p = 0.02, η2 = 0.55] in sprinters compared with endurance track cyclists. Moreover, the post-pre race difference showed higher QTstiff [F(1,15) = 79.2, p = 0.001, η2 = 0.72] and PTstiff [F(1,14) = 204.0, p ≤ 0.001, η2 = 0.85], as well as, mean VL stiffness [F(1,89) = 113.2, p = 0.05, η2 = 0.64] in sprinters compared with endurance track cyclists (Tables 1, 2; Figure 5).
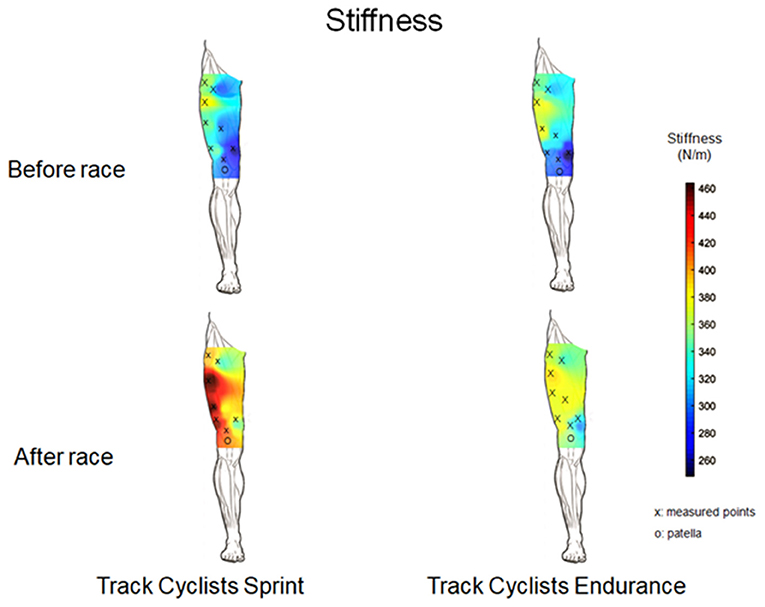
Figure 5. Muscle stiffness (N/m) maps from the quadriceps muscle and tendon before and after 200 m flying start (Track Cyclists Sprint) and 4,000 m individual pursuit race (Track Cyclists Endurance).
Discussion
The current study showed an increase in QT and PT thickness and stiffness in both sprint and endurance cyclists after 200 and 4,000 m race. Sprint track cyclists were characterized by higher values of tendons thickness before the race than endurance track cyclists. The reported increase in both QTthick, PTthick, and QMstiff in sprint track cyclists after 200 m flying start may indicate quadriceps muscle edema and hypervascularity. The results of our study are in line with the hypothesis, which predicts spatial changes of QMstiff and acute alterations in tendons thickness after sprint and endurance races. The changes in QTthick and PTthick were assessed using diagnostic ultrasound imaging as well as the changes in QMstiff and tendons stiffness was assessed using myotonometry at several locations depicting non uniform changes in both thickness and stiffness. Both ultrasound and myotonometry showed good to excellent relative reliability. These findings are interpreted in relation to the anthropometrics characteristics of sprint track cyclists (Van Der Zwaard et al., 2019) and competition characteristics (Craig and Norton, 2001) as well as with respect to the risk of getting injury.
Physiological Perspective to Acute and Chronic Mechanisms Following Fatigue
In vivo studies have evaluated tendon's degenerative model described as acute laceration models induced damage include stress, fiber disorganization, inter-fiber tears, edema, and disrupted microfiber remodeling (Proske and Morgan, 2001; Nakama et al., 2005; Fung et al., 2010; Mccreesh et al., 2017). Furthermore, those changes in the structure of a tendon result in morphological and mechanical properties, including kinked fiber patterns causing torsion of fibers across and increased stiffness (Fung et al., 2010). We observed an increase of QTthick and PTthick in sprint and endurance track cyclists after races. Moreover, the difference between post-pre stiffness was larger in sprint compared with endurance track cyclists. Ditroilo et al. (2011) reported that stiffness increases linearly with increased tension, which is in relation with our previous study (Klich et al., 2020). We have shown an increase in QM tension and a decrease in elasticity, mostly as a result of glycogen depletion and increased production of lactate acid and hydrogen ions. Freedman et al. (2014) and Fung et al. (2010) have demonstrated the effect of tendon damage on its stiffness. The degenerative model assumes a decrease of stiffness in the second phase of post-exercise causing an increase in plastic deformation and fibers redistribute loads from damaged. Proske and Morgan (2001) have reported that increased stiffness is accompanied by micro swelling within the muscle fibers, however, we have not found any evidence. The higher post-pre differences in tendon thickness in sprint track cyclists might be related to alterations in tendon fluid since short-term efforts relapse glycosaminoglycan responsible for binding water (Mccreesh et al., 2017) causing direct influence on tendon stiffness and a result of higher tendon vascularity (Tsui et al., 2017).
The chronic model of overuse should be considered as a degenerative model including changes in connective tissues, e.g., collagen synthesis or fibroblast migration (Fredberg and Stengaard-Pedersen, 2008). Higher differences in sprinter's stiffness might be related to training specificity, e.g., short-term maximal efforts. Our previous study reported an increase in thigh muscle (especially VL) pain sensitivity after maximal anaerobic power training (Klich et al., 2018) and 200 m flying start (Klich et al., 2020). The training loads in endurance cyclists are mainly focused on aerobic capacity, and overloads does not seem to influence stiffness and thickness (Karamanidis and Arampatzis, 2006).
Effect of 200 m Flying Start and 4,000 m Pursuit Race on QTThick and PTThick
This study investigated the QTthick and the PTthick at three and four locations, respectively. Moreover, it is also the first study evaluating spatial changes in thickness and stiffness immediately after an elite event in track cyclists. Previous studies have also assessed the QTthick and PTthick at different locations from their attachments (Ozçakar et al., 2003; Pfirrmann et al., 2008; Giombini et al., 2013; Todd et al., 2015; Kizilkaya and Ecesoy, 2019). Several studies have examined both tendons thickness in elite sports (Pfirrmann et al., 2008; Giombini et al., 2013) measured at insertion, mid-length, and distal attachments. For instance, Giombini et al. (2013) reported tendon thickness 10 mm proximal (for QT) and 5 mm distal from the patella apex (for PT). Fisker et al. (2017) have evaluated PTthick after CrossFit workout using similar ultrasound examination procedures to the one describe in Giombini et al. (2013). Ozçakar et al. (2003) evaluated the QTthick in soccer players near to the insertion to the patella. Other studies reported the patient's QTthick at 10 mm (Kizilkaya and Ecesoy) and 30 mm (Todd et al., 2015) proximal to the patella apex and the PT at 10 mm distal to the insertion. In our study, we investigated the QTthick in locations placed 5–10–15 mm proximal and 5–10–15–20 mm distal to the apex of the patella. We observed significant differences in QTthick and PTthick between both groups at baseline, related with greater body mass of sprint track cyclists and influence of habitual loading during effort (Zhang et al., 2015; Mersmann et al., 2017). Our findings showed significant differences in spatial distribution of QTthick in within-group compared to location placed at 5 mm in sprint and endurance track cyclists The results demonstrated significant highest QTthick at locations placed 15 mm (difference in thickness ranged between 2 and 4%) in both groups, however in PTthick were not found any statistical differences. Previous studies have assessed only a single measure 10 mm proximately from the apex of the patella (Ozçakar et al., 2003; Todd et al., 2015; Kizilkaya and Ecesoy, 2019); however, Fredberg et al. (2008) have reported that PTthick was significantly larger in proximal areas as compared to distal locations.
After the sprint or endurance track, significant increases in both PTthick and QTthick were found. The percentage increase in QTthick was 3% (sprint) and 2% (endurance), while PTthick increased by 6 and 5%, respectively. The highest post-race increase in QTthick was found at location placed 15 mm (Δ post-pre: 0.23 mm in the sprint and 0.17 mm in endurance track cyclists), while PTthick at 15 mm (Δ post-pre: 0.36 mm) in sprinters and 20 mm (Δ post-pre: 0.29 mm) in endurance cyclists. Castro et al. (2019) have reported that the middle region of PTThick (~20 mm) was the easiest to define and had the highest intra-rater reliability. Such increases in the tendon thickness are most likely caused by including hypoechogenicity and vascularity (Visnes et al., 2015; Tsui et al., 2017). Visnes et al. (2015) reported that the hypoechoic areas are correlated with a risk for developing tendon tendinopathy. Previous studies have shown a training-induced adaptation of muscles and tendons by longtime training on morphological and mechanical in different athletes (Cook et al., 2004; Couppe et al., 2008; Giombini et al., 2013; Charcharis et al., 2019). However, our study presents an acute result of specific effort on tendon morphological and viscoelastic properties changes. Visnes et al. (2015) showed an increase of about 7–11% in the QTthick, without any changes in the PTthick. Furthermore, the authors observed a 50% thicker QT compared with PT among cyclists. Zhang et al. (2014) reported that morphological alterations in overloaded tendons (~23% difference in the PTthick). In our study, both tendons increased their thickness; however, a higher percentage increase was observed within the PT (~6–7%). In general, cycling training is based on short-term high-intensity exercises, strength training (sprint cyclists) (Klich et al., 2018), and aerobic training (endurance cyclists) (Craig and Norton, 2001; Faria et al., 2005). Thus, changes in morphological properties are mostly considered due to tendon adaptation (Visnes et al., 2015). Visnes et al. (2015) reported an increase of about 7–11% in the QTthick, without any changes in the PTthick. Magnusson and Kjaer (2003) observed that tendon hypertrophy in endurance athletes leads to a lower risk of stress across the tendon. The tendinopathy alterations may indicate intrinsic changes in the tendon due to vascularity, causing micro-inflammation (Craig and Norton, 2001; Seynnes et al., 2009). This finding has been reproduced by Fisker et al. (2017) who have also observed an impact of high-intensity loads on tendon thickening.
Effect of 200 m Flying Start and 4,000 m Pursuit Race on QTStiff, PTStiff, and QMStiff
Several studies assessed changes in viscoelastic properties due to training and fatigue (Seynnes et al., 2009; Mannarino et al., 2019; Chalchat et al., 2020), tendinopathy (Zhang et al., 2014), or muscular overload in elite athletes (Andonian et al., 2016; Young et al., 2018; Cristi-Sánchez et al., 2019). In our study, we observed significant differences in stiffness within groups and between-groups when comparing relative changes (difference post-pre race) in sprint and endurance track cyclists, in line with Epro et al. (2019). Previous studies have found an increase in the QTstiff and the PTstiff following isokinetic fatigue protocol (Chalchat et al., 2020), resistance training (Seynnes et al., 2009; Visnes et al., 2015; Mersmann et al., 2017; Mannarino et al., 2019) and prolonged exercise (Andonian et al., 2016). However, cross-sectional studies reported higher stiffness in different athletes compared with a healthily control group (Zhang et al., 2015; Young et al., 2018; Cristi-Sánchez et al., 2019). Taş et al. (2019) assessed stiffness of PT, QT, RF, and VM in soccer players compared with a control group. Soccer players had lower PTstiff and QTstiff as well as higher stiffness of RF compared with sedentary controls. Those authors have reported also higher PTstiff then QTstiff and similar stiffness of RF and VM in soccer players. Cristi-Sánchez et al. (2019) found higher PTstiff in soccer players than inactive participants suggesting that the PTstiff is related to the level of higher force transmission during muscle contraction, however Charcharis et al. (2019) reported higher thickness of VL and PTstiff in athletes (different sports), as a result of training-induced adaptation. Mersmann et al. (2017) and Zhang et al. (2015) have observed higher PTstiff in volleyball players, as compared with healthily volunteers, providing an evidence that PT is adapting to mechanical loading. Furthermore, their research showed following findings to the higher stiffness in athletes: (1) develops the performance of the muscle-tendon unit interaction [also supported by Arampatzis et al. (2020)] and (2) protects the muscle and tendons against overstrain. Visnes et al. (2015) and Mersmann et al. (2017) found that short-term training also result in higher PTstiff. Furthermore, those changes in the viscoelastic properties should be considered in relation to muscle strength (Epro et al., 2019) and increases in tendon's thickness (Klich et al., 2019). Seynnes et al. (2009) have suggested that training-induced changes may be related to tendon hypertrophy and alterations in collagen synthesis. While, Epro et al. (2019) has proposed that changes in tendon thickness may be the results of protective mechanisms.
The current study also assessed the spatial changes in the viscoelastic properties of QMstiff after 200 m flying start or 4,000 m individual pursuit race. In our study, we observed an heterogeneous spatial distribution at baseline for QMstiff in both groups, i.e., higher stiffness in TFL (point no. 3) and VL (point no. 4–6). After races, the spatial distribution remained similar with a shift toward higher stiffness. A higher increase in the QMstiff in sprint track cyclists may indicate an adaptation to the specific-training loads (Cristi-Sánchez et al., 2019), especially due to mechanical energy transmission during cycling phases (Young et al., 2018). Moreover, Kordi et al. (2020) reported a positive relationships between quadriceps muscle volume and peak power output in sprint track cyclists. The alterations in QMstiff after 200 m flying start, observed in our study could be considered by higher power-cadence and torque-cadence in sprinters, than in endurance track cyclists (Kordi et al., 2020). Furthermore, the differences in spatial distribution in QMstiff between sprint and endurance track cyclists might be related with higher activity of QM during pedaling, especially activity of VL during the propulsion phase (Dorel et al., 2005), thus shows the highest activity during sprint exercises (Akima et al., 2005). Kordi et al. (2020) have not found any relationship between activity of VL and peak power output, and significant differences between muscle volume of VL in sprint and endurance track cyclists. In our study, differences in stiffness of VL between both groups could be explained by muscle fiber type composition of VL in sprint and endurance track cyclists. Higher QMstiff may be related with greater proportion of type II muscle fibers in VL (Akima et al., 2005; Kordi et al., 2020). Additionally, higher stiffness in sprinters is also a result of muscle metabolic response, due to increases in lactate acid concentration and H+ ions (Visnes et al., 2015). It should be noted that sprint and endurance track cyclists have set their position on the bicycle differently. Therefore, this factor may influence those differences in the QMstiff. In a previous case report, we found increased stiffness in the QM during 200 m flying start and then sprint events, as a result of increased fatigue and higher maximal power output (Klich et al., 2020).
Perspectives
Ultrasonography and myotonometry are frequently used to evaluate tendon and muscle tissues, in muscle strains, tendinopathies, tears, and overloading injuries. Field testing of potential tissue-overloading is very important when evaluating injury risk-factors and rehabilitation management. Furthermore, investigation of the quadriceps muscle among athletes may provide important critical clinical findings regarding morphological properties and, consequently injury mechanisms. Finally, measuring thickness at different locations and stiffness over QM enable to delineate spatial changes in the generate 3D graphical representations that can be used to monitor potential risk of injuries and optimize rehabilitation process.
Limitations
Finally, we should recognize some potential limitations of the current study. First, we have investigated only the quadriceps femoris muscle. Future studies should also include hamstring and adductor muscles. Second, we could have investigated the cross-sectional area of the QT and the PT. However, this research protocol was prepared according to Ekizos et al. (2013) that consider measurements of cross-sectional area in PT not reliable. Third, we reported an acute effect in tendons; however, repeated measures after 12 and/or 24 h should be conducted in future studies to assess the recovery process following competitions. Future studies investigating QTThick, PTThick, and QM stiffness in sports why high knee-injury risks like handball are also warranted.
Conclusions
This study reported for the first time changes in morphological and mechanical properties, represented by tendon thickness and stiffness. Moreover, our study showed spatial heterogeneity of tendons thickness and stiffness presented by 3D topographical maps after track cycling competition. Sprint track cyclists exhibited significantly higher post-pre differences in thickness and stiffness of QT and PT, as compared with endurance track cyclists. Moreover, the spatial differences in muscle stiffness and tendon thickness reported for both groups might be associated also with loading adaptation, and thus adaptation-based vascularity and hypertrophy processes. Higher stiffness in sprint compared with endurance track cyclists at baseline seems to highlight alterations in mechanical properties of the tendon and muscle that could lead to overuse injuries. The current study suggests that assessments using both ultrasonography and myotonometry provides crucial information about tendons and muscles properties and their acute adaptation to exercise.
Data Availability Statement
The datasets generated for this study are available on request to the corresponding author.
Ethics Statement
The studies involving human participants were reviewed and approved by Ethical Committee of the University Research Ethics Committee at the University School of Physical Education in Wrocław. The patients/participants provided their written informed consent to participate in this study.
Author Contributions
SK, IK, and AKa planned this study. SK and IK collected data. SK, KF, PM, and AKl prepared the manuscript. PM and CF interpreted data and supervised the study. KF, PM, and AKa supervised method analysis. All authors read and approved the final version of the manuscript.
Conflict of Interest
The authors declare that the research was conducted in the absence of any commercial or financial relationships that could be construed as a potential conflict of interest.
Acknowledgments
We thank the volunteers for their participation in the study.
References
Akima, H., Kinugasa, R., and Kuno, S. (2005). Recruitment of the thigh muscles during sprint cycling by muscle functional magnetic resonance imaging. Int. J. Sports Med. 26, 245–252. doi: 10.1055/s-2004-821000
Andonian, P., Viallon, M., Le Goff, C., De Bourguignon, C., Tourel, C., Morel, J., et al. (2016). Shear-wave elastography assessments of quadriceps stiffness changes prior to, during and after prolonged exercise: a longitudinal study during an extreme mountain ultra-marathon. PLoS One 11, e0161855. doi: 10.1371/journal.pone.0161855
Arampatzis, A., Mersmann, F., and Bohm, S. (2020). Individualized muscle-tendon assessment and training. Front. Physiol. 11, 723. doi: 10.3389/fphys.2020.00723
Beggs, I., Bianchi, S., Bueno, A., and Cohen, M. (2016). European Society of Musculoskeletal Radiology. Musculoskeletal Ultrasound Technical Guidelines IV. Hip (last accessed September 16, 2015).
Binderup, A. T., Arendt-Nielsen, L., and Madeleine, P. (2010). Pressure pain threshold mapping of the trapezius muscle reveals heterogeneity in the distribution of muscular hyperalgesia after eccentric exercise. Eur. J. Pain 14, 705–712. doi: 10.1016/j.ejpain.2009.11.001
Bizzini, M., and Mannion, A. F. (2003). Reliability of a new, hand-held device for assessing skeletal muscle stiffness. Clin. Biomech. 18, 459–461. doi: 10.1016/S0268-0033(03)00042-1
Castro, J., Livino De Carvalho, K., Silva, P. E., Fachin-Martins, E., Babault, N., Marqueti, R. C., et al. (2019). Intra- and inter-rater reproducibility of ultrasound imaging of patellar and quadriceps tendons in critically ill patients. PLoS One 14, e0219057. doi: 10.1371/journal.pone.0219057
Chalchat, E., Gennisson, J. L., Peñailillo, L., Oger, M., Malgoyre, A., Charlot, K., et al. (2020). Changes in the viscoelastic properties of the vastus lateralis muscle with fatigue. Front. Physiol. 11, 307. doi: 10.3389/fphys.2020.00307
Charcharis, G., Mersmann, F., Bohm, S., and Arampatzis, A. (2019). Morphological and mechanical properties of the quadriceps femoris muscle-tendon unit from adolescence to adulthood: effects of age and athletic training. Front. Physiol. 10, 1082. doi: 10.3389/fphys.2019.01082
Chen, G., Wu, J., Chen, G., Lu, Y., Ren, W., Xu, W., et al. (2019). Reliability of a portable device for quantifying tone and stiffness of quadriceps femoris and patellar tendon at different knee flexion angles. PLoS One 14, e0220521. doi: 10.1371/journal.pone.0220521
Chino, K., Ohya, T., Kato, E., and Suzuki, Y. (2018). Muscle thickness and passive muscle stiffness in elite athletes: implications of the effect of long-term daily training on skeletal muscle. Int. J. Sports Med. 39, 218–224. doi: 10.1055/s-0043-122737
Cook, J. L., Malliaras, P., De Luca, J., Ptasznik, R., Morris, M. E., and Goldie, P. (2004). Neovascularization and pain in abnormal patellar tendons of active jumping athletes. Clin. J. Sport Med. 14, 296–299. doi: 10.1097/00042752-200409000-00008
Couppe, C., Kongsgaard, M., Aagaard, P., Hansen, P., Bojsen-Moller, J., Kjaer, M., et al. (2008). Habitual loading results in tendon hypertrophy and increased stiffness of the human patellar tendon. J. Appl. Physiol. 105, 805–810. doi: 10.1152/japplphysiol.90361.2008
Craig, N. P., and Norton, K. I. (2001). Characteristics of track cycling. Sports Med. 31, 457–468. doi: 10.2165/00007256-200131070-00001
Cristi-Sánchez, I., Danes-Daetz, C., Neira, A., Ferrada, W., Yáñez Díaz, R., and Silvestre Aguirre, R. (2019). Patellar and achilles tendon stiffness in elite soccer players assessed using myotonometric measurements. Sports Health 11, 157–162. doi: 10.1177/1941738118820517
Ditroilo, M., Watsford, M., Fernandez-Pena, E., Lucertini, F., De Vito, G., Fernández-Peña, E., et al. (2011). Effects of fatigue on muscle stiffness and intermittent sprinting during cycling. Med. Sci. Sports Exerc. 43:837–845. doi: 10.1249/MSS.0b013e3182012261
Domínguez-Martín, M., López-Ruiz, F., Reyes-López, M. V., Valenza, G., Fernández De Las Peñas, C., and Madeleine, P. (2013). Differences in pressure pain sensitivity of elite male soccer players on artificial turf and natural grass. Sport Technol. 6, 22–28. doi: 10.1080/19346182.2012.712136
Dorel, S., Hautier, C. A., Rambaud, O., Rouffet, D., Van Praagh, E., Lacour, J. R., et al. (2005). Torque and power-velocity relationships in cycling: relevance to track sprint performance in world-class cyclists. Int. J. Sports Med. 26, 739–746. doi: 10.1055/s-2004-830493
Ekizos, A., Papatzika, F., Charcharis, G., Bohm, S., Mersmann, F., and Arampatzis, A. (2013). Ultrasound does not provide reliable results for the measurement of the patellar tendon cross sectional area. J. Electromyogr. Kinesiol. 23, 1278–1282. doi: 10.1016/j.jelekin.2013.08.004
Elliott, B., and Alderson, J. (2007). Laboratory versus field testing in cricket bowling: a review of current and past practice in modelling techniques. Sports Biomech. 6, 99–108. doi: 10.1080/14763140601058623
Epro, G., Hunter, S., König, M., Schade, F., and Karamanidis, K. (2019). Evidence of a uniform muscle-tendon unit adaptation in healthy elite track and field jumpers: a cross sectional investigation. Front. Physiol. 10, 574. doi: 10.3389/fphys.2019.00574
Faria, E. W., Parker, D. L., and Faria, I. E. (2005). The science of cycling: factors affecting performance–Part 2. Sports Med. 35, 313–338. doi: 10.2165/00007256-200535040-00003
Faul, F., Erdfelder, E., Lang, A. G., and Buchner, A. (2007). G*Power 3: a flexible statistical power analysis program for the social, behavioral, and biomedical sciences. Behav. Res. Methods 39, 175–191. doi: 10.3758/BF03193146
Fernández-Carnero, J., Binderup, A. T., Ge, H.-Y., Fernandez-De-Las-Penas, C., Arendt-Nielsen, L., and Madeleine, P. (2010). Pressure pain sensitivity mapping in experimentally induced lateral epicondylalgia. Med. Sci. Sports Exerc. 42, 922–927. doi: 10.1249/MSS.0b013e3181c29eab
Fisker, F. Y., Kildegaard, S., Thygesen, M., Grosen, K., and Pfeiffer-Jensen, M. (2017). Acute tendon changes in intense CrossFit workout: an observational cohort study. Scand. J. Med. Sci. Sports 27, 1258–1262. doi: 10.1111/sms.12781
Fredberg, U., Bolvig, L., Andersen, N. T., and Stengaard-Pedersen, K. (2008). Ultrasonography in evaluation of Achilles and patella tendon thickness. Ultraschall Med. 29, 60–65. doi: 10.1055/s-2007-963027
Fredberg, U., and Stengaard-Pedersen, K. (2008). Chronic tendinopathy tissue pathology, pain mechanisms, and etiology with a special focus on inflammation. Scand. J. Med. Sci. Sports 18, 3–15. doi: 10.1111/j.1600-0838.2007.00746.x
Freedman, B. R., Sarver, J. J., Buckley, M. R., Voleti, P. B., and Soslowsky, L. J. (2014). Biomechanical and structural response of healing Achilles tendon to fatigue loading following acute injury. J. Biomech. 47, 2028–2034. doi: 10.1016/j.jbiomech.2013.10.054
Fung, D. T., Wang, V. M., Andarawis-Puri, N., Basta-Pljakic, J., Li, Y., Laudier, D. M., et al. (2010). Early response to tendon fatigue damage accumulation in a novel in vivo model. J. Biomech. 43, 274–279. doi: 10.1016/j.jbiomech.2009.08.039
Giombini, A., Dragoni, S., Di Cesare, A., Di Cesare, M., Del Buono, A., and Maffulli, N. (2013). Asymptomatic A chilles, patellar, and quadriceps tendinopathy: a longitudinal clinical and ultrasonographic study in elite fencers. Scand. J. Med. Sci. Sports 23, 311–316. doi: 10.1111/j.1600-0838.2011.01400.x
Goyal, T., Paul, S., Das, L., and Choudhury, A. K. (2020). Correlation between anthropometric measurements and activity level on length and diameter of semitendinosus tendon autograft in knee ligament surgery: a prospective observational study. SICOT-J 6:23. doi: 10.1051/sicotj/2020007
Karamanidis, K., and Arampatzis, A. (2006). Mechanical and morphological properties of human quadriceps femoris and triceps surae muscle-tendon unit in relation to aging and running. J. Biomech. 39, 406–417. doi: 10.1016/j.jbiomech.2004.12.017
Kawczynski, A., Mroczek, D., Frackiewicz, A., Chmura, P., Becella, L., Samani, A., et al. (2014). Effects of two recovery procedures after a football game on sensory and biochemical markers. J. Sports Med. Phys. Fitness 54, 394–402.
Kizilkaya, A. Ö., and Ecesoy, H. (2019). Ultrasonographic assessment of quadriceps and patellar tendon thicknesses in patients with patellofemoral pain syndrome. Acta Orthop. Traumatol. Turc. 53, 272–277. doi: 10.1016/j.aott.2019.04.009
Klich, S., Krymski, I., and Kawczynski, A. (2020). Viscoelastic properties of lower extremity muscles after elite track cycling sprint events: a case report. Central Eur. J. Sport Sci. Med. 29, 5–10. doi: 10.18276/cej.2020.1-01
Klich, S., Krymski, I., Michalik, K., and Kawczynski, A. (2018). Effect of short-term cold-water immersion on muscle pain sensitivity in elite track cyclists. Phys. Ther. Sport 32, 42–47. doi: 10.1016/j.ptsp.2018.04.022
Klich, S., Pietraszewski, B., Zago, M., Galli, M., Lovecchio, N., and Kawczynski, A. (2019). Ultrasonographic and myotonometric evaluation of the shoulder girdle after an isokinetic muscle fatigue protocol. J Sport Rehabil. 29, 1047–1052. doi: 10.1123/jsr.2019-0117
Kordi, M., Folland, J., Goodall, S., Haralabidis, N., Maden-Wilkinson, T., Sarika Patel, T., et al. (2020). Mechanical and morphological determinants of peak power output in elite cyclists. Scand. J. Med. Sci. Sports 30, 227–237. doi: 10.1111/sms.13570
Kulig, K., Landel, R., Chang, Y. J., Hannanvash, N., Reischl, S. F., Song, P., et al. (2013). Patellar tendon morphology in volleyball athletes with and without patellar tendinopathy. Scand. J. Med. Sci. Sports 23, e81–88. doi: 10.1111/sms.12021
Landis, J. R., and Koch, G. G. (1977). The measurement of observer agreement for categorical data. Biometrics 33, 159–174. doi: 10.2307/2529310
Liang, X., Wang, B., Zeng, X., Tang, Y., Xiao, F., Haiwei, L., et al. (2017). Effect of different resting time on patella-patellar tendon healing after acute injury. Chin. J. Tissue Eng. Res. 21, 1805–1812. doi: 10.1177/0363546517712223
Loturco, I., Gil, S., De Souza Laurino, C. F., Roschel, H., Kobal, R., Abad, C. C. C., et al. (2015). Differences in muscle mechanical properties between elite power and endurance athletes: a comparative study. J. Strength Cond. Res. 29, 1723–1728. doi: 10.1519/JSC.0000000000000803
Magnusson, S. P., and Kjaer, M. (2003). Region-specific differences in Achilles tendon cross-sectional area in runners and non-runners. Eur. J. Appl. Physiol. 90, 549–553. doi: 10.1007/s00421-003-0865-8
Mannarino, P., Matta, T. T. D., and Oliveira, L. F. (2019). An 8-week resistance training protocol is effective in adapting quadriceps but not patellar tendon shear modulus measured by Shear Wave Elastography. PLoS One 14, e0205782. doi: 10.1371/journal.pone.0205782
Mccreesh, K. M., Purtill, H., Donnelly, A. E., and Lewis, J. S. (2017). Increased supraspinatus tendon thickness following fatigue loading in rotator cuff tendinopathy: potential implications for exercise therapy. BMJ Open Sport Exerc. Med. 3, e000279. doi: 10.1136/bmjsem-2017-000279
Mersmann, F., Charcharis, G., Bohm, S., and Arampatzis, A. (2017). Muscle and tendon adaptation in adolescence: elite volleyball athletes compared to untrained boys and girls. Front. Physiol. 8, 417. doi: 10.3389/fphys.2017.00417
Nakama, L. H., King, K. B., Abrahamsson, S., and Rempel, D. M. (2005). Evidence of tendon microtears due to cyclical loading in an in vivo tendinopathy model. J. Orthop. Res. 23, 1199–1205. doi: 10.1016/j.orthres.2005.03.006
Ozçakar, L., Kunduracyoolu, B., Cetin, A., Ulkar, B., Guner, R., and Hascelik, Z. (2003). Comprehensive isokinetic knee measurements and quadriceps tendon evaluations in footballers for assessing functional performance. Br. J. Sports Med, 37, 507–510. doi: 10.1136/bjsm.37.6.507
Penailillo, L., Blazevich, A. J., and Nosaka, K. (2015). Muscle fascicle behavior during eccentric cycling and its relation to muscle soreness. Med. Sci. Sports Exerc. 47, 708–717. doi: 10.1249/MSS.0000000000000473
Pfirrmann, C. W., Jost, B., Pirkl, C., Aitzetmüller, G., and Lajtai, G. (2008). Quadriceps tendinosis and patellar tendinosis in professional beach volleyball players: sonographic findings in correlation with clinical symptoms. Eur. Radiol. 18, 1703–1709. doi: 10.1007/s00330-008-0926-9
Proske, U., and Morgan, D. L. (2001). Muscle damage from eccentric exercise: mechanism, mechanical signs, adaptation and clinical applications. J. Physiol. 537, 333–345. doi: 10.1111/j.1469-7793.2001.00333.x
Richardson, J. T. (2011). Eta squared and partial eta squared as measures of effect size in educational research. Educ. Res. Rev. 6, 135–147. doi: 10.1016/j.edurev.2010.12.001
Seynnes, O. R., Erskine, R. M., Maganaris, C. N., Longo, S., Simoneau, E. M., Grosset, J. F., et al. (2009). Training-induced changes in structural and mechanical properties of the patellar tendon are related to muscle hypertrophy but not to strength gains. J. Appl. Physiol. (1985) 107, 523–530. doi: 10.1152/japplphysiol.00213.2009
Skou, S. T., and Aalkjaer, J. M. (2013). Ultrasonographic measurement of patellar tendon thickness–a study of intra- and interobserver reliability. Clin. Imaging 37, 934–937. doi: 10.1016/j.clinimag.2013.01.007
Taş, S., Özkan, Ö., Karaçoban, L., Dönmez, G., Çetin, A., and Korkusuz, F. (2019). Knee muscle and tendon stiffness in professional soccer players: a shear-wave elastography study. J. Sports Med. Phys. Fitness 60, 276–281. doi: 10.23736/S0022-4707.19.09938-9
Todd, D. C., Ghasem, A. D., and Xerogeanes, J. W. (2015). Height, weight, and age predict quadriceps tendon length and thickness in skeletally immature patients. Am. J. Sports Med. 43, 945–952. doi: 10.1177/0363546515570620
Tsui, S. S., Leong, H. T., Leung, V. Y., Ying, M., and Fu, S. N. (2017). Tendon vascularity in overhead athletes with subacromial pain syndrome and its correlation with the resting subacromial space. J. Shoulder Elbow Surg. 26, 774–780. doi: 10.1016/j.jse.2016.09.041
Van Der Zwaard, S., De Ruiter, C. J., Jaspers, R. T., and De Koning, J. J. (2019). Anthropometric clusters of competitive cyclists and their sprint and endurance performance. Front. Physiol. 10:1276. doi: 10.3389/fphys.2019.01276
Visnes, H., Tegnander, A., and Bahr, R. (2015). Ultrasound characteristics of the patellar and quadriceps tendons among young elite athletes. Scand. J. Med. Sci. Sports 25, 205–215. doi: 10.1111/sms.12191
Von Elm, E., Altman, D. G., Egger, M., Pocock, S. J., Gøtzsche, P. C., and Vandenbroucke, J. P. (2008). The Strengthening the Reporting of Observational Studies in Epidemiology (STROBE) statement: guidelines for reporting observational studies. J. Clin. Epidemiol. 61, 344–349. doi: 10.1016/j.jclinepi.2007.11.008
Wanich, T., Hodgkins, C., Columbier, J.-A., Muraski, E., and Kennedy, J. G. (2007). Cycling injuries of the lower extremity. J. Am. Acad. Orthop. Surg. 15, 748–756. doi: 10.5435/00124635-200712000-00008
Watanabe, K., Sato, T., Mukaimoto, T., Takashima, W., Yamagishi, M., and Nishiyama, T. (2016). Electromyographic analysis of thigh muscles during track cycling on a velodrome. J. Sports Sci. 34, 1413–1422. doi: 10.1080/02640414.2015.1114135
Weir, J. P. (2005). Quantifying test-retest reliability using the intraclass correlation coefficient and the SEM. J. Strength Cond. Res. 19, 231–240. doi: 10.1519/00124278-200502000-00038
Young, F. C., Cristi-Sánchez, I., Danes-Daetz, C., Monckeberg, J. E., and Aguirre, R. S. (2018). Patellar Tendon stiffness in elite breakdancers assessed by myotonometric measurement. J. Dance Med. Sci. 22, 179–183. doi: 10.12678/1089-313X.22.4.179
Zhang, Z., Ng, G., and Fu, S. (2015). Effects of habitual loading on patellar tendon mechanical and morphological properties in basketball and volleyball players. Eur. J. Appl. Physiol. 115, 2263–2269. doi: 10.1007/s00421-015-3209-6
Keywords: tendon, thickness, stiffness, maps, track cycling
Citation: Klich S, Ficek K, Krymski I, Klimek A, Kawczyński A, Madeleine P and Fernández-de-las-Peñas C (2020) Quadriceps and Patellar Tendon Thickness and Stiffness in Elite Track Cyclists: An Ultrasonographic and Myotonometric Evaluation. Front. Physiol. 11:607208. doi: 10.3389/fphys.2020.607208
Received: 16 September 2020; Accepted: 25 November 2020;
Published: 14 December 2020.
Edited by:
Emiliano Cè, University of Milan, ItalyReviewed by:
Ryoichi Ema, Shizuoka Sangyo University, JapanKohei Watanabe, Chukyo University, Japan
Feza Korkusuz, Hacettepe University, Turkey
Copyright © 2020 Klich, Ficek, Krymski, Klimek, Kawczyński, Madeleine and Fernández-de-las-Peñas. This is an open-access article distributed under the terms of the Creative Commons Attribution License (CC BY). The use, distribution or reproduction in other forums is permitted, provided the original author(s) and the copyright owner(s) are credited and that the original publication in this journal is cited, in accordance with accepted academic practice. No use, distribution or reproduction is permitted which does not comply with these terms.
*Correspondence: Sebastian Klich, sebastian.klich@awf.wroc.pl