 Wan Teng
 Yan-Yan Zhao
 Xue-Qiang Zhao1
 Xin-Ping Chen
 Yi-Ping Tong
- 1The State Key Laboratory for Plant Cell and Chromosome Engineering, Institute of Genetics and Developmental Biology, Chinese Academy of Sciences, Beijing, China
- 2Institute of Tropical Agriculture and Forestry, Hainan University, Haikou, China
- 3Research Center of Resource, Environment and Food Security, China Agricultural University, Beijing, China
The PHT1 family of phosphate (Pi) transporters mediates phosphorus (P) uptake and re-mobilization in plants. A genome-wide sequence analysis of PHT1 genes in wheat (Triticum aestivum) was conducted, and their expression locations and responses to P availability were further investigated. We cloned 21 TaPHT1 genes from the homologous alleles at TaPHT1.1 to 1.10 through screening a BAC library and amplifying genomic sequences. The TaPHT1 transporters were clustered into five branches in the phylogenetic tree of PHT1 proteins, and the TaPHT1 genes from a given branch shared high similarities in sequences, expression locations, and responses to P availability. The seven tested PHT1 genes all showed Pi-transport activity in yeast (Saccharomyces cerevisiae) cells grown under both low Pi and high Pi conditions. The expression of TaPHT1.1/1.9, 1.2, and 1.10 were root specific. The expression of these TaPHT1 genes at flowering positively correlated with P uptake after stem elongation across three P application rates and two wheat varieties in a field experiment. Therefore, modification of PHT1 expression may improve P use efficiency in a broad regime of P availability.
Introduction
Phosphorus (P) is one of the essential macronutrients for plant growth and development, and it takes part in cellular macromolecules, energy transfer reactions, and cellular metabolism. Efficient acquisition of phosphate (Pi) from soil combined with efficiency translocation of Pi within plants is essential for plants to maintain adequate levels of cellular Pi necessary for normal function (Raghothama and Karthikeyan, 2005). Although total P in soils is abundant, the soluble phosphate (Pi) is often low (Bieleski, 1973; Rausch and Bucher, 2002), and therefore plants often encounter a scarcity of Pi in soils of both agricultural and natural systems (Raghothama, 1999, 2000). As there is a large difference between Pi levels in plant cells (mM) and soil solution (μM), plants need to acquire Pi against a steep concentration gradient across the plasma membrane (Smith et al., 2003; Raghothama and Karthikeyan, 2005). The transmembrane transport of Pi from soils into plant cells requires a high-affinity, energy-driven transport mechanism (Smith et al., 2003). The PHT1 family of plant Pi transporters is assumed to play the predominant roles in this transmembrane transport process. These proteins are characterized by 12 membrane-spanning domains which are similar to PHO84, a high-affinity Pi transporter from yeast (Saccharomyces cerevisiae) (Muchhal et al., 1996; Rausch and Bucher, 2002).
There are four PHOSPHATE TRANSPORTER (PHT) families in plants: PHT1, PHT2, PHT3, and PHT4 which are located on plasma membrane, plastid inner membrane, mitochondrial inner membrane, and Golgi-compartment, respectively (Lopez-Arredondo et al., 2014). Under the stress of P-starvation, the expression of PHT1 genes are strongly induced to increase the ability of the roots in acquiring P from soils and remobilize P within plants (Smith et al., 2003; Raghothama and Karthikeyan, 2005). A large number of PHT1 transporters have been identified in many plant species and show differences in expression locations and affinities for Pi (Nussaume et al., 2011). Nine PHT1 genes in Arabidopsis (Arabidopsis thaliana) have been identified. AtPHT1.1 and AtPHT1.4 are highly expressed at the root–soil interface, including the epidermis, root hair cells, and the root cap under low P conditions (Mudge et al., 2002), and they are the major genes responsible for Pi acquisition by roots in both high and low P supplies (Misson et al., 2004; Shin et al., 2004; Catarecha et al., 2007). AtPHT1.8 and AtPHT1.9 are likely to act sequentially in the interior of the plant during the root-to-shoot translocation of Pi and are involved in root-to-shoot translocation of Pi (Lapis-Gaza et al., 2014). There are 13 PHT1 members in the rice (Oryza sativa) genome, and some of them have been functionally characterized, including OsPHT1.1 (Sun et al., 2012), OsPHT1.2 and OsPHT1.6 (Ai et al., 2009), OsPHT1.4 (Ye et al., 2015), and OsPHT1.8 (Jia et al., 2011; Li et al., 2015). For example, OsPHT1.6 is expressed in both epidermal and cortical cells of the younger primary and lateral roots and encodes as a high-affinity transporter with a broad role in Pi uptake and translocation throughout the plant, whereas OsPHT1.2 is localized exclusively in the stele of primary and lateral roots and functions as a low-affinity transporter responsible for Pi translocation (Ai et al., 2009). Barley (Hordeum vulgare) is a close relative to wheat (Triticum aestivum). To date, 11 PHT1 genes have been reported in barley. The HvPHT1.1 and HvPHT1.2 promoters drive the expression of β-glucuronidase (GUS) and green fluorescent protein (GFP) reporter genes in epidermal and cortex cells as well as vascular tissues of roots (Schunmann et al., 2004). When expressed in Xenopus laevis oocytes, HvPHT1.1 is confirmed to be a high-affinity transporter with a very low Km value (1.9 μM) for Pi transport (Preuss et al., 2011). The expression locations and Km value for Pi transport indicate the possible role of HvPHT1.1 in P uptake. HvPHT1.6 is expressed in both roots and shoots (Huang et al., 2008). Also, it is highly expressed in old leaves compared to young leaves, especially in the leaf phloem tissue (Rae et al., 2003). HvPHT1.6 shows the linear transport activity for Pi-stimulated inward current over a concentration range of 5 to 30 mM in Xenopus laevis oocytes (Preuss et al., 2010). These results suggest that HvPHT1.6 function as a low-affinity Pi transporter responsible for Pi remobilization in the whole plant. Huang et al. (2011) investigated the expression of PHT1 genes and its relationship with P acquisition efficiency and P utilization efficiency (the amount of biomass produced per unit of acquired P) in four barley genotypes. They did not find a clear pattern in the expression of the four HvPHT1.1 paralogs (HvPHT1.1, 1.2, 1.9, 1.10) among the four barley genotypes, but observed that the expression of HvPHT1.3 and 1.6 positively correlated with P utilization efficiency. HvPHT1.8 and HvPHT1.11 (known as HvPT11) have been demonstrated to be specifically activated by arbuscular mycorrhizal (AM) fungi (Glassop et al., 2005; Sisaphaithong et al., 2012), indicating their possible roles in the mycorrhizal pathway of Pi uptake.
Wheat is one of the most important crops. However, limited attempts have been made to dissect the role of Pi transporters in wheat (Secco et al., 2017). Davies et al. (2002) isolated the first full-length sequence of a wheat PHT1 gene (TaPHT1.10-U, formerly known TaPT2) and partial clones of several other putative PHT1 genes. TaPHT1.10-U was induced by P-deficiency in roots, and had higher transcript abundance in P-efficient wheat varieties than in inefficient ones (Davies et al., 2002). In yeast, TaPHT1.10-U can complement high-affinity phosphate transporter gene PHO84 function (Zeng et al., 2002) and shows an apparent mean Km of 23.6 μM Pi (Guo et al., 2014). Overexpression of TaPHT1.10-U increases plant dry weight and Pi acquisition, whereas knock-down of TaPHT1.10-U has the opposite effect (Guo et al., 2014). These results suggest that TaPHT1.10-U functions as a high-affinity Pi transporter and mediates Pi uptake. A recent study observed that TaPHT1.12-7A (former name TaPHT1.4) was root-specific and P-deficiency inducible. Yeast complement analysis showed that TaPHT1.12-7A encodes a high-affinity Pi transporter with an apparent Km of 35.3 μM. Overexpressing TaPHT1.12-7A significantly improves growth traits and accumulates more Pi than the wild-type plant and those with downregulated TaPHT1.12-7A expression (Liu et al., 2013). A recent study also revealed the relationships between PHT1 expression and P use efficiency in wheat (Aziz et al., 2014). The highly P-efficient wheat cultivar Chinese 80-55 has a higher Pi acquisition in the presence of Pi and accumulates higher Pi concentrations in all organs upon Pi withdrawal compared with the less-efficient cultivar Machete. These differences correlate with differential organ-specific expression of Pi transporters TaPHT1.10-4A (reported as TaPHT1.2, GenBank: AY293828), TaPHT1.6-5A (reported as TaPHT1.5, GenBank: AF110180) and TaPHT1.4-5B (reported as TaPHT1.8, GenBank: AK333026) (Aziz et al., 2014). Shukla et al. (2016) found that aleurone accumulates more Pi with higher expression of TaPHT1 genes compared to endosperm. TaPHT1.8-6A (known as TRIae; Pht1; myc, Glassop et al., 2005, GenBank: AJ830009), TaPHT1.11-4A (known as TRIae; Pht1; 12, GenBank: AB753271), TaPHT1.11-4B (known as TRIae; Pht1;11, GenBank: AB753270), and TaPHT1.11-4D (known as TRIae; Pht1; 10, GenBank: AB753269) have been found to be induced by AM fungi (Glassop et al., 2005; Sisaphaithong et al., 2012). Although expression of some PHT1 genes has displayed correlation with P use-related traits in wheat and its close relative barley under controlled conditions, an on-farm field-scale investigation is required to explore the PHT1 genes contributing to P uptake and utilization, as the response of PHT1 genes to P supply level under controlled conditions greatly differed from that under field conditions. Our recent study showed that the expression of TaPHT1.1, 1.2, 1.9, and 1.10 in roots at the flowering stage under low P conditions was lower than that under high P conditions in a field experiment (Teng et al., 2013). The inhibition of these four wheat genes by P-deficiency could be, at least partially, explained by the upregulated AM colonization under P-deficiency, considering that AM colonization has been found to inhibit the response of HvPHT1.1 and HvPHT1.2 to P deficiency in barley (Glassop et al., 2005).
In this study, we aimed to identify the sequences of PHT1 genes in the whole genome of wheat, and to analyze the correlation between the PHT1 expression and P uptake under field conditions. We isolated 21 full length sequences of PHT1 genes in wheat, and further analyzed their functions, expression location and response to P supply level. We observed that the expression of TaPHT1.1, 1.2, 1.9, and 1.10 in roots at the flowering stage contributed to P uptake of different wheat varieties under field conditions.
Materials and Methods
Wheat Varieties
The winter wheat (Triticum aestivum) variety Xiaoyan 54 was commercially released in 2000, and was used to isolate TaPHT1 sequences, and to analyze gene expression location and response to P availability. The winter wheat varieties Kenong 9204 (KN9204) and Shijiazhuang 8 (SJZ8) were commercially released in 2003, and were used in the field experiments to analyze the relationship between TaPHT1 expression and P uptake.
Isolation of PHT1 Pi Transporters in Wheat
To isolate PHT1 sequences from the wheat variety Xiaoyan 54, we performed BAC library screening and genomic sequence amplification by using the primers in Supplementary Table S1. After several rounds screening the BAC library of Xiaoyan 54 (Dong et al., 2010), we obtained 28 BAC clones which contained PHT1 genes. These BAC clones were sequenced commercially by using a Roche/454 GS-FLX Titanium System (Roche Diagnostics, Germany) at SinoGenoMax Co., Ltd. (Chinese National Human Genome Center, Beijing, China). The resultant sequences were examined for the promoter and protein-coding sequences of PHT1 genes, and consequently the primers were designed to isolate the coding regions of the PHT1 genes in these BAC clones. The PCR products amplified from BAC clones and genomic DNA were sub-cloned into a pMD18-T Vector (Takara Bio, Dalian, China), and then sequenced commercially at SinoGenoMax Co., Ltd. The putative cis-elements in the promoters were predicted by RSAT::Plants software1. We used the neighbor-joining method to generate a phylogenetic tree of PHT1 proteins from wheat, Triticum urartu, Aegilops tauschii, barley, maize (Zea mays), rice, and Arabidopsis, and the phylogenetic tree was drawn using MEGA 5.0 (Tamura et al., 2011). Sequence alignment was performed by DNAMAN6.0 (Lynnon BioSoft, San Ramon, CA, USA).
Functional Complementation Assay of Pi Transporters in Yeast
The yeast manipulations were performed as previously described (Ai et al., 2009). For the complementation assay, the coding sequences of the TaPHT1 genes were amplified by PCR and subcloned into the yeast expression vector p112A1NE to create TaPHT1-p112A1NE constructs. These constructs and the empty vector p112A1NE were transformed into the yeast Pi uptake-defective mutant MB192 (Bun-Ya et al., 1991). Because the PHT1 transporters are members of the H+/Pi symporter family, we firstly evaluated the optimal pH value for the growth of the transformed and control yeast strains. After measuring the optical density of the yeast cell lines at pH values ranging from 4 to 8 in yeast nitrogen base (YNB) liquid medium, we observed that the optimal pH value for most of the yeast mutant cells carrying TaPHT1s was 6, whereas the optimal pH value for the wild-type ranged from 4 to 6. Therefore, the pH value was set to 6 in the subsequent studies. To measure the kinetic growth profiles of the yeast strains, the yeast cells were grown in YNB liquid medium to the logarithmic phase (when the absorbance at 600 nm was 0.8), and were then harvested and washed in Pi-free YNB medium. Then, the yeast cells were grown at 30°C for 24 h in the YNB liquid media containing 200 μM Pi (high Pi) and 20 μM Pi (low Pi). The absorbance at 600 nm (OD600) was recorded every 6 h. MB192 and p112A1NE were kindly provided by Prof. Shubin Sun from Nanjing Agricultural University, Nanjing, China.
Plant Growth Conditions
A hydroponic culture and three field experiments were conducted. The winter wheat variety Xiaoyan 54 was used in the hydroponic culture. The nutrient solution and growth conditions of the hydroponic culture were described by Wang et al. (2013). The seedlings, after 6 days of germination, were grown in nutrient solutions that contained 200 μM Pi (high P) or 5 μM Pi (low P). The plants were grown at 20°C for 3 weeks, and the roots and shoots were collected separately for gene expression analysis.
The field experiment in the experimental station of the Institute of Genetics and Developmental Biology in Beijing was carried out in the 2012–2013 growing season. The plant density and P fertilizer treatments was described by Wang et al. (2013). Briefly, the low P and high P treatments, i.e., 0.0 g m-2 and 13.5 g m-2 of P as calcium superphosphate, respectively, were applied before sowing. The seeds of Xiaoyan 54 were sown at the end of September in 2012. At the re-greening stage (March 18, 2013), the roots in 0–30 cm depth soil and shoots were collected separately. At the flowering stage (May 3, 2013), the stems, spikes, flag leaves, and aging leaves (top third leaf) were sampled. At the grain filling stage (14 days after flowering), the stems, grains, flag leaves, and aging leaves were collected. In each sampling time, 10 plants were randomly selected in each of the three replications. The plant samples were stored at -80°C for gene expression analysis.
Two field experiments at the Quzhou Experiment Station (36.5° N 115.0° E, 40 m above sea level) of the China Agricultural University have been described by Teng et al. (2013). These two experiments were conducted in the 2009–2010 growing season (referred as the 2010 field experiment) and the 2010–2011 growing season (referred as the 2011 field experiment). The data were collected from the winter wheat varieties KN9204 and SJZ8 at the P application rates 0, 100, and 400 kg ha-1 of P as calcium superphosphate (referred as P0, P100, and P400, respectively). The data for P use-related traits and expression levels of TaPHT1 genes in KN9204 have been reported by Teng et al. (2013). The P application rates P0, P100, and P400 represented deficient, optimal, and excessive P supply, respectively (Teng et al., 2013).
RNA Extraction and Quantitative Real-time PCR
Total RNA extraction and real-time quantitative reverse transcription PCR (qRT-PCR) were performed according to the methods of Teng et al. (2013). The primer sequences are listed in Supplementary Table S2. The gene expression levels were normalized to the internal control of TaActin.
Measurement of Total P Concentration in Plant Samples
To determine plant total P, dried samples were milled and subsequently digested with concentrated H2SO4 and H2O2 using the molybdate-blue colorimetric method (Murphy and Riley, 1962).
Statistical Analysis
The SPSS statistical software (SAS Institute, Cary, NC, USA) was used to perform analysis of variance using one-way analysis of variance (ANOVA). Comparisons of means were performed using Duncan’s multiple range analysis test and paired samples t-test (α = 0.05).
Results
Sequence Analysis of PHT1 Transporters in Wheat
We cloned 21 TaPHT1 genes from common wheat through screening a BAC library of Xiaoyan 54 and amplifying genomic sequences (Supplementary Table S3). None of these genes contained intron, 19 of them contained full length ORFs, and their deduced protein sequences varied from 521 to 539 amino acids (Supplementary Table S3). One nucleotide deletion occurred at 368 bp downstream of the start codon in TaPHT1.10-4B and thus resulted in a frame shift mutation, and TaPHT1.9-4A had a premature stop codon mutation at 810 bp downstream of the start codon, but this premature stop mutation was not found in the Chinese spring. We mapped the cloned TaPHT1s on chromosomes by sequence analysis of BAC contigs and the reference sequence of Chinese spring2. The five clones, BAC48, BAC470, BAC674, BAC1217, and BAC1779, formed a BAC contig which contained TaPHT1.1-4B, 1.2-4B, 1.9-4B, and 1.10-4B (Supplementary Figure S1A). TaPHT1.9-4B and 1.2-4B matched with the sequences from 210,450 to 212,013 bp and from 299,422 to 300,999 bp in the scaffold TGACv1_scaffold_320302_4BL, respectively (Supplementary Figure S1B), Therefore TaPHT1.1-4B and 1.10-4B were assigned to chromosome 4B. Further sequence analysis showed that the 1011 bp fragment from 220136 to 221146 bp and the 1316 bp fragment from 258319 to 259634 bp of the scaffold TGACv1_scaffold_320302_4BL matched with TaPHT1.10-4B and 1.1-4B, respectively, but both fragments had low sequence quality. The former fragment contained 585 unknown nucleotides, and the later fragment contained 1004 unknown nucleotides; this was possibly why these two fragments were not annotated. TaPHT1.10-4B also showed 99.7% of sequence identity with the sequence from 1 to 1465 bp in the scaffold TGACv1_scaffold_684896_U (Overlapping gene TRIAE_CS42_U_TGACv1_684896_AA2159320, Supplementary Table S3). TaPHT1.10-4B from Xiaoyan 54 seemed to be the allele of TRIAE_CS42_U_TGACv1_684896_AA2159320 from Chinese spring, as both genes had the nucleotide deletion at 368 bp downstream of the start codon.
Genome-wide analysis of the genome sequence in Triticum_aestivum_CS42_TGAC_v1 assembly for Chinese spring2 totally identified 32 Gene IDs for TaPHT1 (Supplementary Table S3). The Gene ID TRIAE_CS42_4BL_TGACv1_320302_AA1034400 matched with TaPHT1.2-4B and TaPHT1.9-4B; and no Gene ID was found to match with TaPHT1.1-4B and TaPHT1.10-U cloned in the current study or TaPHT1.11-4B (former name TRIae; Pht1;11) cloned by Sisaphaithong et al. (2012). Therefore, we identified a total of 36 TaPHT1 genes (Supplementary Table S3). The 31 genes of TaPHT1.1-TaPHT1.11 were named according to their similarity with barley PHT1 transporters and chromosome location, and the remaining five genes were sequentially named TaPHT1.12, TaPHT1.13, and TaPHT1.14, together with the chromosome location (Supplementary Table S3). The TaPHT1 genes were unevenly distributed on the chromosomes, as there were 17 and 8 PHT1 genes on the chromosomes of homologous group 4 and 5, respectively (Supplementary Table S3). This uneven distribution was mainly due to the PHT1 clusters on the chromosomes of these homologous groups. For example, we found five TaPHT1 genes (TaPHT1.5-4B, TaPHT1.1-4B, 1.2-4B, 1.9-4B and 1.10-4B) within a 150-kb region on the long arm of chromosome 4B (Supplementary Figure S1). The scaffold TGACv1_scaffold_407907_5BL on the long arm of chromosome 5B conferred TaPHT1.3-5B and TaPHT1.4-5B within an approximate 18-kb region (Supplementary Table S3). We also cloned the promoter sequences of 10 TaPHT1 genes, and all these promoters were found to contain several putative Pi-starvation response regulator PHR1 binding cis-element P1BS and WRKY transcription factor binding element W-Box (Supplementary Figure S2).
We calculated the relatedness of TaPHT1s using the ClustalX 2.1 software, with the results suggesting that the protein sequence identities ranged from 46 to 99%. The highest identities were found between the protein sequences of TaPHT1.1/1.2/1.9/1.10, and for that of TaPHT1.3/1.4. There were more than 98% of protein sequence identities between each other of the homologous alleles at a given TaPHT1 locus from genomes A, B, and D (e.g., TaPHT1.8-6A, -6B and -6D). A neighbor-joining tree was constructed using a multiple sequence alignment according to TaPHT1 proteins and the PHT1 sequences from Triticum urartu, Aegilops tauschii, barley, maize, rice, and Arabidopsis (Supplementary Table S3). TaPHT1.10-4B was not included in the phylogenetic analysis, as it contained a frame shift mutation. The 35 TaPHT1s were clustered into five of the six branches (Figure 1). Branch I only contained PHT1s from Arabidopsis. TaPHT1.13-2A, TRIurPHT1.13, and OsPHT1.4/1.5 formed Branch II. The six TaPHT1.6/1.7 genes fell into Branch III which contained HvPHT1.6/1.7 and OsPHT1.6/1.7. The nine TaPHT1.3/1.4/1.5 genes belonged to Branch IV, and showed a close relationship with HvPHT1.3/1.4/1.5. The nine TaPHT1.1/1/2/1/9/1.10 genes belonged to Branch V, and they closely related to HvPHT1.1/1.2/1.9/1.10 and OsPHT1.1/1.2/1.3. The 10 TaPHT1.8/1.11/1.12/1.14 genes were grouped into Branch VI, which contained the AM fungi-inducible PHT1s from cereals as well as AtPHT1.6/1.8/1.9 from Arabidopsis.
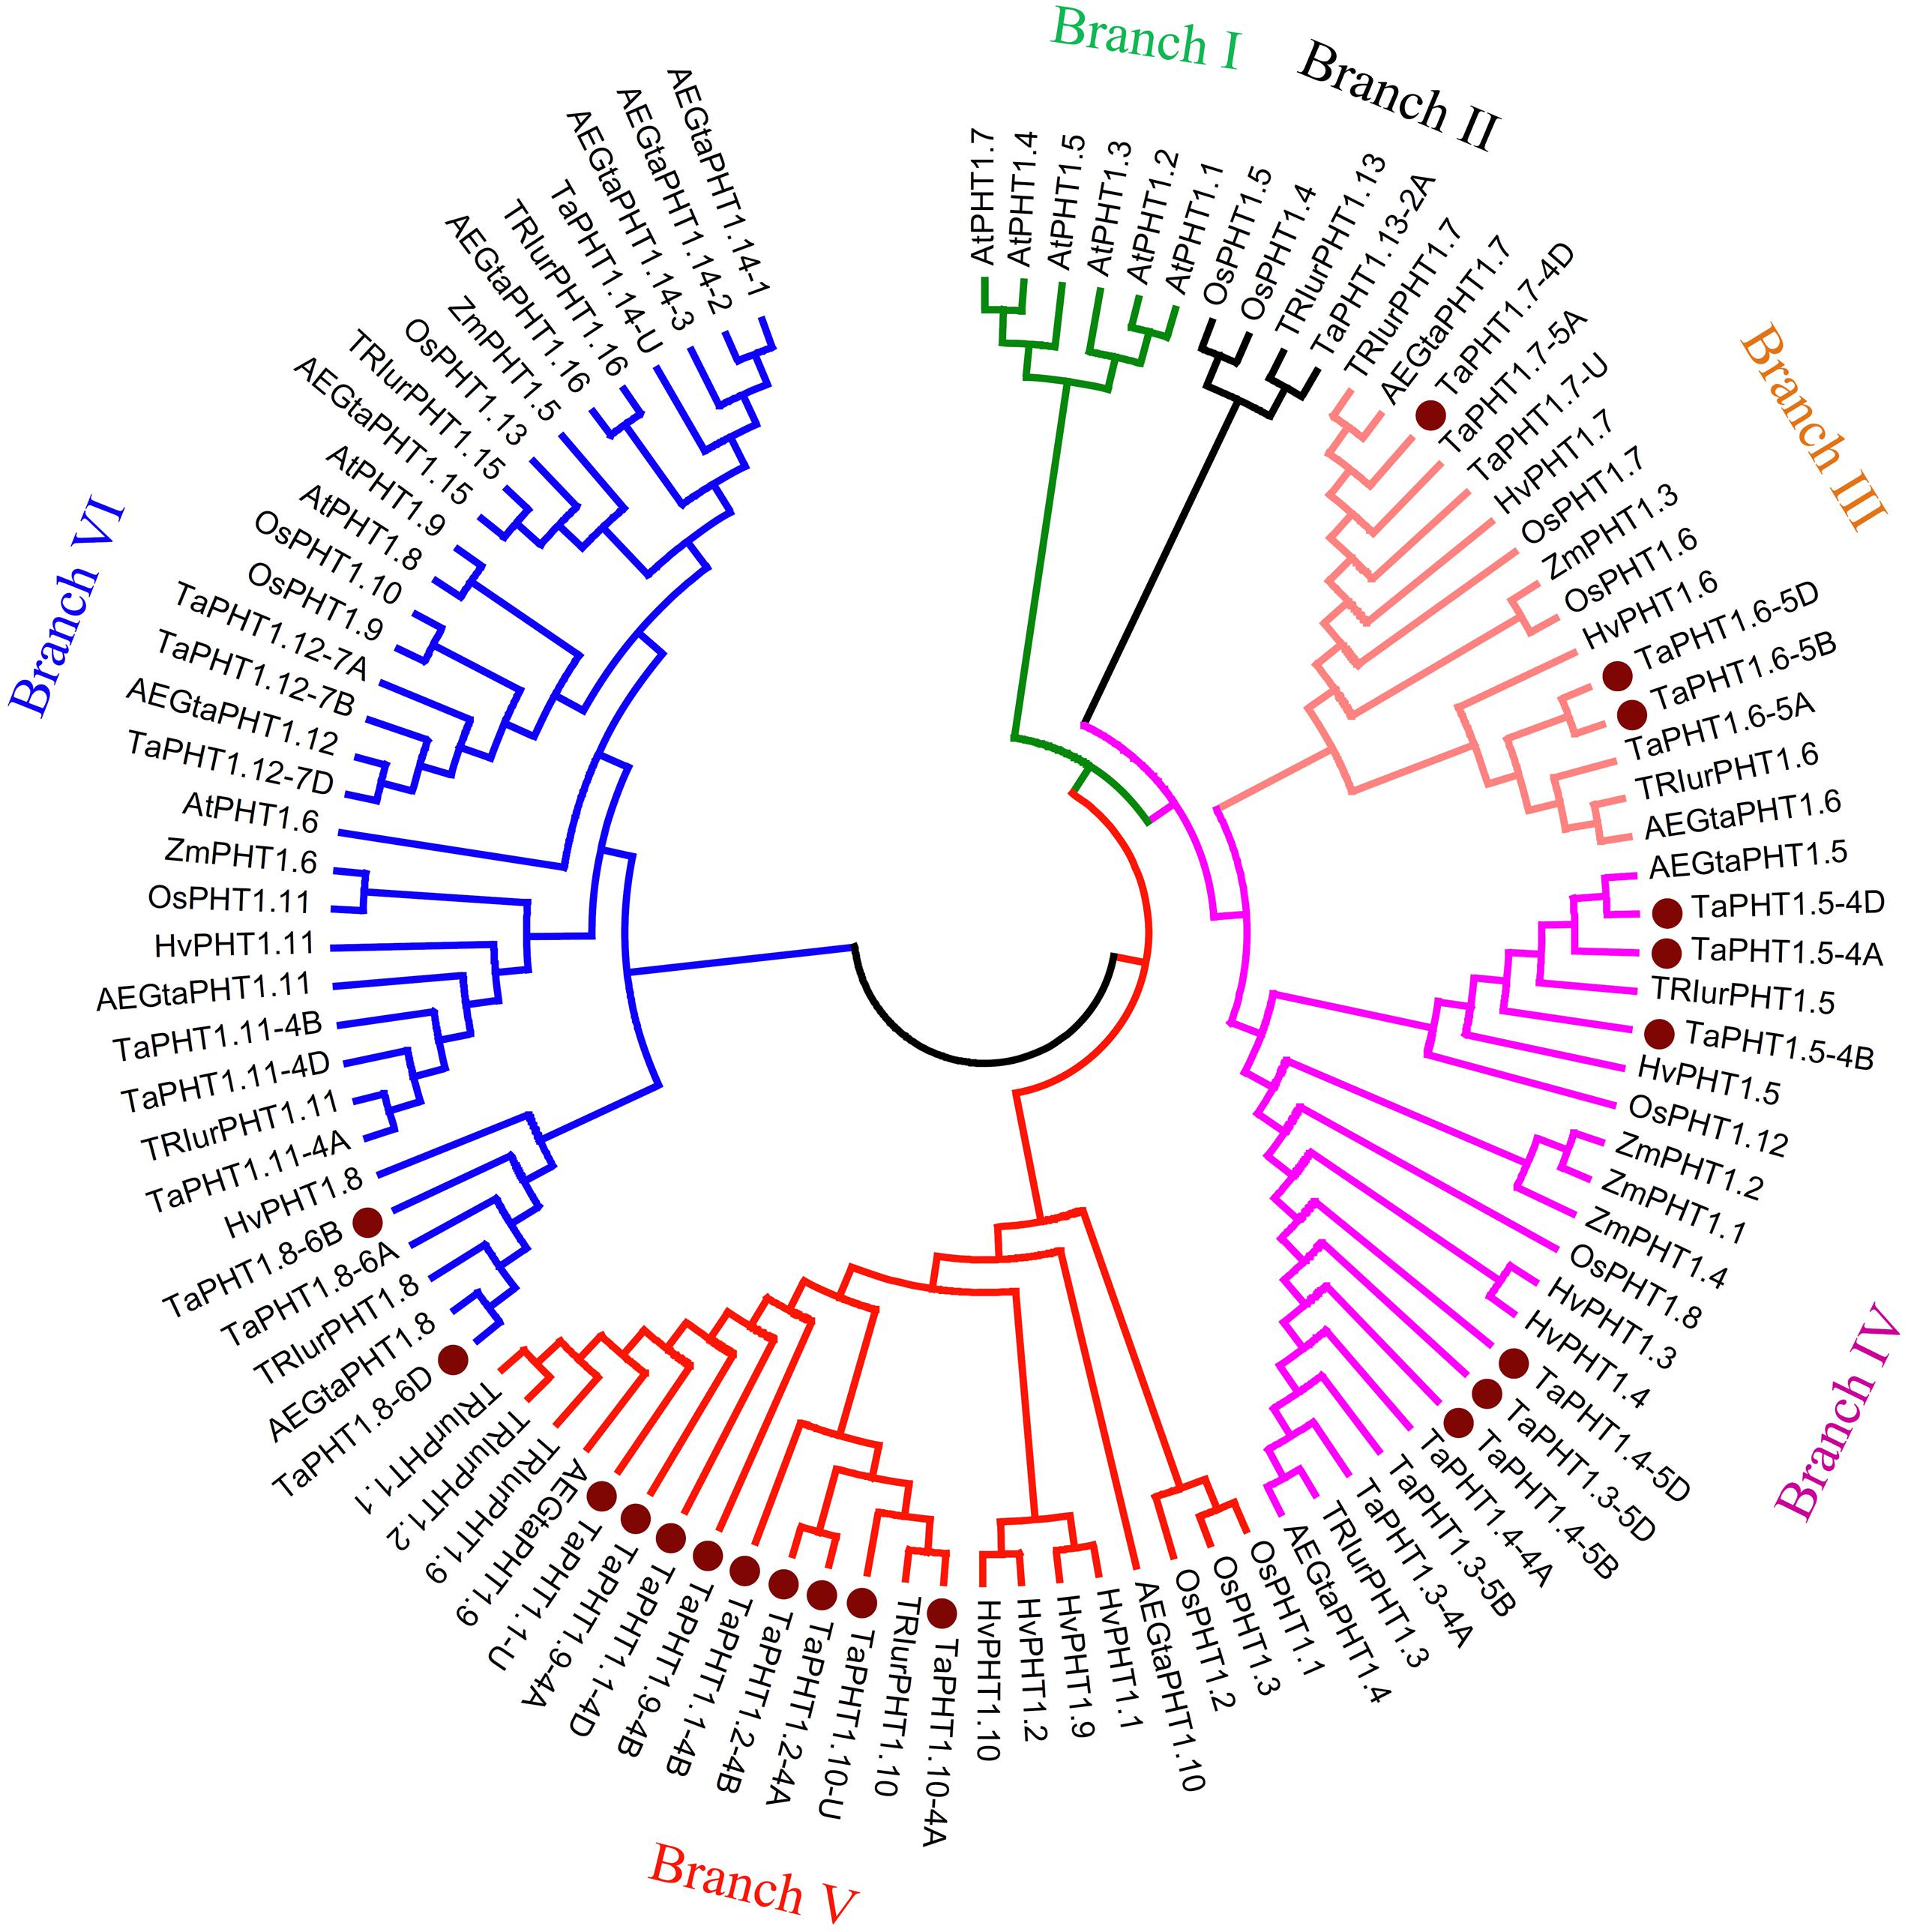
FIGURE 1. Phylogenetic analysis for PHT1 transporters in plants. The neighbor-joining method was used to perform a phylogenetic analysis of PHT1 transporters from Triticum aestivum (Ta), Triticum urartu (TRIur), Aegilops tauschii (AEGta), Hordeum vulgare (Hv), Oryza sativa (Os), Zea mays (Za), and Arabidopsis thaliana (At). Boot strap values are from 1000 replications. The genes cloned in the present study are indicated by a dot.
Analysis of Pi Transport Activities of TaPHT1s in a Yeast Strain Defective in Pi Uptake
We analyzed the Pi transport activities of TaPHT1.1-4D, 1.10-4A, 1.4-5D, 1.5-4A, 1.6-5D, 1.7-4D, and 1.8-6B genes using the yeast mutant MB192 strain (pho84 mutant; Bun-Ya et al., 1991), which is defective in Pi uptake. TaPHT1.1-4D and 1.10-4A were selected to represent the closely related TaPHT1.1/1.2/1.9/1.10 which encoded two types of protein length, 521 amino acids and 525 amino acids. TaPHT1.4-5D was chosen to represent the closely related TaPHT1.3/1.4. The coding regions of the seven selected TaPHT1 genes were separately inserted into the yeast expression vector p112A1NE under the control of the yeast alcohol dehydrogenase promoter. The constructs were separately transformed into a yeast Pi transporter mutant MB192. An empty vector was also transformed to be used as a control (Yp112). We first analyzed the complementation of MB192 by TaPHT1 genes by using dilution based plate assays. All the yeast transformants harboring the candidate TaPHT1 genes grew better than the Yp112 (empty vector control), but poorer than the wild-type in the plates which contained 20, 60, 100, and 140 μM Pi when the yeast cells were diluted to 1/100 OD value (Supplementary Figure S3C). This result indicated that the seven tested TaPHT1 genes could partially restore the growth of MB192 mutant cells. Staining test for acid phosphatase activity also showed that TaPHT1.6-5D and TaPHT1.10-4A partially restore the growth of MB192 mutant (Supplementary Figures S3A,B). We then assessed the kinetic growth of the yeast cells in YNB liquid medium that contained 200 μM Pi (high Pi) and 20 μM Pi (low Pi). The wild-type yeast strain grew much quicker than the Yp112, MB192, and the yeast cells transformed with TaPHT1 genes (Yp112-TaPHT1s), whereas Yp112 and MB192 exhibited a growth defect on both high Pi and low Pi media (Figure 2). All the yeast mutant cells carrying Yp112-TaPHT1s transformants grew faster than Yp112 and MB192 under high Pi and low Pi conditions (Figure 2), suggesting that these selected TaPHT1s had Pi transport activity.
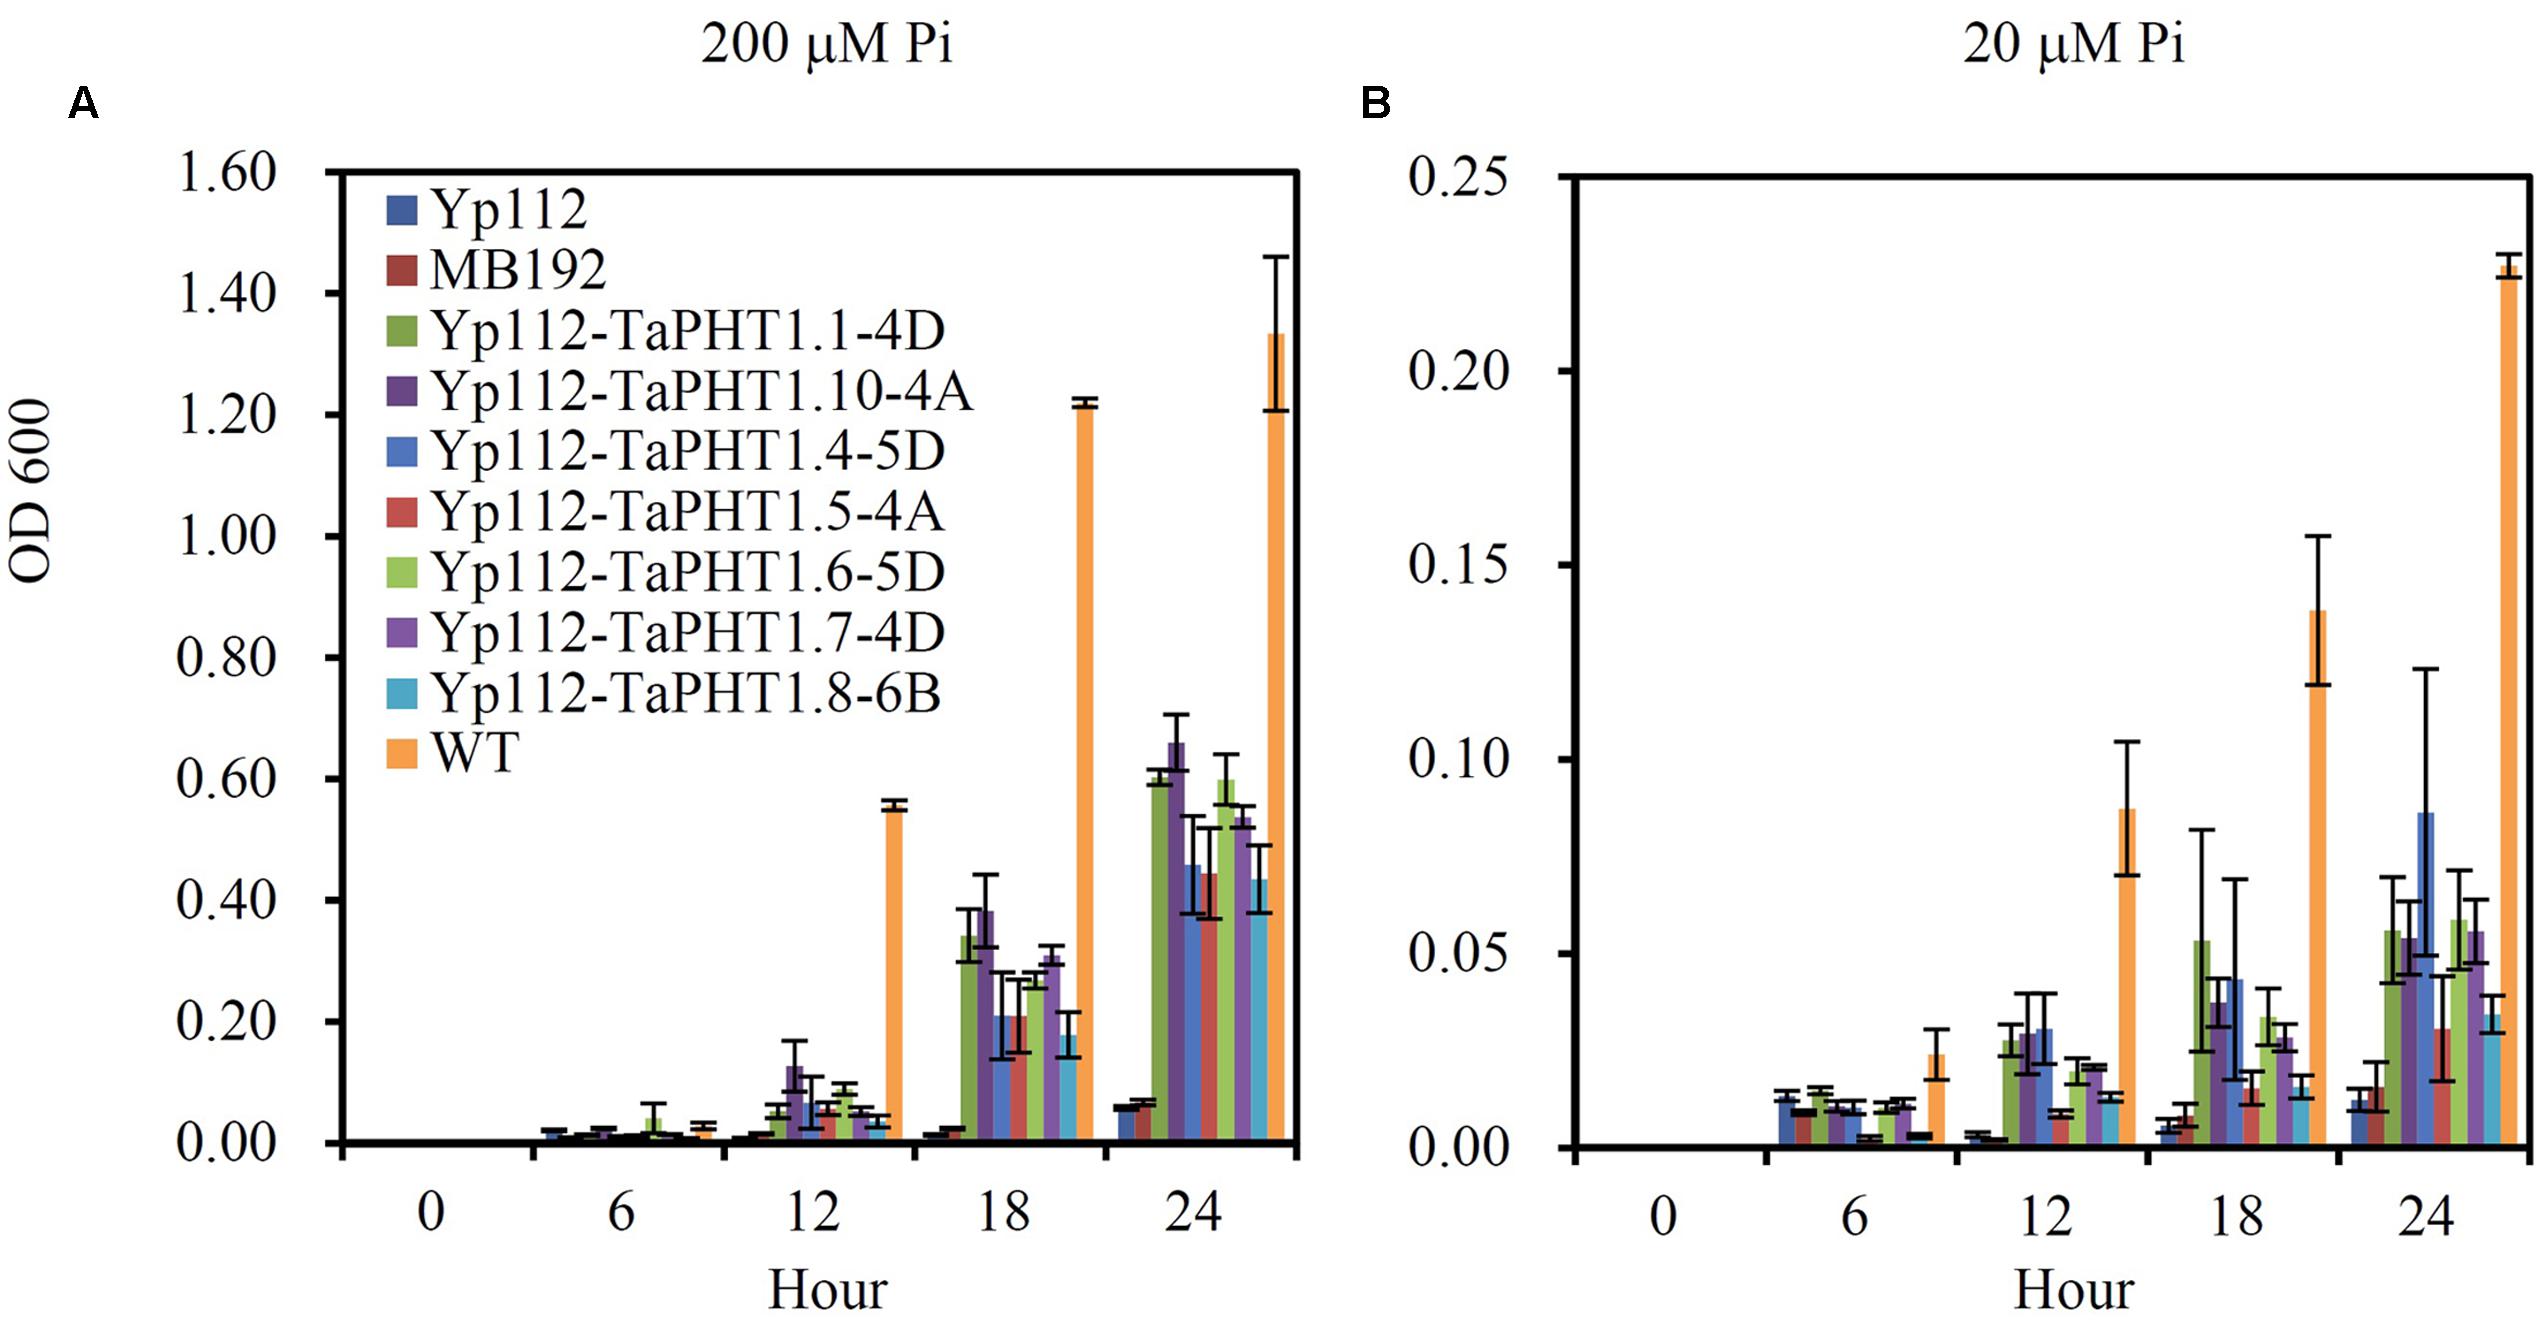
FIGURE 2. Functional expression of seven TaPHT1 genes in yeast. Kinetic growth profiles of the wild-type (WT), MB192, MB192 transformed with an empty expression vector (Yp112) and the candidate PHT1 genes (Yp112-TaPHT1s) generated from a 24 h YNB culture medium under 200 μM Pi (A) and 20 μM Pi (B). OD 600, Optical density at 600 nm. Data are mean ± SE of three biological replications.
Responses of TaPHT1 Expression to P Availability
Quantitative real-time RT-PCR was used to analyze the responses of TaPHT1 genes to P supply levels at the seedling stage in a hydroponic culture and at the re-greening stage in a field experiment. Primers were designed to amplify the homologous alleles at a particular locus; for example, the relative expression level of TaPHT1.2 might represent that of all three homologous alleles of TaPHT1.2 (TaPHT1.2-4A, -4B, and -4D). In both the hydroponic culture and the field experiment, the expression of TaIPS1.1, a molecular indicator of plant Pi status (Teng et al., 2013), was upregulated by the low P treatment (Supplementary Figures S4A–C), indicating that the plants in the low P treatment in both of the experiments were P-starved. TaPHT1.1/1.9, TaPHT1.2, and TaPHT1.10 were predominantly expressed in roots in both experiments (Figures 3A, 4A), and their expression was dramatically induced by low P treatment in the hydroponic culture (Figure 3A), but not in the field experiment (Figure 4A). Of these four root-specific genes, TaPHT1.10 displayed the highest expression and TaPHT1.1/1.9 the lowest (Figures 3A, 4A). TaPHT1.3/1.4 and TaPHT1.6 were expressed in both roots and shoots, and TaPHT1.6 exhibited stronger expression than TaPHT1.3/1.4 in both experiments (Figures 3B, 4B). These three genes differed in the response to P supply. Compared to high P treatment, low P treatment upregulated TaPHT1.3/1.4 in roots and TaPHT1.6 in shoots in the hydroponic culture (Figure 3B), and upregulated TaPHT1.3/1.4 in roots and shoots and TaPHT1.6 in shoots in the field experiment (Figure 4B). TaPHT1.5, 1.7 and 1.8 were presented at very low expression levels in both roots and shoots in both of the experiments (Figures 3C, 4C). Upregulation by low P treatment was observed for TaPHT1.7 in shoots in the hydroponic culture (Figure 3C), TaPHT1.7 in roots and TaPHT1.8 in roots and shoots in the field experiment (Figure 4C).
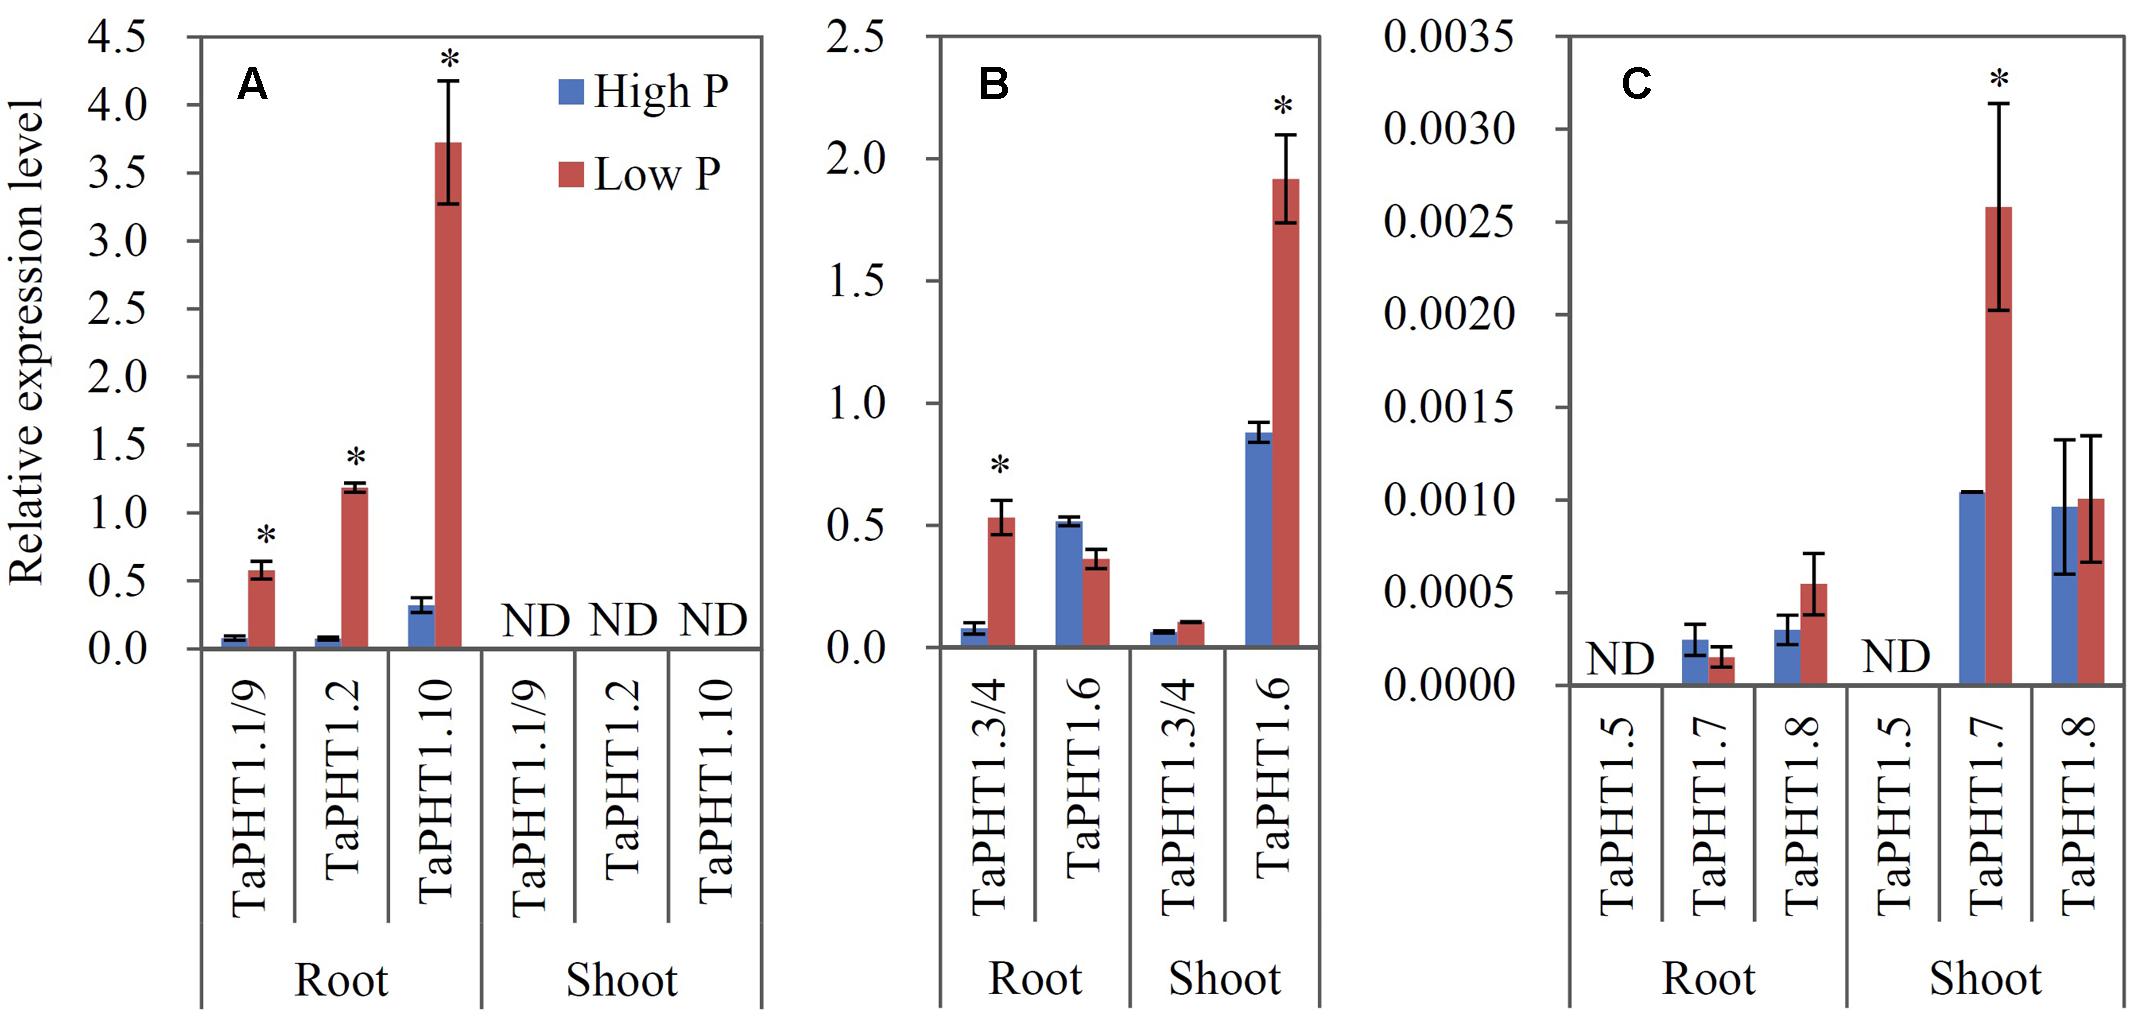
FIGURE 3. Relative expression levels of TaPHT1 genes in the roots and shoots of Xiaoyan 54 grown in high P and low P nutrient solutions in the hydroponic culture experiment at the seedling stage. The seeds of Xiaoyan 54 were germinated at 25°C for 5 days, then transferred a nutrient solution containing 200 μM Pi (high P) or 5 μM Pi (low P). The plants were grown at 20°C for 3 weeks, and the roots and shoots were collected separately for gene expression analysis. The gene expression levels were normalized to the internal control of TaActin. (A) Relative expression levels of TaPHT1.1/1.9, 1.2, and 1.10; (B) Relative expression levels of TaPHT1.3/1.4, and 1.6; (C) Relative expression levels of TaPHT1.5, 1.7, and 1.8. Data are mean ± SE of three biological replications. ∗ indicates significant differences between different P application rates (P < 0.05). ND, not detectable.
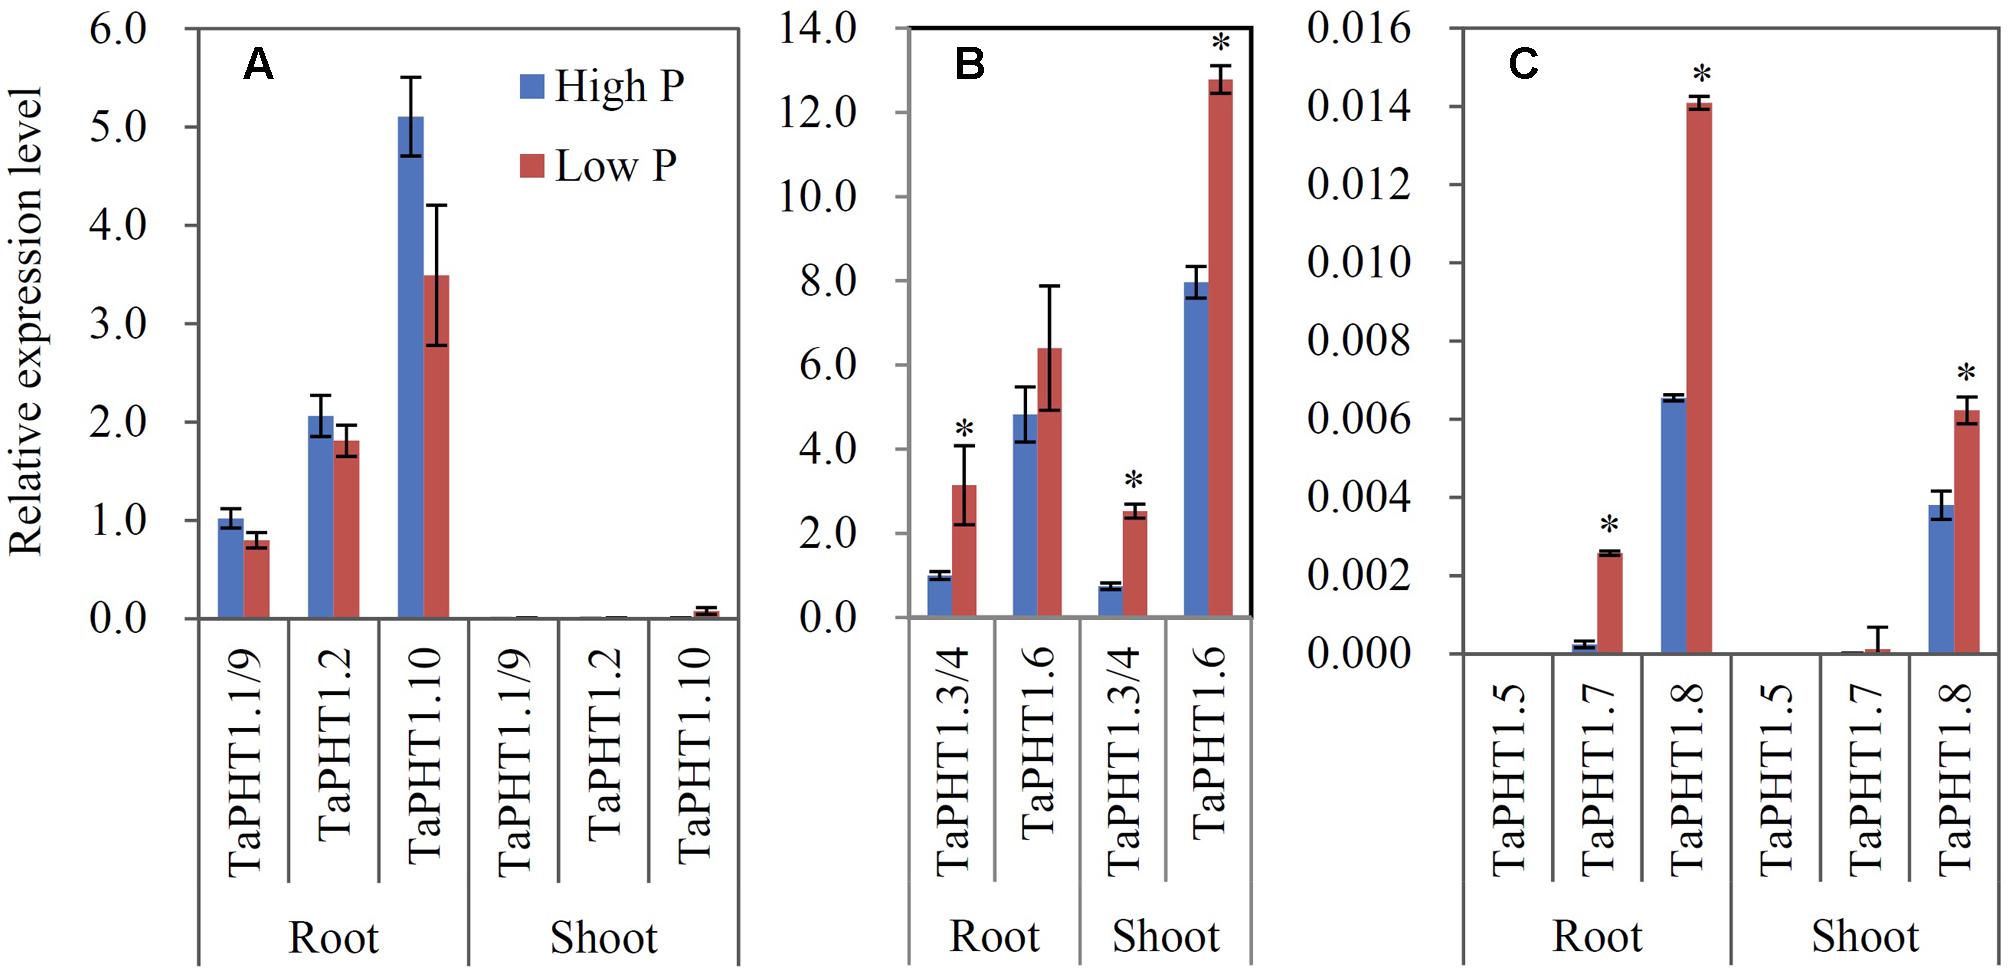
FIGURE 4. Relative expression levels of TaPHT1 genes in the roots and shoots of Xiaoyan 54 plants grown in the high P and low P soils in the field experiment in Beijing at the re-greening stage. (A) Relative expression levels of TaPHT1.1/1.9, 1.2, and 1.10; (B) Relative expression levels of TaPHT1.3/1.4, and 1.6; (C) Relative expression levels of TaPHT1.5, 1.7, and 1.8. The gene expression levels were normalized to the internal control of TaActin. Data are mean ± SE of three biological replications. ∗ indicates significant differences between different P application rates (P < 0.05).
Since TaPHT1.6 had the most abundant transcripts in shoots among the investigated TaPHT1 genes, we further analyzed the expression of TaPHT1.6 in different aerial parts at the flowering and grain filling stages (14 days after flowering) in the field experiment. The expression of TaPHT1.6 was much higher in leaves than in stems, spikes, and grains, and was higher in aging leaves than in flag leaves (Supplementary Figure S5). Significant upregulation by low P treatment was observed in aging leaves, stems, spikes, and grains (Supplementary Figure S5).
Relationship of TaPHT1s Expression with P Uptake
We measured P uptake of two commercial wheat varieties at stem elongation, flowering, and maturity stages in two consecutive field experiments (2010 experiment and 2011 experiment). Data were collected at the P application rates of 0 kg P ha-1 (P0), 100 kg P ha-1 (P100), and 400 kg P ha-1 (P400). In most cases, the wheat variety KN9204 had higher total P concentration in shoots at stem elongation and flowering and in straws and grains at maturity than the wheat variety SJZ8, except for that of stem elongation in the 2011 experiment (Table 1). Comparison of aerial P accumulation between these two varieties showed that KN9204 absorbed more P than SJZ8 after stem elongation at all the P application rates in both of the field experiments (Figure 5).
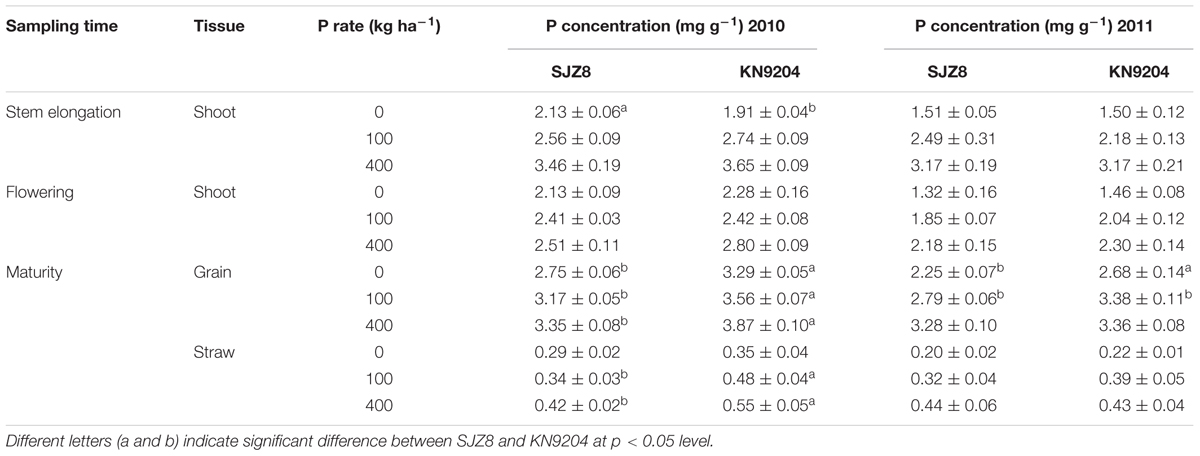
TABLE 1. Total P concentrations in aerial parts in wheat plants in the 2010 and 2011 field experiments.
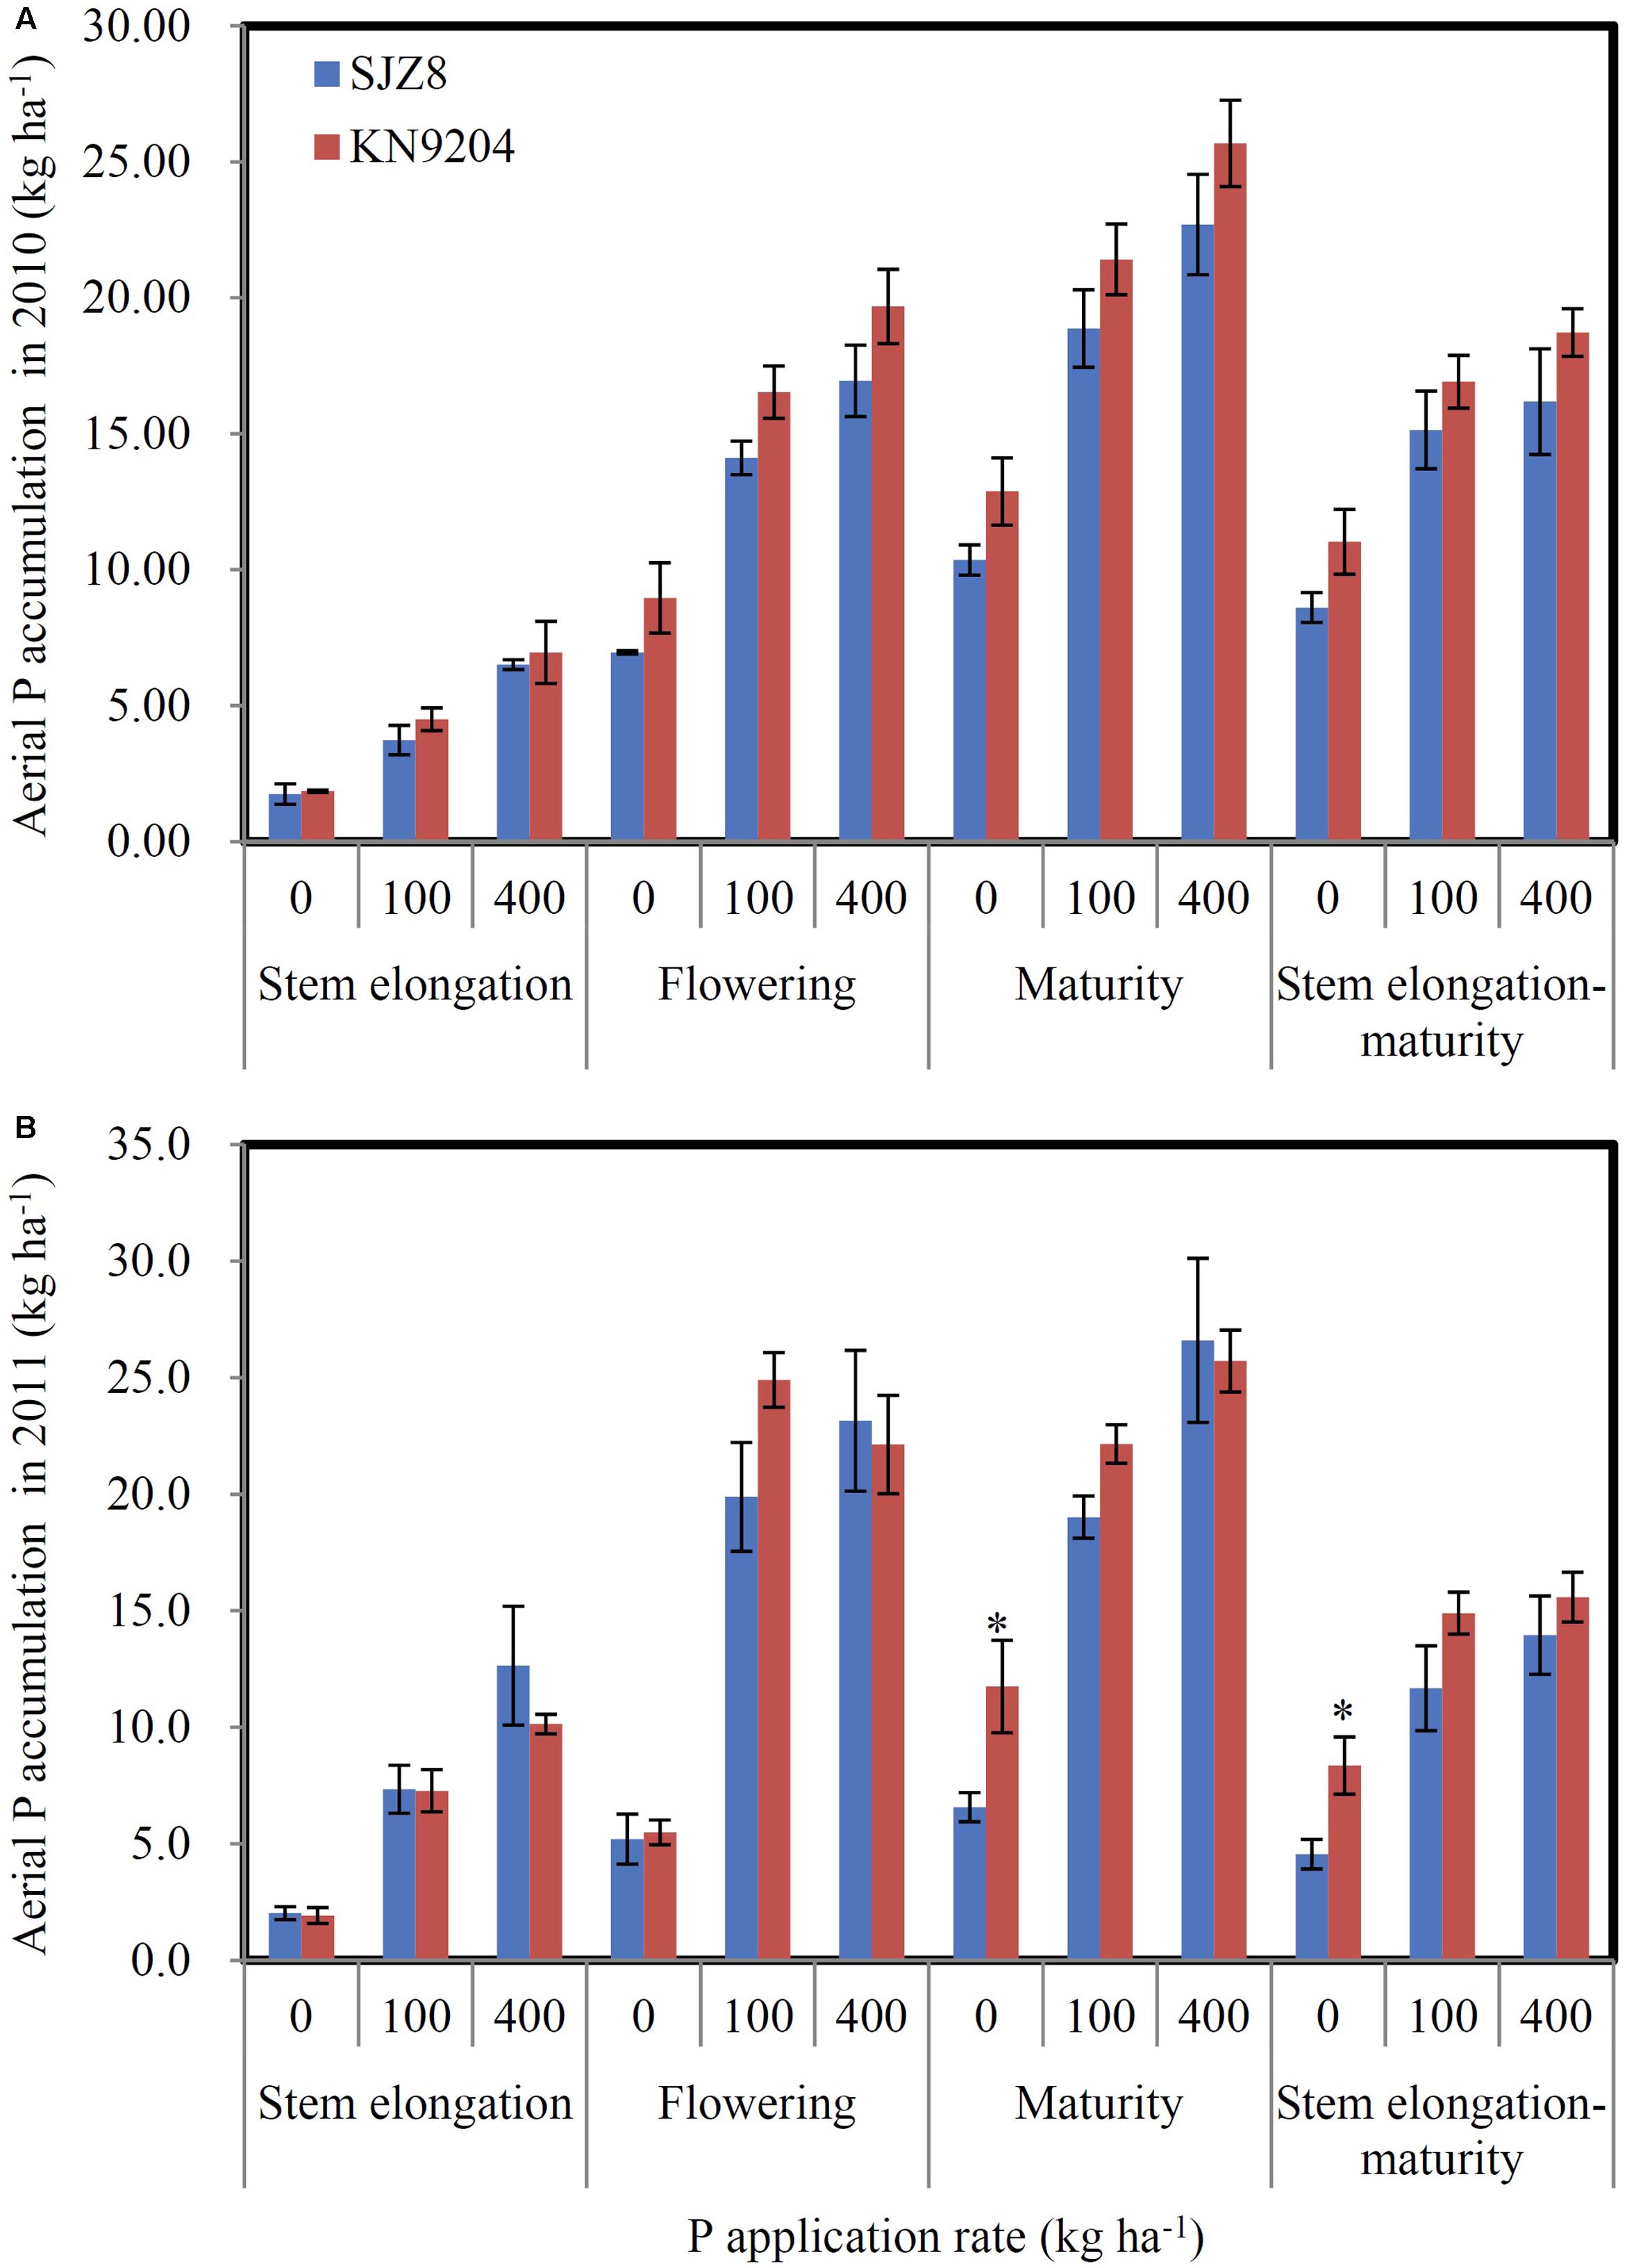
FIGURE 5. P uptake of KN9204 and SJZ8 under different P application rates in the 2010 and 2011 field experiments in Quzhou. (A,B) Aerial P accumulation in the 2010 (A) and 2011 (B) field experiments. 0, 100, and 400 indicate P application rate in kg P ha-1. Data are mean ± SE of four replicates. ∗ indicates significant differences between the two wheat varieties (P < 0.05).
As the differences in P uptake between KN9204 and SJZ8 were mainly observed at flowering and maturity, we analyzed the TaPHT1s expression at the flowering stage in the 2011 field experiment. The higher expression of TaIPS1.1 at P0 than at P100 and P400 indicated that the wheat plants grown under P0 conditions were P-starved (Supplementary Figure S4D). TaPHT1.1/1.9, 1.2, and 1.10 were expressed more abundantly in the roots of KN9204 than in those of SJZ8 at all the three P rates (Figures 6A–C), whereas SJZ8 had higher expression of TaPHT1.8 in roots at P100 and P400 (Figure 6D) and higher expression of TaPHT1.6 in roots at P0 and P100 (Figure 6E) and in shoots at P0 than KN9204 (Figure 6F). The paired t-test showed that the mean values across the three P application rates for P uptake after stem elongation in 2010 and 2011 field experiments and the expression of TaPHT1.1/1.9 and 1.10 at flowering in 2011 field experiment were significantly higher in KN9204 than in SJZ8 (Supplementary Table S4). We further analyzed the correlations between gene expression at flowering and P uptake after stem elongation (difference between stem elongation and maturity). P uptake after stem elongation showed a positive correlation with the expression of TaPHT1.1/1.9 (Figure 7A), TaPHT1.2 (Figure 7B), and TaPHT1.10 in roots (Figure 7C), but a negative correlation with the expression of TaPHT1.8 in roots (Figure 6D) and TaPHT1.6 in roots and shoots (Figures 6E,F).
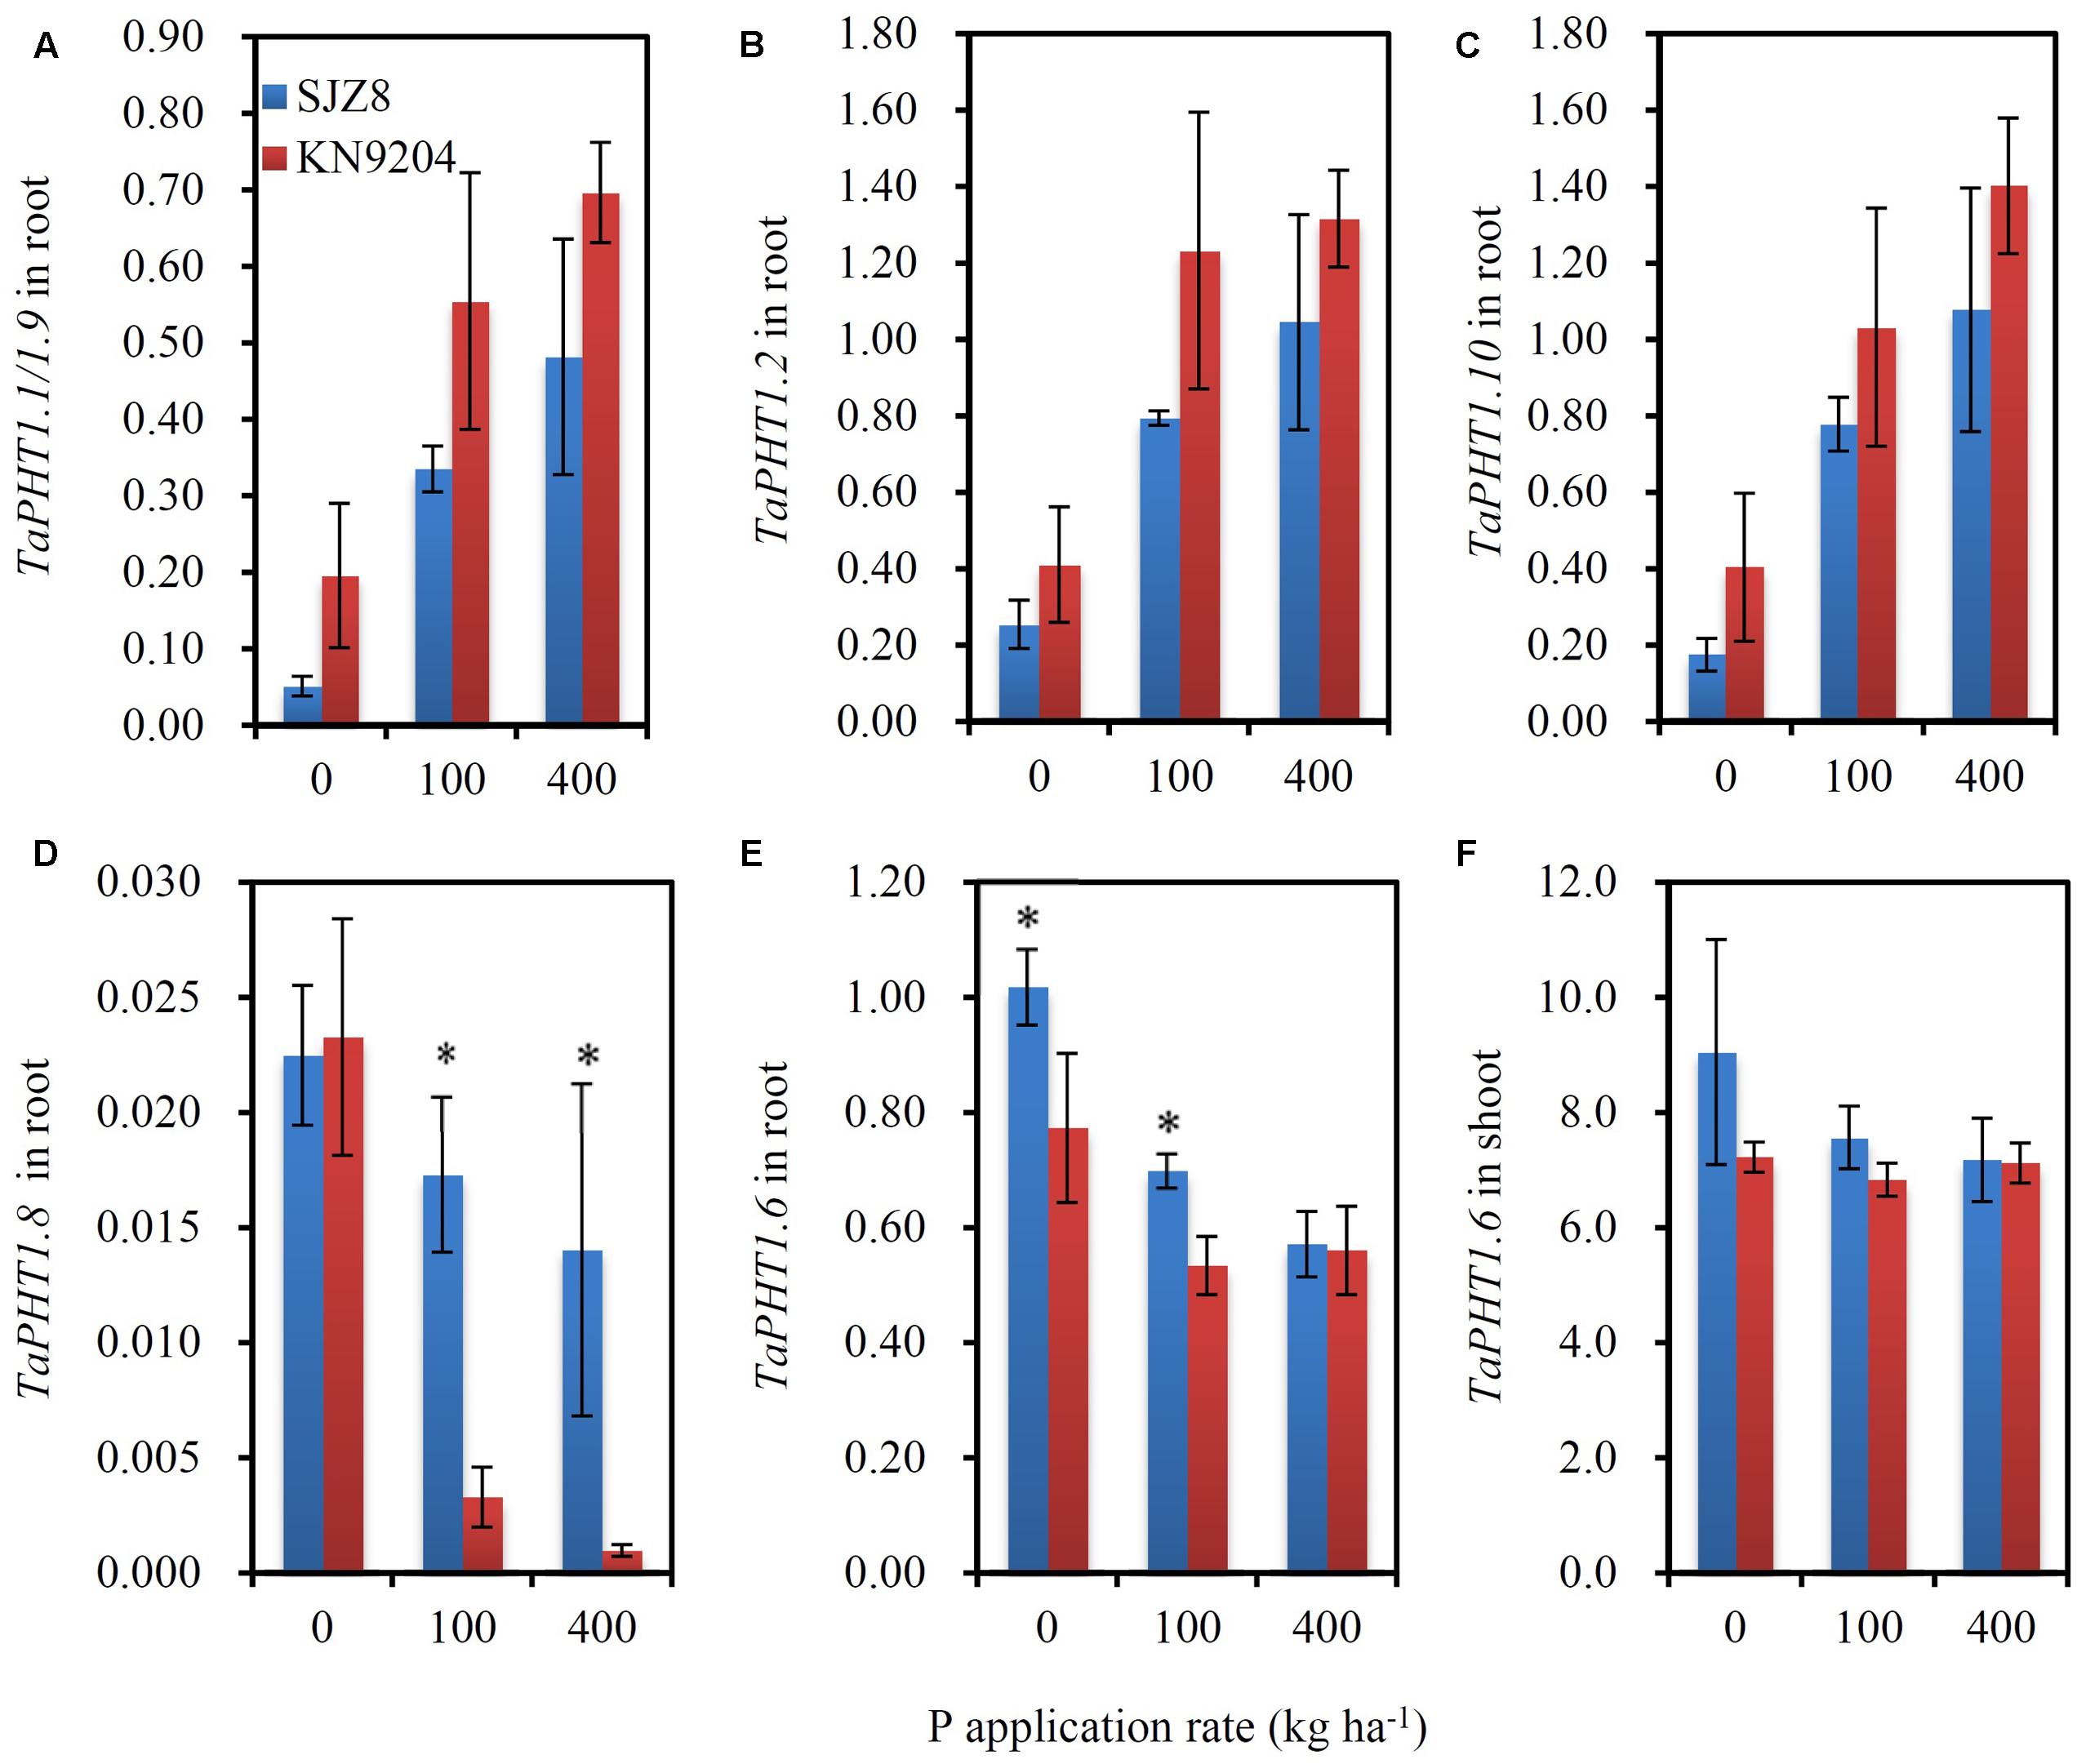
FIGURE 6. The relative expression levels of PHT1 genes in KN9204 and SJZ8 at the flowering stage under different P application rates in the 2011 field experiment in Quzhou. (A–D) Relative expression levels of TaPHT1.1/1.9 (A), TaPHT1.2 (B), TaPHT1.10 (C), and TaPHT1.8 (D) in roots; (E,F) Relative expression levels of TaPHT1.6 in roots (E) and shoots (F). The gene expression levels were normalized to the internal control of TaActin. Data are mean ± SE of four replicates. ∗ indicates significant differences between the two wheat varieties (P < 0.05).
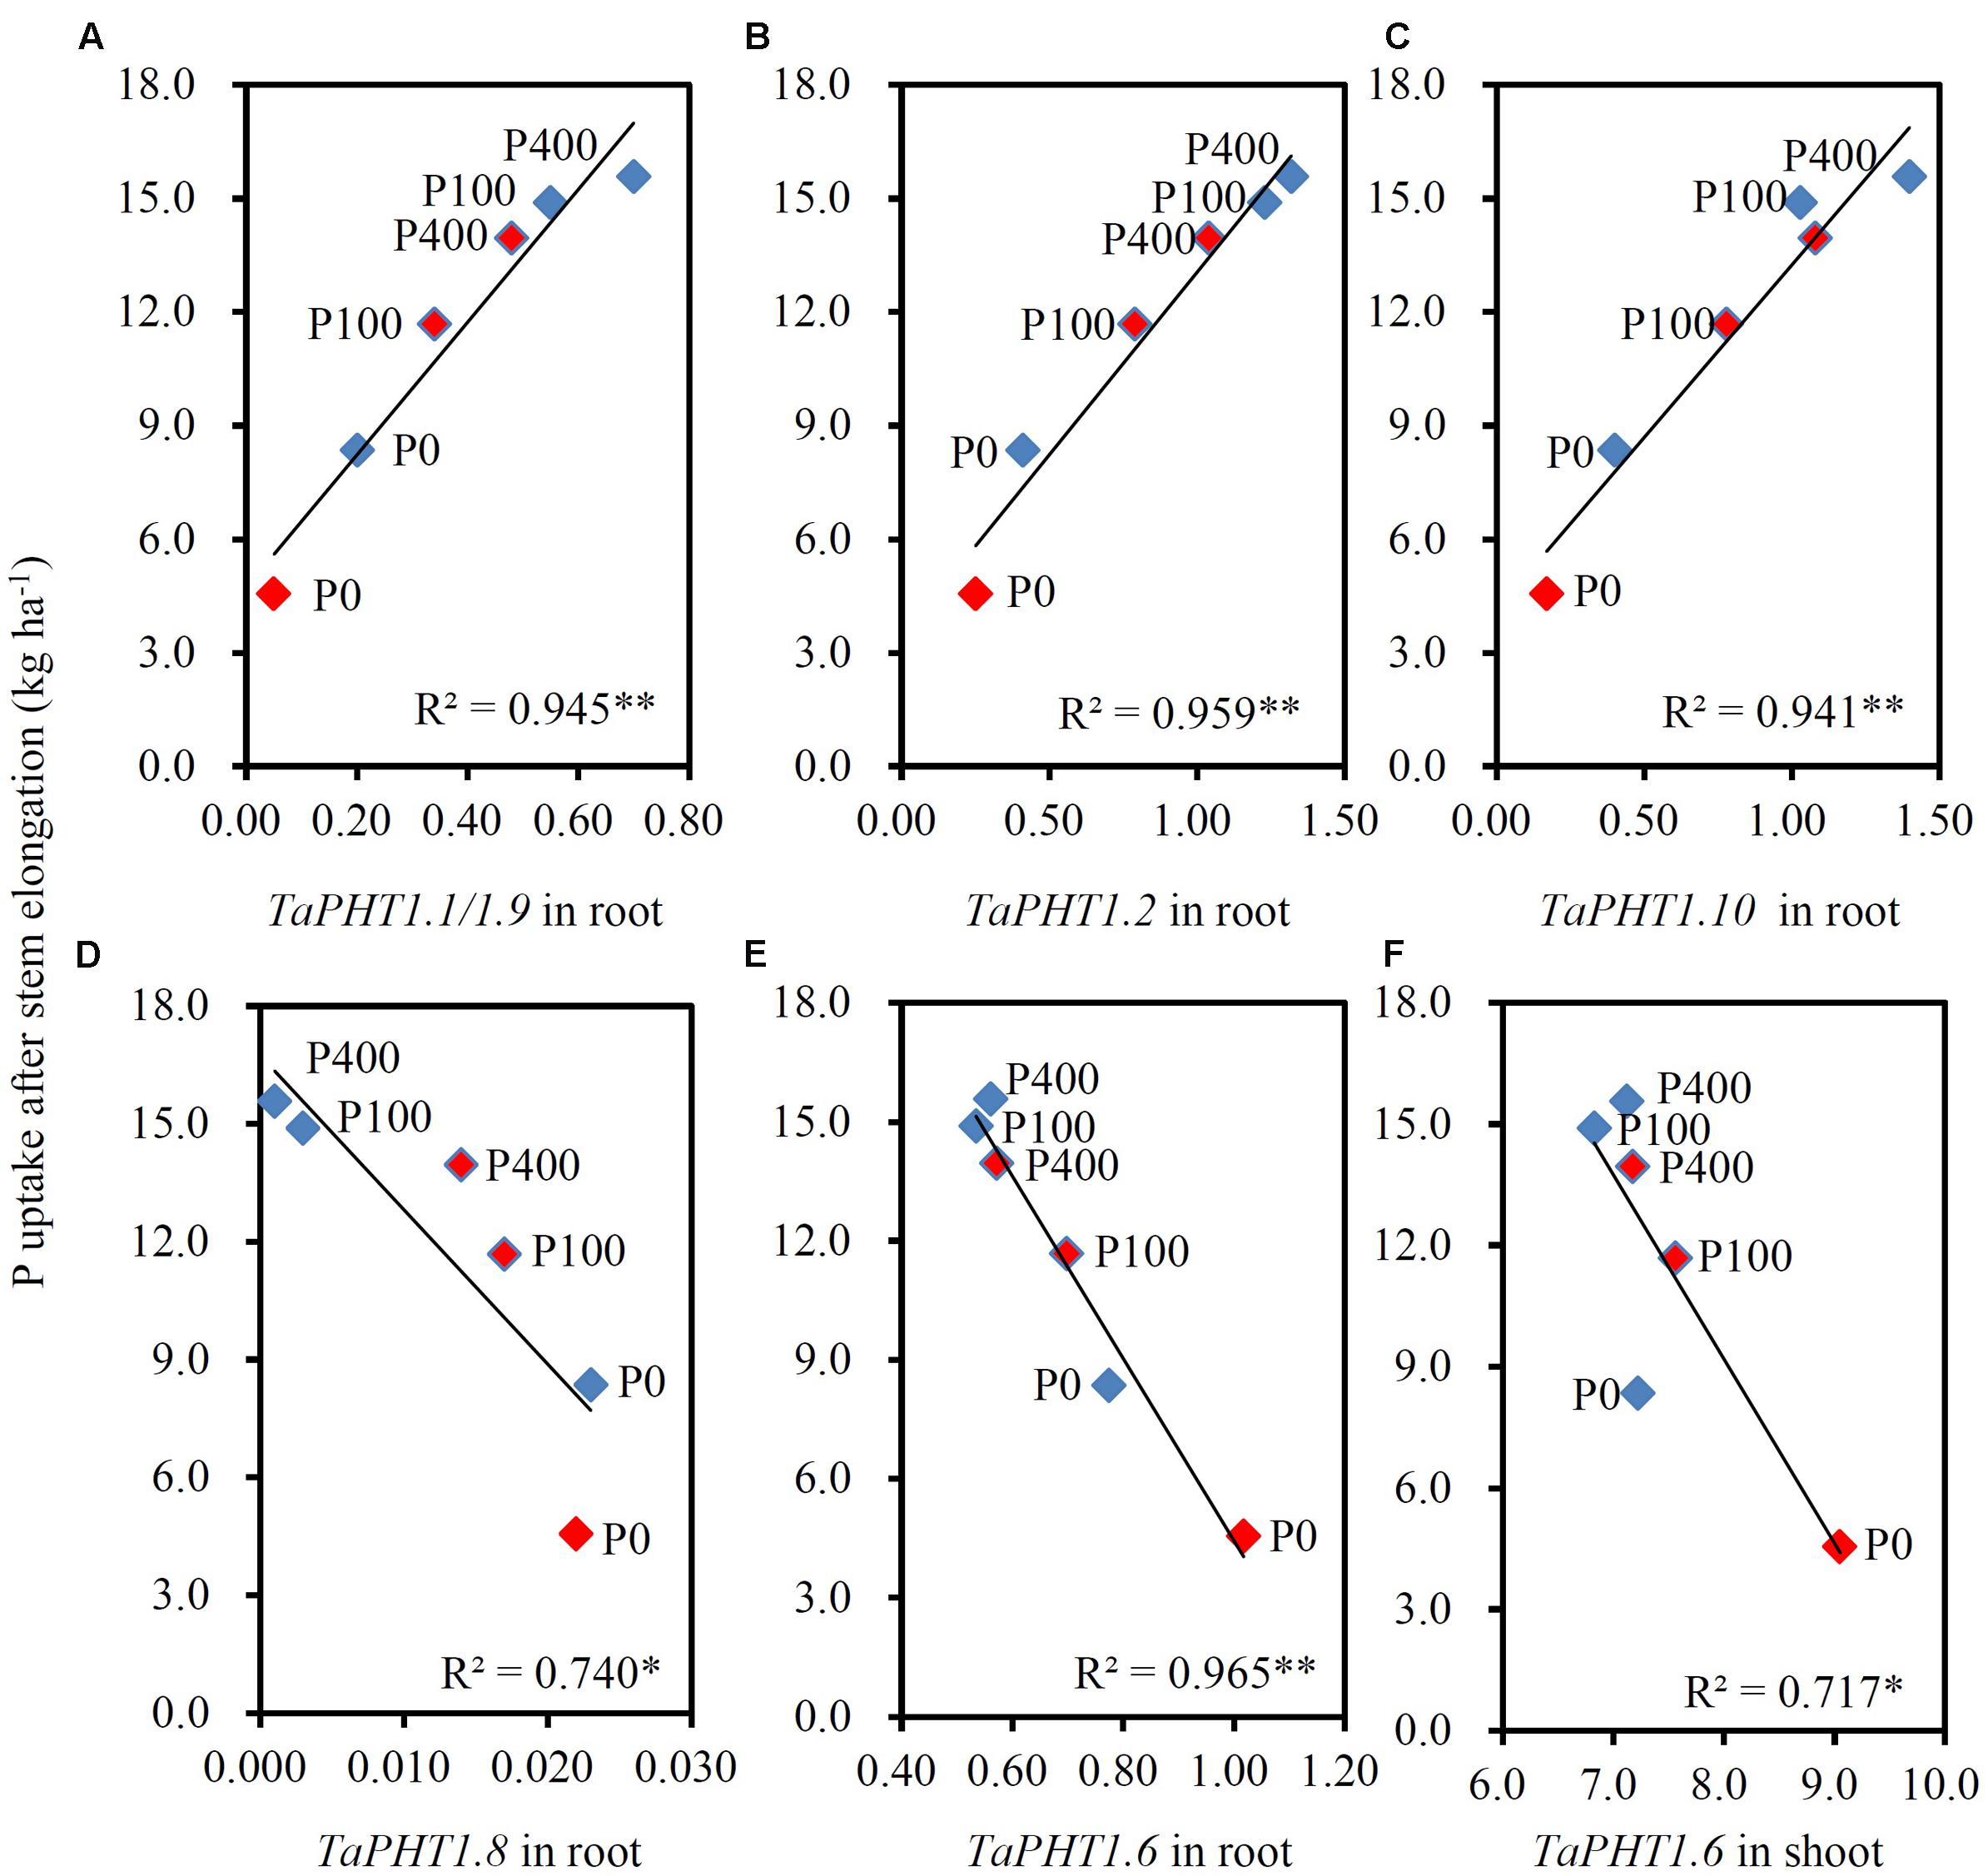
FIGURE 7. Correlations between P uptake after stem elongation and the relative expression level of TaPHT1 genes at flowering stage in the 2011 field experiment in Quzhou. (A–D) Correlation of P uptake after stem elongation with relative expression levels of TaPHT1.1/1.9 (A), TaPHT1.2 (B), TaPHT1.10 (C), and TaPHT1.8 (D) in roots; (E,F) Correlation of P uptake after stem elongation with relative expression levels of TaPHT1.6 in roots (E) and shoots (F). Blue and red diamonds indicate KN9204 and SJZ8, respectively. The data are the mean of four replicates. The data from KN9204 and SJZ8 are indicated by blue and pink color, respectively. P0, P100, and P400 indicate P application rates of 0, 100, and 400 kg P ha-1, respectively. ∗ and ∗∗ indicate the significance of R2 at P < 0.05 and P < 0.01, respectively.
Discussion
We identified a total of 36 TaPHT1 genes named from TaPHT1.1 to TaPHT1.14 in wheat. Of the 32 PHT1 genes with chromosome location information, 12, 11, and 9 were from the A, B, and D genomes (Supplementary Table S3), respectively. In order to evaluate the PHT1 number in wheat, we also identified 13 PHT1 genes in Triticum urartu and 14 PHT1 genes in Aegilops tauschii, and these PHT1 genes were named from PHT1.1 to PHT1.16 (Supplementary Table S3). We did not find the wheat Gene IDs which are orthologous to PHT1.15 and PHT1.16 of Triticum urartu and Aegilops tauschii (Figure 1), but several scaffolds from the short arms of group 2 chromosomes in wheat contained PHT1.15 and PHT1.6 like fragments which were not annotated yet. Although we identified a PHT1.14 gene (TaPHT1.14-U) in wheat, there were three closely related PHT1.14 genes (AEGtaPHT1.14-1, 1.14-2, and 1.14-3) in Aegilops tauschii (Figure 1). Further detailed analysis of the Chinese spring genome sequence found that the forward orientation of seven fragments showed high similarity with TaPHT1.14-U in the scaffold TGACv1_scaffold_642582_U (Supplementary Figure S6). The second, fourth, fifth, and sixth fragments showed similarity only with the 3′-end of TaPHT1.14-U (Supplementary Figure S6). However, the first fragment showed 96–98% identity with 1–1604 bp of the 1656 bp coding region in TaPHT1.14-U (the third fragment 3, Supplementary Figure S6), whereas the seventh fragment located in the last 550 bp of the scaffold showed 99% identity with 1–550 bp of the coding region in TaPHT1.14-U (Supplementary Figure S6). As such, TGACv1_scaffold_642582_U may contain three closely related PHT1.14 genes. Taking the information together, there may have as many as 16 (if with one PHT1.14 gene)-18 (if with three PHT1.14 genes) PHT1 genes in each of the three subgenomes in wheat.
The cloned 10 TaPHT1 promoters contained the putative Pi-starvation response regulator PHR1 binding cis-element P1BS and the WRKY transcription factor binding element W-Box (Supplementary Figure S2), indicating that TaPHT1s may be regulated by PHR1 and WRKY transcription regulatory factors. In fact, our previous study has documented that TaPHR1 can form homodimers to activate TaPHT1.10-U expression in vitro (Wang et al., 2013). It has been reported that PHR1 regulates Pi starvation-inducible genes by binding as a dimer to the cis-element P1BS in the promoter region of its downstream gene (Rubio et al., 2001) and the majority of Pi starvation-inducible genes contain the P1BS element (Muller et al., 2007; Nilsson et al., 2010). As such, the P1BS elements in the promoters might contribute to the observed upregulation of TaPHT1 genes by low P treatment (Figure 3). Several WRKY transcription factors have been found to bind to the W-box to regulate the expression of Pi-starvation response genes in Arabidopsis (Devaiah et al., 2007; Chen et al., 2009; Wang et al., 2014). Whether WRKY transcription factors involved in regulating the response of TaPHT1 genes to P-deficiency is needed to be studied in the future.
The seven tested TaPHT1 genes showed Pi-transport activity in yeast cells grown under low Pi and high Pi conditions (Figure 2). The genes from the same branch of the phylogenetic tree shared similar tissue-specific expression and response to P-deficiency (Figures 3, 4). The expression of TaPHT1.1/1.2/1.9/1.10 in Branch V was root-specific and upregulated by low P treatment in the hydroponic culture (Figure 3A), but their upregulations by low P treatment was abolished in the field experiments (Figures 4A, 6A–C). These abolished upregulations by low P treatment were possible due to the increased AM colonization in roots under P deficiency (Teng et al., 2013), as AM colonization has been found to inhibit the response of HvPHT1.1 and HvPHT1.2 to P-deficiency in roots of barley (Glassop et al., 2005). In Branch V, HvPHT1.1 has been found to encode high-affinity transporters of Pi (Preuss et al., 2011). Taking information together, TaPHT1 transporters in Branch V may function as high-affinity Pi transporters mediating Pi acquisition from soils. TaPHT1.6 in Branch III and TaPHT1.3/1.4 in Branch IV were expressed in both roots and shoots and were upregulated by low P treatment in the hydroponic culture and in the field experiment (Figures 3B, 4B). In aerial parts, TaPHT1.6 was expressed in stems, leaves, spikes, and grains (Supplementary Figure S5). HvPHT1.6 in Branch III was expressed in both roots and shoots (Rae et al., 2003). OsPHT1.8 in Branch IV was expressed in various tissue organs from roots to seeds and plays an important role in Pi homeostasis and P redistribution from source to sink organs (Jia et al., 2011; Li et al., 2015). These results indicate that PHT1s in Branches III and IV may mediate Pi remobilization in whole plant. However, they may have diverse affinities for Pi, as OsPHT1.8 has been shown high-affinity for Pi (Jia et al., 2011), and HvPHT1.6 low-affinity for Pi (Rae et al., 2003). TaPHT1.5 in Branch IV and TaPHT1.7 in Branch III were expressed at very low levels in both of the hydroponic culture and field experiment (Figures 3C, 4C). The reported AM fungi inducible PHT1s were grouped into Branch VI (Figure 1), including TaPHT1.8 and TaPHT1.11 from wheat, HvPHT1.8 and HvPHT1.11 from barley, ZmPHT1.6 from maize (Glassop et al., 2005; Sisaphaithong et al., 2012), and OsPHT1.11 from rice (Paszkowski et al., 2002). Here, we found that TaPHT1.8 was upregulated by low P treatment in the field experiments (Figures 4C, 6D), but not by low P treatment in the hydroponic culture (Figure 3C). Since we observed that low P treatment increased AM colonization rate in roots of KN9204 compared to high P treatment in field experiments (Teng et al., 2013), the upregulation of TaPHT1.8 by low P treatment in the field experiments might reflect the fact that TaPHT1.8 was exclusively induced by AM fungi (Glassop et al., 2005).
Previous studies state that transgenic modifying expression of PHT1 genes altered P uptake and re-distribution in wheat (Liu et al., 2013) and rice (Ai et al., 2009; Jia et al., 2011; Yan et al., 2014). The transcript abundance of PHT1 genes has been shown to relate with P uptake in wheat (Aziz et al., 2014) and P utilization efficiency in barley (Huang et al., 2011) under controlled conditions. These results indicate that mRNA levels of PHT1 genes affect the capacities of P uptake and remobilization. Our current on-farm field-scale study showed that the expression of TaPHT1.1/1.2/1.9/1.10 correlated with the differences in P uptake between different wheat varieties. The positive correlations between P uptake after stem elongation and the expression levels of TaPHT1.1/1.2/1.9/1.10 at the flowering stage (Figures 7A–C) might result from two factors: P supply level and wheat variety. Firstly, both P uptake and expression of these TaPHT1 genes increased with P application rate (Figures 5, 6A–C). Secondly, KN9204 had higher P uptake after stem elongation and the relative expression levels of TaPHT1.1/1.2/1.9/1.10 at the flowering stage than SJZ8 at a given P application rate (Figures 5, 6A–C). In contrast to the positive correlations between the expression of TaPHT1.1/1.2/1.9/1.10 and P uptake after stem elongation, the expression of TaPHT1.8 and TaPHT1.6 negatively correlated with P uptake after stem elongation (Figures 7D–F). The negative correlation between TaPHT1.8 expression and P uptake after stem elongation resulted from the decreased TaPHT1.8 expression with P application rate and lower TaPHT1.8 expression in roots of KN9204 compared to that of SJZ8 at P100 and P400 (Figure 7D). However, this negative correlation did not support that AM colonization inhibited P uptake, as we did not analyze the expression of TaPHT1.11 yet. It has been reported that TaPHT1.11-A1, -B1, and -D1 were AM-inducible and were expressed at much higher level than TaPHT1.8 (Sisaphaithong et al., 2012). The negative correlation between TaPHT1.6 expression and P uptake after stem elongation mainly resulted from the decreased TaPHT1.6 expression with P application rate (Figures 7E,F), as KN9204 and SJZ8 had similar expression levels of TaPHT1.6 in roots at P400, and in shoots at P0, P100 and P400 (Figures 6E,F). Although TaPHT1.6 may mediate P redistribution, the similar expression levels of TaPHT1.6 in shoots at flowering did not explain the differences in grain P concentration between these two varieties (Table 1). This was possibly because that the transport of P to grains occurs during grain filling. As such, further research is needed to investigate the expression of TaPHT1 genes including TaPHT1.6 during grain filling, the research may identify the TaPHT1 genes which contribute to the differences in grain P concentration between different wheat varieties.
In summary, the hexaploid wheat has many more PHT1 genes than the diploid cereal crops such as barley and rice. Although we performed genome-wide analysis of PHT1 genes, we did not isolate all the PHT1 genes in wheat. The on-going wheat genome sequencing project will help us to understand the complexity of the Pi transport system in wheat. Although there were a large number of PHT1 genes in wheat, the TaPHT1 transporters from a given branch of the phylogenetic tree shared high similarities in sequences, expression locations, and responses to P-availability, this finding will help us to predict the roles of TaPHT1 genes in mediating Pi uptake and re-distribution. Our research also provided useful cues to understand the influences of PHT1 genes on the genotypic differences in P uptake. Further studies on mechanisms underlying the genotypic differences in PHT1 expression will facilitate the breeding of wheat varieties with improve P use efficiency.
Author Contributions
Y-PT, WT, and Y-YZ designed this study; Y-YZ screened BAC clones, WT and Y-YZ analyzed PHT1 sequences; Y-YZ and WT assayed expression and function of PHT1 genes; all authors carried out the field experiments; WT and Y-YZ wrote the manuscript under the supervision of Y-PT. All authors have read and approved this manuscript.
Funding
This research was supported by the National Key Research and Development Program of China from Ministry of Science and Technology of China (2016YFD0100706) and the National Transgenic Key Project from the Ministry of Agriculture of China (2016ZX08002-005).
Conflict of Interest Statement
The authors declare that the research was conducted in the absence of any commercial or financial relationships that could be construed as a potential conflict of interest.
Acknowledgment
The yeast mutant MB192 and vector p112A1NE were kindly provided by Prof. Shubin Sun from Nanjing Agricultural University, Nanjing, China.
Supplementary Material
The Supplementary Material for this article can be found online at: http://journal.frontiersin.org/article/10.3389/fpls.2017.00543/full#supplementary-material
Footnotes
References
Ai, P. H., Sun, S. B., Zhao, J. N., Fan, X. R., Xin, W. J., Guo, Q., et al. (2009). Two rice phosphate transporters, OsPht1;2 and OsPht1;6, have different functions and kinetic properties in uptake and translocation. Plant J. 57, 798–809. doi: 10.1111/j.1365-313X.2008.03726.x
Aziz, T., Finnegan, P. M., Lambers, H., and Jost, R. (2014). Organ-specific phosphorus-allocation patterns and transcript profiles linked to phosphorus efficiency in two contrasting wheat genotypes. Plant Cell Environ. 37, 943–960. doi: 10.1111/pce.12210
Bieleski, R. L. (1973). Phosphate pools, phosphate transport, and phosphate availability. Annu. Rev. Plant Phys. 24, 225–252. doi: 10.1146/annurev.pp.24.060173.001301
Bun-Ya, M., Nishimura, M., Harashima, S., and Oshima, Y. (1991). The PHO84 gene of Saccharomyces cerevisiae encodes an inorganic phosphate transporter. Mol. Cell. Biol. 11, 3229–3238. doi: 10.1128/MCB.11.6.3229
Catarecha, P., Segura, M. D., Franco-Zorrilla, J. M., Garcia-Ponce, B., Lanza, M., Solano, R., et al. (2007). A mutant of the Arabidopsis phosphate transporter PHT1;1 displays enhanced arsenic accumulation. Plant Cell 19, 1123–1133. doi: 10.1105/tpc.106.041871
Chen, Y. F., Li, L. Q., Xu, Q., Kong, Y. H., Wang, H., and Wu, W. H. (2009). The WRKY6 transcription factor modulates PHOSPHATE1 expression in response to low Pi stress in Arabidopsis. Plant Cell 21, 3554–3566. doi: 10.1105/tpc.108.064980
Davies, T. G. E., Ying, J., Xu, Q., Li, Z. S., Li, J., and Gordon-Weeks, R. (2002). Expression analysis of putative high-affinity phosphate transporters in Chinese winter wheats. Plant Cell Environ. 25, 1325–1339. doi: 10.1046/j.1365-3040.2002.00913.x
Devaiah, B. N., Karthikeyan, A. S., and Raghothama, K. G. (2007). WRKY75 transcription factor is a modulator of phosphate acquisition and root development in arabidopsis. Plant Physiol. 143, 1789–1801. doi: 10.1104/pp.106.093971
Dong, L. L., Zhang, X. F., Liu, D. C., Fan, H. J., Sun, J. Z., Zhang, Z. J., et al. (2010). New insights into the organization, recombination, expression and functional mechanism of low molecular weight glutenin subunit genes in bread wheat. PLoS ONE 5:e13548. doi: 10.1371/journal.pone.0013548
Glassop, D., Smith, S. E., and Smith, F. W. (2005). Cereal phosphate transporters associated with the mycorrhizal pathway of phosphate uptake into roots. Planta 222, 688–698. doi: 10.1007/s00425-005-0015-0
Guo, C. J., Guo, L., Li, X. J., Gu, J. T., Zhao, M., Duan, W. W., et al. (2014). TaPT2, a high-affinity phosphate transporter gene in wheat (Triticum aestivum L.), is crucial in plant Pi uptake under phosphorus deprivation. Acta Physiol. Plant 36, 1373–1384. doi: 10.1007/s11738-014-1516-x
Huang, C. Y., Roessner, U., Eickmeier, I., Genc, Y., Callahan, D. L., Shirley, N., et al. (2008). Metabolite profiling reveals distinct changes in carbon and nitrogen metabolism in phosphate-deficient barley plants (Hordeum vulgare L.). Plant Cell Physiol. 49, 691–703. doi: 10.1093/pcp/pcn044
Huang, C. Y., Shirley, N., Genc, Y., Shi, B., and Langridge, P. (2011). Phosphate utilization efficiency correlates with expression of low-affinity phosphate transporters and noncoding RNA, IPS1, in barley. Plant Physiol. 156, 1217–1229. doi: 10.1104/pp.111.178459
Jia, H., Ren, H., Gu, M., Zhao, J., Sun, S., Zhang, X., et al. (2011). The phosphate transporter gene OsPht1;8 is involved in phosphate homeostasis in rice. Plant Physiol. 156, 1164–1175. doi: 10.1104/pp.111.175240
Lapis-Gaza, H. R., Jost, R., and Finnegan, P. M. (2014). Arabidopsis PHOSPHATE TRANSPORTER1 genes PHT1;8 and PHT1;9 are involved in root-to-shoot translocation of orthophosphate. BMC Plant Biol. 14:334. doi: 10.1186/s12870-014-0334-z
Li, Y. T., Zhang, J., Zhang, X., Fan, H. M., Gu, M., Qu, H. Y., et al. (2015). Phosphate transporter OsPht1;8 in rice plays an important role in phosphorus redistribution from source to sink organs and allocation between embryo and endosperm of seeds. Plant Sci. 230, 23–32. doi: 10.1016/j.plantsci.2014.10.001
Liu, X. M., Zhao, X. L., Zhang, L. J., Lu, W. J., Li, X. J., and Xiao, K. (2013). TaPht1;4, a high-affinity phosphate transporter gene in wheat (Triticum aestivum), plays an important role in plant phosphate acquisition under phosphorus deprivation. Funct. Plant Biol. 40, 329–341. doi: 10.1071/FP12242
Lopez-Arredondo, D. L., Leyva-Gonzalez, M. A., Gonzalez-Morales, S. I., Lopez-Bucio, J., and Herrera-Estrella, L. (2014). Phosphate nutrition: improving low-phosphate tolerance in crops. Annu. Rev. Plant Biol. 65, 95–123. doi: 10.1146/annurev-arplant-050213-035949
Misson, J., Thibaud, M. C., Bechtold, N., Raghothama, K., and Nussaume, L. (2004). Transcriptional regulation and functional properties of Arabidopsis Pht1;4, a high affinity transporter contributing greatly to phosphate uptake in phosphate deprived plants. Plant Mol. Biol. 55, 727–741. doi: 10.1007/s11103-004-1965-5
Muchhal, U. S., Pardo, J. M., and Raghothama, K. G. (1996). Phosphate transporters from the higher plant Arabidopsis thaliana. Proc. Natl. Acad. Sci. U.S.A. 93, 10519–10523. doi: 10.1073/pnas.93.19.10519
Mudge, S. R., Rae, A. L., Diatloff, E., and Smith, F. W. (2002). Expression analysis suggests novel roles for members of the Pht1 family of phosphate transporters in Arabidopsis. Plant J. 31, 341–353. doi: 10.1046/j.1365-313X.2002.01356.x
Muller, R., Morant, M., Jarmer, H., Nilsson, L., and Nielsen, T. H. (2007). Genome-wide analysis of the Arabidopsis leaf transcriptome reveals interaction of phosphate and sugar metabolism. Plant Physiol. 143, 156–171. doi: 10.1104/pp.106.090167
Murphy, J., and Riley, J. P. (1962). A modified single solution method for the determination of phosphate in natural waters. Anal. Chim. Acta 27, 31–36. doi: 10.1016/S0003-2670(00)88444-5
Nilsson, L., Muller, R., and Nielsen, T. H. (2010). Dissecting the plant transcriptome and the regulatory responses to phosphate deprivation. Physiol. Plant. 139, 129–143. doi: 10.1111/j.1399-3054.2010.01356.x
Nussaume, L., Kanno, S., Javot, H., Marin, E., Pochon, N., Ayadi, A., et al. (2011). Phosphate import in plants: focus on the PHT1 transporters. Front. Plant Sci. 2:83. doi: 10.3389/fpls.2011.00083
Paszkowski, U., Kroken, S., Roux, C., and Briggs, S. P. (2002). Rice phosphate transporters include an evolutionarily divergent gene specifically activated in arbuscular mycorrhizal symbiosis. Proc. Natl. Acad. Sci. U.S.A. 99, 13324–13329. doi: 10.1073/pnas.202474599
Preuss, C. P., Huang, C. Y., Gilliham, M., and Tyerman, S. D. (2010). Channel-like characteristics of the low-affinity barley phosphate transporter PHT1;6 when expressed in Xenopus oocytes. Plant Physiol. 152, 1431–1441. doi: 10.1104/pp.109.152009
Preuss, C. P., Huang, C. Y., and Tyerman, S. D. (2011). Proton-coupled high-affinity phosphate transport revealed from heterologous characterization in Xenopus of barley-root plasma membrane transporter, HvPHT1;1. Plant Cell Environ. 34, 681–689. doi: 10.1111/j.1365-3040.2010.02272.x
Rae, A. L., Cybinski, D. H., Jarmey, J. M., and Smith, F. W. (2003). Characterization of two phosphate transporters from barley; evidence for diverse function and kinetic properties among members of the Pht1 family. Plant Mol. Biol. 53, 27–36. doi: 10.1023/B:PLAN.0000009259.75314.15
Raghothama, K. G. (1999). Phosphate acquisition. Annu. Rev. Plant Phys. 50, 665–693. doi: 10.1146/annurev.arplant.50.1.665
Raghothama, K. G. (2000). Phosphate transport and signaling. Curr. Opin. Plant Biol. 3, 182–187. doi: 10.1016/S1369-5266(00)00062-5
Raghothama, K. G., and Karthikeyan, A. S. (2005). Phosphate acquisition. Plant Soil 274, 37–49. doi: 10.1007/s11104-004-2005-6
Rausch, C., and Bucher, M. (2002). Molecular mechanisms of phosphate transport in plants. Planta 216, 23–37. doi: 10.1007/s00425-002-0921-3
Rubio, V., Linhares, F., Solano, R., Martin, A. C., Iglesias, J., Leyva, A., et al. (2001). A conserved MYB transcription factor involved in phosphate starvation signaling both in vascular plants and in unicellular algae. Gene Dev. 15, 2122–2133. doi: 10.1101/gad.204401
Schunmann, P. H. D., Richardson, A. E., Smith, F. W., and Delhaize, E. (2004). Characterization of promoter expression patterns derived from the Pht1 phosphate transporter genes of barley (Hordeum vulgare L.). J. Exp. Bot. 55, 855–865. doi: 10.1093/jxb/erh103
Secco, D., Bouain, N., Rouached, A., Prom, U. T. C., Hanin, M., Pandey, A. K., et al. (2017). Phosphate, phytate and phytases in plants: from fundamental knowledge gained in Arabidopsis to potential biotechnological applications in wheat. Crit. Rev. Biotechnol. doi: 10.1080/07388551.2016.1268089 [Epub ahead of print].
Shin, H., Shin, H. S., Dewbre, G. R., and Harrison, M. J. (2004). Phosphate transport in Arabidopsis: Pht1;1 and Pht1;4 play a major role in phosphate acquisition from both low- and high-phosphate environments. Plant J. 39, 629–642. doi: 10.1111/j.1365-313X.2004.02161.x
Shukla, V., Kaur, M., Aggarwal, S., Bhati, K. K., Kaur, J., Mantri, S., et al. (2016). Tissue specific transcript profiling of wheat phosphate transporter genes and its association with phosphate allocation in grains. Sci. Rep. 6:39293. doi: 10.1038/srep39293
Sisaphaithong, T., Kondo, D., Matsunaga, H., Kobae, Y., and Hata, S. (2012). Expression of plant genes for arbuscular mycorrhiza-inducible phosphate transporters and fungal vesicle formation in sorghum, barley, and wheat roots. Biosci. Biotechnol. Biochem. 76, 2364–2367. doi: 10.1271/bbb.120782
Smith, F. W., Mudge, S. R., Rae, A. L., and Glassop, D. (2003). Phosphate transport in plants. Plant Soil 248, 71–83. doi: 10.1023/A:1022376332180
Sun, S. B., Gu, M. A., Cao, Y., Huang, X. P., Zhang, X., Ai, P. H., et al. (2012). A constitutive expressed phosphate transporter, OsPht1;1, modulates phosphate uptake and translocation in phosphate-replete rice. Plant Physiol. 159, 1571–1581. doi: 10.1104/pp.112.196345
Tamura, K., Peterson, D., Peterson, N., Stecher, G., Nei, M., and Kumar, S. (2011). MEGA5: molecular evolutionary genetics analysis using maximum likelihood, evolutionary distance, and maximum parsimony methods. Mol. Biol. Evol. 28, 2731–2739. doi: 10.1093/molbev/msr121
Teng, W., Deng, Y., Chen, X. P., Xu, X. F., Chen, R. Y., Lv, Y., et al. (2013). Characterization of root response to phosphorus supply from morphology to gene analysis in field-grown wheat. J. Exp. Bot. 64, 1403–1411. doi: 10.1093/jxb/ert023
Wang, H., Xu, Q., Kong, Y. H., Chen, Y., Duan, J. Y., Wu, W. H., et al. (2014). Arabidopsis WRKY45 transcription factor activates PHOSPHATE TRANSPORTER1;1 expression in response to phosphate starvation. Plant Physiol. 164, 2020–2029. doi: 10.1104/pp.113.235077
Wang, J., Sun, J. H., Miao, J., Guo, J. K., Shi, Z. L., He, M. Q., et al. (2013). A phosphate starvation response regulator Ta-PHR1 is involved in phosphate signalling and increases grain yield in wheat. Ann. Bot. 111, 1139–1153. doi: 10.1093/aob/mct080
Yan, W., Chen, G. H., Yang, L. F., Gai, J. Y., and Zhu, Y. L. (2014). Overexpression of the rice phosphate transporter gene OsPT6 enhances tolerance to low phosphorus stress in vegetable soybean. Sci. Hortic. 177, 71–76. doi: 10.1016/j.scienta.2014.07.037
Ye, Y., Yuan, J., Chang, X., Yang, M., Zhang, L., Lu, K., et al. (2015). The phosphate transporter gene OsPht1;4 is involved in phosphate homeostasis in rice. PLoS ONE 10:e0126186. doi: 10.1371/journal.pone.0126186
Keywords: wheat (Triticum aestivum), PHT1 genes, genome-wide analysis, phosphate transporter, phosphorus uptake, phosphate-starvation response
Citation: Teng W, Zhao Y-Y, Zhao X-Q, He X, Ma W-Y, Deng Y, Chen X-P and Tong Y-P (2017) Genome-wide Identification, Characterization, and Expression Analysis of PHT1 Phosphate Transporters in Wheat. Front. Plant Sci. 8:543. doi: 10.3389/fpls.2017.00543
Received: 11 February 2017; Accepted: 27 March 2017;
Published: 11 April 2017.
Edited by:
Raul Antonio Sperotto, Centro Universitário UNIVATES, BrazilReviewed by:
Stefano Cesco, Free University of Bozen-Bolzano, ItalyHatem Rouached, Institut National de la Recherche Agronomique (INRA), France
Soren K. Rasmussen, University of Copenhagen, Denmark
Copyright © 2017 Teng, Zhao, Zhao, He, Ma, Deng, Chen and Tong. This is an open-access article distributed under the terms of the Creative Commons Attribution License (CC BY). The use, distribution or reproduction in other forums is permitted, provided the original author(s) or licensor are credited and that the original publication in this journal is cited, in accordance with accepted academic practice. No use, distribution or reproduction is permitted which does not comply with these terms.
*Correspondence: Yi-Ping Tong, yptong@genetics.ac.cn
†These authors have contributed equally to this work.