 Yun Song
 Yan Chen1
 Shuifang Zhu
 MingFu Li
- 1Institute of Plant Quarantine, Chinese Academy of Inspection and Quarantine, Beijing, China
- 2Biological Germplasm Resources Identification Center of AQSIQ, Beijing, China
- 3Institute of Animal Quarantine, Chinese Academy of Inspection and Quarantine, Beijing, China
Rice is the most important crop in the world as the staple food for over half of the population. The wild species of Oryza represent an enormous gene pool for genetic improvement of rice cultivars. Accurate and rapid identification of these species is critical for effective utilization of the wild rice germplasm. In this study, we developed valuable chloroplast molecular markers by comparing the chloroplast genomes for species identification. Four chloroplast genomes of Oryza were newly sequenced on the Illumina HiSeq platform and other 14 Oryza species chloroplast genomes from Genbank were simultaneously taken into consideration for comparative analyses. Among 18 Oryza chloroplast genomes, five variable regions (rps16-trnQ, trnTEYD, psbE-petL, rpoC2 and rbcL-accD) were detected for DNA barcodes, in addition to differences in simple sequence repeats (SSR) and repeat sequences. The highest species resolution (72.22%) was provided by rpoC2 and rbcL-accD with distance-based methods. Three-marker combinations (rps16-trnQ + trnTEYD + rbcL-accD, rps16-trnQ + trnTEYD + rpoC2 and rpoC2 + trnTEYD + psbE-petL) showed the best species resolution (100%). Phylogenetic analysis based on the chloroplast genome provided the best resolution of Oryza. In the comparison of chloroplast genomes in this study, identification of the most variable regions and assessment of the focal regions of divergence were efficient in developing species-specific DNA barcodes. Based on evaluation of the chloroplast genomic resources, we conclude that chloroplast genome sequences are a reliable and valuable molecular marker for exploring the wild rice genetic resource in rice improvement.
Introduction
Rice is an important cereal crop that provides essential food and energy for more than half of the world’s population. The genus Oryza has two cultivated species (O. sativa and O. glaberrima) and approximately 21 species of wild relatives. Rice with an AA genome type is the most important species, which has two subspecies with global distributions, O. sativa ssp. japonica and O. sativa ssp. indica. The genus Oryza is classified into 10 genome types, including six diploids (AA, BB, CC, EE, FF, and GG) and four allotetraploids (BBCC, CCDD, HHJJ, and HHKK) (Aggarwal et al., 1999).
The wild species contain valuable genetic diversity that has continued to contribute immensely to rice crop improvement (Choi et al., 2017). Because of the importance of Oryza as a major food crop, Oryza species have been the subject of studies on taxonomy, phylogenetic relationships of species within the genus, and species identification (Zou et al., 2008; Tang et al., 2010; Zhang et al., 2014). Such approaches provide tremendous benefits in plant breeding and to effective conservation. For the effective exploration, conservation, and domestication, accurately identified wild species would provide clarity. However, taxonomy of wild species remains problematic. For example, the A-genome group, also called the Oryza sativa complex, consisting of eight diploid species, is particularly problematic because most of them lack clear morphological distinguishing characteristics (Vaughan, 1989; Zhu and Ge, 2005).
Biological specimens are identified using morphological features, and in most cases, an experienced professional taxonomist is required. Molecular marker methods and DNA barcoding, offer effective information for taxonomy and species discrimination. In recent decades, the applications of various molecular techniques (SSR, AFLP, and DNA barcodes, among others) have played important roles in resolving questions concerning taxonomy and species discrimination. DNA barcoding can provide a new tool for accurate species discrimination (Hebert et al., 2003). DNA barcoding involves sequencing one or more standard genomic regions as a tool for species identification. Recently, a two-locus land plant barcode consisting of portions of the chloroplast genes rbcL and matK or ycf1b and the nuclear gene ITS have been proposed (CBOL Plant Working Group, 2009).
For phylogenetic studies of Oryza, molecular markers, including chloroplast genome regions (Ge et al., 1999; Tang et al., 2010), complete chloroplast genomes (Wambugu et al., 2015; Tong et al., 2016), multiple nuclear genes (Zou et al., 2008), and SNPs (Wang et al., 2017) have been analyzed. However, an effective DNA barcode for Oryza remains unclear. One source of sequence of diversity that can be used to identify species is the chloroplast genome. The chloroplast genome has a highly conserved circular DNA arrangement ranging from 115 to 165 kb, with 130 genes encoded. Chloroplast genomes have often been used for phylogenetic studies and species identification because of the slower evolution than that of nuclear genomes. Moreover, in most angiosperms, genetic information from the chloroplast genome is inherited maternally, with the chloroplast genome then a good indicator of maternal ancestry. Most studies show that chloroplast genome mutations are not random but clustered as “hot spots” (Dong et al., 2012, 2014a; Song et al., 2015; Xu et al., 2017), and this mutation dynamic has created highly variable regions in the genome.
With the recent availability of the next-generation sequencing techniques, much sequence data can be generated at relatively low cost with time saved. In this study, we sequenced and analyzed the chloroplast genome of O. meyeriana, O. latifolia, O. eichingeri, and O. rhizomasis using the Illumina HiSeq platform. The first objective was to obtain useful chloroplast molecular markers by comparing the chloroplast genomes for species identification. The second objective was to evaluate the interspecific variation within the genus. The third objective was to reveal the structural patterns of the Oryza chloroplast genome.
Materials and Methods
Taxon Sampling, DNA Extraction, and Sequencing
Fresh leaves of the four species of Oryza were collected from the Kunming Institute of Botany, Chinese Academy of Sciences and the Rice Research Institute, Guangdong Academy of Agricultural Sciences. Fresh leaves from each accession were immediately dried with silica gel before DNA extraction. Total genomic DNA was extracted and purified following the method of Li et al. (2013). DNA samples were randomly fragmented into 400–600 bp fragments using an ultrasonicator. An Illumina paired-end DNA library with 500-bp insert size was constructed using a NEBNext® UltraTMDNA Library Prep Kit following the manufacturer’s instructions. Paired-end sequencing (2 × 150 bp) was conducted on an Illumina HiSeq X Ten platform.
Genome Assembly and Genome Annotation
The paired-end reads were qualitatively assessed and assembled with SPAdes 3.6.1 (Bankevich et al., 2012). Chloroplast genome sequence contigs were selected from SPAdes software by performing a BLAST search using the Oryza sativa chloroplast genome sequence as a reference (GenBank accession number: JN861110). The selected contigs were assembled with Sequencher 5.4.5 (Gene Codes, Ann Arbor, MI, United States). Small gaps in the assemblies were bridged with specific primers designed for PCR based on their flanking sequences and then by Sanger sequencing. Based on the reference chloroplast genome, the four junctions between the inverted repeats (IRs) and single-copy regions were checked by amplification with specific primers followed by Sanger sequencing (Dong et al., 2013). Chloroplast genome annotation was performed with Plann (Huang and Cronk, 2015) using the Oryza sativa reference sequence from Genbank. A chloroplast genome map was drawn using Genome Vx software (Conant and Wolfe, 2008).
Analysis of Tandem Repeats and Single Sequence Repeats
MIcroSAtellite (MISA1) was used to detect single sequence repeats (SSR) within the chloroplast genome, with the parameters set at >10 for mononucleotide, >5 for dinucleotide, >4 for trinucleotide, and >3 for tetranucleotide, pentanucleotide, and hexanucleotide SSRs. The web-based software REPuter was used to visualize the dispersed repeat sequences in Oryza by forward vs. reverse complement (palindromic) alignment (Kurtz et al., 2001). The following settings for repeat identification were used: (1) a minimum repeat size of 30 bp; (2) Hamming distance of 3; and (3) 90% or greater sequences identity. Tandem repeats were identified using web-based Tandem Repeats Finder2, with 2, 7, and 7 set for the alignment parameters match, mismatch, and indel, respectively.
Sequence Divergence Analysis and Phylogenetic Analyses
Complete chloroplast genomes were used to analyze the average pairwise sequence divergence for the 18 Oryza species (Table 1). All Oryza sequenced chloroplast genomes were aligned using MAFFT v7 (Katoh and Standley, 2013) assuming collinear genomes for the full alignment and then adjusted manually using Se-Al 2.0 (Rambaut, 1996). Variable and parsimony-informative base sites were calculated using MEGA 6.0 software (Tamura et al., 2013). The p-distances among Oryza chloroplast genomes were calculated to evaluate the divergence of Oryza species using MEGA software.
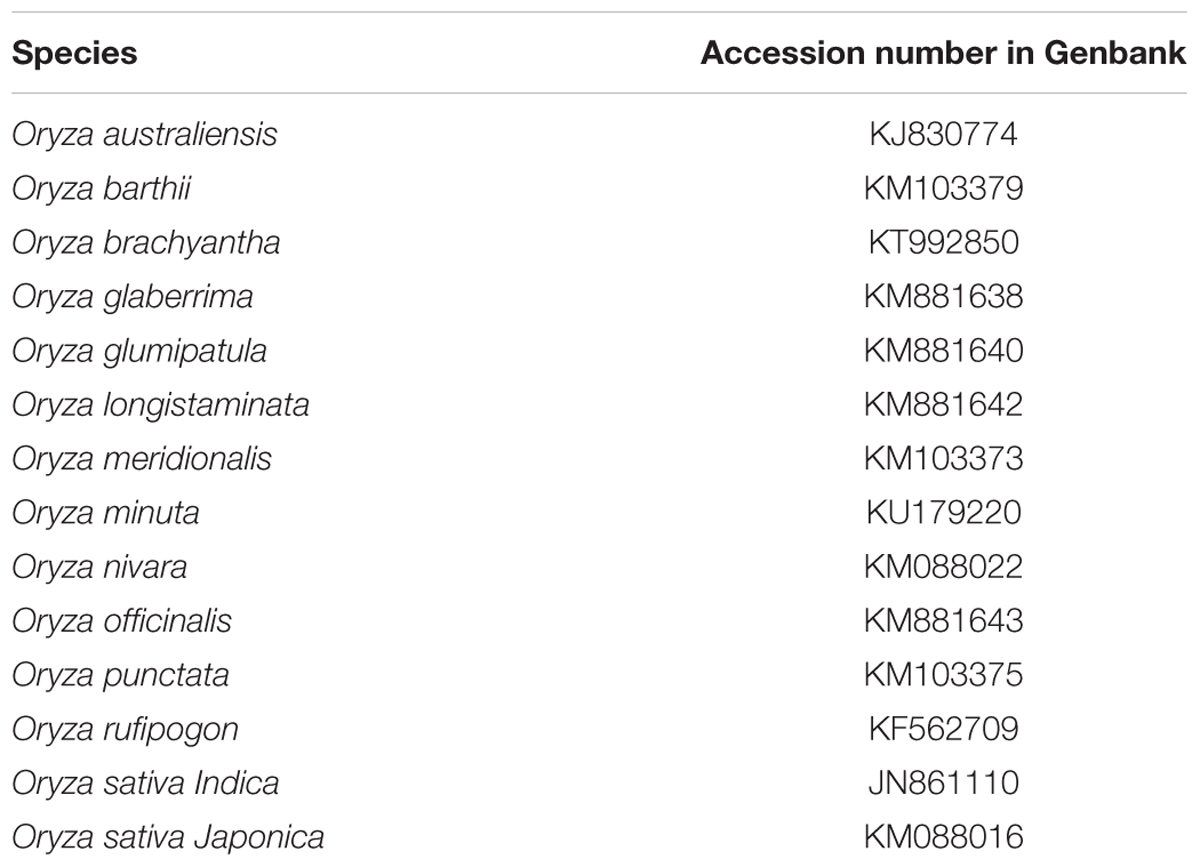
TABLE 1. A list of the 14 taxa sampled from Genbank in this study.
Phylogenetic trees were constructed by maximum parsimony (MP), maximum likelihood (ML), and Bayesian inference (BI) using the entire chloroplast genome. The chloroplast genome sequences of Leersia tisserantii, Zizania latifolia, Zizania aquatic, Rhynchoryza subulata, Chikusichloa aquatic, Potamophila parviflora, and Microlaena stipoides were used as out-groups.
Maximum parsimony analyses were conducted using PAUP v4b10, which was performed using heuristic searches with the ‘MulTrees’ option followed by tree bisection–reconnection (TBR) branch swapping. To assess node support, bootstrap analyses were performed using 1000 replicates with 10 random taxon additions and heuristic search options. All characters were equally weighted, gaps were treated as missing, and character states were treated as unordered. ML analyses were performed using RAxML v.8.1.24 with general time reversible (GTR) + G model. Supports for nodes were assessed with 1,000 rapid bootstrapping replicates. BI was conducted with Mrbayes v3.2 (Ronquist et al., 2012). The analysis was run for 1,000,000 generations and sampled every 1,000 generations. The first 25% of the trees were discarded as burn-in, the remaining trees were used to build a 50% majority-rule consensus tree and estimate the Bayesian posterior probabilities.
Divergent Hot Spot Identification
Hypervariable chloroplast regions were identified using slideAnalyses of SPIDER (Brown et al., 2012) version 1.2-0. This function extracts all the passable windows of a chosen size in a DNA alignment and performs pairwise distance (K2P) analyses of each window. Two factors were considered for the definition of hypervariable regions: first, the mean distance of each window, and second, the proportion of zero pairwise distances for each species in the matrix. The step size was set to 200 bp, with an 800-bp window length. Two data sets were created for this analysis: (1) all 18 species data set and (2) only AA genome species data set (included nine species).
DNA Barcoding Analysis
We analyzed the hypervariable barcodes and compared the chloroplast genes rbcL, matK, and trnH-psbA using two different methods. To assess the barcoding resolution for all barcodes, the distance and the tree-building methods were the two analytical approaches. Distance may be the most commonly used method for DNA sequences classification, which was used to evaluate the barcode performances of the newly identified highly variable regions. The function nearNeighbour of SPIDER was used for barcoding analyses (Brown et al., 2012).
Tree building analyses provide a convenient and visualized method for evaluating discriminatory performance by calculating the proportion of monophyletic species. MP trees were constructed for each hypervariable marker and the different marker combinations using MEGA 6.0. Relative support for the branches of the MP tree was assessed via 1,000 bootstrap replicates. Species were considered successfully discriminated when all individuals of a species formed a single and exclusive clade in a MP tree with bootstrap value above 50%.
Results
Chloroplast Genome Generation, Characterization, and Annotation
Using an Illumina HiSeq X ten system, the four species of Oryza were sequenced, producing from 9,642,763 to 10,287,100 paired-end raw reads (150 bp for average read length). After mapping the paired-end reads with the reference chloroplast genome of Oryza sativa, 105,824 to 499,727 reads were extracted, with 117× to 556× coverage (Table 2). PCR-based sequencing validated four junction regions in each of the Oryza chloroplast genomes. The four Oryza chloroplast genome sequences were deposited in GenBank (accession numbers, MF401450–MF401453).
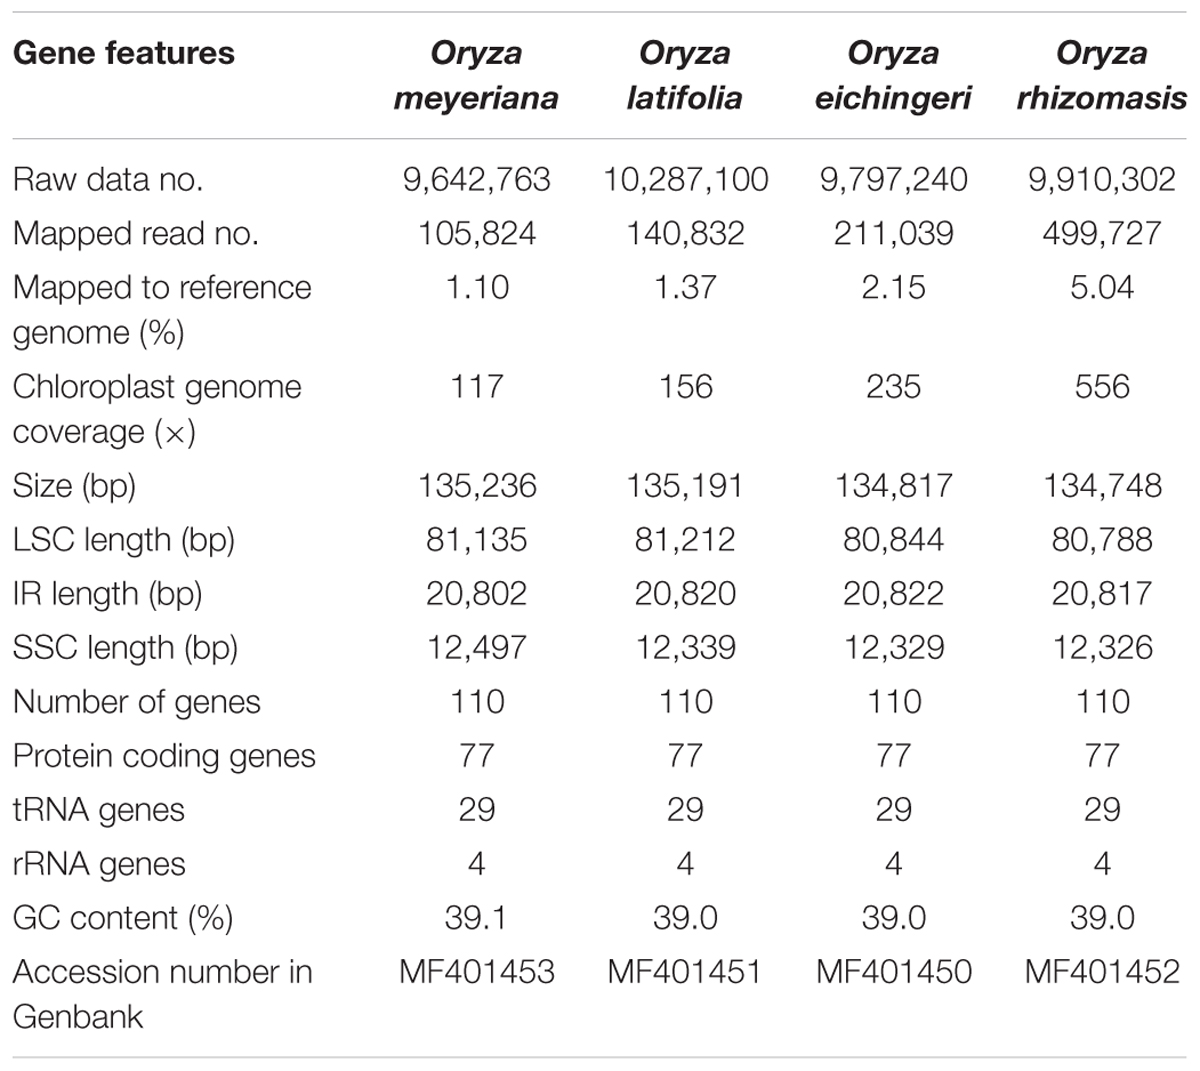
TABLE 2. Summary statistics for assembly of four Oryza species chloroplast genomes.
The chloroplast genome of the four species of Oryza ranged from 134,748 bp (O. rhizomasis) to 135,239 bp (O. meyeriana). Chloroplast genomes showed a typical quadripartite structure, consisting of a pair of IRs (20,817–20,822 bp) separated by the LSC (80,788–81,212 bp) and SSC (12,326–12,497 bp) regions (Figure 1 and Table 2). For all four chloroplast genomes, the average GC content was 39.0%. The annotation chloroplast genomes of these four species were represented in one circular map, because their gene number, order and names were the same. With the duplicated genes in IR regions only counted once, the chloroplast genomes of the four species of Oryza harbored 110 different genes, including 77 protein-coding genes, 29 tRNA genes and 4 rRNA genes. The gene number and the genome organization are very similar to the chloroplast genomes of other Oryza species.
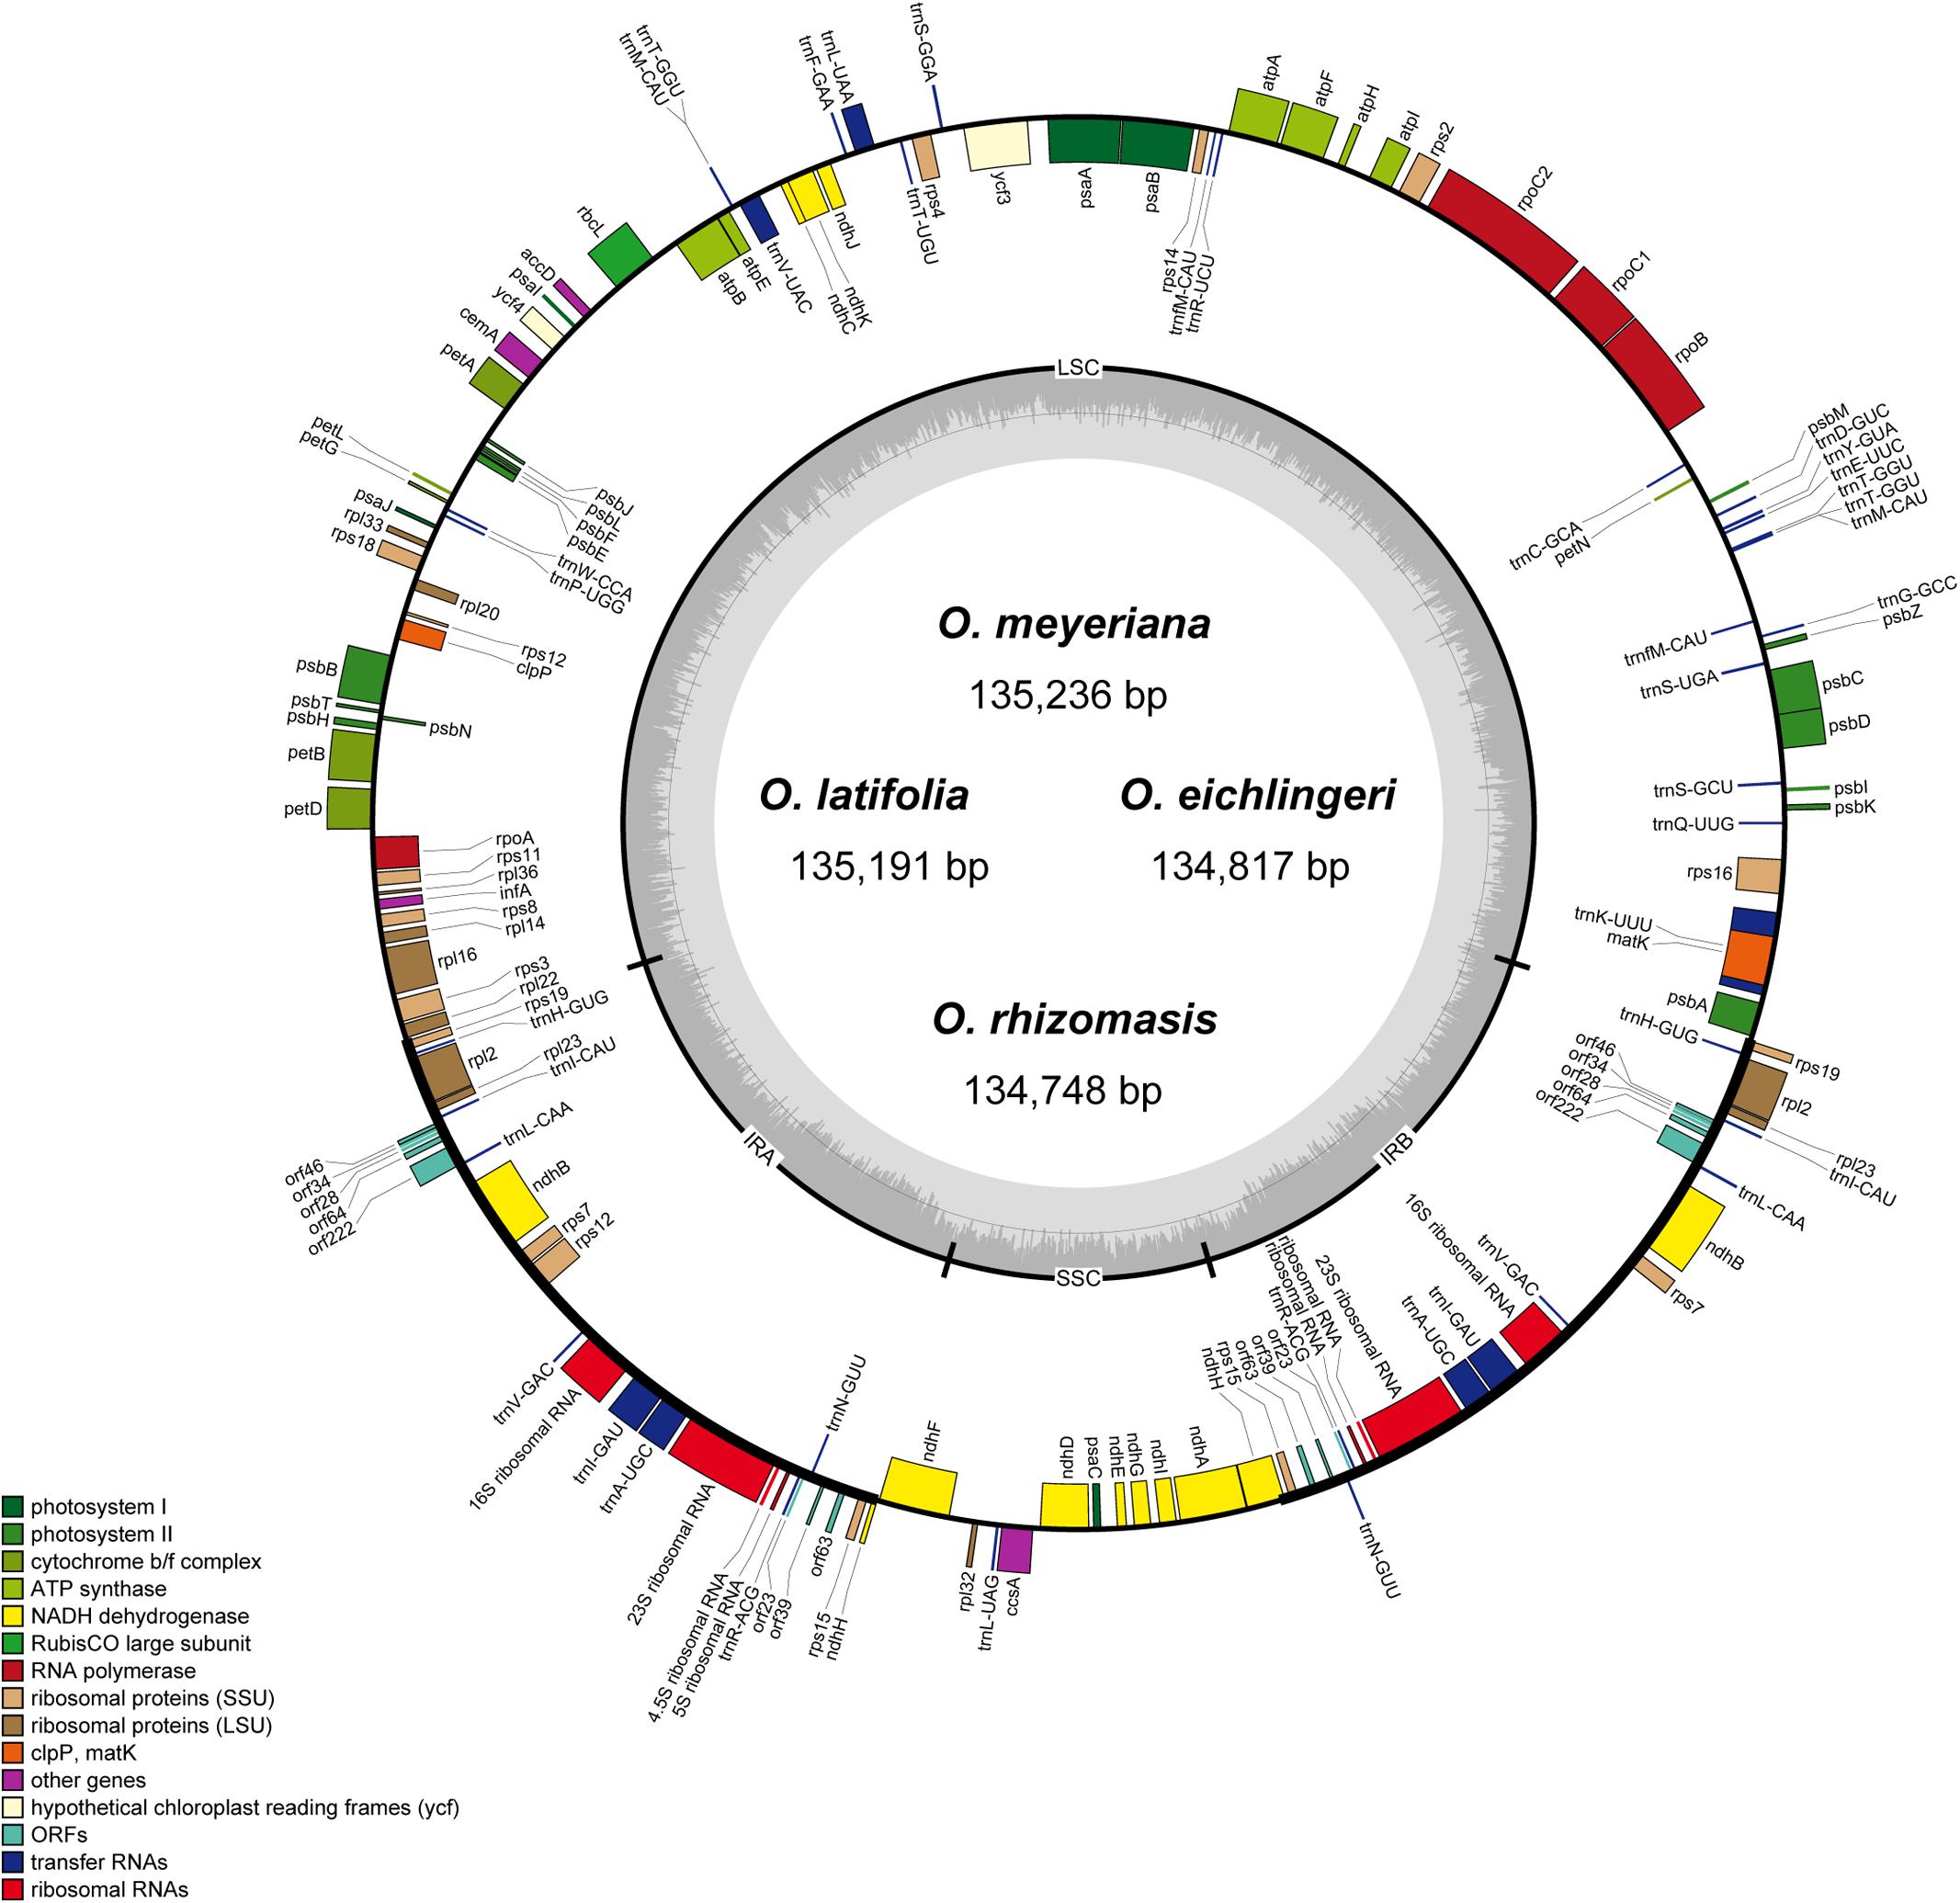
FIGURE 1. Gene map of Oryza chloroplast genome. Genes on the inside are transcribed in the clockwise direction while genes on the outside are transcribed in the counterclockwise direction. Genes in different functional groups are shown in different colors. The thick lines indicate the extent of the inverted repeats (IRa and IRb).
SSR and Repeat Analyses
In this study, we detected SSRs and dispersed repeats in all published Oryza species chloroplast genomes. Each Oryza chloroplast genome contained 22–31 SSRs (Figure 2). Among those SSRs, most were located in the LSC/SSC regions (92.0%). For each species, mono-, di-, tri-, tetra-, penta-, and hexanucleotide SSRs were all detected, with the average of mono-, di-, tri-, and tetranucleotide SSRs 38.69%, 15.64%, 11.63%, and 32.77%, respectively. Additionally, we did not find many penta- and hexanucleotide SSRs in Oryza, which is similar to the chloroplast genome of angiosperm species (Choi et al., 2016; Xu et al., 2017). SSRs were particularly rich in AT in the Oryza chloroplast genomes. The majority of SSRs in all species were A/T mononucleotides.
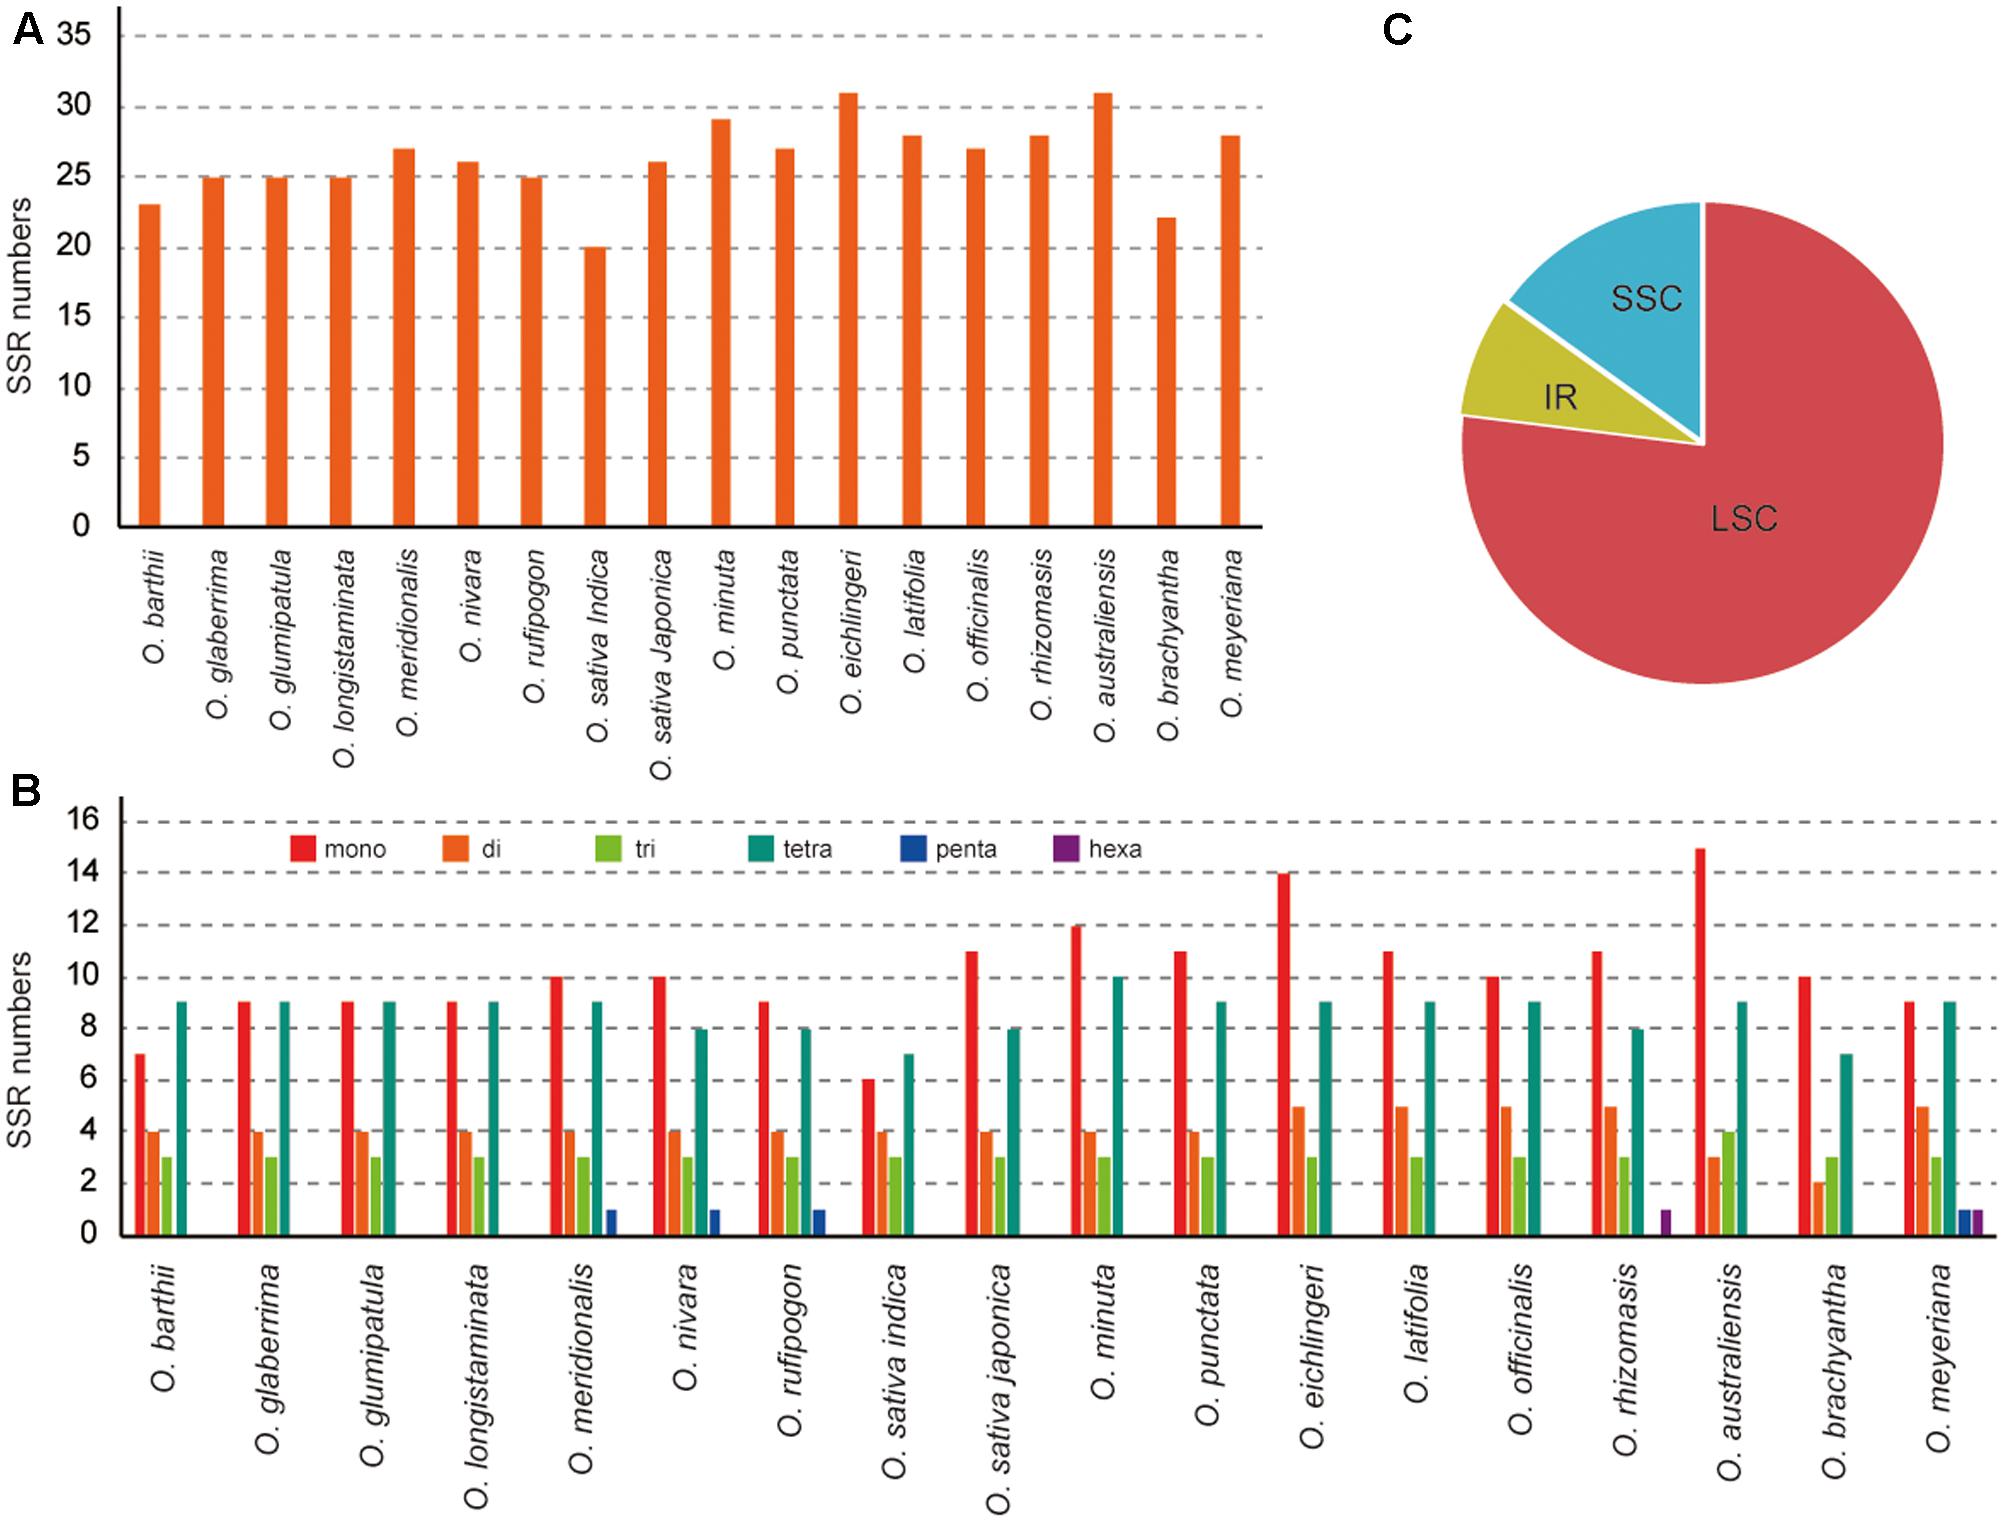
FIGURE 2. Analysis of perfect simple sequence repeats (SSRs) in 18 Oryza chloroplast genomes. (A) Number of SSRs detected in 18 chloroplast genomes. (B) Frequency of identified SSRs in LSC, IR, and SSC regions. (C) Number of SSR types detected in 18 chloroplast genomes.
Dispersed repeat sequences, which play a role in genome rearrangement, have been used as a source to understand the phylogenetic relationships of species. Repeat sequences with a repeat unit longer than 30 bp were analyzed (Figure 3). Each Oryza chloroplast genome contained 50–63 repeat sequences, including 30–42 forward repeats, 19–22 palindromic repeats, and 22–34 tandem repeats. The repeats were primarily located in non-coding regions of chloroplast genomes.
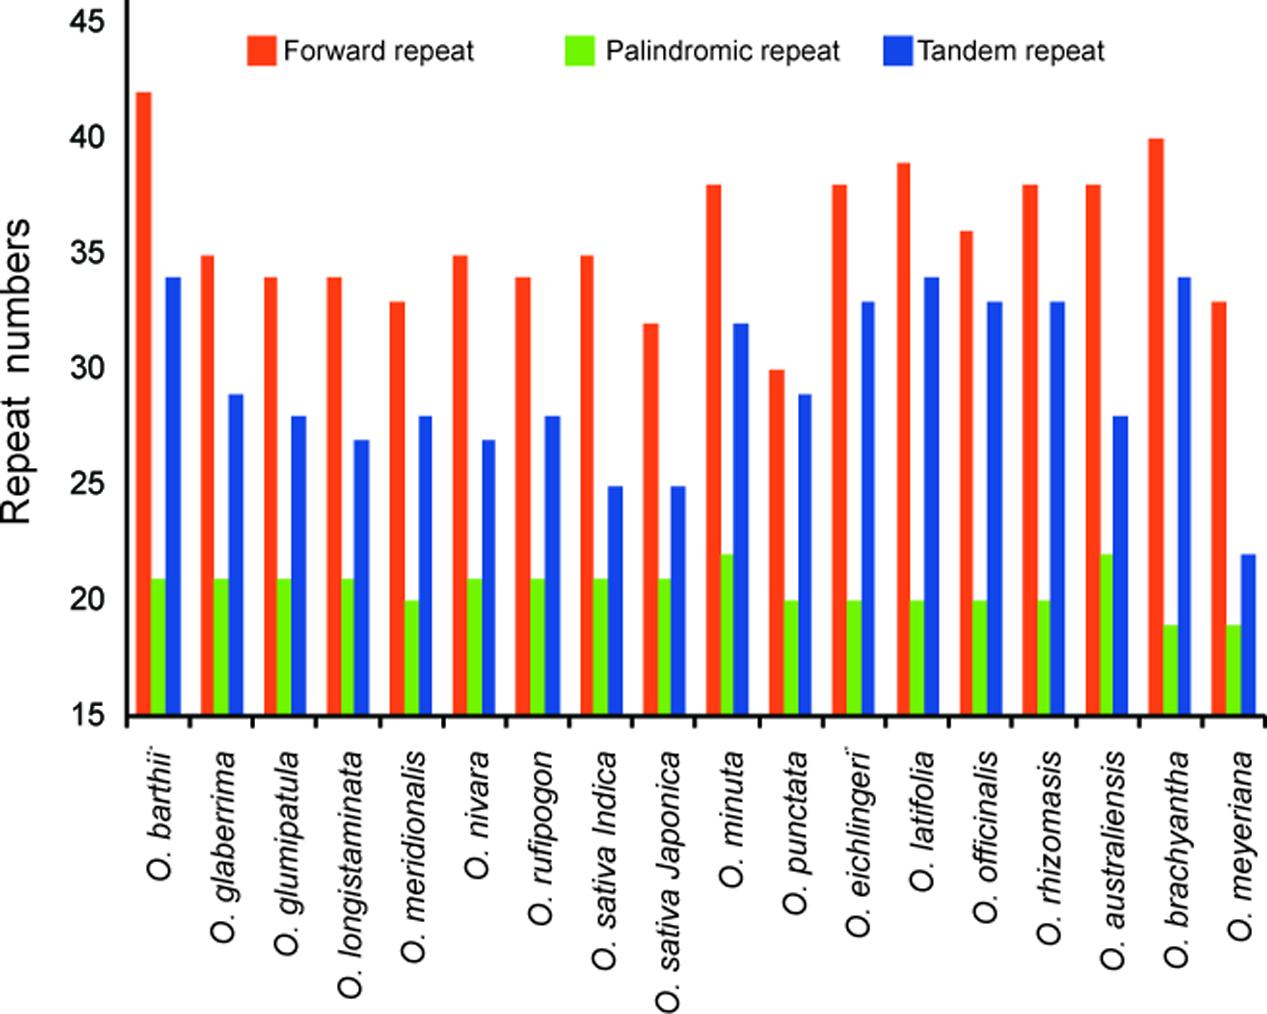
FIGURE 3. Analysis of repeated sequences in 18 Oryza chloroplast genomes.
Genome Sequence Divergence
Eighteen Oryza chloroplast genomes were fully aligned, and the alignment matrix of 139,988 bp was obtained. The alignment revealed high sequence similarity across the Oryza chloroplast genomes, suggesting that they are highly conserved. We retrieved 3,593 variable sites (2.57%), including 2,017 singletons and 1,576 parsimony-informative sites (1.13%), in the total chloroplast genome.
The number of nucleotide substitutions and p-distance were used to estimate the divergence among the eighteen Oryza species. The number of nucleotide substitutions among seven species varied from 13 to 1,953, and the p-distance varied from 0.0001 to 0.0149 (Supplementary Table S1). The overall sequence divergence estimated by p-distance among the four genomes was only 0.0052. The largest sequence divergence was observed between O. minuta and O. brachyantha and the lowest divergence was between O. barthii and O. glaberrima. At the level of the genome type, the largest sequence divergence occurred between the FF genome group and AA or BB genome group (Supplementary Table S2), with the sequence distance (0.0147). The smallest sequence divergence was observed between the CC genome group and CCDD genome group, with the sequence distance (0.0012).
Phylogenetic Analyses
Phylogenetic relationships within the Oryza were reconstructed using MP, ML, and BI analyses. The topologies based on the three methods were highly supported and largely congruent. Figure 4 illustrates the phylogeny generated by the ML analysis, including three types of support values: MP bootstrap values (MP-BS), ML bootstrap values (ML-BS), and BI posterior probabilities (BI-PP). All analyses fully supported the monophyly of the genus Oryza (ML-BS/BI-PP/MP-BS = 100/1.0/100). Within Oryza, the eighteen species divided into seven major groups with different genome types (AA, BB, CC, CCDD, EE, FF, and GG). The CCDD genome species formed a monophyletic clade with the CC genome, which suggested that the CC genome served as the maternal parent of the CCDD genome species. Two BBCC genome species, O. minuta and O. eichingeri, had different maternal origins, with a maternal parent of the BB genome for O. minuta and a maternal parent of the CC genome for O. eichingeri. O. longistaminata, and O. glumaepatula formed the basal clade in the AA group, which are found in Africa and South America, respectively.
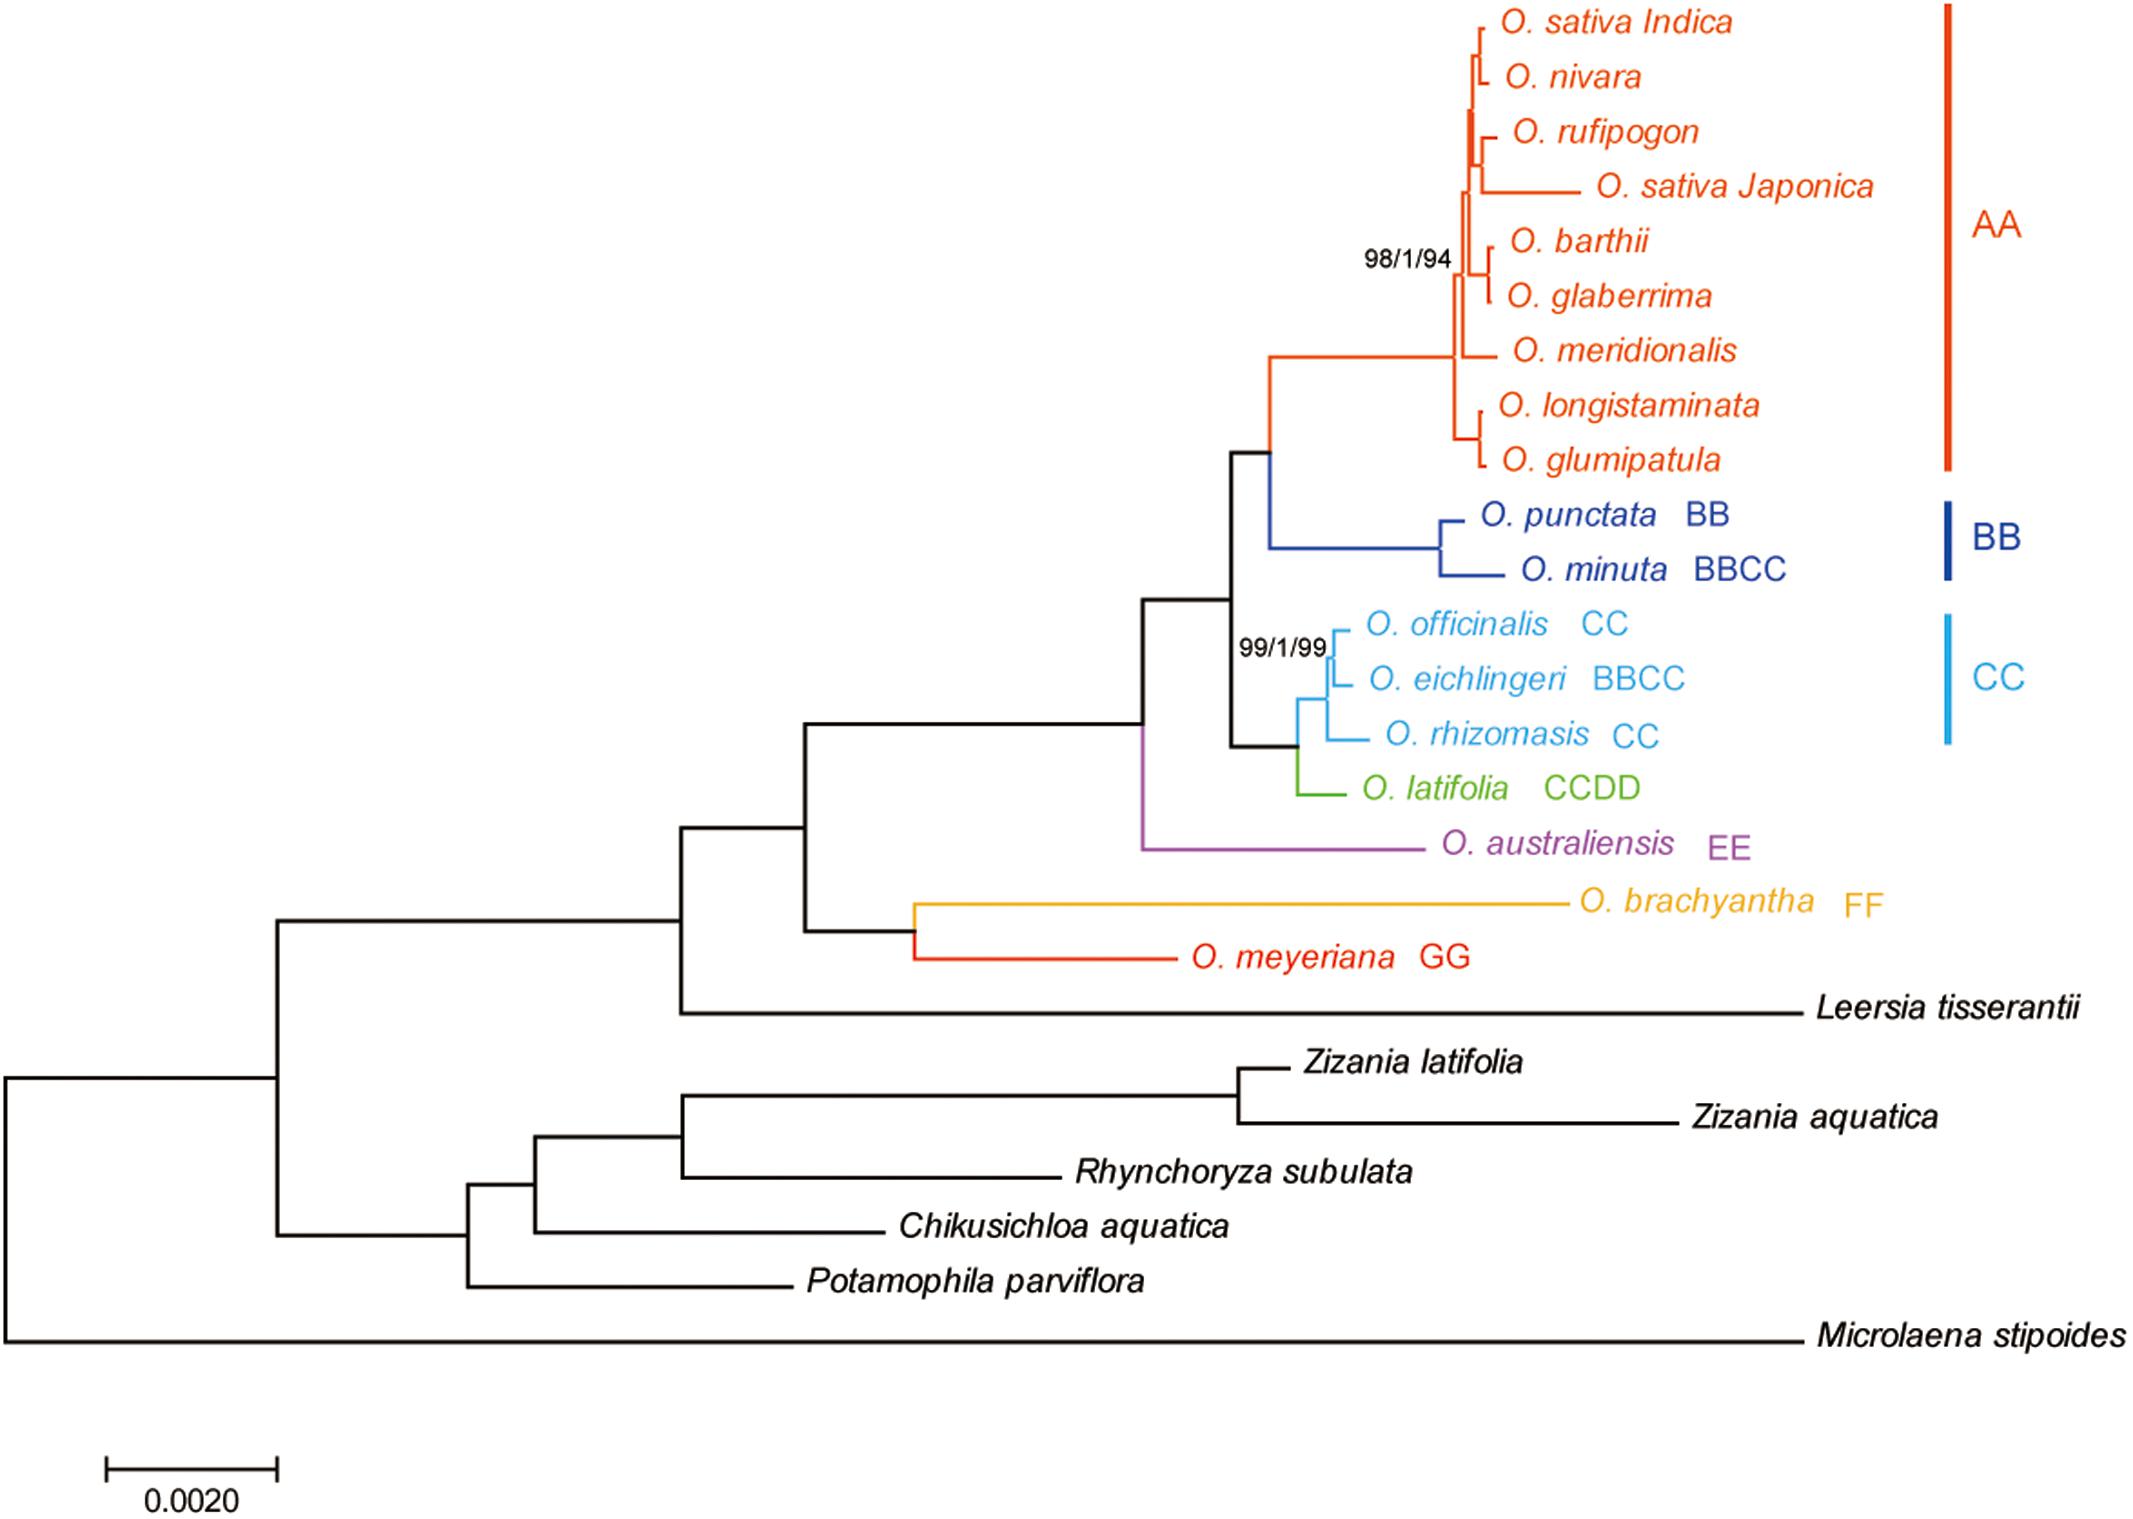
FIGURE 4. Phylogenetic tree reconstruction of 25 taxa using maximum likelihood, Bayesian inference, and maximum parsimony methods based on the complete chloroplast genome sequences. ML topology shown with ML bootstrap support value/Bayesian posterior probability/MP bootstrap support given at each node. Nodes with 100 ML-BP/1.0 BI-PP/100 MP-BP are not marked.
DNA Barcode Development and DNA Barcoding Analysis
To identify the hypervariable chloroplast regions, pairwise distance values within 800 bp in the eighteen Oryza chloroplast genomes were calculated with slideAnalyses of SPIDER (Figure 5). Three regions showed remarkably high distances and low proportions of zero pairwise distances for each species in the 18 species data set. One region was the coding region of rpoC2 and two were the intergenic regions (rps16-trnQ and rbcL-accD). For the data set of AA genome species, four variable chloroplast regions (rps16-trnQ, trnTEYD, psbE-petL and rbcL-accD) were identified.
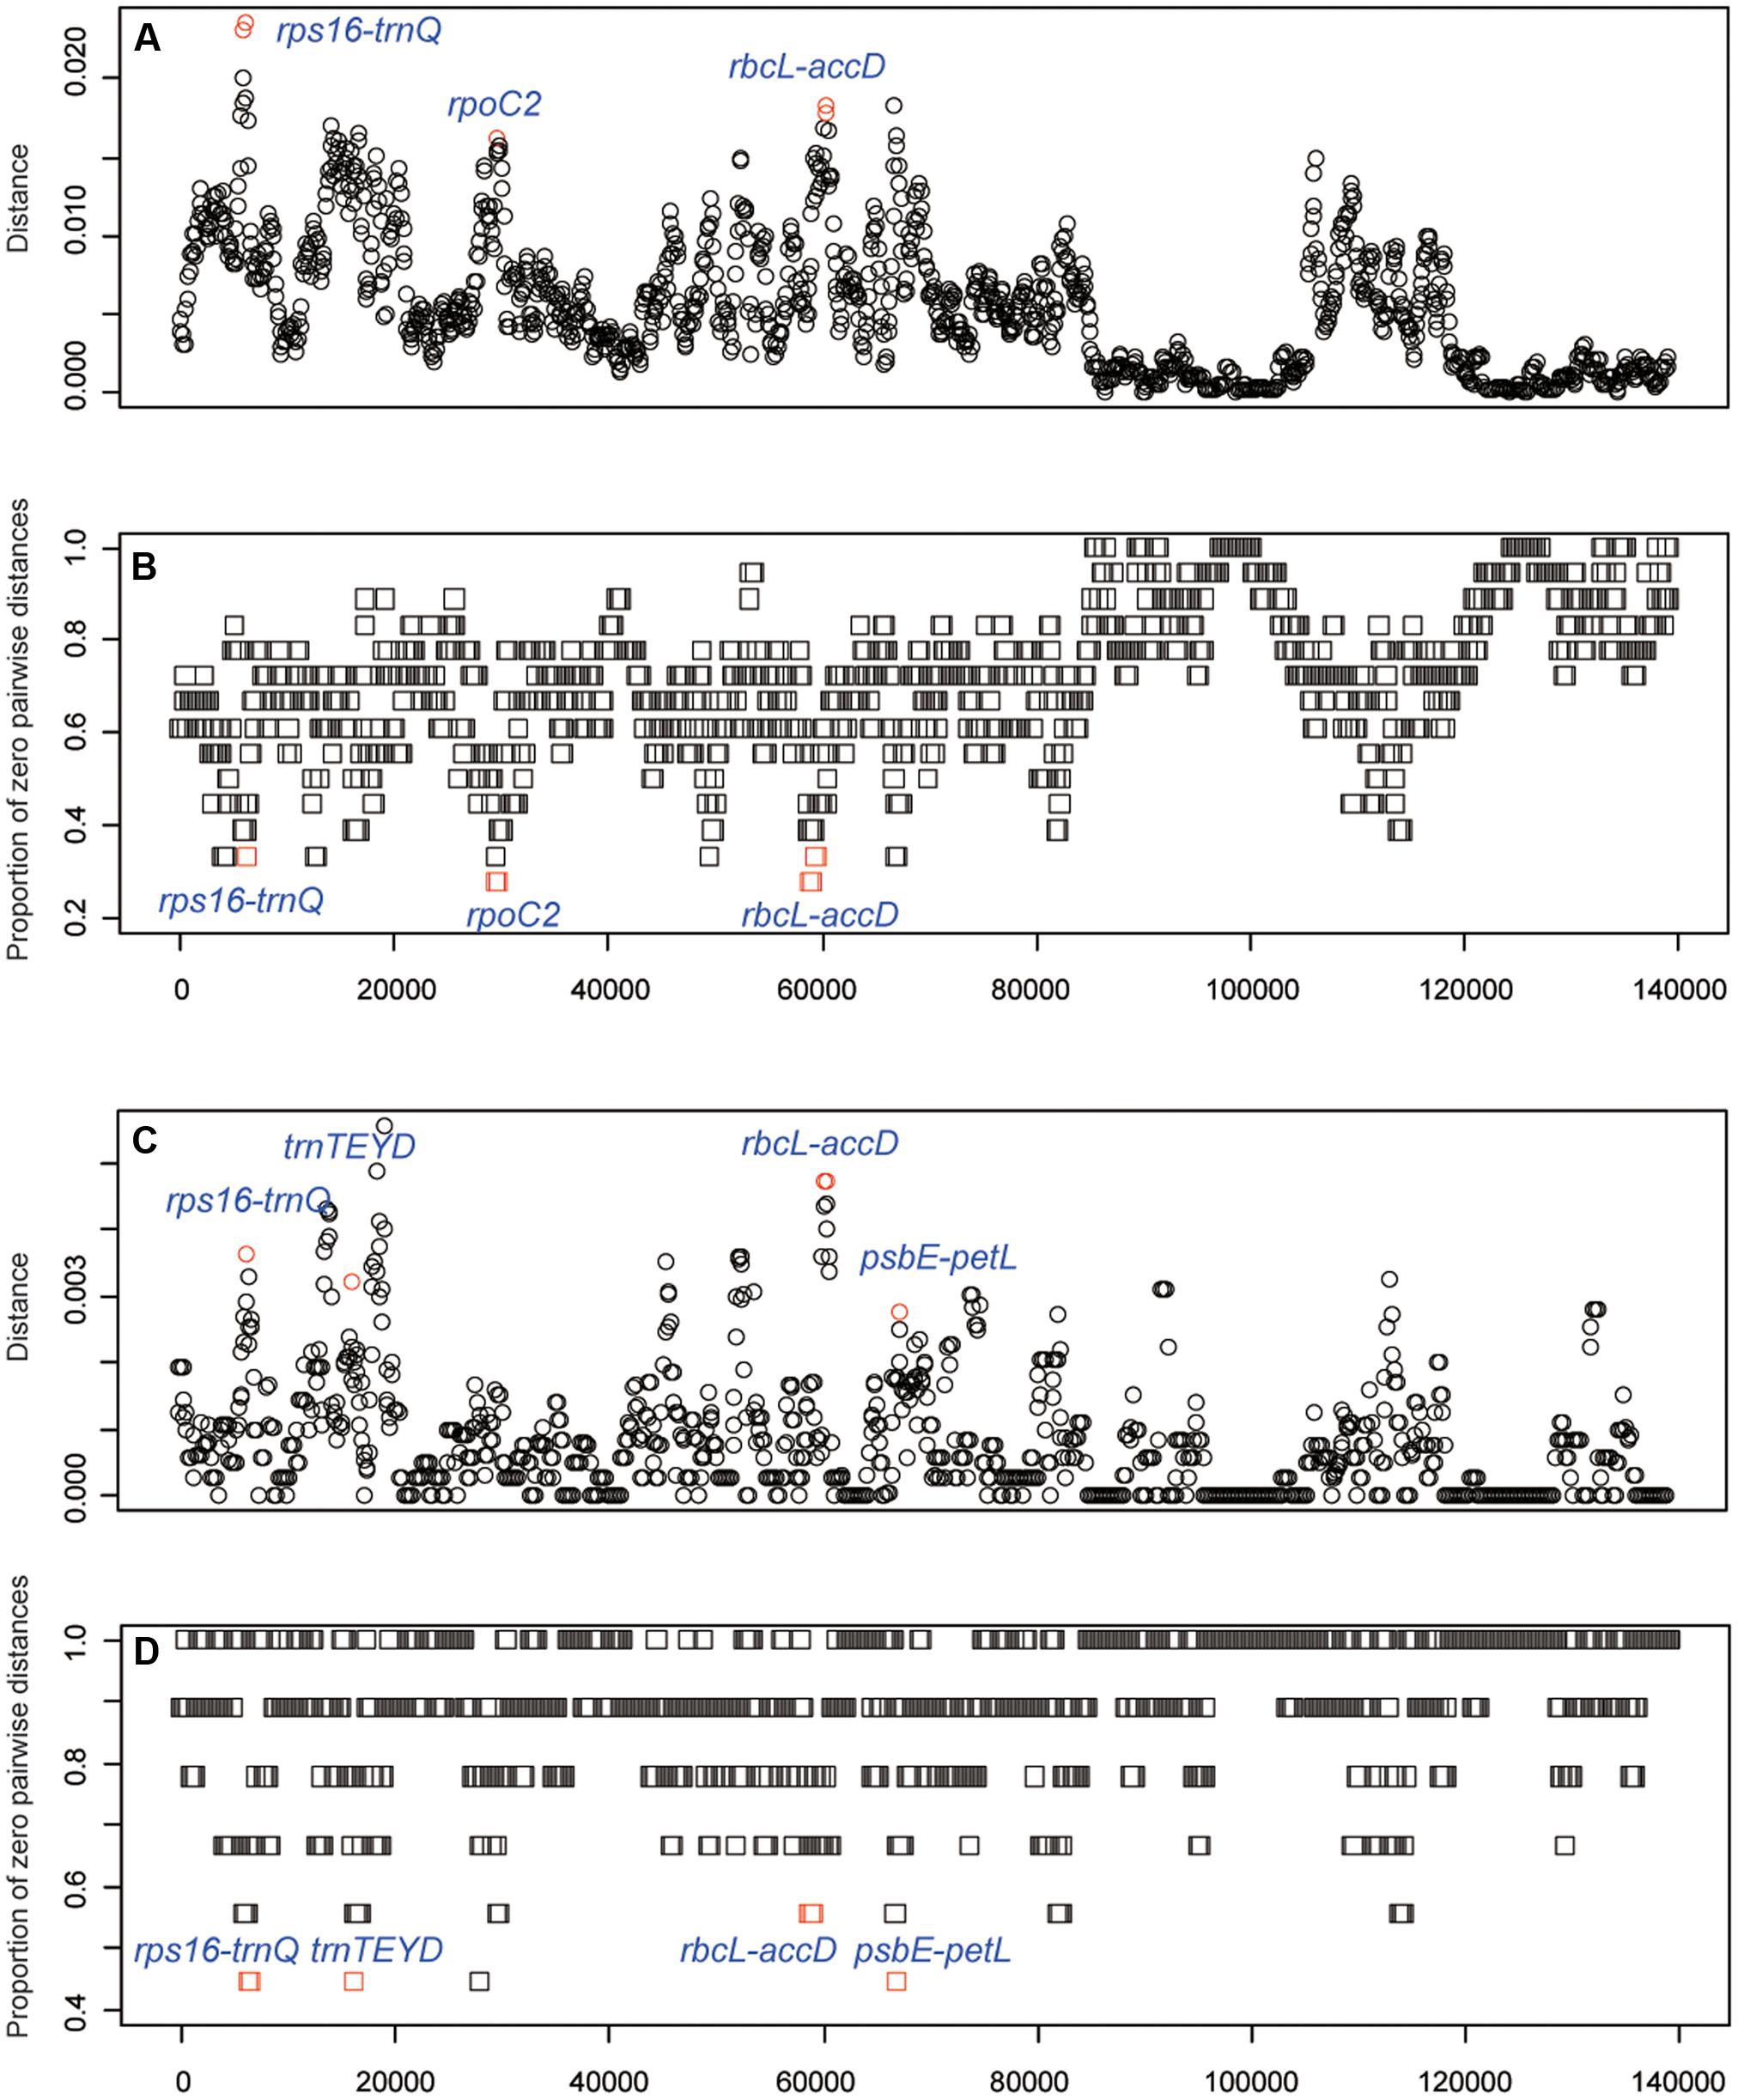
FIGURE 5. DNA barcode development. (A) Mean distance of each window using the 18 species data set. (B) The proportion of zero pairwise distances for each species based on the 18 species data set. (C) Mean distance of each window using the AA genome species data set. (D) The proportion of zero pairwise distances for each species based on the AA genome species data set.
The variability of the five developed variable regions was tested together with three conventional candidate DNA barcodes (matK, rbcL and trnH-psbA). Features of the eight barcode data set are shown in Table 3. The conventional candidate DNA barcodes had lower variability than that of the newly developed markers. The highest variability was in the rpoC2 region (6.80%), followed by the regions psbE-petL region (6.75%), rps16-trnQ (6.73%), trnTEYD (6.00%), and rbcL-accD (5.22%).
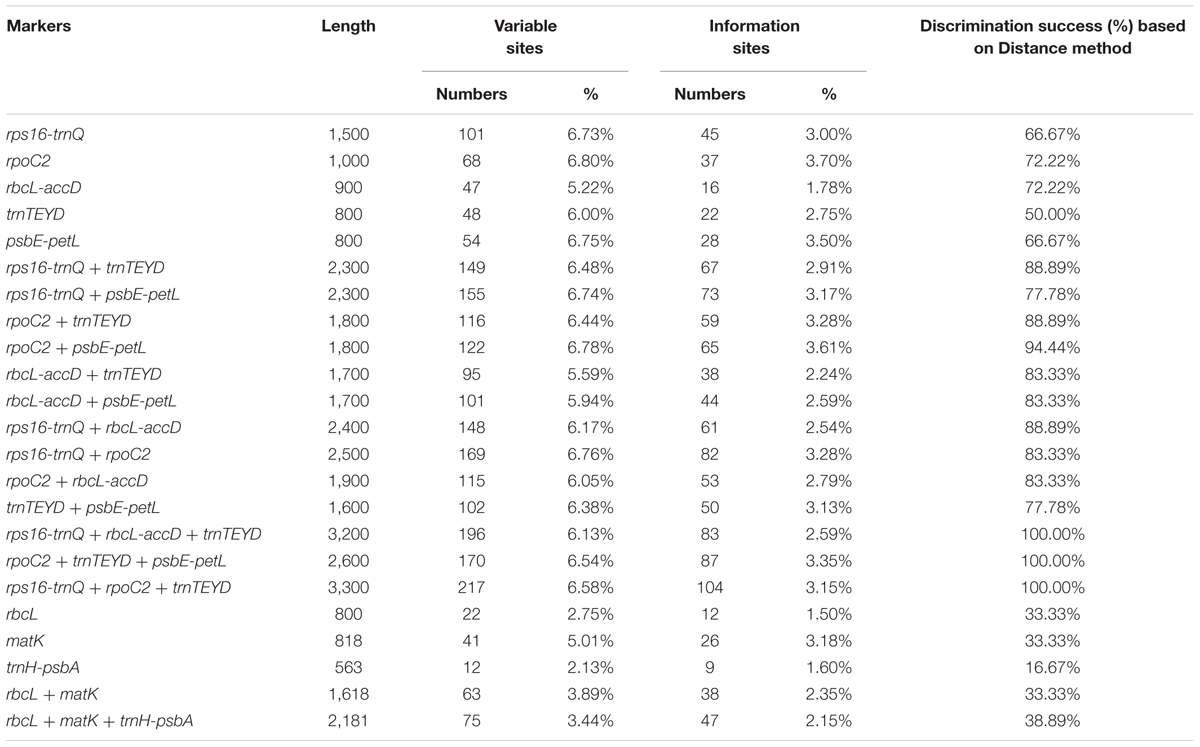
TABLE 3. Variability of the five new markers and the universal chloroplast DNA barcodes in Oryza.
Of the single-region barcodes, rpoC2 and rbcL-accD had the highest rate of correct identifications (72.22%), followed by rps16-trnQ and psbE-petL (66.67%) and trnTEYD (50.00%). The conventional candidate DNA barcodes had less discriminatory power, e.g., trnH-psbA had only a 16.67% success rate. Of the two-region barcodes, the best performing was rpoC2 + psbE-petL (94.44%). With the two core DNA barcodes rbcL and matK combined, success was only 33.33%. When analyzing multi-region barcodes, the highest correct identifications (100%) were with rps16-trnQ + trnTEYD + rbcL-accD, rps16-trnQ + trnTEYD + rpoC2, and rpoC2 + trnTEYD + psbE-petL. The MP tree method generated a graphical representation of the results, and the results of the tree-based method were the same (Figure 6).
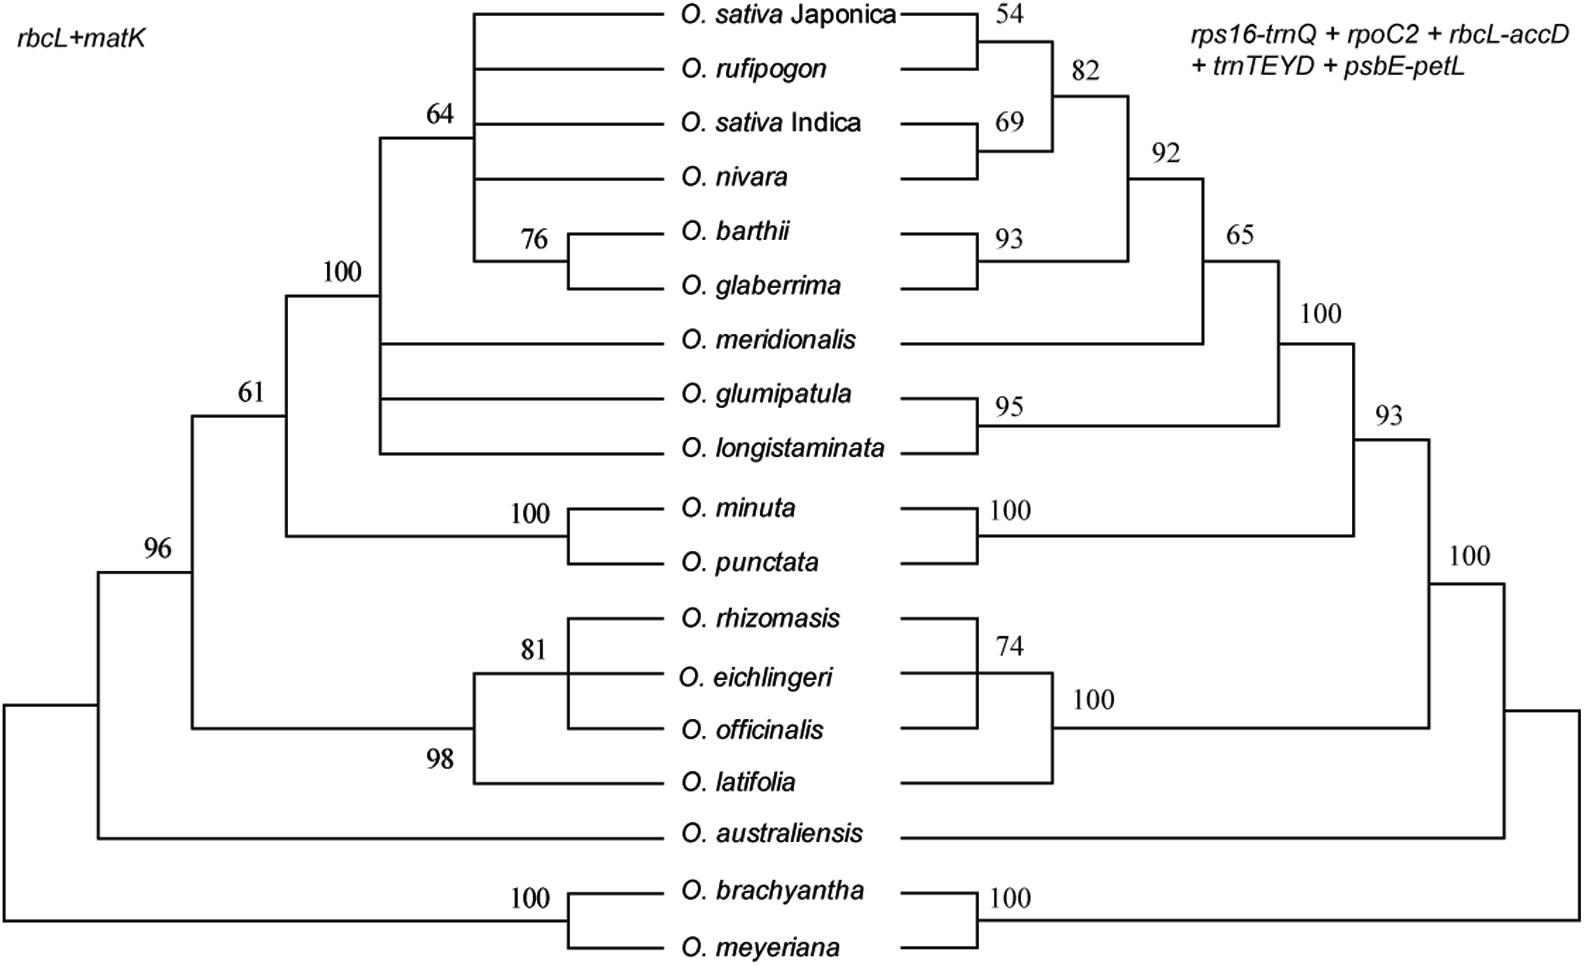
FIGURE 6. MP tree for Oryza using the rbcL + matK and rps16-trnQ + rpoC2 + rbcL-accD + trnTEYD + psbE-petL DNA barcode combinations.
Discussion
Knowing the name of an organism is essential, because the name is the same anywhere, indicating a specific organism, whether in medicine, seed, or wood form. However, the accurate discrimination of material using only morphological characteristics is difficult. DNA barcoding has become conventional technology used in discrimination. Although DNA barcoding technology has developed significantly, no barcode achieves the goal of sophisticated identification of plant species. In fact, the identification of species with short evolutionary times and close genetic relationships continues to face great challenges (Fazekas et al., 2008).
The ideal DNA barcode would be a single locus that could be universally amplified and sequenced for a broad range of taxa, easily aligned over large phylogenetic distances and that provided sufficient variation to reliably distinguish closely related species (Clement and Donoghue, 2012). Unfortunately, the candidate barcodes such as matK and rbcL, as “core” plant barcodes, perform well in terms of universality and/or sequence quality but often have limited resolutions at the species level (Dong et al., 2015). In this study, the combination of matK, rbcL, and trnH-psbA have poor resolution within Oryza, only less than half of the samples were successfully identified within Oryza (Table 3 and Figure 6). Therefore, development of effective, specific barcodes with high identification rates is very important for Oryza.
The chloroplast genome has additional effective resources for the development of specific barcodes (Dong et al., 2012, 2014b; Song et al., 2017; Xu et al., 2017). Some “hotspot” regions occur in the chloroplast genome that evolve very rapidly and meet the criteria required to be a DNA barcode. The strategy of searching the whole chloroplast genome has been successfully applied to Panax (Dong et al., 2014b), Paris (Song et al., 2017), Quercus (Yang et al., 2017), and Lagerstroemia (Xu et al., 2017). Therefore, the strategy to identify the best chloroplast DNA barcodes is reliable. In this study in the comparison of the eighteen Oryza chloroplast genomes, we identified five highly variable regions (candidate DNA barcodes), including rps16-trnQ, trnTEYD, psbE-petL, rpoC2, and rbcL-accD (Figure 5). These markers provided effective resolution of Oryza. The regions rps16-trnQ and rbcL-accD have been the focus in previous studies assessing DNA barcodes in angiosperms (Dong et al., 2012) or as species-specific DNA barcodes (Xu et al., 2017); however, trnTEYD, psbE-petL, and rpoC2 are rarely reported.
Conclusion
In this study, we generated chloroplast genomes for four Oryza species using Illumina HiSeq platforms and compared those genomes with the other published Oryza chloroplast genomes. The complete chloroplast genome of Oryza species had conserved genome structures and size and gene contents. The chloroplast genomes provided sufficient genetic information for species discrimination and hypervariable regions have been identified by comparing the chloroplast genomes. The specific Oryza DNA barcodes were tested and found useful for identifying Oryza species.
Author Contributions
YS and JL designed the experiment, drafted the manuscript. YC collected samples and performed the experiment. YS and JX analyzed the data. NC, ML, and SZ contributed reagents and analysis tools. All of the authors have read and approved the final manuscript.
Funding
This work was supported by grants from the National Key Research and Development Program of China (2017YFF0210302, 2017YFF0210300), the Specialized Funds for Inspection and Quarantine Scientific Research on Germplasm Resources from General Administration of Quality Supervision, Inspection and Quarantine of the People’s Republic of China (AQSIQ).
Conflict of Interest Statement
The authors declare that the research was conducted in the absence of any commercial or financial relationships that could be construed as a potential conflict of interest.
Acknowledgment
The authors thank Lizhi Gao, Shiqin Liu, Xiaoxia Zhu and Zhilan Fan for help in specimen collection and helpful discussion.
Supplementary Material
The Supplementary Material for this article can be found online at: https://www.frontiersin.org/articles/10.3389/fpls.2017.01854/full#supplementary-material
TABLE S1 | Numbers of nucleotide substitutions and sequence distances in 18 complete chloroplast genomes. The upper triangle shows the number of nucleotide substitutions. The lower triangle indicates the number of sequence distances in complete chloroplast genomes.
TABLE S2 | Sequence distances among the seven Oryza groups.
Footnotes
References
Aggarwal, R. K., Brar, D. S., Nandi, S., Huang, N., and Khush, G. S. (1999). Phylogenetic relationships among Oryza species revealed by AFLP markers. Theor. Appl. Genet. 98, 1320–1328. doi: 10.1007/s001220051198
Bankevich, A., Nurk, S., Antipov, D., Gurevich, A. A., Dvorkin, M., Kulikov, A. S., et al. (2012). SPAdes: a new genome assembly algorithm and its applications to single-cell sequencing. J. Comput. Biol. 19, 455–477. doi: 10.1089/cmb.2012.0021
Brown, S. D., Collins, R. A., Boyer, S., Lefort, M. C., Malumbres-Olarte, J., Vink, C. J., et al. (2012). Spider: an R package for the analysis of species identity and evolution, with particular reference to DNA barcoding. Mol. Ecol. Resour. 12, 562–565. doi: 10.1111/j.1755-0998.2011.03108.x
CBOL Plant Working Group (2009). A DNA barcode for land plants. Proc. Nat. Acad. Sci. U.S.A. 106, 12794–12797. doi: 10.1073/pnas.0905845106
Choi, J. Y., Platts, A. E., Fuller, D. Q., Hsing, Y. L., Wing, R. A., and Purugganan, M. D. (2017). The rice paradox: multiple origins but single domestication in Asian rice. Mol. Biol. Evol. 34, 969–979. doi: 10.1093/molbev/msx049
Choi, K. S., Chung, M. G., and Park, S. (2016). The complete chloroplast genome sequences of three Veroniceae species (Plantaginaceae): comparative analysis and highly divergent regions. Front. Plant Sci. 7:355. doi: 10.3389/fpls.2016.00355
Clement, W. L., and Donoghue, M. J. (2012). Barcoding success as a function of phylogenetic relatedness in Viburnum, a clade of woody angiosperms. BMC Evol. Biol. 12:73. doi: 10.1186/1471-2148-12-73
Conant, G. C., and Wolfe, K. H. (2008). GenomeVx: simple web-based creation of editable circular chromosome maps. Bioinformatics 24, 861–862. doi: 10.1093/bioinformatics/btm598
Dong, W., Cheng, T., Li, C., Xu, C., Long, P., Chen, C., et al. (2014a). Discriminating plants using the DNA barcode rbcLb: an appraisal based on a large dataset. Mol. Ecol. Resour. 14, 336–343. doi: 10.1111/1755-0998.12185
Dong, W., Liu, H., Xu, C., Zuo, Y., Chen, Z., and Zhou, S. (2014b). A chloroplast genomic strategy for designing taxon specific DNA mini-barcodes: a case study on ginsengs. BMC Genet. 15:138. doi: 10.1186/s12863-014-0138-z
Dong, W., Liu, J., Yu, J., Wang, L., and Zhou, S. (2012). Highly variable chloroplast markers for evaluating plant phylogeny at low taxonomic levels and for DNA barcoding. PLOS ONE 7:e35071. doi: 10.1371/journal.pone.0035071
Dong, W., Xu, C., Cheng, T., Lin, K., and Zhou, S. (2013). Sequencing angiosperm plastid genomes made easy: a complete set of universal primers and a case study on the phylogeny of Saxifragales. Genome Biol. Evol. 5, 989–997. doi: 10.1093/gbe/evt063
Dong, W., Xu, C., Li, C., Sun, J., Zuo, Y., Shi, S., et al. (2015). ycf1, the most promising plastid DNA barcode of land plants. Sci. Rep. 5:8348. doi: 10.1038/srep08348
Fazekas, A. J., Burgess, K. S., Kesanakurti, P. R., Graham, S. W., Newmaster, S. G., Husband, B. C., et al. (2008). Multiple multilocus DNA barcodes from the plastid genome discriminate plant species equally well. PLOS ONE 3:e2802. doi: 10.1371/journal.pone.0002802
Ge, S., Sang, T., Lu, B. R., and Hong, D. Y. (1999). Phylogeny of rice genomes with emphasis on origins of allotetraploid species. Proc. Natl. Acad. Sci. U.S.A. 96, 14400–14405. doi: 10.1073/pnas.96.25.14400
Hebert, P. D. N., Cywinska, A., Ball, S. L., and DeWaard, J. R. (2003). Biological identifications through DNA barcodes. Proc. Biol. Sci. 270, 313–321. doi: 10.1098/rspb.2002.2218
Huang, D. I., and Cronk, Q. C. B. (2015). Plann: a command-line application for annotating plastome sequences. Appl. Plant Sci. 3:apps.1500026. doi: 10.3732/apps.1500026
Katoh, K., and Standley, D. M. (2013). MAFFT multiple sequence alignment software version 7: improvements in performance and usability. Mol. Biol. Evol. 30, 772–780. doi: 10.1093/molbev/mst010
Kurtz, S., Choudhuri, J. V., Ohlebusch, E., Schleiermacher, C., Stoye, J., and Giegerich, R. (2001). REPuter: the manifold applications of repeat analysis on a genomic scale. Nucleic Acids Res. 29, 4633–4642. doi: 10.1093/nar/29.22.4633
Li, J., Wang, S., Jing, Y., Wang, L., and Zhou, S. (2013). A modified CTAB protocol for plant DNA extraction. Chin. Bull. Bot. 48, 72–78. doi: 10.3724/SP.J.1259.2013.00072
Rambaut, A. (1996). Se-Al: Sequence Alignment Editor. Version 2.0. Available at: http://tree.bio.ed.ac.uk/software/seal/
Ronquist, F., Teslenko, M., van der Mark, P., Ayres, D. L., Darling, A., Höhna, S., et al. (2012). MrBayes 3.2: efficient Bayesian phylogenetic inference and model choice across a large model space. Syst. Biol. 61, 539–542. doi: 10.1093/sysbio/sys029
Song, Y., Dong, W., Liu, B., Xu, C., Yao, X., Gao, J., et al. (2015). Comparative analysis of complete chloroplast genome sequences of two tropical trees Machilus yunnanensis and Machilus balansae in the family Lauraceae. Front. Plant Sci. 6:662. doi: 10.3389/fpls.2015.00662
Song, Y., Wang, S., Ding, Y., Xu, J., Li, M. F., Zhu, S., et al. (2017). Chloroplast genomic resource of Paris for species discrimination. Sci. Rep. 7:3427. doi: 10.1038/s41598-017-02083-7
Tamura, K., Stecher, G., Peterson, D., Filipski, A., and Kumar, S. (2013). MEGA6: molecular evolutionary genetics analysis version 6.0. Mol. Biol. Evol. 30, 2725–2729. doi: 10.1093/molbev/mst197
Tang, L., Zou, X.-H., Achoundong, G., Potgieter, C., Second, G., Zhang, D.-Y., et al. (2010). Phylogeny and biogeography of the rice tribe (Oryzeae): evidence from combined analysis of 20 chloroplast fragments. Mol. Phylogenet. Evol. 54, 266–277. doi: 10.1016/j.ympev.2009.08.007
Tong, W., Kim, T.-S., and Park, Y.-J. (2016). Rice chloroplast genome variation architecture and phylogenetic dissection in diverse Oryza species assessed by whole-genome resequencing. Rice 9:57. doi: 10.1186/s12284-016-0129-y
Wambugu, P. W., Brozynska, M., Furtado, A., Waters, D. L., and Henry, R. J. (2015). Relationships of wild and domesticated rices (Oryza AA genome species) based upon whole chloroplast genome sequences. Sci. Rep. 5:13957. doi: 10.1038/srep13957
Wang, H., Vieira, F. G., Crawford, J. E., Chu, C., and Nielsen, R. (2017). Asian wild rice is a hybrid swarm with extensive gene flow and feralization from domesticated rice. Genome Res. 27, 1029–1038. doi: 10.1101/gr.204800.116
Xu, C., Dong, W., Li, W., Lu, Y., Xie, X., Jin, X., et al. (2017). Comparative analysis of six Lagerstroemia complete chloroplast genomes. Front. Plant Sci. 8:15. doi: 10.3389/fpls.2017.00015
Yang, J., Vázquez, L., Chen, X., Li, H., Zhang, H., Liu, Z., et al. (2017). Development of chloroplast and nuclear DNA markers for Chinese oaks (Quercus subgenus Quercus) and assessment of their utility as DNA barcodes. Front. Plant Sci. 8:816. doi: 10.3389/fpls.2017.00816
Zhang, Q. J., Zhu, T., Xia, E. H., Shi, C., Liu, Y. L., Zhang, Y., et al. (2014). Rapid diversification of five Oryza AA genomes associated with rice adaptation. Proc. Natl. Acad. Sci. U.S.A. 111, E4954–E4962. doi: 10.1073/pnas.1418307111
Zhu, Q., and Ge, S. (2005). Phylogenetic relationships among A-genome species of the genus Oryza revealed by intron sequences of four nuclear genes. New Phytol. 167, 249–265. doi: 10.1111/j.1469-8137.2005.01406.x
Keywords: Oryza, chloroplast genome, DNA barcoding, variable markers, sequence divergence
Citation: Song Y, Chen Y, Lv J, Xu J, Zhu S, Li M and Chen N (2017) Development of Chloroplast Genomic Resources for Oryza Species Discrimination. Front. Plant Sci. 8:1854. doi: 10.3389/fpls.2017.01854
Received: 03 July 2017; Accepted: 11 October 2017;
Published: 25 October 2017.
Edited by:
Jacqueline Batley, University of Western Australia, AustraliaReviewed by:
Robert Henry, The University of Queensland, AustraliaAndrea Zuccolo, Sant’Anna School of Advanced Studies, Italy
Copyright © 2017 Song, Chen, Lv, Xu, Zhu, Li and Chen. This is an open-access article distributed under the terms of the Creative Commons Attribution License (CC BY). The use, distribution or reproduction in other forums is permitted, provided the original author(s) or licensor are credited and that the original publication in this journal is cited, in accordance with accepted academic practice. No use, distribution or reproduction is permitted which does not comply with these terms.
*Correspondence: Naizhong Chen, chennz@263.net.cn MingFu Li, limf9@sina.com