 Juan Carlos Suárez1,2,3*
 Milan O. Urban4
 Amara Tatiana Contreras1,2
 Jhon Eduar Noriega1,2
 Chetan Deva5
 Stephen E. Beebe4
 José A. Polanía6
 Fernando Casanoves7
 Idupulapati M. Rao4
- 1Facultad de Ingeniería, Programa de Ingeniería Agroecológica, Universidad de la Amazonia, Florencia, Colombia
- 2Facultad de Ingeniería, Programa de Maestría en Sistemas Sostenibles de Producción, Universidad de la Amazonia, Florencia, Colombia
- 3Centro de Investigaciones Amazónicas CIMAZ Macagual César Augusto Estrada González, Grupo de Investigaciones Agroecosistemas y Conservación en Bosques Amazónicos-GAIA, Florencia, Colombia
- 4International Center for Tropical Agriculture (CIAT), Cali, Colombia
- 5Climate Impacts Group, School of Earth and Environment, Institute for Climate and Atmospheric Science, University of Leeds, Leeds, United Kingdom
- 6Departamento de Biología Molecular de Plantas, Instituto de Biotecnología, Universidad Nacional Autónoma de México, Cuernavaca, Mexico
- 7CATIE - Centro Agronómico de Investigación y Enseñanza, Turrialba, Costa Rica
In our study, we analyzed 30years of climatological data revealing the bean production risks for Western Amazonia. Climatological profiling showed high daytime and nighttime temperatures combined with high relative humidity and low vapor pressure deficit. Our understanding of the target environment allows us to select trait combinations for reaching higher yields in Amazonian acid soils. Our research was conducted using 64 bean lines with different genetic backgrounds. In high temperatures, we identified three water use efficiency typologies in beans based on detailed data analysis on gasometric exchange. Profligate water spenders and not water conservative accessions showed leaf cooling, and effective photosynthate partitioning to seeds, and these attributes were found to be related to higher photosynthetic efficiency. Thus, water spenders and not savers were recognized as heat resistant in acid soil conditions in Western Amazonia. Genotypes such as BFS 10, SEN 52, SER 323, different SEFs (SEF 73, SEF 10, SEF 40, SEF 70), SCR 56, SMR 173, and SMN 99 presented less negative effects of heat stress on yield. These genotypes could be suitable as parental lines for improving dry seed production. The improved knowledge on water-use efficiency typologies can be used for bean crop improvement efforts as well as further studies aimed at a better understanding of the intrinsic mechanisms of heat resistance in legumes.
Introduction
The common bean (Phaseolus vulgaris L.) is the most important legume in people’s diet in the tropics of Latin America and East Africa (Beebe et al., 2008; Andrade et al., 2016; Polanía et al., 2016c; Asfaw et al., 2017). The majority of common bean production is from developing countries by small-scale producers (Polania et al., 2016a), where it is affected by climatic variations that limit its production (Beebe et al., 2013; Polania et al., 2016b). In an intermediate greenhouse gas emissions scenario, global average temperatures are predicted to increase by 2°C between 2041 and 2060 (IPCC, 2021), which may result in a loss of 50% of the area currently planted by 2050 (Beebe et al., 2011; Rippke et al., 2016; Rao et al., 2017).
Heat stress in bean cultivation generates a series of irreversible damages in the metabolism and development of plants (Omae et al., 2007, 2012; Porch and Hall, 2013; Sofi and Maduraimuthu, 2017; Suárez et al., 2020), according to observations made across different environments (Costa et al., 2000; Omae et al., 2012; Suárez et al., 2018a, b, 2020). At a physiological level, several processes are affected (Wentworth et al., 2006), photosynthesis is highly sensitive to high temperatures (Mathur et al., 2014) generating a decrease in the photosynthetic absorption of CO2 (Perdomo et al., 2016); the leaf senescence and expansion is reduced (Wahid et al., 2007) as well as the grain yield (Suárez et al., 2020).
Mainly, the rate of photosynthesis is affected by stomatal closure that limits the diffusion of CO2 from the stomata, through intercellular spaces and carboxylation sites through the resistance in mesophyll (Bigras, 2005; Cardona-Ayala et al., 2014), restricting growth and dry matter accumulation (Chaves and Oliveira, 2004; Amsalu et al., 2014). At the same time, the way they are affected is related to physiological responses such as transpiration, respiration, antioxidant activity, light absorption and capture (Lawlor and Cornic, 2002; Silva et al., 2010; Falqueto et al., 2017), electron transport capacity (Jmax), maximum carboxylation rate (Vcmax), (Dreyer et al., 2001; Yamori et al., 2006, 2008), ATP synthesis and the RuBP regeneration capacity (Wise et al., 2004).
Heat is one of the main constraints on plant adaptability and productivity (Omae et al., 2012), so plant water status is paramount under high temperature conditions as plants attempt to stabilize water content in their tissues (Fahad et al., 2017). Mechanisms of heat tolerance identified in plants include canopy acclimatization to a gradual increase in temperature (Hong et al., 2003), decreasing the thickness of the leaves (Crawford et al., 2012), and/or by increasing the stomatal conductance (gs), they sustain the diffusion of CO2 in the leaves, improving cooling from transpiration (Porch and Hall, 2013). In addition, some plants have the ability to maintain or increase instantaneous water use efficiency (WUE) by maintaining or increasing photosynthesis (Sofi and Maduraimuthu, 2017), mainly due to an overall improvement in the rate of carboxylation and its relative rate to oxygenation, by increasing the amounts of Rubisco and/or its specificity for CO2 (Parry et al., 2005; Galmes et al., 2014).
Water use efficiency (WUE) has been established as an important attribute that describes the efficiency of plants to use available water for carbon sequestration (Bramley et al., 2013). With rising temperatures and heat stress in the future, increasing WUE is vital for sustainable production (Farooq et al., 2019). Although WUE is a complex phenotypic trait (Araus et al., 2002; Easlon et al., 2014), it has been proposed that some plant traits can be based on the “water-saving” isohydric plant model or the “water-spending” anisohydric plant model (Blum, 2015). Polania et al. (2016a) identified water-saving bean genotypes that have the characteristic of better instantaneous WUE – producing more with less water and less gas exchange, unlike water-spending genotypes that exhibit better effective use of water (EUW) by maximizing water capture for more production with better gas exchange. However, these results were generated in lysimeter-like tubes, not in the field conditions.
Throughout its evolution and domestication, the common bean eventually formed two cultivated gene pools, the Mesoamerican gene pool and the Andean gene pool (Debouck and Smartt, 1995), originating in Central and South America (Gepts and Debouck, 1991). The genetic structure of the common bean has been frequently reviewed, because during its global domestication there have been changes in its morphological characteristics, including enlargement of seeds and leaves, alterations in growth habits and photoperiodic response, as well as changes in color and seed coat, leading to an increase in its genetic diversity that has allowed it to develop optimal responses under stress conditions (Singh et al., 1991; Long and Bernacchi, 2003; Mcclean et al., 2004). In this regard, the adverse effects of heat stress on common beans can be likely mitigated through the development of heat-resistant genotypes (Wahid et al., 2007). Understanding the mechanisms and/or physiological strategies of plants at high temperatures is necessary to develop breeding strategies to improve their adaptability (Beebe, 2012; Omae et al., 2012). The identification of heat-resistant bean lines can help to maintain production under conditions of increased temperature as a result of a climate change (Beebe et al., 2011; Beebe, 2012). In this regard, the objective for the present study was to identify the relationship between WUE as a high temperature resistance mechanism as well as identifying superior advanced lines (genotypes) of common beans with better heat resistance that contributes to better physiological performance and grain yield under heat stress. The study provides novel information on the physiological behavior and response mechanisms to high temperatures in different common bean genotypes in Western Amazonia. Results and suggestions can be used for crop improvement efforts and for studies aimed at a better understanding of the mechanisms of heat stress resistance in beans.
Materials and Methods
Experimental Site and Meteorological Conditions
The evaluation of the adaptation of bean materials was carried out at the Centro de Investigaciones Amazónicas CIMAZ Macagual, Universidad de la Amazonia (1°37’N and 75°36’W), located in Florencia, Caquetá (Colombia). Located in the moist climate of the tropical rainforest ecosystem, it exhibits an average annual precipitation of 3,800mm, 1700h of sunshine year−1, an average temperature of 25.5°C, and a relative humidity of 84%. Under greenhouse conditions the mean maximum and minimum temperatures were 33.8°C and 24.6°C, respectively, the mean daily temperature was 28.5°C and the mean relative air humidity was 56% (Figure 1). These evaluations were conducted in two periods [(1) October 2017 to January 2018; (2) August to November 2018] which corresponded to the driest part of the year and the highest air temperature compared to the other months of the year.
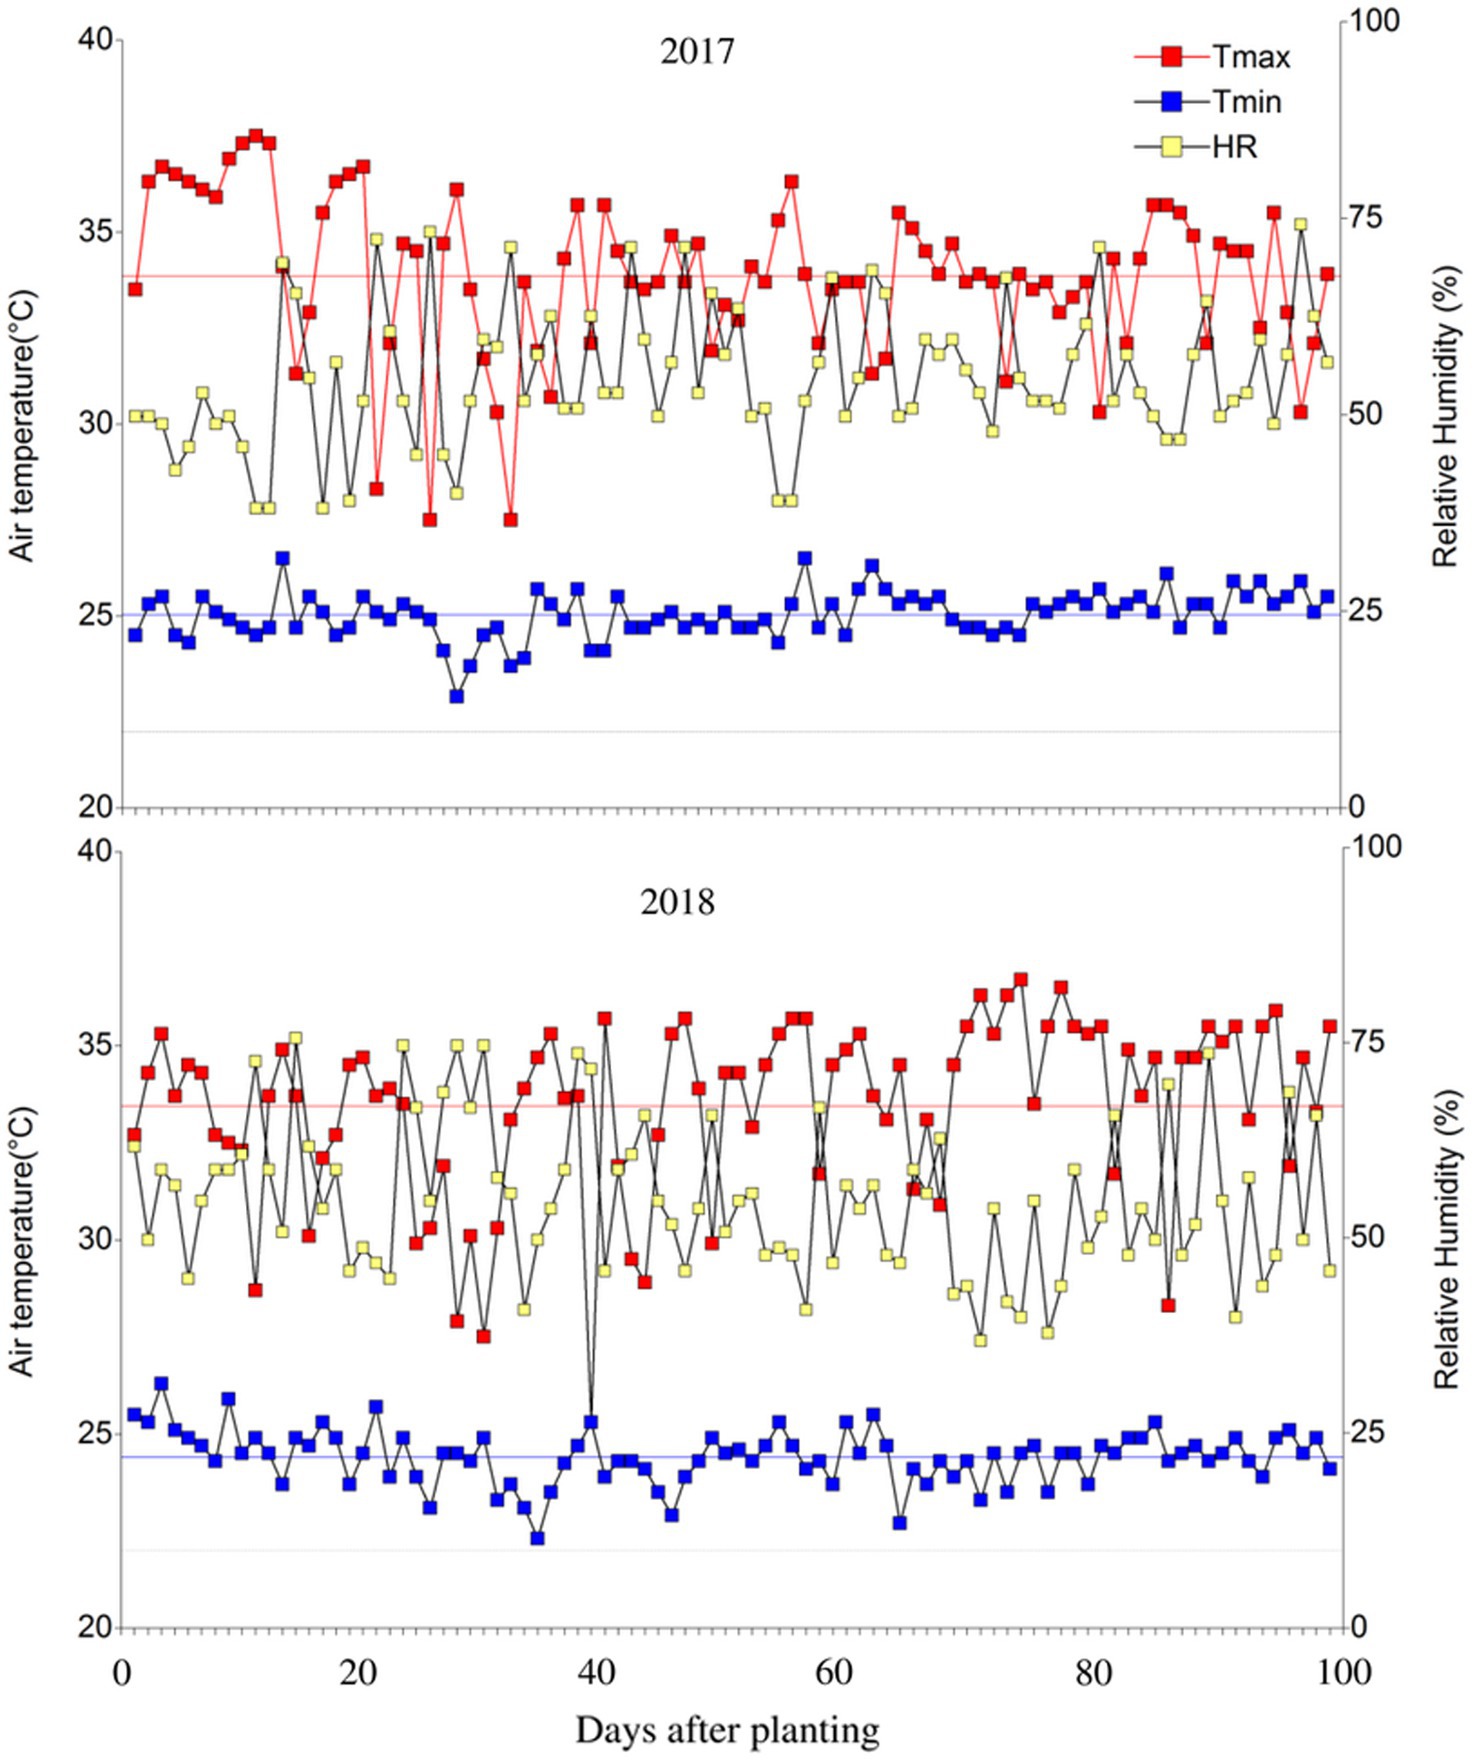
Figure 1. Distribution of maximum/minimum temperatures and relative humidity during the crop growing period under greenhouse conditions at Centro de Investigaciones Amazónicas CIMAZ Macagual, Universidad de la Amazonia, Colombia in two seasons (2017) and (2018). The black line is a mean temperature of 22°C. Red and blue line means the average of the maximum and minimum air temperature, respectively. 2017: Tairmax: 33.86±0.22°C, Tairmin: 25.03±0.06°C, RH: 56.19±0.94%. 2018: Tairmax: 33.45±0.24°C, Tairmin: 24.41±0.07°C, RH: 55.32±1.02%.
Plant Material and Experimental Design
A total of 64 bean genotypes were used in this study (Supplementary Table 1). The list include 32 advanced lines of Phaseolus vulgaris L. (ALB 348, BFS 10, BFS 35, DAB 295, DAB 525, ICA QUIMBAYA, SCR 40, SCR 45, SCR 56, SEN 136, SEN 52, SEN 70, SER 125,SER 271, SER 316, SER 323, SER 324, SER 48, SER 16, SMC 232, SMN 65, SMN 68, SMN 99, SMR 101, SMR 139, SMR 173, SMR 174, SMR 175, SMR 39, SXB 412, TIO CANELA 75, VAX 1), four Mesoamerican interspecific lines of P. vulgaris × P. coccineus (ALB 351, ALB 352, BFS 123, BFS 142), eleven Andean interspecific lines of P. vulgaris × (P. vulgaris × P. coccineus; RRA 3, RRA 31, RRA 57, RRA 60, RRA 69, RRA 78, RRA 80, RRA 81, RRA 93, RRA 103, RRA 124), one interspecific line from P. vulgaris × P. acutifolius (SER 212), 11 interspecific lines from P. vulgaris × P. acutifolius × P. coccineus (SEF 1, SEF 10, SEF 12, SEF 16, SEF 40, SEF 42, SEF 46, SEF 49, SEF 70, SEF 71, SEF 73), one Mesoamerican type with interspecific genes, generated through crossing [(ALB 74 × INB 841)F1 × RCB 593)], and four interspecific lines from P. vulgaris × P. coccineus which resulted in a group of Mesoamerican gene pool lines [ALB 121, ALB 191, ALB 210, ALB 60; F5:6 generation of SER16 × (SER16 × G35346-3Q); Butare et al., 2011]. The genotypes tested belong to the Mesoamerican or Andean gene pool and include elite and advanced lines for drought, aluminum resistance, heat, high micronutrient content and other desirable attributes that can improve grain production or market price. The ALB lines (small red kidney, black kidney) were developed for improved adaptation to drought and aluminum toxicity in acidic soil. The BFS (small red) lines have been developed to improve adaptation to low soil fertility and drought. The DAB (red mottled, red-pink) lines have been developed to improve adaptation to drought. The RRA (various colored) lines have been developed to improve resistance to root rots caused by Pythium and Sclerotium. The SEF, SER and SCR (small red), SEN (small black), SXB (cream) lines have been developed for improved adaptation to drought and heat. The SMC (various colored), SMN (black), SMR (red) lines have been developed to improve tolerance to drought with a high mineral (Fe) content in seed. The VAX (cream striped) line is sensitive to aluminum toxicity. The TIO CANELA 75 (small red kidney) commercial cultivar is recognized as drought sensitive. The ICA QUIMBAYA commercial cultivar is resistant to aluminum. Details on each line in terms of commercial class, gene pool, growth habit, classification and genetic background are provided in Supplementary Table 1. The morphophysiological data are provided in Supplementary Table 2.
A completely randomized plot design with three replications was used. Each experimental unit (advanced bean lines) consisted of a plot sown with three rows of two meters long, with a distance between rows of 0.6m and a spacing between plants of 15cm (equivalent to 11 plants m−2). The seeds were planted in a soil with an effective depth of 80cm of soil profile. The water availability was maintained at a field capacity during the whole experiment. It is a clay loam soil (Oxisol) with bulk density values that ranged between 1 and 1.3gcm−3, pH values that ranged from pH 4.1 to 5.2, with a mean organic carbon content of 1.35%, available P content (Bray-II) of 2.58mgkg−1, saturation of total bases of 7.1% (Ca: 0.38 cmol kg−1, Mg: 0.1 cmol kg−1, K: 0.14 cmol kg−1, Na: 0.1 cmol kg−1, total bases: 0.8 cmol kg−1), a cation exchange capacity of 11.3 cmol kg−1, and an exchangeable aluminum content of 6.3 cmol kg−1 with 73.4% of Al saturation.
Gas Exchange Parameters and Photosynthetic Light- and CO2-Response Curves of Common Bean Lines
The gas exchange parameters at leaf level, such as stomatal conductance (gs, mmol H2O m−2 s−1), transpiration rate (E, mmol H2O m−2 s−1), instantaneous water use efficiency (mmol CO2 mol−1 H2O), sub-stomatal CO2 concentration (Ci, μmol mol−1) were measured using an infrared gas analyzer CIRAS-3 Portable Photosynthesis System (PP Systems Inc. Amesbury, MA, United States) at a partial CO2 concentration of 400ppm under artificial photosynthetic active radiation (PAR) following the steps outlined by Suárez et al. (2018a,b), where the corresponding air temperature range at the time of the gas exchange measurements was 27.2 to 34.4°C. The stomatal limitation value (glim) was calculated using the following formula: glim=1− (Ci/Ca), according to Yin et al. (2006). With the difference between the air temperature and the leaf temperature (measured by the CIRAS-3 Portable Photosynthesis System) we calculated the leaf temperature differential (LTD). Gas exchange measurements were taken between 08:00 and 11:00h (solar time) on three fully developed leaves (located between the seventh and ninth leaf developed from the base of the plant) of each plant with three independent replications per genotype, at each monitoring period. The measurements of leaf gas exchange were made at the stage (later R7) when 50% of the pods have reached final length, which corresponds to a period of 50 to 70days after sowing, according to the BBCH scale for bean growth (BBCH 75; Meier, 2001).
The photosynthetic response curves to PAR intensity (henceforth, A/PAR) were generated by increasing PAR in ten steps from 0 to 2,000μmolm−2 s−1. Initially, the environmental conditions to which the leaves were exposed to in the CIRAS chamber were as follows: vapor pressure deficit (VPD) between 1.0 and 1.5kPa, leaf temperature of 25°C, and a partial concentration of CO2 of 50ppm for 5min to allow the stomata to open; subsequently A/PAR curves were obtained at a partial concentration of CO2 of 400ppm. In order to determine the photosynthetic limitations of common bean that result from the microclimatic conditions, the above data were used to calculate different parameters derived from the slope of the initial linear portion of the A/PAR curve (Bauerle et al., 2006): light-saturated maximum net carbon assimilation rate (Amax, μmol CO2 m−2 s−1), light compensation point (LCP, μmol m−2 s−1), dark respiration rates (Rd, μmol CO2 m−2 s−1), light saturation point (LSP, μmol m−2 s−1), and apparent quantum efficiency (ΦPAR, μmol CO2 μmol protons−1).
Photosynthetic assimilation response curves to internal CO2 concentration (henceforth, A/Ci) were made at a saturating light level of 1,300μmolm−2 s−1 (based on the A/PAR curves), at 25°C and ambient O2 concentration following the recommendations of Long and Bernacchi (2003). Measurements were initiated at a partial concentration of CO2 of 400ppm, which was gradually decreased to 50ppm and subsequently increased in 15 steps up to 1,600ppm of partial concentration of CO2 (Martins et al., 2013). Leakage errors were corrected by measuring the CO2 response curves in dead leaves following the recommendations of Flexas et al. (2007). Different parameters derived from each A/Ci curve were determined including maximum rate of ribulose-1,5-bisphosphate carboxylase/oxygenase (RuBisCO), carboxylation (Vcmax), maximum rate of electron transport driving regeneration of ribulose-1, 5-bisphosphate (RuBP; Jmax), and leaf respiration under light conditions (RD).
Calculation of Stress Index in a High Temperature Environment
To evaluate the agronomic yield upon high temperature environment, destructive sampling (85–90 DAS) was carried out in the central row of each plot, the pods of the harvested plants were threshed, and the grains were cleaned and oven-dried to determine their yield (kgha−1). Because in this study, control yields (yield not influenced by heat) were not available, the response of individual genotypes to heat stress in Western Amazonia was determined using three steps calculating genotype stress index (GSI). GSI in this sense serves the same as other stress indices, to eliminate the effect of intra- and inter-genotypic variability by showing the individual genotype yield in the context of the population median. The first step was to calculate yield reduction (YR) of each individual genotype per experiment [YR=Yj/Ÿ (%), where Yj=mean yield of individual genotype j, Ÿ=geometric mean of the whole experiment]. The YR serves as a first standardization of obtained genotype yield toward the geometric yield from the whole individual experiment (year repetition). The second step was to calculate general stress intensity index (SII) as a second data standardization using ratio of geometric means from all (in our study two) years of experiments [SII=1− (Ÿj/Ÿi), where Ÿj and Ÿi are geometric yields of all genotypes used in all experiments]. The third step was to calculate GSI for each particular genotype used in the study. The GSI was calculated using the following equation: GSI={1−[Ÿ (YRx1, YRx2)]}/SII, where Ÿ is the geometric mean, YRx1 or x2 is the yield change per genotype X in first (1) or second (2) year, and SII is general stress intensity index.
Statistical Analysis
The Michaelis–Menten hyperbolic constant was used to adjust the A/PAR curves; the parameters Amax, LSP, LCP, Rd, and ΦPAR were calculated following the equations described in Lobo et al. (2013). The model created by Farquhar et al. (1980) (the ‘FvCB model’) was used to evaluate the A/Ci curve and to estimate Vcmax, Jmax, and RD using the “plantecophys” package in R (Duursma, 2015). Pearson’s and Spearman’s correlation coefficients were calculated in order to determine significant relationships between variables, which were visualized in a string diagram. To determine the genotypes that best responded to high temperature conditions a scatterplot was used. Variables that affect grain yield (Assimilation A, stomatal conductance gs and leaf temperature depression LTD), or Transpiration (E) were plotted on the X-axis. As the dependent variable, grain yield was plotted on the Y-axis. Four quadrants were visualized by plotting the corresponding averages on each axis.
Due to the non-linear behavior of A the model adjustment was carried out using linear segment models with two segments given by the following function where is the intercept, is the slope of the first segment, γ is the point at which the segments join, and is the slope of the second segment. The value obtained from the point at which the segments joined, a linear mixed model (LMM) to perform a covariance analysis using genotype as a class variable and ambient temperature as a covariate for gs and A as response variables was prepared. This point corresponds to the maximum ambient temperature value at which the A took a linear segment direction. For each genotype we calculated the mean expected value for responses (gs and A) when temperature was 27.74°C. With these estimated values we performed a scatter plot of A against gs and included a label for each genotype.
Bean genotypes were grouped using all physiological and bean yield variables using cluster analysis for those genotypes that have higher photosynthetic efficiency in relation to instantaneous WUE values as well as those that had higher heat tolerance allowing to maintain bean yield in advanced common bean lines. With the conformed bean genotypes typologies, a principal component analysis (PCA) was also performed and the effect of the leaf temperature depression on the different physiological mechanisms to maintain a higher photosynthetic efficiency was tested by means of a Monte Carlo permutation test. The ANOVA using LMM was adjusted to analyze the effect of the fixed factor (Genotype). Plots associated with genotypes within the monitoring period (repeated measurements) were included as random effects. The assumptions of normality and homogeneity of variance were evaluated using an exploratory residual analysis. Differences between genotypes were analyzed with Fisher’s post hoc LSD test with a significance of α=0.05. The LMM were made using the lme function in the nlme package, the cluster analysis, PCA and the graphic outputs were made in the packages “ade4,” “ggplot2,” “factoextra” and “corrplot” in the R language software, version 3.4.4 (R Development Core Team, 2019), by the interface in InfoStat (Di Rienzo et al., 2019).
Results
Relationships Between Physiological Variables and Grain Yield With High Temperature
The high air temperature had a negative effect on common bean genotypes by decreasing carbon assimilation (A, r=−0.42, p<0.001 r=coefficient of correlation) due to the reduction in stomatal conductance (gs, r=−0.75, p<0.001) and substomatal CO2 concentration (Ci, r=−0.57, p<0.001) which resulted in lower grain yield (GY, Table 1). Likewise, when the air temperature increases, some genotypes increase WUE (r=0.63 between LTD and WUE p<0.001), generating processes of stomatal limitation to photosynthesis (r=0.60 between LTD and glim p<0.001). For an adequate grain yield, carbon fixation must be high (r=0.51, p<0.001 between A and GY), increasing gs, resulting in a transpiration cooling mechanism (r=0.36, p<0.001 between A and gs; r=0.51, p<0.001 between A and E, respectively). Furthermore, this characteristic negatively affects the efficient use of water (r=−0.88 between E and WUE p<0.001). There were other characteristics such as LSP which was positively related to both GY and A, as well as to E.
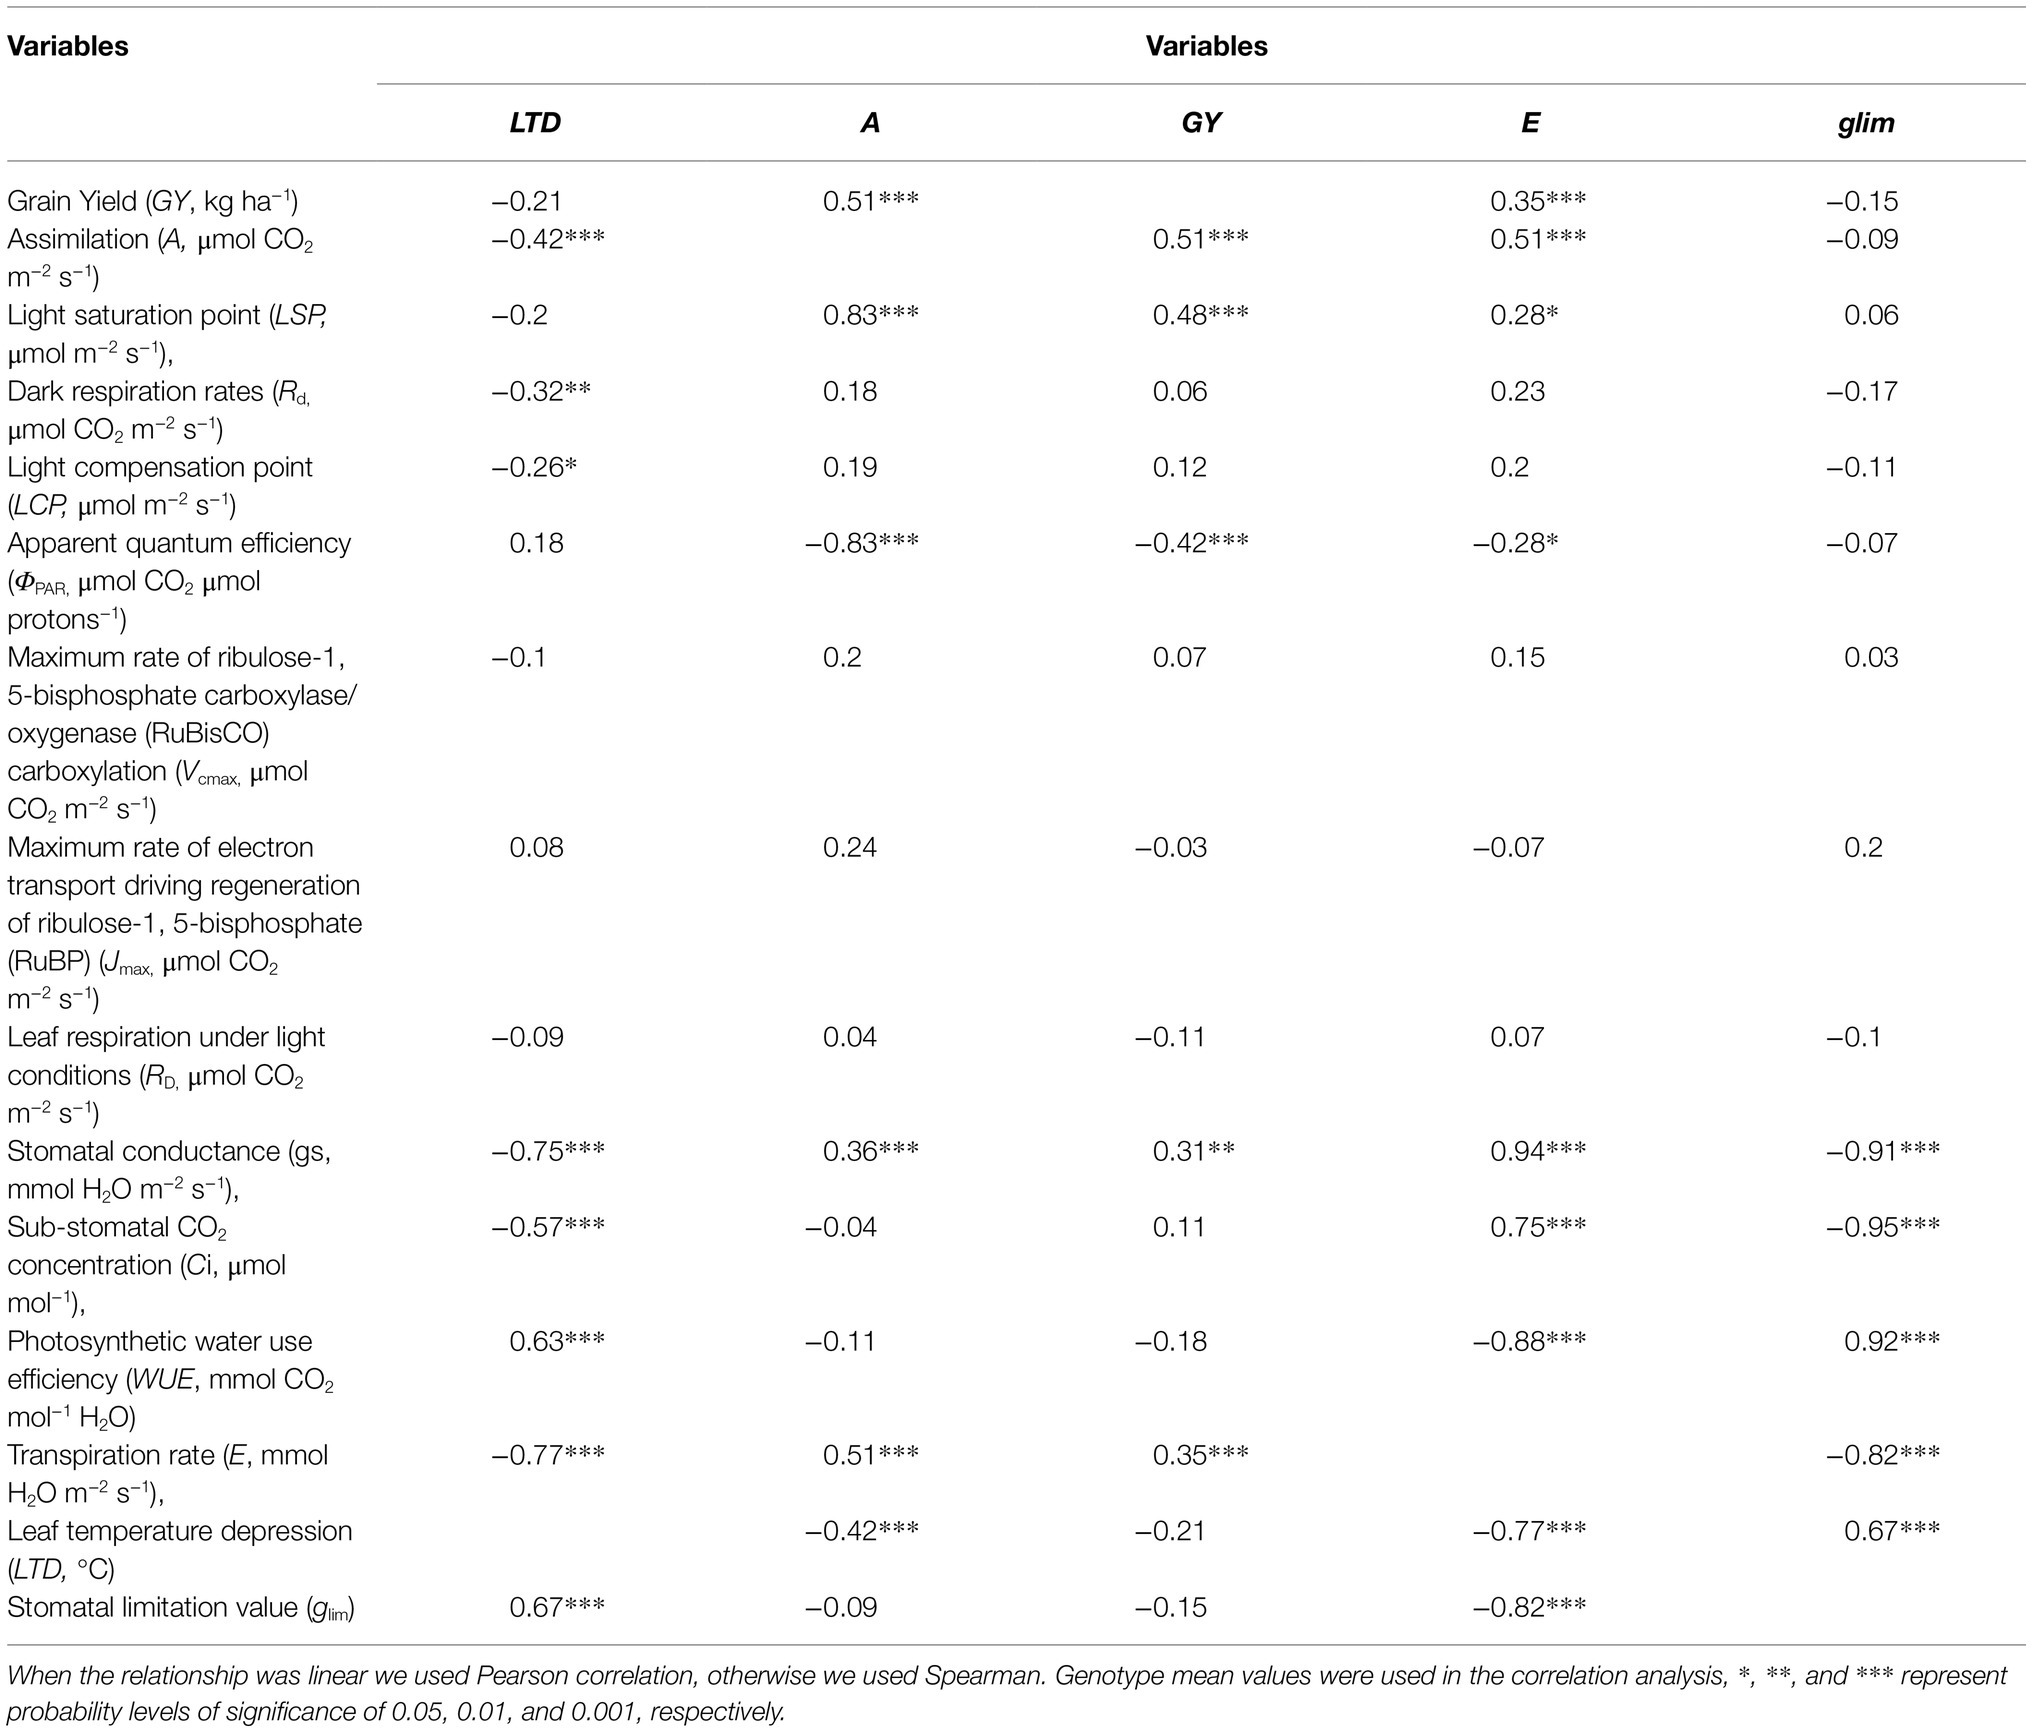
Table 1. Correlation coefficients (r) between grain yield (GY), assimilation (A), leaf temperature depression (LTD), transpiration (E) and stomatal limitation (glim) values and physiological traits at the leaf level of 64 genotypes of bean grown under conditions of high temperature.
We summarized the weather characteristics of the main growing season in Florencia for the years 1984–2014 (Figure 2). The growing season is characterized by higher values of maximum and minimum temperatures and plenty of rainfall in the first half of the season. Relative humidity is extremely high in this tropical rainforest environment and when combined with low wind speeds leads to very low values of VPD throughout the season. This suggests weaker atmospheric demand for water than would be the case in most bean growing regions. Average daily maximum temperatures greater than 30°C and average daily minimum temperatures greater than 20°C are thought to reduce bean yields (Porch et al., 2010). Between the years 1984 and 2014, approximately a third of growing seasons experienced at least 1day in which maximum daily temperatures exceeded 30°C between 20 and 60days into the growing season (Figure 3). Average daily minimum temperatures of greater than 20°C were experienced in all growing seasons between 20 and 60days into the growing season. This suggests that high nighttime temperatures are more of a production risk than high daytime temperatures in Florencia.
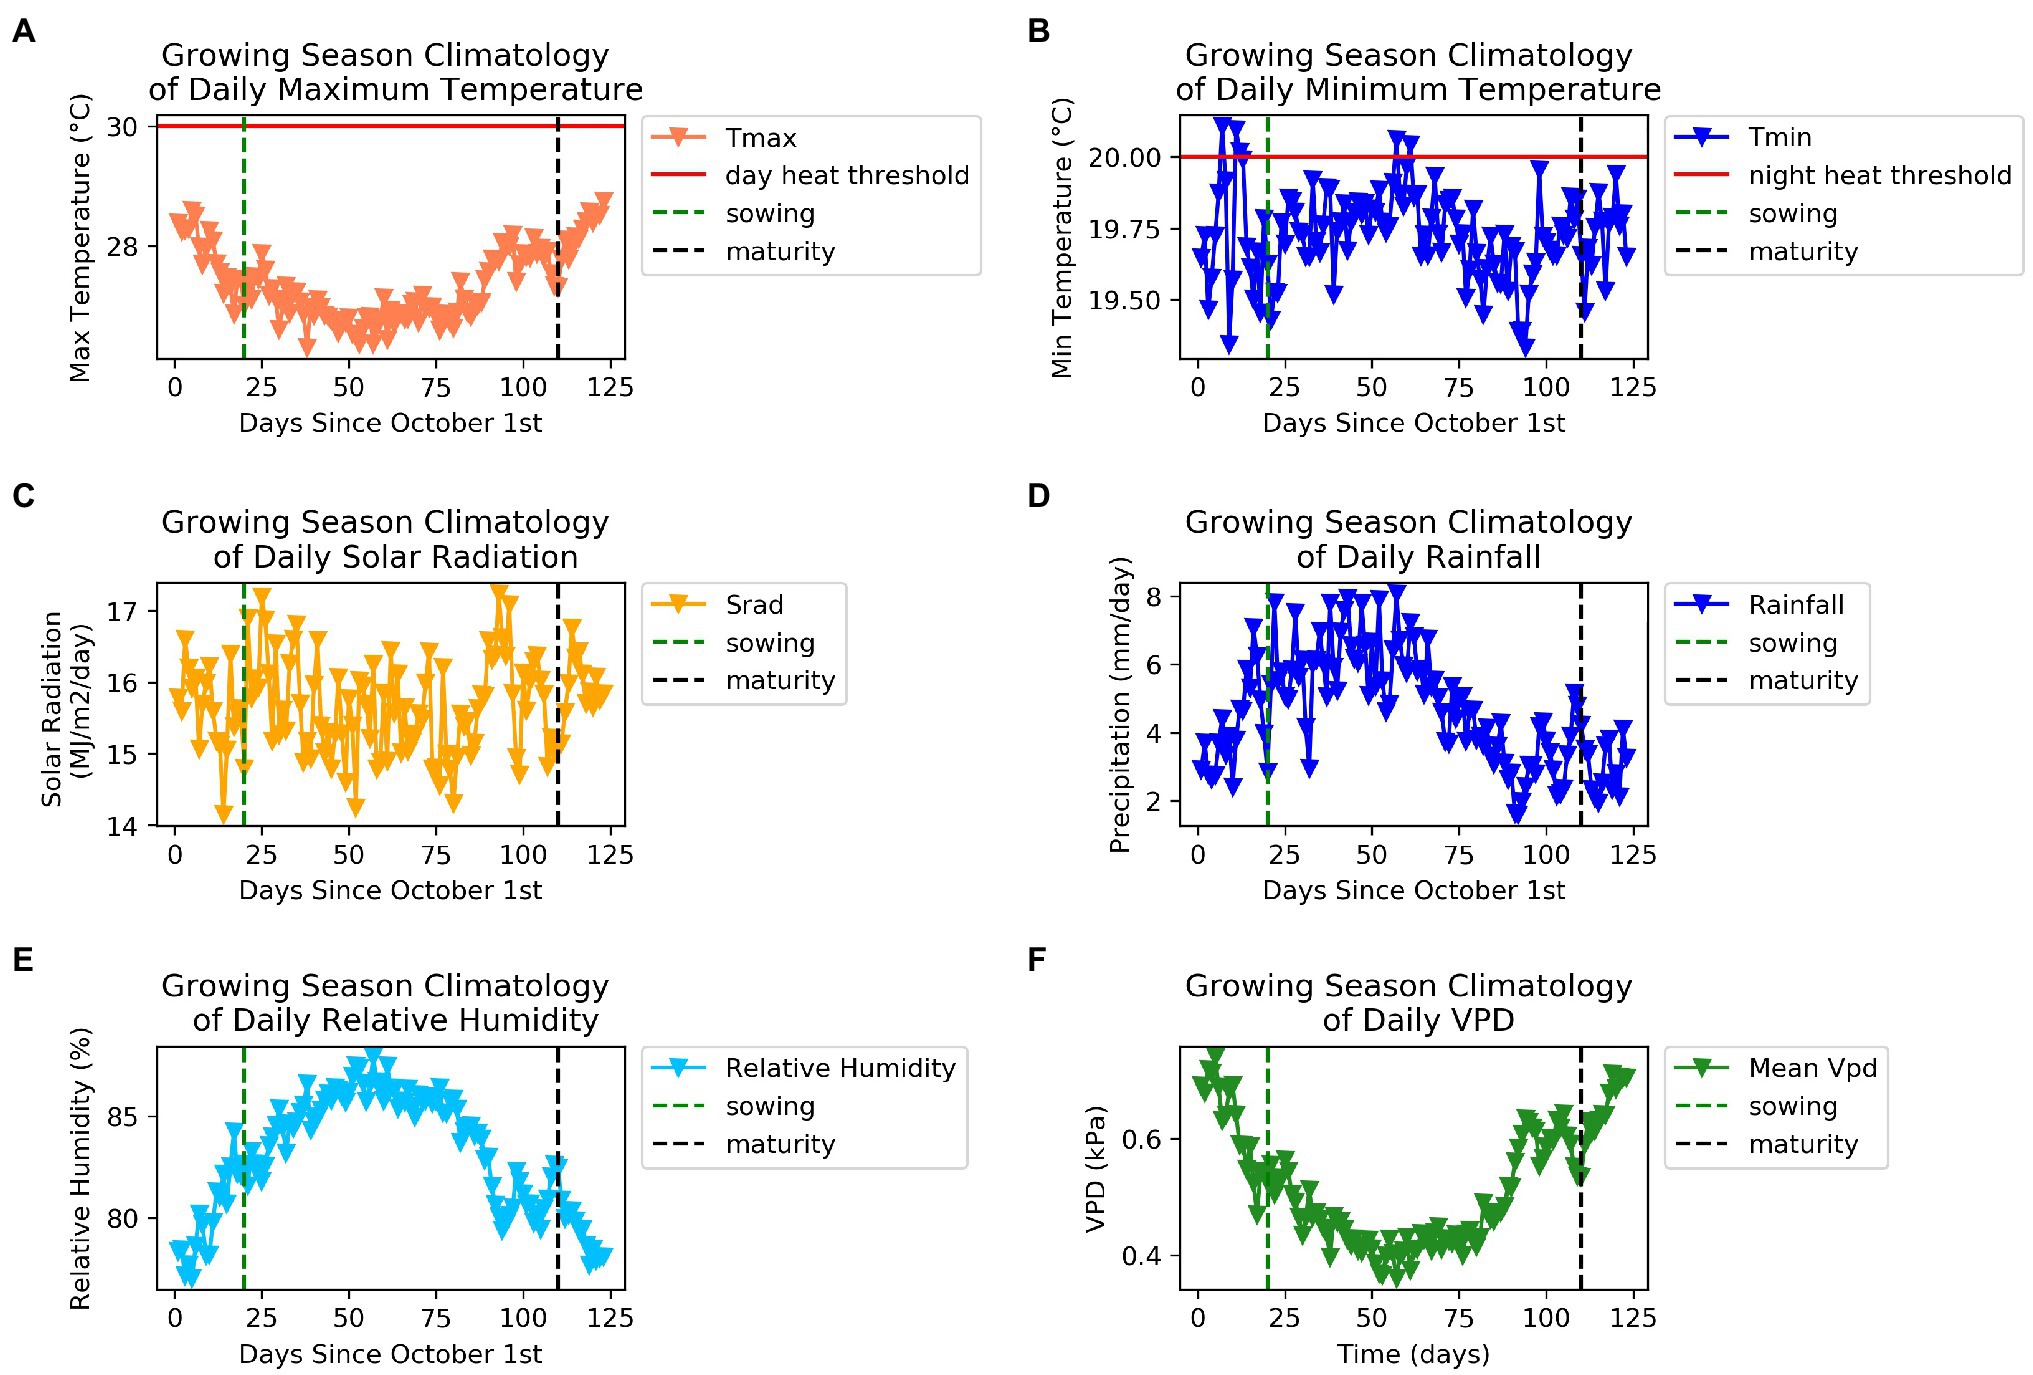
Figure 2. Weather characteristics of the main growing season in Florencia for the years 1984–2014 (A) Daily maximum temperature (°C), (B) daily minimum temperature (°C), (C) daily solar radiation (MJm−2 day−1), (D) daily rainfall (mmday−1), (E) relative humidity (%), (F) daily vapour pressure deficit (kPa).
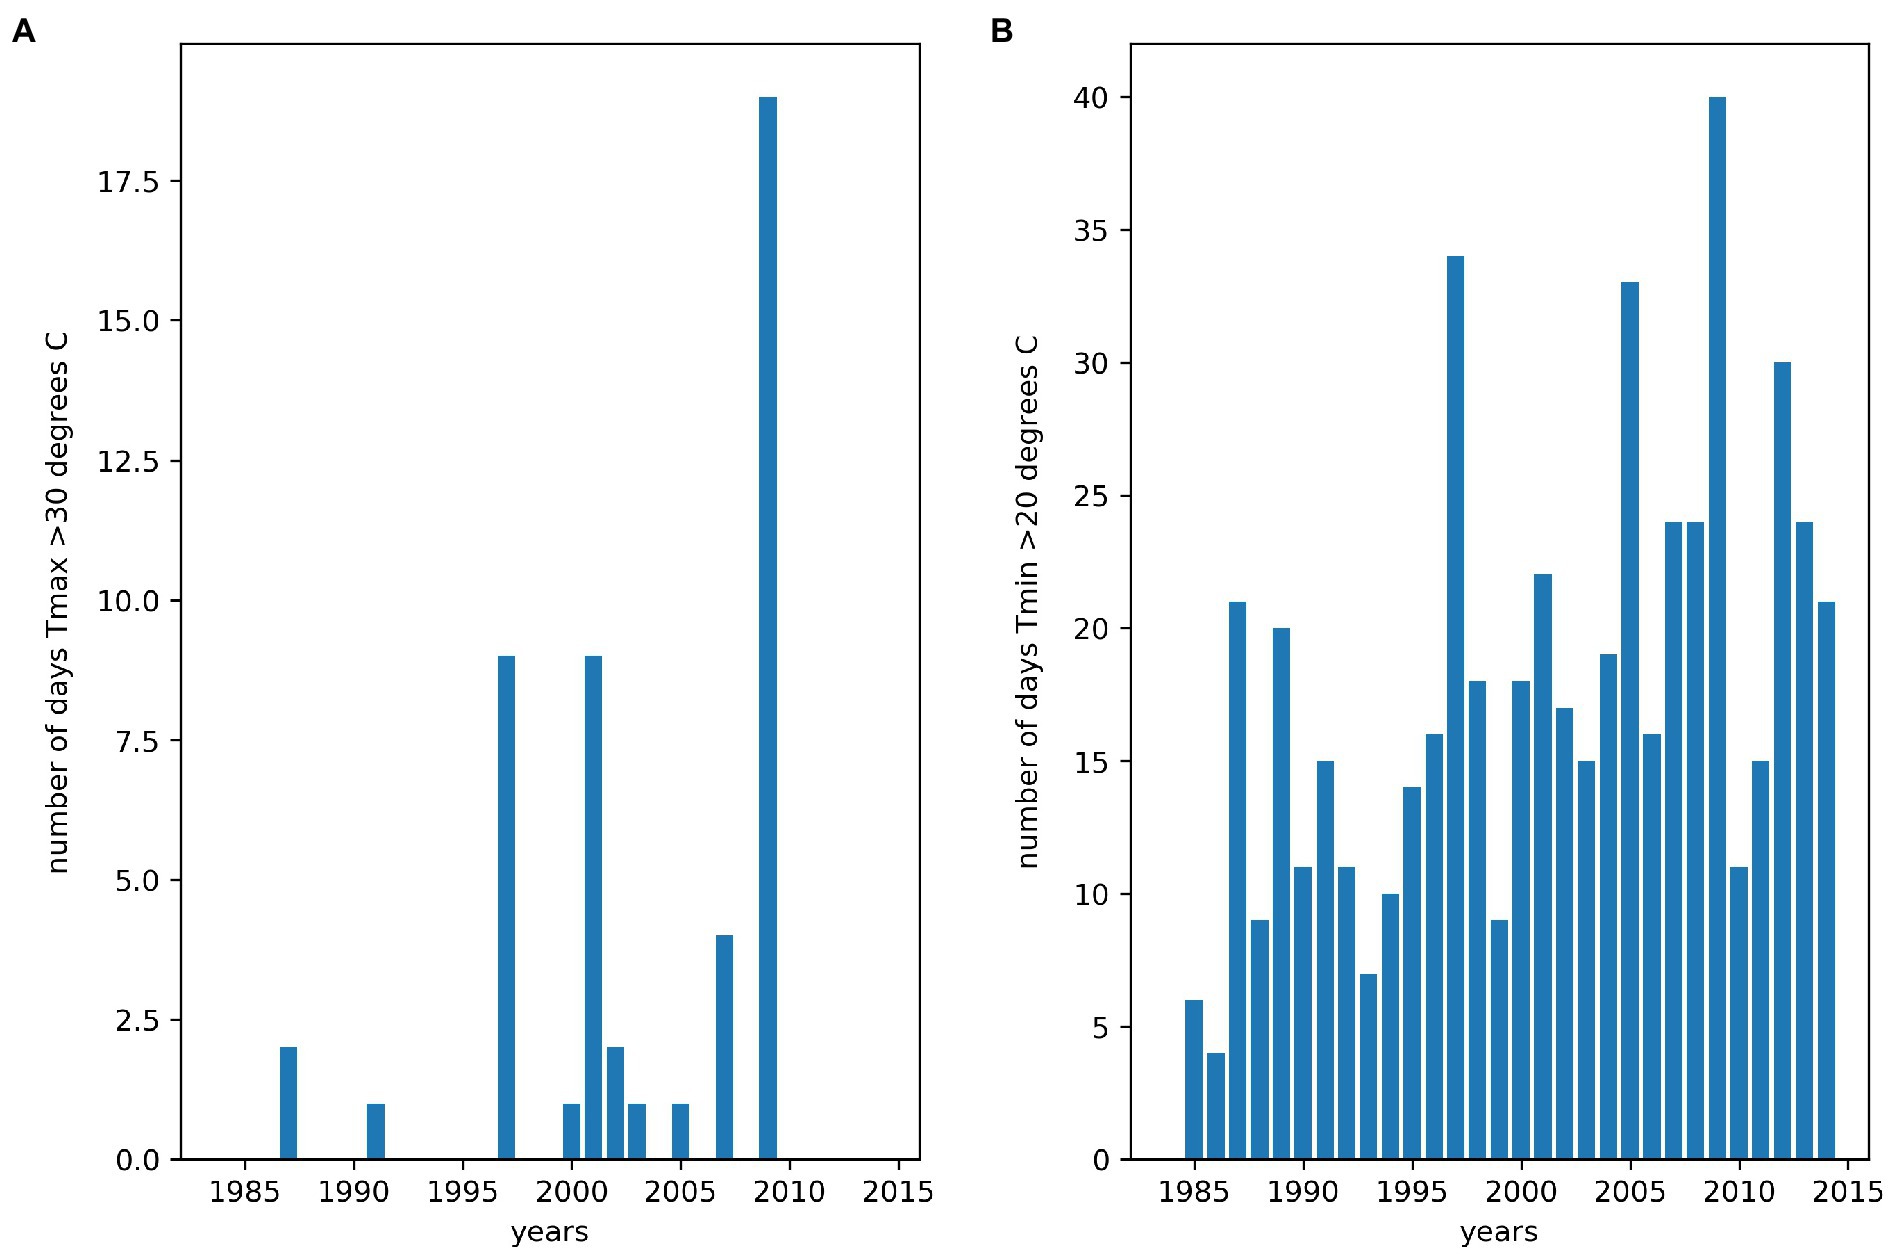
Figure 3. Number of days daytime and nighttime thresholds were exceeded between 20 and 60days into the main growing season for the years 1984–2014 in Florencia. (A) day time heat stress thresholds were exceeded, and (B) night time heat stress thresholds were exceeded.
Physiological Characteristics Among Common Bean Genotypes When Grown Under High Temperature Conditions
Chord diagram of correlation coefficients between agronomic and physiological traits at leaf level of 64 genotypes of bean grown under conditions of high temperatures is presented in Figure 4.
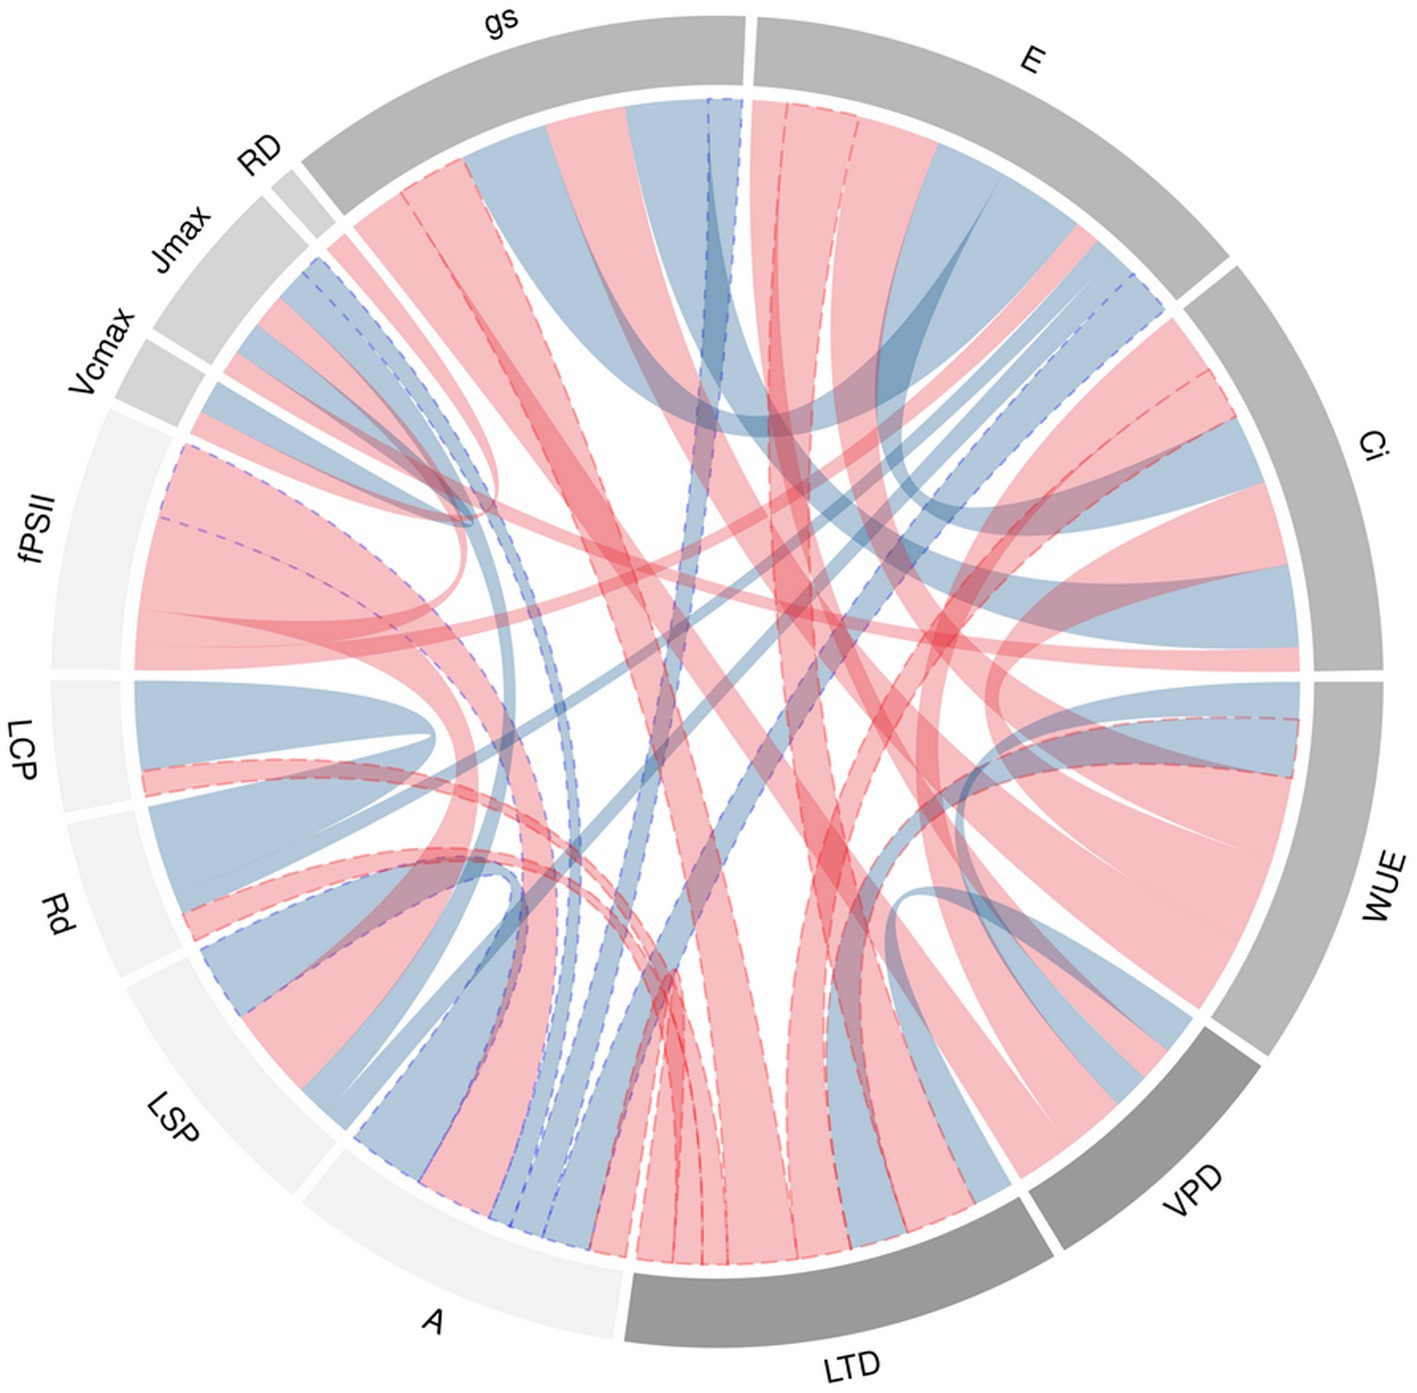
Figure 4. Chord diagram of correlation coefficients between agronomic and physiological traits at leaf level of 64 genotypes of bean grown under conditions of high temperatures. The ribbons within the circle correspond to significant correlations with a p<0.05. The red ribbons indicate negative coefficients and the blue ribbons indicate positive coefficients. The ribbons with blue and red dotted lines are the relationship of A and LTD to the different variables whose correlation was statistically significant. The acronyms are described in Table 1.
In general, grain yield (GY) of the 64 bean genotypes ranged from 336 to 1,614kgha−1 with an average value of 957kgha−1 (Table 2). The genotypes with the higher values of GY were BFS 10, SEN 52, SER 323, SCR 56, SEF 10, SEF 40, SEF 70, SEF 73, SMR 173 and SMN 99 with a production value higher than 1,300kgha−1. Within the genotypes that have higher GY, differences were found at the LTD level (Supplementary Figure 1A). For example, BFS 10, SMN 99 were the genotypes with higher E, which translated into a lower LTD (more negative), contrary to what was found in the different SEFs lines (SEF 10, SEF 40, SEF 70, SEF 73), SMR 173, SER 323, and SEN 52. Some genotypes found in the lower left quadrant (SER 48, ALB 348, RRA 80) have low E and positive LTD which negatively affected A and GY. However, sometimes this mechanism was not efficient enough in the process of grain formation (ALB 121, SEF 14, SEF 12) probably because of additional effects from soil constraints.
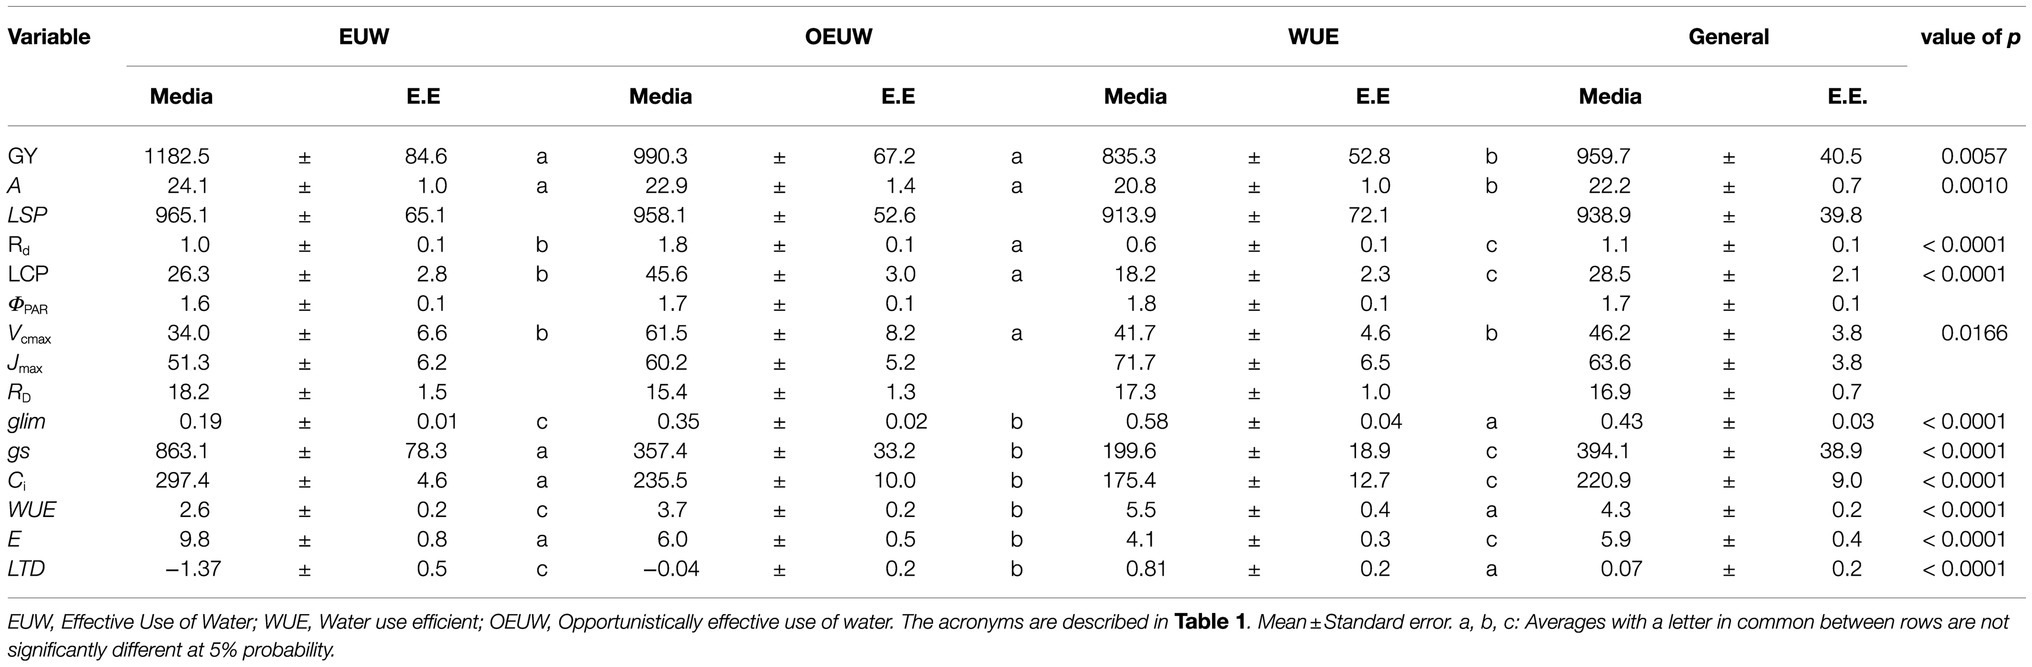
Table 2. Physiological variables of the different types of common bean genotypes grown at high temperatures.
The BFS 10 showed the highest value of gs and GY, but also high E that affected LTD. Interestingly, the SCR 56 and several SEFs lines (SEF 10, SEF 40, SEF 70, SEF 73) showed opposite behavior characterized by low gs, high glim, and a high GY. We found that for low left quadrant genotypes that have low gs, the glim was higher, and therefore, the leaf temperature was higher than the air temperature (positive LTD) with negative effect on GY. Other genotypes with similarly high GY values presented a lower E and high WUE that caused higher leaf temperature than air temperature (Supplementary Figure 1D).
When analyzing the effect of increased air temperature on carbon assimilation and its effect on water use efficiency, we found that some genotypes had higher E and therefore more negative LTD, a mechanism that allowed higher A (Supplementary Figure 2A). In particular, the SCR 56, SEN 52, and SEF 40 genotypes presented both higher WUE and A. This higher efficiency is mainly due to the maximum rate of RuBisCO carboxylation (Vcmax) presented specifically for SEF 40 (Supplementary Figure 2B). The physiological performance of ALB 352 and SMR 152 which presented higher A with lower Vcmax and GY value higher than 1,100kgha−1 due to a low glim (Supplementary Figure 2C) is worth mentioning. As the air temperature increases, glim increases, decreasing Ci and consequently the A. In this sense, we described two interesting groups of bean genotypes [(1) SMN 99, SMN 95, SEF 14, ALB 121 and SMR 123, and (2) ALB 352, SMR 174, and SEN 52] which with similar Ci, achieved high carbon assimilation [A, in group (1) 22, and group (2) 30μmol CO2 m−2 s−1, respectively] under very different leaf temperatures. These two responses suggest different physiological behavior as mechanisms of leaf-lead air temperature dissipation and reveal a physiological or biochemical player in the background (Supplementary Figure 2C). A reduction of the ΦPAR was found related to increase of LSP (SCR 56, SEF 70 and SEF 10; Supplementary Figure 2D), which affects the assimilation of carbon (A) and a maximum rate of electron transport driving regeneration of ribulose-1, 5-bisphosphate (RuBP; Jmax). These genotypes were able to achieve very high GY (above 1,450kg) despite leaf temperatures more than +1°C above ambient temperatures (Supplementary Figures 1D and 2D).
Two-segment model between the ambient temperature and A showed the point at which the segments join. In our study, this point was found at 27.74°C (Figure 5A). This point reveals the air temperature at which A reaches its maximum and then stays linear, with a slope of 0.63 (p<0.001). From the historical climate information, we found 85days of the year that have values higher than 27.74°C, distributed in two periods of the year that correspond to Julian days 1 to 53 (between the months of January to February) and Julian days 243 to 284 (that correspond to the whole month of October and first week of November; Figures 5B,C).
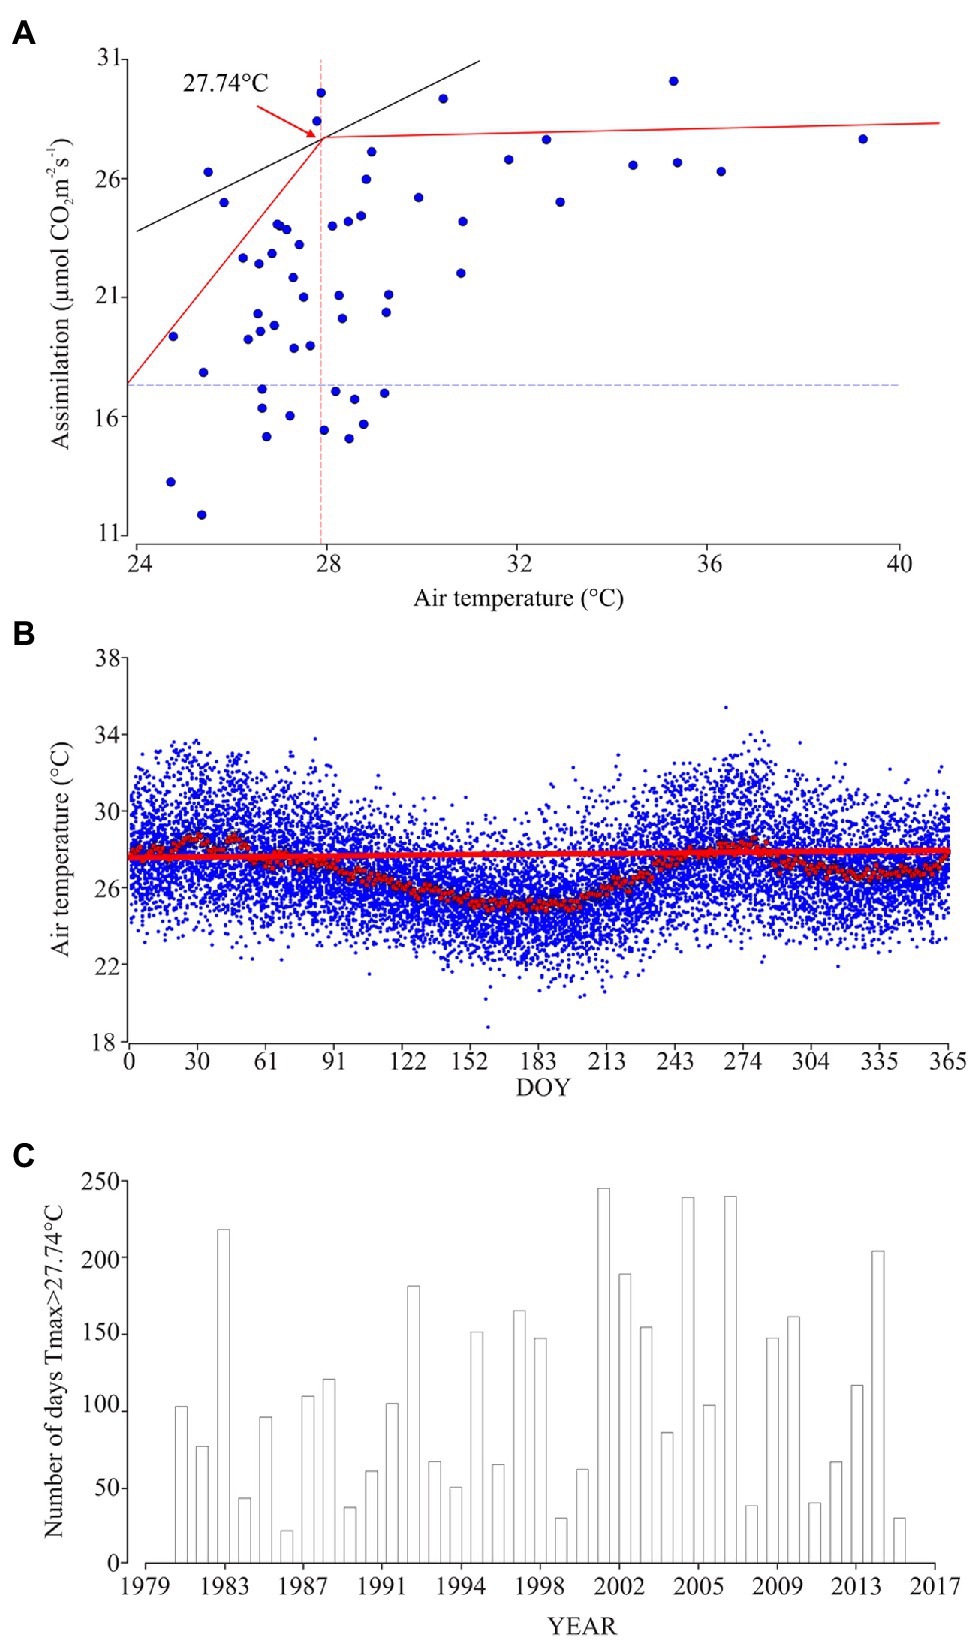
Figure 5. Relationship between physiological behavior and air temperature. (A) Linear segments model between ambient temperature and A: Red line is the path of the adjusted linear segment model, of the value 27.74°C, which corresponds to γ (the point at which the segments join). This point allows one to determine the maximum temperature threshold at which the bean under normal conditions performs the carbon fixation process effectively without enzymatic or morphological restrictions. (B) Daily temperature behavior between 1979 and 2017 (blue points); red points are the averages and standard error for each day (n=38years). Red line corresponds to γ at which the segments join 27.74°C. (C) Number of days in each year with maximum temperature values above 27.74°C.
Water Use as a Mechanism to Tolerate High Temperatures
According to the cluster analysis of different variables taken from the 64 bean genotypes, three statistically different groups with contrasting physiological mechanisms to tolerate high air temperature were found. According to their physiological traits, we divided the bean genotypes into: (1). WUE: Water Use Efficiency, (2). EUW: Effective use of water, and (3). OEUW: Opportunistically effective use of water (Figure 6). These typologies were generated by trait differences (p<0.0001) using leaf temperature differential (LTD), instantaneous water use (WUE), the transpiration (E), gas exchange (gs), gasometric limitation caused by air temperature increase (glim), and carbon use and fixation (Ci, Rd, LCP and Vcmax).
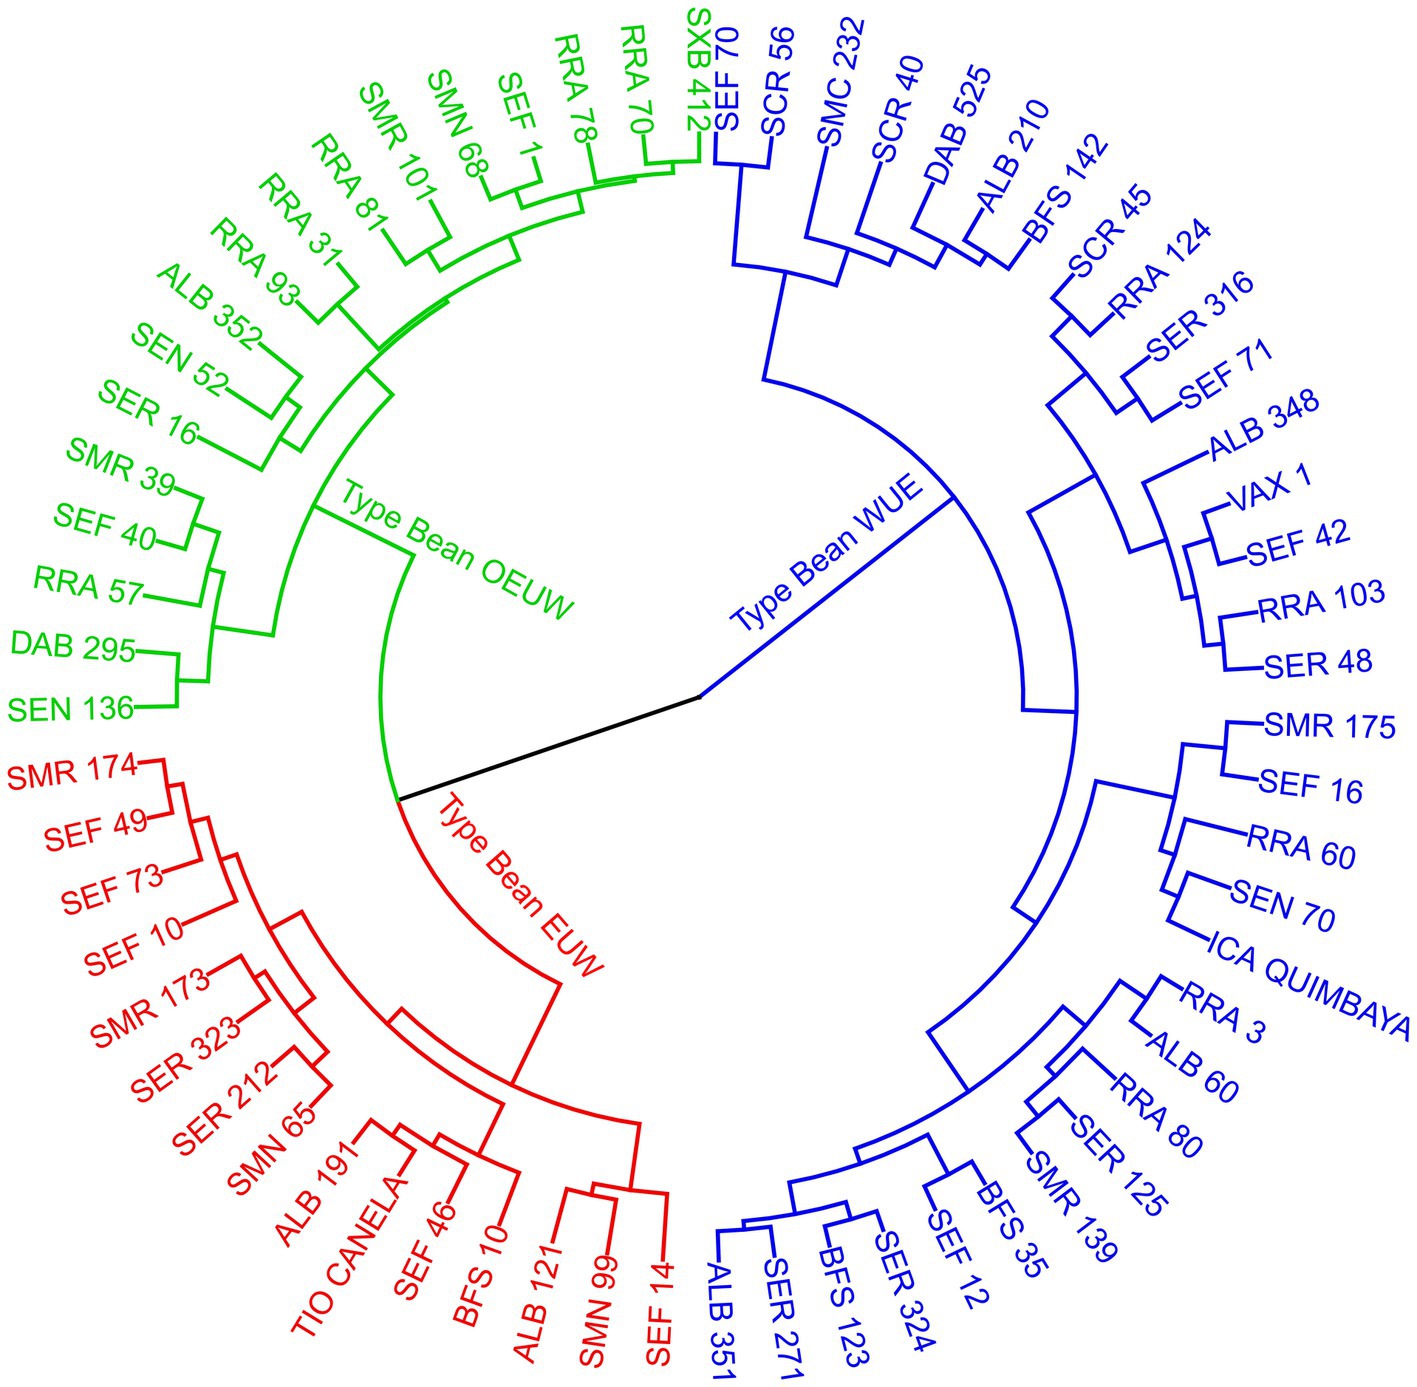
Figure 6. Dendrogram (method Ward, Euclidean distance) showing the different typologies of common bean genotypes grouped by different physiological variables (Table 1) cultivated at high temperatures. EUW; Effective Use of Water, WUE; Water use efficient, OEUW; Opportunistically effective use of water.
The PCA (Supplementary Figure 3A) related to gas exchange (gs, glim), water use (WUE, E), intracellular carbon (Ci) and leaf temperature differential (LTD) is clearly opposed along axis 1 (32.8% of variance can be explained), separating genotypes with contrasting differences in heat dissipation strategy and water use. Axis 2 (20.5% variance can be explained) opposed genotypes with characteristics related to ΦPAR and LSP. The separation of bean genotype into three typologies according to physiological traits was significant and explained 30% of the total variance according to the Monte Carlo test (Supplementary Figure 3B).
Below we describe the representative typologies. We take only those genotypes with a GY higher than 1,200kg to eliminate genotypes with very low yield potential or heavily damaged ones. The main differences are due to most of the variables considered in this study. However, LSP, ΦPAR, Jmax and RD did not show statistical differences in the typologies (Table 2).
Genotypes With EUW (n=14; 21.8% of the Total Genotypes Evaluated)
This group on average has a grain yield of 1,182kg, represented by genotypes such as BFS 10, SER 323, SMN 99 (Phaseolus vulgaris) and SEF 10, SEF 46 and SEF 73 (P. vulgaris, P. acutifolius and P. coccineus interspecific). The two important mechanisms involved (transpiration and thermal dissipation by LTD) reduced glim, increasing gs and Ci, and therefore carbon fixation (A, Table 2), resulting in high GY. The negative LTD values (i.e., the leaf is cooler than the air temperature), should be involved as a heat resistant genotype trait (similar trend is observed in second typology, WUE; Deva et al., 2020). Not surprisingly, when analyzing the correlations between the different variables for this typology, we found that gs exhibited high values in this group (Figure 7). Taken together, the high GY, with high gs and E, and consequently low leaf temperature, allows categorization of this group as heat resistant genotypes with profligate water spenders traits (similarly to Blum, 2009).
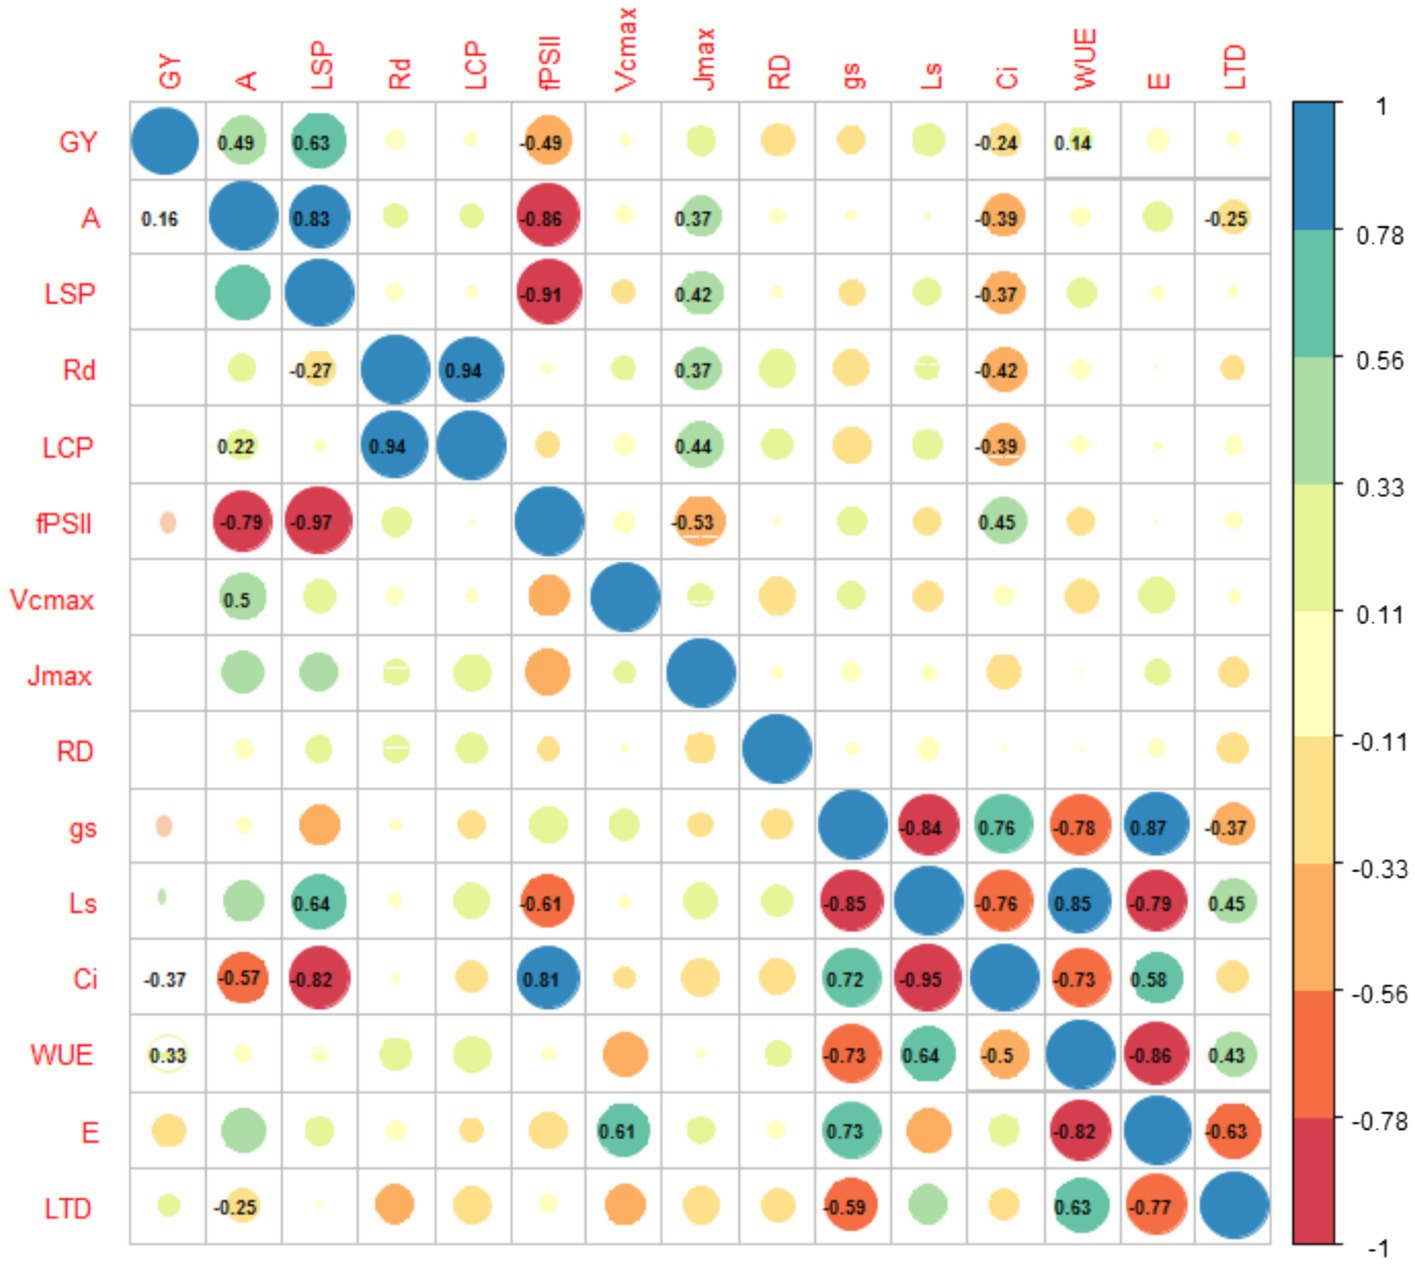
Figure 7. Correlation between the different physiological variables of different genotypes grown at high temperatures. Below and above the diagonal, values correspond to the correlations for the EUW (Effective Use of Water) and WUE (Water use efficient), respectively. The blue and red are the positive and negative correlation, respectively, accompanied by the magnitude of the correlation by the size of the circle. Only significant correlations (p<0.05) appear within the circles. The acronyms are shown in Table 1.
Water Use Efficient Genotypes (n=30; 46,8%)
This group is represented by genotypes such as SEF 70 (P. vulgaris, P. acutifolius, and P. coccineus interspecific) and SCR 56 (Phaseolus vulgaris) with GY of 1,493 and 1,479kgha−1, respectively. The average GY for this typology is 835kgha−1. This group represented the highest values of WUE, hence its name. This high efficiency had a notable impact on the capacity to carry out gas exchange processes, reducing Ci and E, which increased glim. In turn, the decrease in E was followed by increased LTD (Leaf temperatures were sometimes higher than air temperatures). Despite this, SEF 70 and SCR 56 showed higher capacity of translocation of photoassimilates (enhanced seed filling) likely because of their high LSP which translated into an increase in the maximum rate of electron transport driving regeneration of ribulose-1, 5-bisphosphate (RuBP; Jmax). This resulted in an increase in the maximum rate of RuBisCO carboxylation (Vcmax). The efficiency of the PSII is also demonstrated as it was able to regulate the excess energy and to carry it along the electron transport chain. The correlations of this typology were largely related to those variables related to carbon use (A, Rd, LCP), as well as reduced Ci, since this typology has a high glim (Figure 7).
This group demonstrates typical conservative traits of the water savers group (high WUE, positive LTD, high glim, low E, gs, Ci etc.). Generally, in some terminal drought scenarios, these traits can increase final GY. However, the lowest A, Rd and LCP which altogether surely lead to lowest GY proved that conservative crop behavior can significantly decrease the yield potential upon heat in Western Amazonia (in agreement with hypotheses postulated in Deva et al., 2020). However, our recommendations are that water savers should be selected only if they reach above-average yield and should not be automatically neglected in breeding programs for increasing resistance to heat, especially for their water-saving tendencies. In our study, some genotypes from this group showed different pathways to heat resistance. Although the real crop water consumption was not measured in this study and the field was irrigated up to field capacity, based on heat-influenced gasometric values (A, gs) we can postulate this group as conservative in water use despite water availability.
Genotypes With OEUW (n=20; 31,2%)
This group of bean genotypes had an average GY of 990kgha−1, which was statistically higher than the WUE typology. The group is characterized by genotypes such as SEN 52, SMR 173, and SMR 39 (Phaseolus vulgaris) with yields of 1,608, 1,346 and 1,205kgha−1, respectively, as well as SEF 40 (P. vulgaris, P. acutifolius and P. coccineus) with a yield of 1,557kgha−1. The main characteristic of this typology is related to higher values of Rd and LCP and efficiency in carbon fixation (Vcmax). At the same time, with its medium capacity in the instantaneous photosynthetic use of water (WUE), middle E, middle Ci, glim and gs, these genotypes regulated leaf temperature less effectively than EUW group. However, this finely regulated water usage allowed efficient carbon fixation, achieving statistically similar performance that achieved heat-resistant ones through transpiration cooling (EUW typology). SER 16 was previously characterized as a typical high-yielding water saver in terminal drought. However, in our study, Western Amazonian soil allowed only very low yield performance of SER 16. We can characterize this third group OEUW as heat resistant genotypes with opportunistic water spender strategy and photosynthetic heat acclimation (Wang et al., 2020) with hybrid trait combinations of both above-mentioned typologies.
By analyzing heat stress resistance in beans under the western Amazonian conditions using the genotype stress index (GSI) we found differences between genotypes (Figure 8). Genotypes below the general average were mainly from the WUE typology group. Conditions in the Amazonia make them susceptible to heat and acidic soil resulting in reduced grain yield. However, genotypes such as BFS 10, SEN 52, SER 323, different SEFs (SEF 73, SEF 10, SEF 40, SEF 70), SCR 56, SMR 173 and SMN 99 (mainly from EUW group) showed GSI values higher than three due to their ability to adapt.
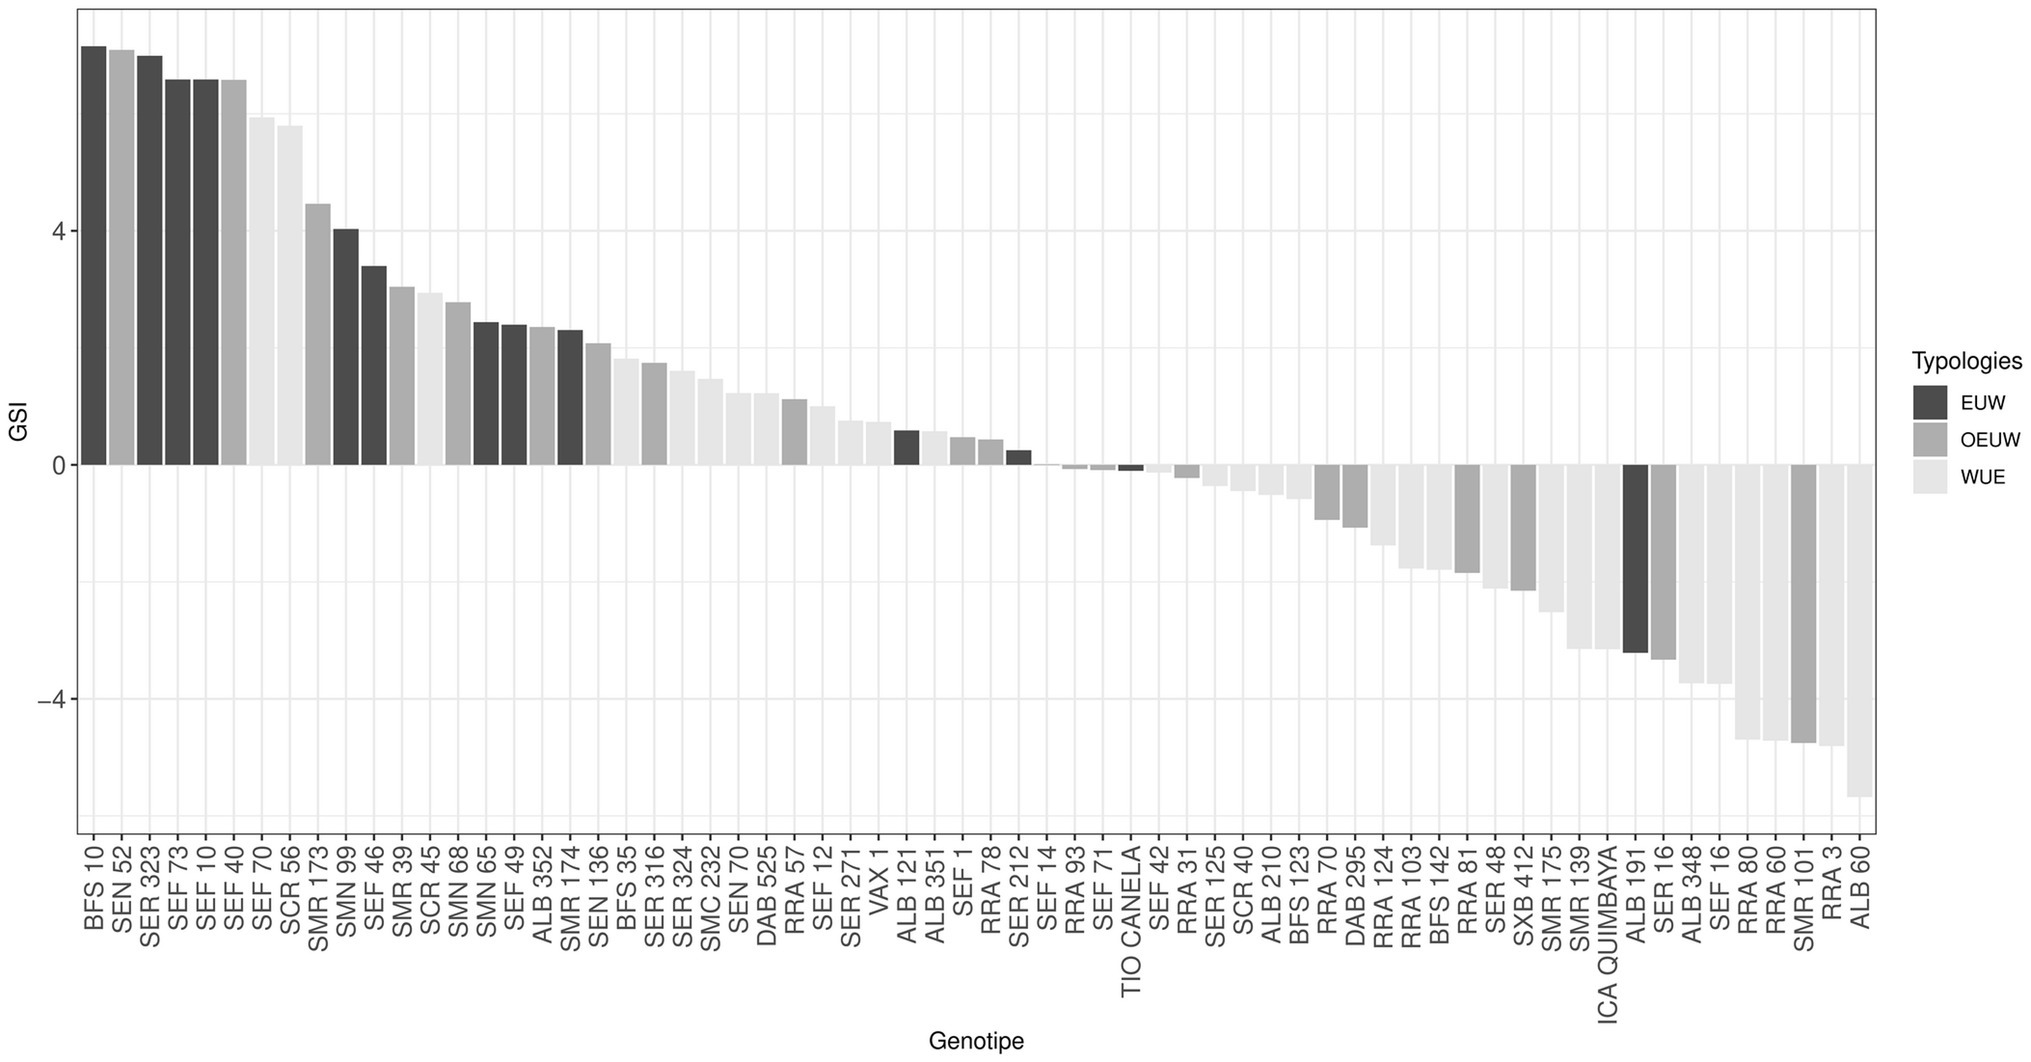
Figure 8. Genotype stress index of common bean genotypes cultivated at high temperatures. EUW: Effective Use of Water, WUE: Water use efficient, OEUW: Opportunistically effective use of water.
Discussion
Heat Tolerance Mechanisms
It has been shown that high temperature impacts phenology and grain yield in Western Amazonia (Suárez et al., 2018a, 2020). In the present study, we identified physiological heat tolerance mechanisms related to gasometric water use. We identified how some common bean lines maintain efficiency in mobilizing photosynthates for grain formation under high temperature conditions. Some lines such as BFS 10, SEF 10, SEF 73, SER 323, SMN 99 and SMR 177 which can be classified as anisohydric (water-spending) genotypes, use the mechanism of leaf temperature differential (LTD, Habermann et al., 2019; Deva et al., 2020). This trait is associated with increased gas exchange (gs), i.e., an increase of the substrate (Ci) for carbon fixation (A) at the cellular level by increasing also E. Therefore, when E increased, some bean genotypes—through latent heat transfer—maintained a lower leaf temperature relative to that of the air (Traub et al., 2018). Therefore, transpiration cooling allowed these genotypes to maintain the photosynthetic processes without major impacts from high temperatures, which was supported by the positive correlation obtained in our study between LSP with A and GY. To work this mechanism properly (LTD), water must be exchanged for carbon and carbon then incorporated into biomass, which relates to effective use of water (EUW; Salvucci and Crafts-Brandner, 2004; Blum, 2009; Boomiraj et al., 2010; Hall, 2010; Urban et al., 2017; Dubey et al., 2020). If this mechanism does not operate some genotypes may have stomatal limitations (glim), reducing latent heat flow, thus increasing leaf temperature (Orozco et al., 2012). On the other hand, isohydric (“water-saving”) genotypes such as SEF 70 and SCR 56 presented low E that caused a greater increase in LTD. These genotypes were characterized by having the ability to have greater WUE, which is attributed to higher water content within the leaves, which allowed leaf-morphology-related thermal capacity to sustain gs under high temperatures (Blum, 2009; Albrecht et al., 2020; Eustis et al., 2020). However, water savers in drought conditions are known to have low biomass accumulation and likely lower yield in comparison with spenders (dependent on water-availability scenario, if early, intermittent or terminal drought occur). Other physiological characteristics presented by this type of bean genotype was high maximum photochemical efficiency of PSII, due to its high LSP that regulated excess energy along the electron transport chain (Robledo et al., 2010; Pan et al., 2018) and to influence a higher maximum regeneration rate of ribulose-1,5-bisphosphate (RuBP; Jmax). Another group made up of SEF 40 and SEN 52 which, in addition to having very similar characteristics to the WUE typology (anisohydric) presented a higher maximum carboxylation rate (Vcmax), and higher Rd and LCP compared to the other typologies. Interestingly, in some cases the rate of photosynthesis was not limited by the ability of the enzyme Ribulose-1,5-bisphosphate (RuBP) carboxylase/oxygenase to carboxylate RuBP (Vcmax) since the electron transport rate for the regeneration of RuBP was also not affected. The mechanism of this typology is to save soil water, dissipate to some degree the negative effect of air temperature but still remain efficient in carbon fixation and assimilate translocation leading to higher grain yield. It has been recently mentioned that a thermal acclimatization has allowed a coupling between Vcmax and Rd (Wang et al., 2020). Therefore, the third typology OEUW, besides having a high Vcmax, also its Rd and LCP values were higher in comparison with the other typologies. The increase in temperature in these bean genotypes could lead to a higher demand for maintenance which is related to higher Rd values (Smith et al., 2019).
Genotypic Variation in Mechanisms of Heat Tolerance
According to the mechanisms described by the different typologies of beans, we found that some of them related to the use of water and others to the ability to increase carboxylation rate. We found that in each typology there were genotypic variations that allowed grain yields over 1,200kgha−1. These genotypes were called advanced superior lines with better heat resistance-related traits for better physiological performance. For example, BFS 10 and SER 323 were genotypes that were grouped into a single typology (EUW) with increased E generating an efficient canopy cooling (Hong et al., 2003). High E was translated into a more negative LTD––a situation that generated conditions within the canopy to maintain physiological processes. This mechanism (better canopy microclimate) hypothetically allowed a translocation of photosynthates for grain formation, thus increasing the GY. Behavior of two genotypes with highest GSI (BFS 10, SER 323; both EUW group) showed the pragmatic base for the above-mentioned statement: although they both had negative LTDs differences were found in carbon fixation efficiency that allowed high GY performance for both genotypes. However, the connection between E, gs, and overall water uptake and GY need to be further studied.
A genotype that showed optimal performance under high temperatures in terms of mobilization of photosynthates for grain formation was SEN 52. This is a black-seeded line derived from the cross [(SXB 123×DOR 677)×SEN 34], which has been reported as heat resistant (CIAT, 2015). This genotype for its high performance can be used as parental material to develop common bean lines tolerant to high temperatures. It was found that this genotype used a certain amount of water to allow an increase in the stomatal conductance (it belongs to OEUW typology). Generally, under hot conditions the limitation of A is presented by a decrease in both the maximum rate of carboxylation (Vcmax), the maximum rate of RuBP regeneration (Jmax) and the maximum photochemical efficiency of PSII (Yamori et al., 2011; Haque et al., 2017). However, SEN 52 did not show negative heat effects on diffusion and assimilation of carbon. Taken together, the most important strategy used by SEN 52 is to use a mechanism that combines EUW, LTD, light use (ΦPAR) and higher carbon fixation (Huang et al., 2017).
Other bean genotypes that showed heat resistance traits were SEFs (SEF 10, SEF 40, SEF 70 y SEF 73) that were generated by crossing (ALB 74×INB 841) F1×RCB 593, where ALB 74 provides genes from P. coccineus L. and INB 841 provides genes from P. acutifolius A. Gray. This allowed them to obtain genetic gain by inheriting its heat resistance (Polanía et al., 2017). When we analyzed in detail the gas exchange mechanisms, we found for example, SEF 40 (the OEUW type) was more efficient in fixing carbon (Vcmax) and showed highest photosynthetic values observed in this study. SEF 70 was the most water efficient genotype compared to the others, with a high light saturation point (LSP) where the functionality of the PSII in relation to electron transfer was efficient. A common feature of SEF 10 and SEF 73 was high instantaneous water use.
In this study, we elucidated the physiological mechanisms of ten heat-resistant genotypes (based on GY upon heat: BFS 10, SCR 56, SEF 10, SEF 40, SEF 70, SEF 73, SEN 52, SER 323, SMN 99 and SMR 177). The increase in temperature affected the adjustment of the thermal tolerance of PSII (Crafts-Brandner and Salvucci, 2002) due to possible reassembly of the reaction centers during heat stress (Lu et al., 2017). We found that PSII was sensitive to high temperatures (Camejo et al., 2005; Feng et al., 2014; Chen et al., 2017) presenting effects on the maximum Rubisco carboxylation rate (Chen et al., 2005; Haque et al., 2017) According to Blum (2009) under water and high temperature stress a high continuous stomatal conductance is required, to allow greater CO2 fixation that translates into a maximum use of soil water for transpiration (which is expressed actually by a lower WUE). However, we found another successful mechanism that some genotypes besides having a moderate use of water have developed a high carbon fixation efficiency (described for the genotype SEN 52).
In this regard, under the different mechanisms found for heat tolerance, the superior performance of the genotype BFS 10 has been due to its combined resistance to drought (Polania et al., 2016b), as well as tolerance to acid soils and high temperatures (Suárez et al., 2018b, 2020). SMN 99 (heat tolerant; Suárez et al., 2020) and SER 323 performed well under the combined stress of heat and acid soil. Our results showed a EUW as a mechanism for heat tolerance, allowing better transpiration cooling associated with final yield (Omae et al., 2012) as an important chronic heat-associated adaptation in common beans. Because the soil water content did not decrease in both experiments and yield differences (visible in absolute yields, yield reductions and stress indices) are consistent between genotypes, we conclude that physiological traits supporting heat tolerance played a similar role and were stable in both experiments. In order to understand differences between the three identified groups we can hypothesize which traits played a bigger role in reducing the negative effect of high temperature during the experiment. The summary of those traits (partially based on measurements, partially based on hypothesized traits) are presented in Figure 9.
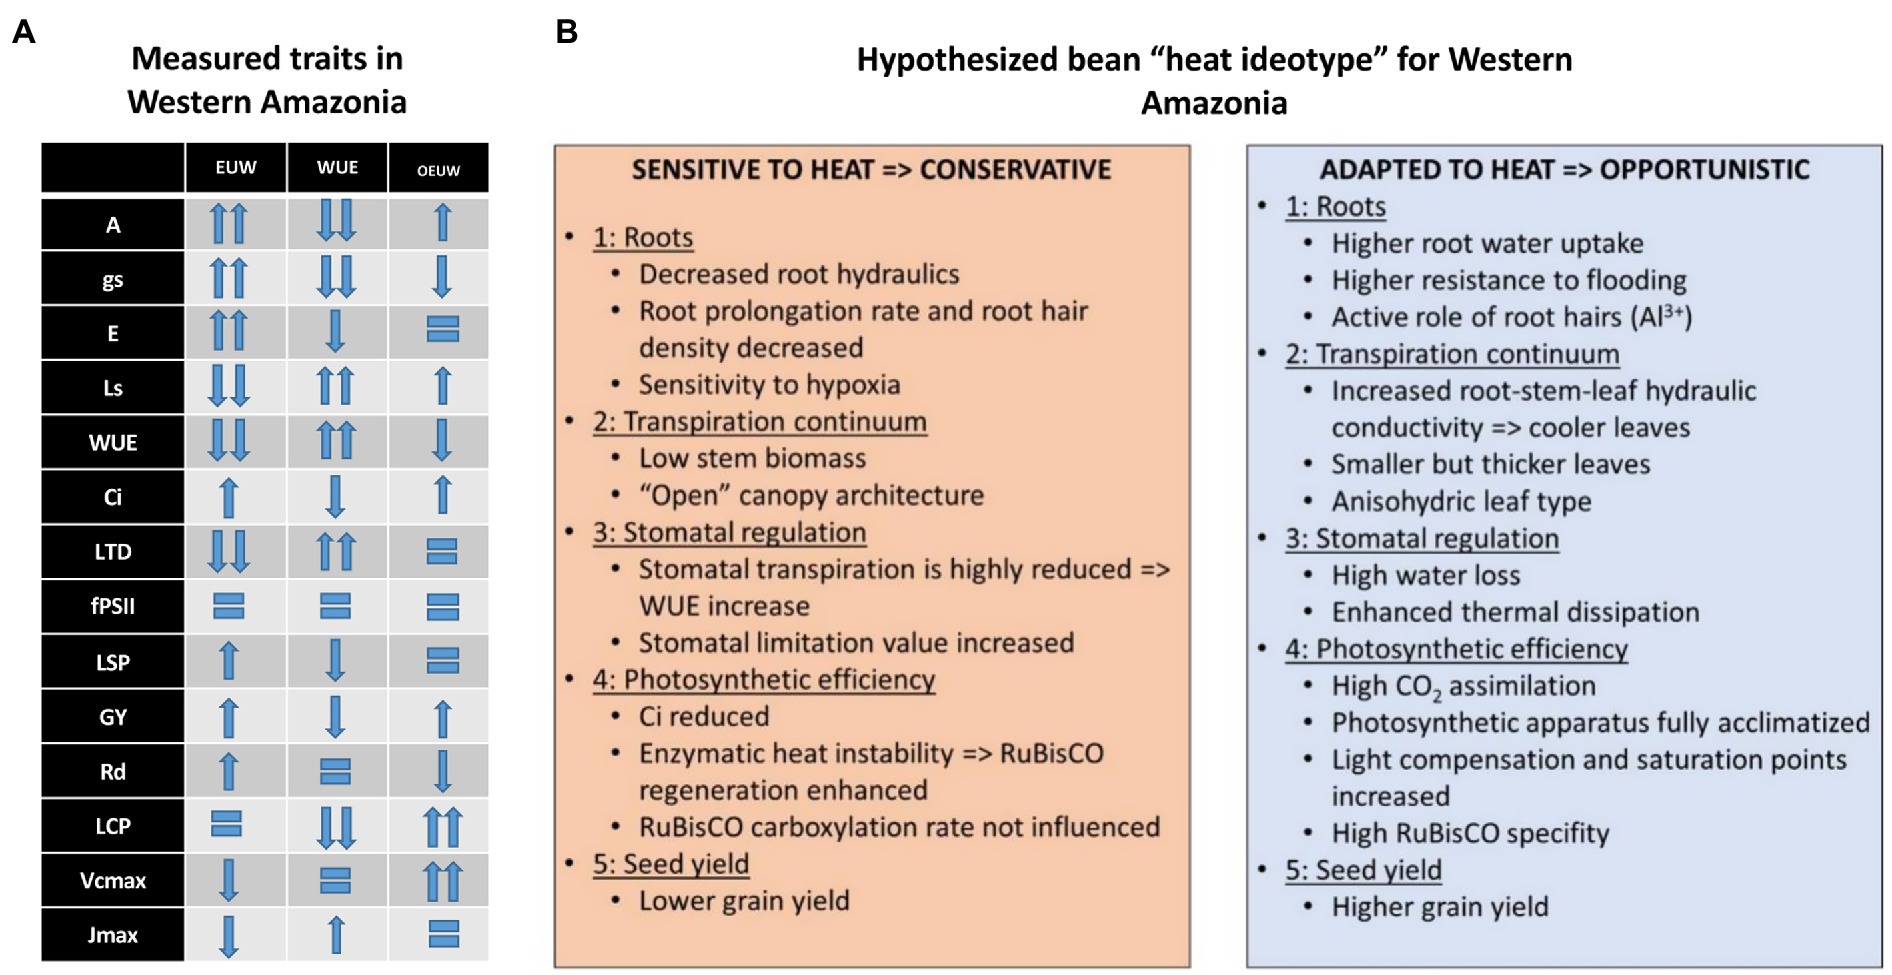
Figure 9. The overview of the measured physiological traits (A) in heat-treated beans in Western Amazonia for three different genotype groups and suggested bean heat ideotype (adapted to heat) based on published and hypothesized results (B). Gas exchange parameters at leaf level: stomatal conductance (gs, mmol H2O m−2 s−1), transpiration rate (E, mmol H2O m−2 s−1), photosynthetic Water Use Efficiency (WUE, mmol CO2 mol−1 H2O), sub-stomatal CO2 concentration (Ci, μmol mol−1), stomata limitation value (glim), leaf temperature differential (LTD), light-saturated maximum net carbon assimilation rate (Amax, μmol CO2 m−2 s−1), light compensation point (LCP, μmol m−2 s−1), dark respiration rates (Rd, μmol CO2 m−2 s−1), light saturation point (LSP, μmol m−2 s−1), and apparent quantum efficiency (ΦPAR, μmol CO2 μmol protons−1), maximum rate of ribulose-1,5-bisphosphate carboxylase/oxygenase (RuBisCO), carboxylation (Vcmax), maximum rate of electron transport driving regeneration of ribulose-1, 5-bisphosphate (RuBP; Jmax), leaf respiration under light conditions (RD), and yield (kgha−1).
Conclusion
Our climatological analysis (1984–2014) showed that approximately a third of growing seasons experienced at least 1day in which maximum daily temperatures exceeded 30°C and average daily minimum temperatures of greater than 20°C were experienced in all growing seasons. This suggests that high nighttime temperatures are more of a production risk than high daytime temperatures in Florencia of western Amazonia region. Furthermore, climatological profiling for the years 1984–2014 showed that the biggest challenges of growing beans in Western Amazonia are high maximum and minimum temperatures, high rainfall in the first half of the season, high RH and low VPD.
By analyzing the effect of air temperature on carbon assimilation we found that some genotypes had higher E and therefore more negative LTD, a mechanism that allowed higher A due to the maximum rate of RuBisCO carboxylation (Vcmax) and high rate of electron transport driving regeneration of ribulose-1, 5-bisphosphate (RuBP; Jmax). As the air temperature increases, glim increases, decreasing Ci and consequently A. According to the analysis of different variables taken from the 64 bean genotypes, three statistically different groups were found with contrasting physiological mechanisms: (1) WUE: Water Use Efficiency, (2) EUW: Effective use of water, and (3). OEUW: Opportunistically effective use of water. However, we also found outliers from this rule showing photosynthetically effective genotypes, surprisingly on the background of positive LTD.
Heat-resistant genotypes with effective use of water (EUW) showed profligate spender traits involving the transpiration and thermal dissipation by LTD with reduced glim increasing gs and Ci as the most important traits therefore resulting in high GY. Heat sensitive water use efficient genotypes (WUE; conservative) represent the highest values of WUE with a notable impact on the capacity to carry out gas exchange processes, reducing Ci and E, which increased glim and reduced LTD. The value of conservative genotypes need to be verified, especially in regions where terminal drought and high temperatures occur together.
By analyzing heat stress resistance in beans under western Amazonian soil and climatic conditions we found that conditions in the Amazonia make beans susceptible to heat and acidic soil resulting in reduced grain yield. However, genotypes such BFS 10, SEN 52, SER 323, different SEFs (SEF 73, SEF 10, SEF 40, SEF 70), SCR 56, SMR 173, and SMN 99 presented high GSI values and these genotypes could be suitable for use as parental lines for improving dry seed production.
Further study is needed to verify if mentioned trait combinations are stable over similar environments and quantify their effect on grain yield in heat areas, as water conservative behavior is not expected to increase bean heat resistance in general. Research focused on lysimetric-related water usage under heat stress (i.e., transpiration efficiency, root hairs, root-stem-leaf conductivity accompanied by seed nutritional profiling) of the above-mentioned three groups is recommended to verify the hypothesis that profligate water-spender and not water conservative traits (high WUE) can crystallize into higher grain yield in the extreme weather and soil conditions of Western Amazonia.
Data Availability Statement
The original contributions presented in the study are included in the article/Supplementary Material, further inquiries can be directed to the corresponding author.
Author Contributions
JS: conceptualization, data curation, formal analysis, funding acquisition, investigation, methodology, project administration, resources, software, validation, visualization, writing – original draft preparation, and writing – review and editing. MU: conceptualization, data curation, investigation, methodology, validation, visualization, writing – original draft preparation, and writing – review and editing. AC: data curation, investigation, methodology, validation, and writing – original draft preparation. JN: data curation, formal analysis, investigation, methodology, and validation. CD: conceptualization, data curation, formal analysis, software, visualization, and writing – review and editing. SB: funding acquisition, resources, validation, and visualization. JP: conceptualization, investigation, methodology, and review and editing. FC: data curation, formal analysis, software, visualization, and writing – review and editing. IR: conceptualization, investigation, methodology, validation, visualization, writing – original draft preparation, and writing – review and editing. All authors contributed to the article and approved the submitted version.
Funding
CD and MU were supported by a Biotechnology and Biological Sciences Research Council (BBSRC) funded project named Bean Breeding for Adaptation to a Changing Climate and Post-Conflict Colombia (BBACO). Grant number BB/S018964/1.
Conflict of Interest
The authors declare that the research was conducted in the absence of any commercial or financial relationships that could be construed as a potential conflict of interest.
Publisher’s Note
All claims expressed in this article are solely those of the authors and do not necessarily represent those of their affiliated organizations, or those of the publisher, the editors and the reviewers. Any product that may be evaluated in this article, or claim that may be made by its manufacturer, is not guaranteed or endorsed by the publisher.
Acknowledgments
MU thanks GIZ and CIM for the support.
Supplementary Material
The Supplementary Material for this article can be found online at: https://www.frontiersin.org/articles/10.3389/fpls.2021.644010/full#supplementary-material
References
Albrecht, H., Fiorani, F., Pieruschka, R., Müller-Linow, M., Jedmowski, C., Schreiber, L., et al. (2020). Quantitative estimation of leaf heat transfer coefficients by active thermography at varying boundary layer conditions. Front. Plant Sci. 10:1684. doi: 10.3389/fpls.2019.01684
Amsalu, B., Beebe, S., Rao, I., and Kunert, K. (2014). Association of nodule performance traits with shoot performance traits of common bean under drought stress. J. Crop Improv. 28, 418–435. doi: 10.1080/15427528.2014.910287
Andrade, E., Ribeiro, N., Azevedo, C., Chiorato, A., Williams, T., and Carboneli, S. (2016). Biochemical indicators of drought tolerance in the common bean (Phaseolus vulgaris L.). Euphytica 210, 277–289. doi: 10.1007/s10681-016-1720-4
Araus, J. L., Slafer, G. A., Reynolds, M. P., and Royo, C. (2002). Plant breeding and drought in C3 cereals: what should we breed for? Ann. Bot. 89, 925–940. doi: 10.1093/aob/mcf049
Asfaw, A., Ambachew, D., Shah, T., and Blair, M. (2017). Trait associations in diversity panels of the two common bean (Phaseolus vulgaris L.) gene pools grown under well, watered and wáter-stress conditions. Front. Plant Sci. 8:733. doi: 10.3389/fpls.2017.00733
Bauerle, W., Wang, G., Bowden, J., and Hong, C. (2006). An analysis of ecophysiological responses to drought in American chestnut. Ann. For. Sci. 63, 833–842. doi: 10.1051/forest:2006066
Beebe, S. (2012). Common bean breeding in the tropics. Plant Breed Rev. 36, 357–456. doi: 10.1002/9781118358566.ch5
Beebe, S., Ramírez, J., Jarvis, A., Rao, I., Mosquera, J., Bueno, J., et al. (2011). “Genetic improvement of common beans and the challenges of climate change,” in Crop Adaptation to Climate Change. eds. S. S. Yadav, et al. (Oxford: Wiley-Blackwell), 356–369.
Beebe, S., Rao, I., Blair, M., and Acosta-Gallegos, J. (2013). Phenotyping common beans for adaptation to drought. Front. Physiol. 4:35. doi: 10.3389/fphys.2013.00035
Beebe, S., Rao, I., Cajiao, C., and Grajales, M. (2008). Selection for drought resistance in common bean also improves yield in phosphorus limited and favorable environments. Crop Sci. 48, 582–592. doi: 10.2135/cropsci2007.07.0404
Bigras, F. (2005). Photosynthetic response of white spruce families to drought stress. New For. 29, 135–148. doi: 10.1007/s11056-005-0245-9
Blum, A. (2009). Effective use of water (EUW) and not water-use efficiency (WUE) is the target of crop yield improvement under drought stress. Field Crop Res. 112, 119–123. doi: 10.1016/j.fcr.2009.03.009
Blum, A. (2015). Towards a conceptual ABA ideotype in plant breeding for water limited environments. Funct. Plant Biol. 42:502. doi: 10.1071/FP14334
Boomiraj, K., Chakrabarti, B., Aggarwal, P. K., Choudhary, R., and Chander, S. (2010). Assessing the vulnerability of Indian mustard to climate change. Agric. Ecosyst. Environ. 138, 265–273. doi: 10.1016/j.agee.2010.05.010
Bramley, H., Turner, N., and Siddique, K. (2013). Water Use Efficiency. Genomics and Breeding for Climate-Resilient Crops. Germany: Springer, 225–268.
Butare, L., Rao, I., Lepoivre, P., Cajiao, C., Polania, J., Cuasquer, J., et al. (2011). Phenotypic evaluation of interspecific recombinant inbred lines (RILs) of Phaseolus species for aluminium resistance and root growth response to aluminium-toxic acid soil. Euphytica 186:715. doi: 10.1007/s10681-011-0564-1
Camejo, D., Rodríguez, P., Morales, M. A., Dell’amico, J. M., Torrecillas, A., and Alarcon, J. J. (2005). High temperature effects on photosynthetic activity of two tomato cultivars with different heat susceptibility. J. Plant Physiol. 162, 281–289. doi: 10.1016/j.jplph.2004.07.014
Cardona-Ayala, C., Jarma-Orozco, A., Araméndiz-Tatis, H., Peña-Agresott, M., and Vergara-Córdoba, C. (2014). Respuestas fisiologicas y bioquimicas del fríjol caupí (Vigna unguiculata L. Walp.) bajo déficit hídrico. Rev. Colombiana de Ciencias Hortí. 8, 250–261. doi: 10.17584/rcch.2014v8i2.3218
Chaves, M. M., and Oliveira, M. M. (2004). Mechanisms underlying plant resilience to water deficits: prospects for water-saving agriculture. J. Exp. Bot. 55, 2365–2384. doi: 10.1093/jxb/erh269
Chen, G. Y., Yong, Z. H., Liao, Y., Zhang, D. Y., Chen, Y., Zhu, J. G., et al. (2005). Photosynthetic acclimation in rice leaves to free-air CO2 enrichment related to both ribulose-1, 5-bisphosphate carboxylation limitation and ribulose-1, 5-bisphosphate regeneration limitation. Plant Cell Physiol. 46, 1036–1045. doi: 10.1093/pcp/pci113
Chen, Y., Zhang, C., Su, Y., Ma, J., Zhang, Z., and Yuan, M. (2017). Responses of photosystem II and antioxidative systems to high light and high temperature co-stress in wheat. Environment 38, 812–826. doi: 10.1016/j.envexpbot.2016.12.001
CIAT. (2015). Developing Beans that Can Beat the Heat. Tech. Rep. Colombia: Centre for International Tropical Agriculture.
Costa, M., Pham, A., Pimentel, C., Pereyra, R., and Zuily, Y., and and Laffray, D. (2000). Differences in growth and water relations among Phaseolus vulgaris cultivars in response to induced drought stress. Environ. Exp. Bot. 43, 227–237. doi: 10.1016/S0098-8472(99)00060-X.
Crafts-Brandner, S. J., and Salvucci, M. E. (2002). Sensitivity of photosynthesis in a C4 plant maize to heat stress. Plant Physiol. 129, 1773–1780. doi: 10.1104/pp.002170
Crawford, A. J., McLachlan, D. H., Hetherington, A. M., and Franklin, K. A. (2012). High temperature exposure increases plant cooling capacity. Curr. Biol. 22, R396–R397. doi: 10.1016/j.cub.2012.03.044
Debouck, D. G., and Smartt, J. (1995). “Beans, Phaseolus spp. (Leguminosae-Papilionoideae),” in Evolution of Crop Plants. 2nd Edn. eds. J. Smartt and N. W. Simmonds (London: Longman Scientific & Technical), 287–294.
Deva, C. R., Urban, M. O., Challinor, A. J., Falloon, P., and Svitákova, L. (2020). Enhanced leaf cooling is a pathway to heat tolerance in common bean. Front. Plant Sci. 11:19. doi: 10.3389/fpls.2020.00019
Di Rienzo, J., Balzarini, M., Gonzalez, L., Casanoves, F., Tablada, M., and Robledo, C. W.. (2019). InfoStat versio’n (2018). Grupo infostat, FCA, Universidad Nacional de Córdoba, Argentina. Available at: http://www.infostat.com.ar (Accessed October 30, 2019).
Dreyer, E., Le Roux, X., Montpied, P., Daudet, F. A., and Masson, F. (2001). Temperature response of leaf photosynthetic capacity in seedlings from seven temperate tree species. Tree Physiol. 21, 223–232. doi: 10.1093/treephys/21.4.223
Dubey, R., Pathak, H., Chaktabarti, B., Sing, S., Gupta, D., and Harit, R. C. (2020). Impact of terminal heat stress on wheat yield in India and options for adaptation. Agric. Syst. 181:102826. doi: 10.1016/j.agsy.2020.102826
Duursma, R. A. (2015). Plantecophys An R package for analysing and modelling leaf gas exchange data. PLoS One 10:e0143346. doi: 10.1371/journal.pone.0143346
Easlon, H. M., Nemali, K. S., Richards, J. H., Hanson, D. T., Juenger, T. E., and McKay, J. K. (2014). The physiological basis for genetic variation in water use efficiency and carbon isotope composition in Arabidopsis thaliana. Photosynth. Res. 119, 119–129. doi: 10.1007/s11120-013-9891-5
Eustis, A., Murphy, K., and Barrios-Masias, F. (2020). Leaf gas exchange performance of ten quinoa genotypes under a simulated heat wave. Plan. Theory 9, 1–15. doi: 10.3390/plants9010081
Fahad, S., Bajwa, A., Nazir, U., Anjum, S., Farooq, A., Zohaib, A., et al. (2017). Crop production under drought and heat stress: plant responses and management options. Front. Plant Sci. 8:1147. doi: 10.3389/fpls.2017.01147
Falqueto, A., da Silva, R., Gaudio, M., Rodrigues, J., Silva, D., and Partelli, F. (2017). Effects of drought stress on chlorophyll a fluorescence in two rubber tree clones. Sci. Hortic. 224, 238–243. doi: 10.1016/j.scienta.2017.06.019
Farooq, M., Hussain, M., Ul-Allah, S., and Siddique, K. H. (2019). Physiological and agronomic approaches for improving water-use efficiency in crop plants. Agric. Water Manag. 219, 95–108. doi: 10.1016/j.agwat.2019.04.010
Farquhar, G. D., von Caemmerer, S., and Berry, J. A. (1980). A biochemical-model of photosynthetic CO2 assimilation in leaves of C-3 species. Planta 149, 78–90. doi: 10.1007/BF00386231
Feng, B., Liu, P., Li, G., Dong, T., Wang, F., Kong, L., et al. (2014). Effect of heat stress on the photosynthetic characteristics in flag leaves at the grain-filling strage of different heat-resistant winter wheat varieties. J. Agro. Crop. Sci. 200, 143–155. doi: 10.1111/jac.12045
Flexas, J., Díaz-Espejo, A., Berry, J. A., Cifre, J., Galmés, J., Kaldenhoff, R., et al. (2007). Analysis of leakage in IRGA’s leaf chambers of open gas exchange systems: quantification and its effects in photosynthesis parameterization. J. Exp. Bot. 58, 1533–1543. doi: 10.1093/jxb/erm027
Galmes, J., Conesa, M. A., Diaz-Espejo, A., Mir, A., Perdomo, J. A., Niinemets, U., et al. (2014). Rubisco catalytic properties optimized for present and future climatic conditions. Plant Sci. 226, 61–70. doi: 10.1016/j.plantsci.2014.01.008
Gepts, P., and Debouck, D. (1991). “Origin, domestication, and evolution of the common bean (Phaseolus vulgaris, L.),” in Common Beans: Research for Crop Improvement. eds. A. Van Schoonhoven and O. Voysest (Wallingford: Commonwealth Agricultural Bureaux International), 7–53.
Habermann, E., Dias de Oliveira, E., Contin, D., San Martin, J., Curtarelli, L., Gonzalez, M., et al. (2019). Stomatal development and conductance of a tropical forage legume are regulated by elevated [CO2] under moderate warming. Front. Plant Sci. 10:609. doi: 10.3389/fpls.2019.00609
Hall, A. E. (2010). “Breeding for heat tolerance,” in Plant Breeding Reviews. eds. J. Janick (New York: John Wiley & Sons, Inc.), 129–168.
Haque, M., Sousa, A., Soares, C., Kjaer, K., Fidalgo, F., Qvist, E., et al. (2017). Temperature variation under continuous light restores tomato leaf photosynthesis and maintains the diurnal pattern in stomatal conductance. Front. Plant Sci. 8:1602. doi: 10.3389/fpls.2017.01602
Hong, S. W., Lee, U., and Vierling, E. (2003). Arabidopsis hot mutants define multiple functions required for acclimation to high temperatures. Plant Physiol. 132, 757–767. doi: 10.1104/pp.102.017145
Huang, G., Zhang, Q., Wei, X., Peng, S., and Li, Y. (2017). Nitrogen can alleviate the inhibition of photosynthesis caused by high temperature stress under both steady-state and flecked irradiance. Front. Plant Sci. 8:945. doi: 10.3389/fpls.2017.00945
IPCC (2021). “Summary for policymakers,” in Climate Change 2021: The Physical Science Basis. Contribution of Working Group I to the Sixth Assessment Report of the Intergovernmental Panel on Climate Change. eds. V. P. Masson-Delmotte, A. Zhai, S. L. Pirani, C. Connors, S. Péan, and N. Berger, et al. (United Kingdom: Cambridge University Press).
Lawlor, D., and Cornic, G. (2002). Photosynthetic carbon assimilation and associated metabolism in relation to water deficits in higher plants. Plant Cell Environ. 25, 275–294. doi: 10.1046/j.0016-8025.2001.00814.x
Lobo, F. A., de Barros, M. P., Dalmagro, H. J., Dalmolin, Ã. C., Pereira, W. E., de Souza, É. C., et al. (2013). Fitting net photosynthetic light-response curves with Microsoft excel a critical look at the models. Photosynthetica 51, 445–456. doi: 10.1007/s11099-013-0045-y
Long, S., and Bernacchi, C. (2003). Gas exchange measurements, what can they tell us about the underlying limitations to photosynthesis? Procedures and sources of error. J. Exp. Bot. 54, 2393–2401. doi: 10.1093/jxb/erg262
Lu, Y., Li, R., Wang, R., Wang, X., Zheng, W., Sun, Q., et al. (2017). Comparative proteomic analysis of flag leaves reveals new insight into wheat heat adaptation. Front. Plant Sci. 8:1086. doi: 10.3389/fpls.2017.01086
Martins, S., Detmann, K., Reis, J., Pereira, L., Sanglard, L., Rogalski, M., et al. (2013). Photosynthetic induction and activity of enzymes related to carbon metabolism: insights into the varying net photosynthesis rates of coffee sun and shade. Theor. Exp. Plant Physiol. 25, 62–69. doi: 10.1590/S2197-00252013000100008
Mathur, S., Agrawal, D., and Jajoo, A. (2014). Photosynthesis: response to high temperature stress. J. Photochem. Photobiol. B Biol. 137, 116–126. doi: 10.1016/j.jphotobiol.2014.01.010
McClean, P. E., Lee, R. K., and Miklas, P. N. (2004). Intron-based sequence diversity studies in Phaseolus. Annu. Rep. Bean Improv. Coop. 47, 85–86.
Meier, U. (2001). Growth Stages of Mono-and Dicotyledonous Plants. Germany: Blackwell Wissenschafts-Verlag.
Omae, H., Kumar, A., Kashiwaba, K., and Shono, M. (2007). Influence of temperature shift after flowering on dry matter partitioning in two cultivars of snap bean (Phaseolus vulgaris L.) that differ in heat tolerance. Plant prod. Science 10, 14–19. doi: 10.1626/pps.10.14
Omae, H., Kumar, A., and Shono, M. (2012). Adaptation to high temperature and water deficit in the common bean (Phaseolus vulgaris L.) during the reproductive period. J. Bot. 2012:803412. doi: 10.1155/2012/803413
Orozco, A., Cardona, C., and Araméndiz, H. (2012). Efecto del cambio climático sobre la fisiología de las plantas cultivadas: una revisión. Revista U.D.C.A. Actualidad Divulgación Científica. 15, 63–76. doi: 10.31910/rudca.v15.n1.2012.803
Pan, C., Ahammed, G., Li, X., and Shi, K. (2018). Elevated CO2 improves photosynthesis under high temperature by attenuating the functional limitations to energy fluxes, electron transport and redox homeostasis in tomato leaves. Front. Plant Sci. 9:1739. doi: 10.3389/fpls.2018.01739
Parry, M. A. J., Flexas, J., and Medrano, H. (2005). Prospects for crop production under drought: research priorities and future directions. Ann. Appl. Biol. 147, 211–226. doi: 10.1111/j.1744-7348.2005.00032.x
Perdomo, J., Carmo-Silva, E., Herminda-Carrera, C., Flexas, J., and Galmés, J. (2016). Acclimation of biochemical and diffusive components of photosynthesis in Rice, wheat, and maize to heat and water deficit: implications for Modeling photosynthesis. Front. Plant Sci. 7:1719. doi: 10.3389/fpls.2016.01719
Polanía, J., Chaves, N., Lobaton, J. D., Cajiao, V., Hernando, C., Rao, I. M., et al. (2017). Heat Tolerance in Common Bean Derived from Interspecific Crosses. Colombia: International Center for Tropical Agriculture.
Polania, J., Poschenrieder, C., Beebe, S., and Rao, I. (2016b). Effective use of water and increased dry matter partitioned to grain contribute to yield of common bean improved for drought resistance. Front. Plant Sci. 7:660. doi: 10.3389/fpls.2016.00660
Polania, J., Poschenrieder, C., Rao, I., and Beebe, S. (2016a). Estimation of phenotypic variability in symbiotic nitrogen fixation ability of common bean under drought stress using 15N natural abundance in grain. Europ. J. Agronomy 79, 66–73. doi: 10.1016/j.eja.2016.05.014
Polanía, J., Rao, I., Cajiao, C., Rivera, M., Bodo, R., and Beebe, S. (2016c). Physiological traits associated with drought resistance in Andean and Mesoamerican genotypes of common bean (Phaseolus vulgaris L.). Euphytica 210, 17–29. doi: 10.1007/s10681-016-1691-5
Porch, T. G., and Hall, A. E. (2013). “Heat tolerance” in Genomics and Breeding for Climate-Resilient Crops. Vol. 2. ed. C. Kole (Berlin, Germany: Springer-Verlag), 167–202.
Porch, T. G., Smith, J. R., Beaver, J. S., Griffiths, P. D., and Canaday, C. H. (2010). TARS-HT1 and TARS-HT2 heat-tolerant dry bean germplasm. Hort. Sci. 45, 1278–1280. doi: 10.21273/HORTSCI.45.8.1278
R Development Core Team (2019) R: A Language and Environment for Statistical Computing. R Foundation for Statistical Computing: Vienna, Austria.
Rao, I., Beebe, S., Polania, J., Grajales, M., Cajiao, C., and Ricaurte, J. (2017). Evidence for genotypic differences among elite lines of common bean in the ability to remobilize photosynthate to increase yield under drought. J. Agric. Sci. 155, 857–875. doi: 10.1017/S0021859616000915
Rippke, U., Ramirez-Villegas, J., and Jarvis, A. (2016). Timescales of transformational climate change adaptation in sub-Saharan African agriculture. Nat. Clim. Chang. 6, 605–609. doi: 10.1038/nclimate2947
Robledo, A., Pérez-López, U., Lacuesta, M., Mena-Petite, A., and Muñoz-Rueda, A. (2010). Influence of water stress on photosynthetic characteristics in barley plants under ambient and elevated CO2 concentrations. Biol. Plant. 54, 285–292. doi: 10.1007/s10535-010-0050-y
Salvucci, M. E., and Crafts-Brandner, S. J. (2004). Inhibition of photosynthesis by heat stress: The activation state of rubisco as a limiting factor in photosynthesis. Physiol. Plant. 120, 179–186. doi: 10.1111/j.0031-9317.2004.0173.x
Silva, E., Ferreira, S., Fontenele, A., Ribeiro, R., Viégas, R., and Silveira, J. (2010). Photosynthetic changes and protective mechanisms against oxidative damage subjected to isolated and combined drought and heat stresses in Jatropha curcas plants. J. Plant Physiol. 167, 1157–1164. doi: 10.1016/j.jplph.2010.03.005
Singh, S. P., Gepts, P., and Debouck, D. G. (1991). Races of common bean (Phaseolus vulgaris, Fabaceae). Econ. Bot. 45, 379–396. doi: 10.1007/bf02887079
Smith, N. G., Li, G., and Dukes, J. S. (2019). Short-term thermal acclimation of dark respiration is greater in non-photosynthetic than in photosynthetic tissues. AoB Plants 11:plz064. doi: 10.1093/aobpla/plz064
Sofi, P., and Maduraimuthu, D. (2017). Variation in some physiological parameters in relation to high temperature stress in common bean (Phaseolus vulgaris L.). SKUAST J. Res. 19, 251–257.
Suárez, J., Melgarejo, L., Casanoves, F., Di Rienzo, J., DaMatta, F., and Armas, C. (2018a). Photosynthesis limitations in cacao leaves under different agroforestry systems in the Colombian Amazon. PLoS One 13:e0206149. doi: 10.1371/journal.pone.0206149
Suárez, J., Polania, J., Contreras, A., Rodriguez, L., Beebe, S., and Rao, I. (2018b). Agronomical, phenological and physiological performance of common bean lines in the Amazon region of Colombia. Theor. Exp. Plant Physiol. 30, 303–320. doi: 10.1007/s40626-018-0125-2
Suárez, J., Polania, J., Contreras, A., Rodríguez, L., Machado, L., Ordoñez, C., et al. (2020). Adaptation of common bean lines to high temperature conditions: genotypic differences in phenological and agronomic performance. Euphytica 216:28. doi: 10.1007/s10681-020-2565-4
Traub, J., Porch, T., Naeem, M., Urrea, C. A., Austic, G., Kelly, J. D., et al. (2018). Screening for heat tolerance in Phaseolus spp. using multiple methods. Crop Sci. 58:2459. doi: 10.2135/cropsci2018.04.0275
Urban, J., Ingwers, M., McGuire, M. A., and Teskey, R. O. (2017). Stomatal conductance increases with rising temperature. Plant Signal. Behav. 12:e1356534. doi: 10.1080/15592324.2017.1356534
Wahid, A., Gelani, S., Ashraf, M., and Foolad, M. (2007). Heat tolerance in plants: an overview. Environ. Exp. Bot. 61, 199–223. doi: 10.1016/j.envexpbot.2007.05.011
Wang, H., Atkin, O. K., Keenan, T. F., Smith, N. G., Wright, I. J., Bloomfield, K. J., et al. (2020). Acclimation of leaf respiration consistent with optimal photosynthetic capacity. Glob. Chang. Biol. 26, 2573–2583. doi: 10.1111/gcb.14980
Wentworth, M., Murchie, E., Gray, J., Villegas, D., Pastenes, C., Pinto, M., et al. (2006). Differential adaptation of two varieties of common bean to abiotic stress. J. Exp. Bot. 57, 699–709. doi: 10.1093/jxb/erj061
Wise, R. R., Olson, A. J., Schrader, S. M., and Sharkey, T. D. (2004). Electron transport is the functional limitation of photosynthesis in field-grown Pima cotton plants at high temperature. Plant Cell Environ. 27, 717–724. doi: 10.1111/j.1365-3040.2004.01171.x
Yamori, W., Nagai, T., and Makino, A. (2011). The rate-limiting step for CO2 assimilation at different temperatures is influenced by the leaf nitrogen content in C3 crop species. Plant Cell Environ. 34, 764–777. doi: 10.1111/j.1365-3040.2011.02280.x
Yamori, W., Noguchi, K., Kashino, Y., and Terashima, I. (2008). The role of electron transport in determining the temperature dependence of the photosynthetic rate in spinach leaves grown at contrasting temperatures. Plant Cell Physiol. 49, 583–591. doi: 10.1093/pcp/pcn030
Yamori, W., Suzuki, K., Noguchi, K., Nakai, M., and Terashima, I. (2006). Effects of rubisco kinetics and rubisco activation state on the temperature dependence of the photosynthetic rate in spinach leaves from contrasting growth temperatures. Plant Cell Environ. 29, 1659–1670. doi: 10.1111/j.1365-3040.2006.01550.x
Keywords: acid soil, climatology, common bean, heat resistance, leaf cooling, partitioning, water spender, water saver
Citation: Suárez JC, Urban MO, Contreras AT, Noriega JE, Deva C, Beebe SE, Polanía JA, Casanoves F and Rao IM (2021) Water Use, Leaf Cooling and Carbon Assimilation Efficiency of Heat Resistant Common Beans Evaluated in Western Amazonia. Front. Plant Sci. 12:644010. doi: 10.3389/fpls.2021.644010
Edited by:
Iker Aranjuelo, Institute of Agrobiotechnology, Superior Council of Scientific Investigations, SpainReviewed by:
Maria Cecilia Rousseaux, Centro Regional de Investigaciones Científicas y Transferencia Tecnológica de La Rioja (CRILAR CONICET), ArgentinaDavid Soba, Institute of Agrobiotechnology, Superior Council of Scientific Investigations, Spain
Copyright © 2021 Suárez, Urban, Contreras, Noriega, Deva, Beebe, Polanía, Casanoves and Rao. This is an open-access article distributed under the terms of the Creative Commons Attribution License (CC BY). The use, distribution or reproduction in other forums is permitted, provided the original author(s) and the copyright owner(s) are credited and that the original publication in this journal is cited, in accordance with accepted academic practice. No use, distribution or reproduction is permitted which does not comply with these terms.
*Correspondence: Juan Carlos Suárez, ju.suarez@udla.edu.co