 Shi-Bin Wang
 Wen-Qi Xu
 Li-Juan Gao2
 Hui-Rong Zheng
 Cai-Lan Hou
- 1Guangdong Mental Health Center, Guangdong Provincial People's Hospital (Guangdong Academy of Medical Sciences), Southern Medical University, Guangzhou, Guangdong, China
- 2Nanhai Public Health Hospital of Foshan City, Foshan, Guangdong, China
- 3Medical College of South China University of Technology, Guangzhou, Guangdong, China
- 4Department of Psychology, School of Public Health, Southern Medical University, Guangzhou, Guangdong, China
Background: Lifestyle habits are vital components of the culture of mental health treatment settings. We examined the bridge connection between depressive and anxiety symptoms and lifestyles from a network perspective using a population-based study.
Methods: Face-to-face interviews were conducted with a provincially representative sample of 13,768 inhabitants from the Guangdong Sleep and Psychosomatic Health Survey based on standardized evaluation techniques. We identified the central symptoms by expected influence. The interconnection between depression and anxiety symptoms, as well as the bridge connectivity linking depression–anxiety symptoms and lifestyle factors, were assessed using the bridge centrality index. Network stability and sensibility analyses were performed using a case-dropping bootstrap procedure.
Results: The core symptom that exhibited the highest expected influence was fatigue or little energy, followed by uncontrollable worry, trouble relaxing, and sad mood in the depression-anxiety symptoms network, while guilt was the most interconnected symptom and had the highest bridge strength. Surrounding nodes of each node explained an average variance of 57.63%. Additionally, suicidal thoughts were recognized as collective bridging symptoms connecting lifestyle variables in the network integrating depression-anxiety symptoms with lifestyle factors. Current tobacco and alcohol consumption were positively associated with suicidal thoughts and irritability. Habitual diet rhythm and physical exercise frequency were linked to suicidal thoughts, guilt, and poor appetite or overeating. Suicidal thoughts, irritability, and guilt indicated the greatest connectivity with lifestyle factors. All networks had high stability and accuracy.
Conclusion: These highlighted core and bridge symptoms could serve as latent targets for the prevention and intervention of comorbid depression and anxiety. It might be crucial for clinical practitioners to design effective and targeted treatment and prevention strategies aiming at specific lifestyles and behaviors.
Introduction
Mental disorders are prominent public health concerns and the leading causes of global disease burden (1). Depression and anxiety are mental illnesses that affect people all over the world and frequently coexist. The presence of either depressive or anxiety symptoms always increases the risk of developing the other. According to the Netherlands Study of Depression and Anxiety (NESDA), the risk of suffering from a lifetime comorbid anxiety was 0.75 among patients with depressive disorder, while the probability of experiencing depression across the lifespan was 0.81 among those with anxiety (2). Primary prevention has not improved much despite notable advancements in psychotherapy and pharmacotherapy for a range of psychiatric issues in recent years.
In the past years, lifestyle factors were routinely deemed as the general and self-comfort strategies with little clinical correlation (3). However, neglect of lifestyle management tends to cause poor treatment outcomes for psychological problems. Poor diet, inactivity, smoking, and alcoholism continue to be prevalent in the culture of psychological health therapeutic settings. As public health awareness grows, the impact of lifestyles is grabbing more and more attention in preventing and treating psychiatric illness. The Canadian 24-h movement guidelines advocate at least 60 min of moderate exercise and no more than 2 h of sedentary behavior to maintain overall mental health (4). Physical activity, tobacco smoking, and dietary patterns, as well as sleep problems, according to the clinical practice guidelines of mood disorders from the Royal Australian and New Zealand College of Psychiatrists, should be handled first before beginning psychotherapy or pharmacological therapy (5). A systematic meta-review of the high-quality evidence has investigated the causal role of exercise, smoking, diet, and sleep in the onset and prognosis of mental disorders (6). Notwithstanding, a wealth of current evidence (7–10) focused on the influence of a single behavioral factor on mental conditions, such as physical exercise, and typically in connection with depressive disorders (11), while ignoring the comprehensive effect of multiple lifestyle factors on depression and anxiety.
Additionally, earlier research studies were mostly committed to examining the connections between lifestyle factors and symptom total scores or diagnostic categories of one of the illnesses (11, 12). However, these relationships are not only found at a disease level but also at the symptoms level (13), whereas just analyzing the sum of symptom scores or diagnostic categories at the disease level may not be sufficient to identify these interconnections because there are differences in the links between distinct lifestyle factors and various symptoms. Further studies are needed to clarify these specific associations between disease symptoms and lifestyle choices. Recently, an emerging methodology contributed to symptomatology research, indicating different relations connecting individual psychological symptoms with risk factors (14). Network analyses have been extensively applied in the psychopathological field by conceptualizing and visualizing interaction among symptoms over the past few years.
The network approach theories were based on the concept that mental disorders were produced by symptoms that interacted with each other through feedback loops until a self-sustaining state was formed (15, 16). In network models, each symptom was visualized as a node that received stimulus from other mental symptoms and exogenous factors outside the network. Lifestyle factors are examples of external factors that have been introduced into the network of symptoms via bridge connection. Connections between two symptoms or symptoms-factors were visualized as network edges (17). This direct symptoms-factors relation could point to a mutual etiological impact. From the perspective of the core network, the onset of one disorder's symptom may trigger another one as time goes on (18). For example, anhedonia can result in people losing interest in daytime activities and work, which may increase feelings of guilt or sadness later in the day because they did not get all done what they wanted to do. This might provide a theoretical explanation for the comorbidity's underlying mechanisms (19). These core and bridge symptoms are latent targets to prevent and intervene in mental disorders, which is crucial to develop efficient and purposeful treatment strategies for psychiatrists.
Based on a massive sample size of 13,768 residents, this study was designed to examine the role of lifestyle factors in the network of depression and anxiety symptoms. In particular, there were several aims: First, the comorbid network structure of depression and anxiety symptoms would be depicted. Second, the direct connection between depression-anxiety symptoms and different lifestyle clusters would be identified, and the common bridging symptoms were examined. Finally, the networks of varying complexity with or without covariates adjustment would be established, and then the sensitivity and stability of all models were analyzed.
Methods
Study population and procedures
The Guangdong Sleep and Psychosomatic Health Survey (GSPHS), a population-based survey with a representative sample of residents aged 18–85 years living in Guangdong province, China, provided the data for this current research. The survey was carried out using a multistage stratified cluster sampling technique between September and November 2019 (20). The sampling procedures in corresponding fine detail have been presented elsewhere (21). The GSPHS team recruited and trained 142 investigators who had at least 2 years of learning experience in the field of medicine and health on standard survey procedures. Participants who satisfied all three of the following requirements were included in this study: (1) ≥ 18 years (born before 1 October 2001); (2) long-standing residents who have lived in Guangdong Province for more than 6 months in a calendar year; and (3) being able to take part in a face-to-face interview. Respondents who were too ill to reply and those who were younger than 18 years were not included in this poll. Each participant gave electronic informed consent before taking the questionnaire at a local neighborhood health center or community clinic. Our investigators conducted in-person interviews with each participant using a series of assessment batteries by online questionnaires. The GSPHS protocol received approval from the Research Ethics Committee of the Guangdong Provincial People's Hospital, Guangdong Academy of Medical Sciences [Reference number: GDREC2018543H (R1)].
Survey instruments
Symptomatology
The 9-item Patient Health Questionnaire (PHQ-9) was applied to measure symptoms of depression over the previous 2 weeks (22). Table 1 illustrates the reference names of the nine items. Each response option was assigned a value of 0 (not at all) to 3 (nearly every day), so the total points of the whole scale ranges from 0 to 27, with higher scores indicating more severe symptoms (23). The satisfactory psychometric qualities for screening depression symptoms have been consistently confirmed in the general population using the Chinese version of PHQ-9 (24). This study's Cronbach's alpha was 0.91, indicating acceptable internal consistency.
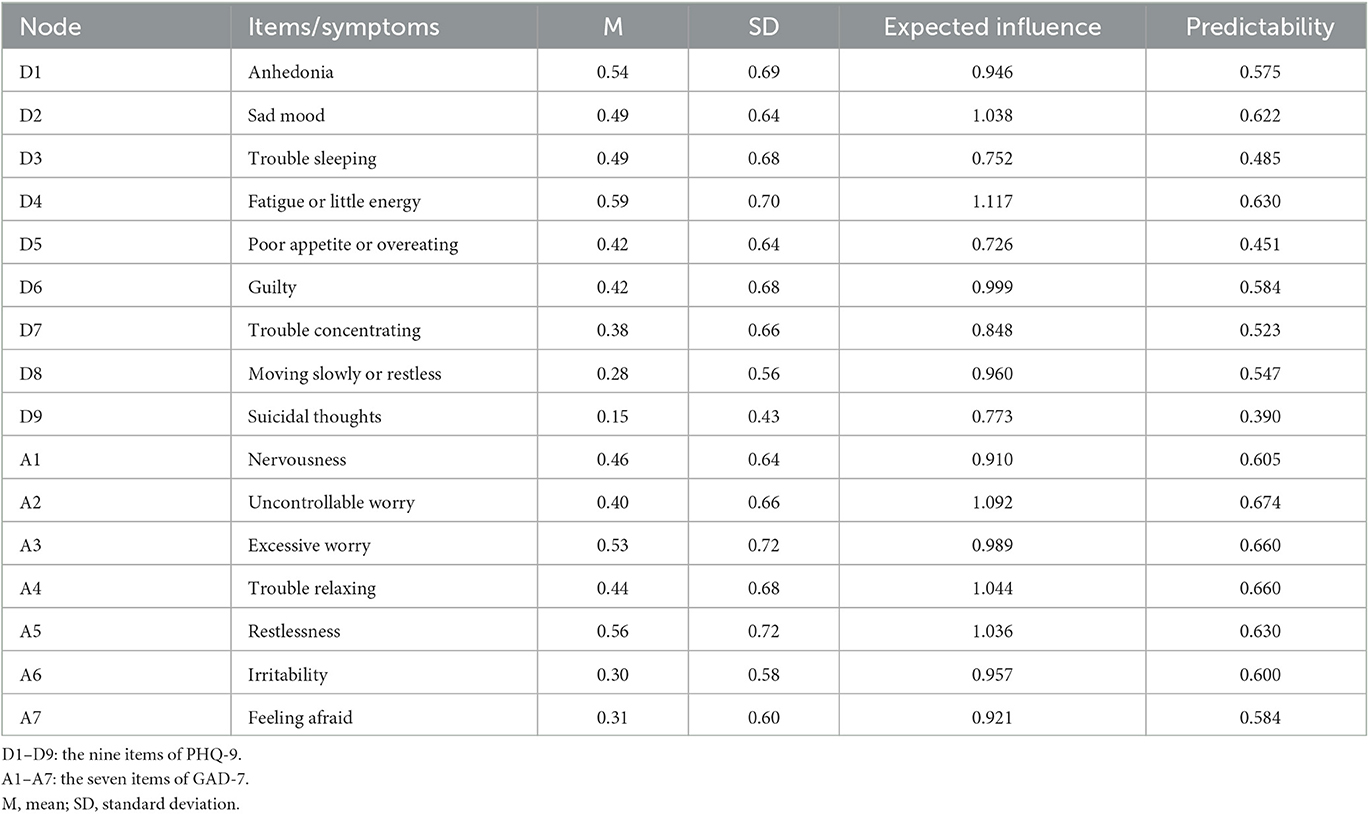
Table 1. Mean, standard deviation, expected influence, and predictability of depressive and anxiety symptoms assessed using the PHQ-9 and GAD-7.
The 7-items Generalized Anxiety Disorder (GAD-7) scale was used to assess anxiety symptoms over the 2 weeks (25). The reference name of each item is shown in Table 1. The GAD-7 option settings are identical to those of the PHQ-9 scale, with total scores ranging from 0 to 21, where greater values signify higher levels of anxiety symptoms. The Chinese version of GAD-7 has been identified with excellent retesting reliability and validity in large samples from a primary care setting (26). The Cronbach's alpha coefficient for GAD-7 in our investigation was 0.93.
Lifestyles
A collection of questions in the questionnaire served as a lifestyle measurement. For example, participants might have been asked “What kind of habitual dietary rhythm do you have?” and then the answers have been converted into a score relying on the following four classes: 1 = Regular 3 meal/day; 2 = Regular 2 meal/day; 3 = Regular 4 meal/day, and 4 = Irregular diet rhythm. For physical exercise frequency, respondents were investigated with the question “How often do you work out in the past year?” for which, the response was categorized into four levels: 1 = more than 3 times/week; 2 = 1–2 times/week; 3 = 1–3 times/month, and 4 = hardly or never exercise. Tobacco use was classified into never smoked, former smoker, and current smoker. A current smoker was described as smoking at least one cigarette per day and for 6 months or longer. A current drinker in alcohol consumption was designated as consuming on average one time or more of standard alcoholic drinks a week.
Statistical analysis
R software (version 4.0.5) was applied in all statistical analyses, including network estimation, network comparison and sensitivity analyses, and network accuracy and stability analyses.
Network estimation
Different correlations among symptoms, lifestyles, and covariates were estimated from simple to complex models. These models used nodes of networks to denote variables that were linked by edges with varying thickness lines. These edges depended on the strengths of partial correlations between nodes with the confounding effects of all the other nodes being controlled. The skewed distributions of the PHQ-9 and GAD-7 total scores were normalized, and we used non-paranormal transformation to compute non-parametric correlation (27). Considering varying data types in this study, including continuous and categorical variables, mixed graphical models using the function of R package mgm (version 1.2-12) were adopted to analyze network predictability (28). The least absolute shrinkage and selection operator (LASSO) in mgm contributed to reducing the number of spurious edges and prune network structures (29), which shrank all edge weights and set small weights to zero (30). To avoid the over-fitting issue, the Extended Bayesian Information Criterion (EBIC) was used to select hyperparameter lambda for the strength of the penalty (31). The EBIC was set to 0 or 0.25 to run all models. Expected influence (EI) was designated as an indicator of node importance in this study based on the function centrality Plot of the R-package qgraph (version 1.6.9) (32). The EI (i.e., node strength) is defined as the normalized sum of all edge weights for a given node and has been proven to be more reliable than the other two centrality indices (i.e., closeness and betweenness) (33, 34). A bridge centrality index (i.e., bridge strength) was also measured based on the function bridge of the R-package networktools (version 1.4.0) to identify bridge connectivity linking different nodes (35). These nodes in our case are clusters of anxiety and depression symptoms and lifestyles. The absolute sum of node edge weights pointing to another network node is used to calculate the EI of a bridge (36). R2 was used to estimate the predictability of each node by taking each node in turn and regressing all other nodes on it (37, 38). The network visualizations were conducted using the R package qgraph (version 1.6.9) (17). The extent of the correlation was indicated by the thickness of the edge. Green edges represented positive relationships, whereas red edges demonstrated negative relationships.
Network comparison and sensitivity analyses
The R-package Network Comparison Test (version 2.2.1) on permutation-based test was used to compare networks among different gender subgroups (39). There were two invariance tests containing network structure invariance and global strength invariance. We evaluated the sensitivity of networks by adding covariates of age and gender. In this study, various variables were modeled using mixed model analysis in mgm package, such as continuous variables for scores, nominal variables for gender, and ordinal variables for lifestyle factors.
Network accuracy and stability analyses
Network stability of node strength and bridge strength were examined through the case dropping bootstrap procedure via R-package bootnet (version 1.5.0) (40). Specifically, we compared centrality indices after reducing cases to the original ones, after randomly removing a subset of samples. When the centrality index did not differ significantly after a large number of samples were excluded from the dataset and the correlation stability coefficient (CS-C) was used to quantify, networks were judged to be robust (40). In general, the CS-C values were typically >0.5 or, better yet, >0.7, indicating a stable network (40). The function bootnet was used to visualize the bootstrapped difference tests for edge weights and the results of 95% confidence intervals of all edge weights by 500 bootstraps.
Results
Sample characteristics
Out of the 17,132 participants, 13,768 responded to the survey for an overall response rate of 80.4%. The sample's age ranges from 18 to 85 years, with a mean age of 34.3 years (SD = 11.04). A total of 6,159 (44.7%) participants were men and 7,609 (55.3%) were women. There were 10,633 (77.2%) participants who had never smoked tobacco, whereas 2,074 (15.1%) participants were current smokers and 1,061 (7.7%) participants were former smokers; 2,361 (17.1%) people consumed alcohol at least once per week; 11,083 (80.5%) participants had regular three meals per day, 944 (6.9%) had two meals per day, 802 (5.8%) had four meals per day, and 939 (6.8%) had an irregular diet rhythm. There were 3,730 (27.1%) participants who hardly or never exercised, 4,488 (32.6%) occasionally exercised, 2,813 (20.4%) exercised one or two times per week, and 2,737 (19.9%) did frequent exercise (Supplementary Table 1). The mean overall PHQ-9 and GAD-7 scores were 3.76 ± 4.38 and 3.00 ± 3.85, respectively. The descriptive statistics of all symptoms are presented in Table 1.
Network of depression-anxiety symptoms
Figure 1A presents the network of depression and anxiety symptoms without controlling covariates. The corresponding correlative matrix is shown in Supplementary Table 2. For depressive symptoms, the strongest association pertained to the edges between anhedonia and fatigue or little energy (D1–D4). The relationship between trouble sleeping and fatigue or little energy (D3–D4), anhedonia and sad mood (D1–D2), sad mood and guilty (D2–D6), trouble concentrating and moving slowly or restlessness (D7–D8), were also strong. For anxiety symptoms, the strongest association pertained to the edges between irritability and feeling afraid (A6–A7). The relationship between nervousness and uncontrollable worry (A1–A2), uncontrollable worry and excessive worry (A2–A3), excessive worry and trouble relaxing (A3–A4), and excessive worry and restlessness (A3–A5) were also strong. These correlations are visualized in Supplementary Figure 1. The results of centrality and predictability in the depressive and anxiety network among the participants are shown in Figure 1B and Table 1. Fatigue or little energy (D4) has the highest expected influence (i.e., node strength), followed by uncontrollable worry (A2), trouble relaxing (A4), and sad mood (D2). Surrounding nodes of each node explained 57.63% of the variance. The centrality index of bridge strength exhibited that guilty (D6) indicated the highest bridge strength, followed by sad mood (D2), moving slowly or restlessness (D8), and suicidal thoughts (D9; Figure 1C).
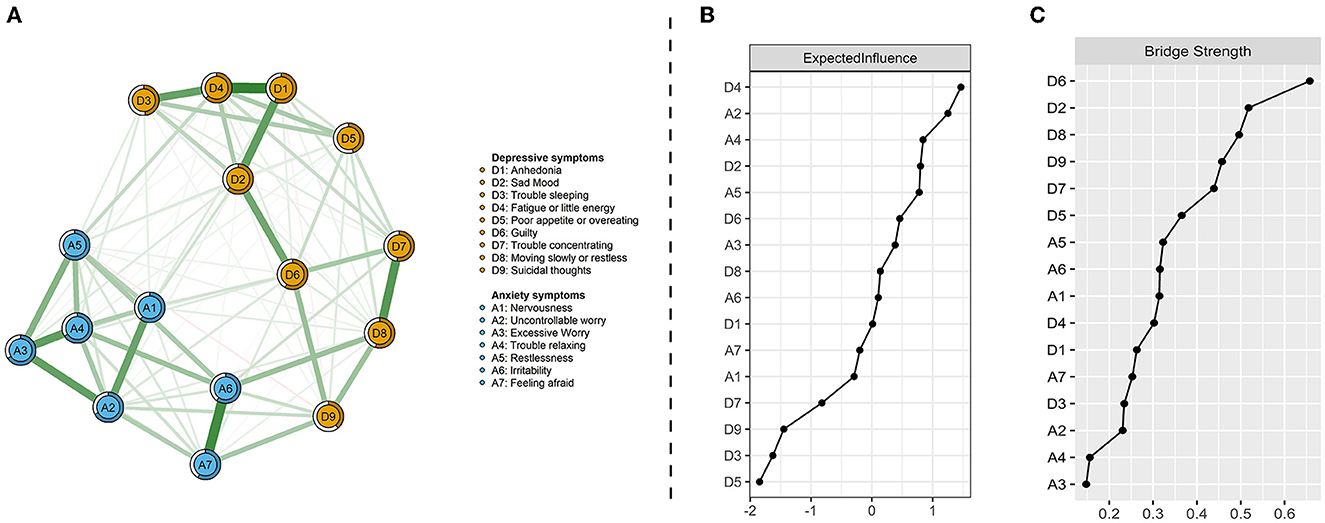
Figure 1. Network visualization of depression and anxiety symptoms (A), centrality index of expected influence (B), and bridge centrality index of bridge strength (C). Green edges indicate positive correlations and red edges indicate negative correlations; the thickness of lines is proportional to the strength of the correlation. The darker outer circle of each node displays predictability. The right panels respectively show the values of expected influence and bridge strength in order.
Network of depression-anxiety symptoms and lifestyles
Figure 2A displays the relationships between depression-anxiety symptoms and lifestyle factors, and Table 2 lists their direct interconnections. They were mostly positively associated, but only two negative edges were found in a total of 20 interrelating nodes. Both current tobacco and alcohol consumption were positively linked with suicidal thoughts (D9) and irritability (A6). Habitual diet rhythm and physical exercise frequency shared connections with poor appetite or overeating (D5), guilty (D6), and suicidal thoughts (D9). Suicidal thoughts were identified as common bridging symptoms in the network of comorbid depression-anxiety and lifestyles. In addition, a unique relationship between irregular diet rhythm and trouble sleeping (D3), and the respective relationships between reduced physical exercise frequency and fatigue or little energy (D4), and restlessness (A5) were also found (Table 2). This has been confirmed by the bridge centrality index, which indicated that suicidal thoughts, irritability, and guilty exhibited the highest connectivity with lifestyles (Figure 2B).
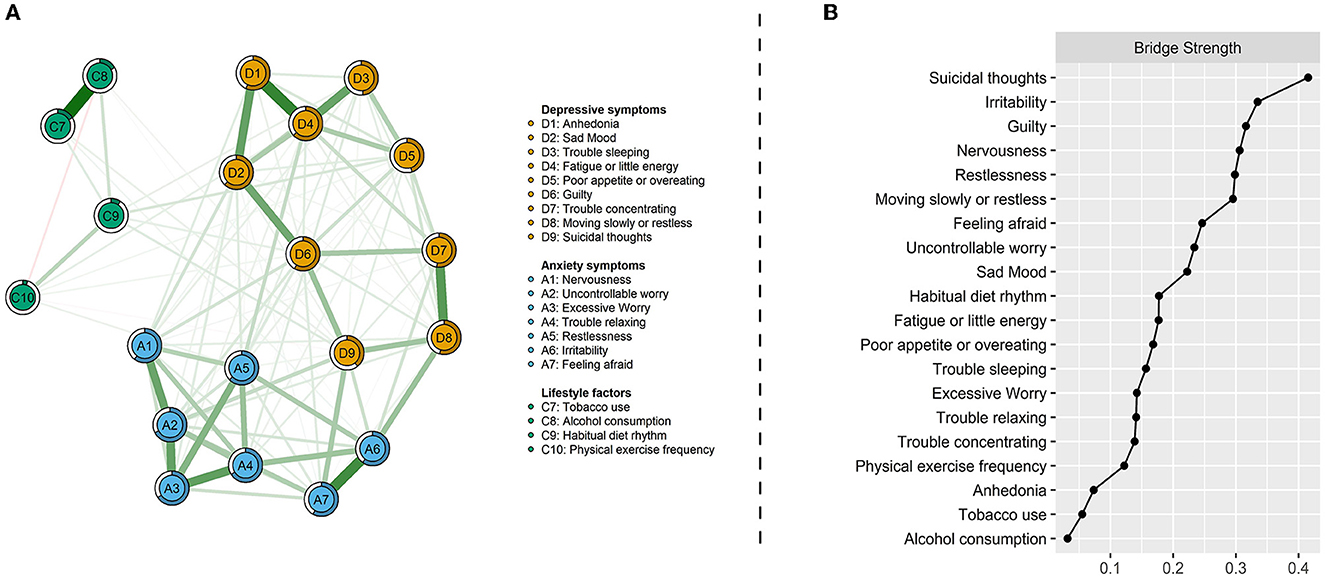
Figure 2. Network visualization of depression-anxiety symptoms and lifestyles (A) and bridge centrality index of bridge strength (B). Green edges indicate positive correlations and red edges indicate negative correlations; the thickness of lines is proportional to the strength of the correlation. The darker outer circle of each node displays predictability. Bridge strength represents each node's connectivity with the other network.
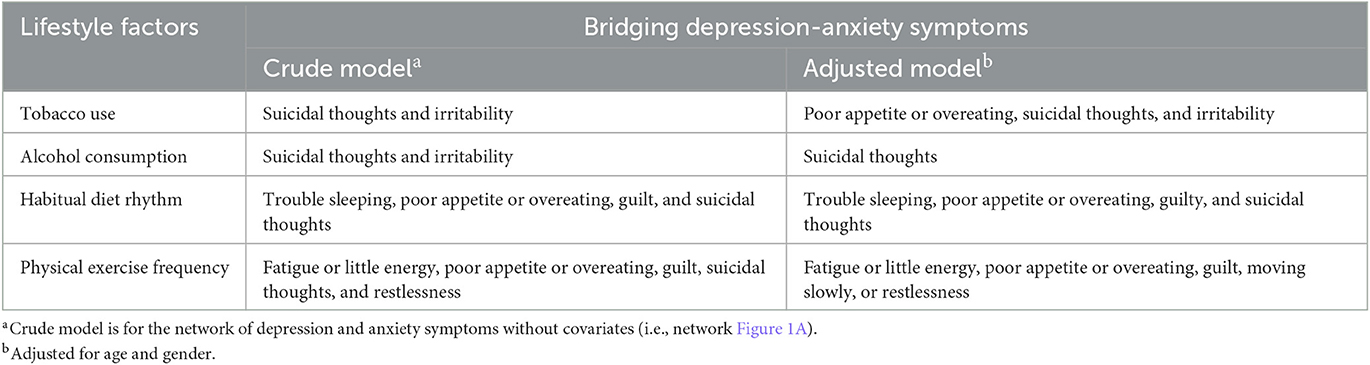
Table 2. Bridge connections between lifestyles and depression-anxiety symptoms.
Network comparison and sensitivity analyses
When correcting for age and gender, there was no apparent difference in overall network structure and connectivity of depression-anxiety symptoms (Figure 1A vs. Supplementary Figure 2), in which key central and bridge symptoms remained the same. As for the network incorporating lifestyles clusters, changes in bridge connections are demonstrated in Table 2. Compared to that without adjusting age and gender (Figure 2A vs. Supplementary Figure 3), relations between habitual diet rhythm and depression-anxiety symptoms were preserved. Tobacco use increased interconnection with poor appetite or overeating, whereas alcohol consumption cut down the link with irritability. Direct interrelation between physical exercise frequency and suicidal thoughts and restlessness disappeared, while an association with moving slowly or restlessness emerged. All network models were reconstructed with a more conservative lambda of 0.25 (see Supplementary Figures 4–7), which presented identically with original networks (r > 0.9 for all correlation coefficients of adjacency matrices). Finally, in the depression-anxiety symptoms model, the results of networks between different gender subgroups were significantly different in overall structure (M = 0.120, P < 0.001) and connectivity (S = 0.203, P = 0.01). In another model of depression-anxiety symptoms and lifestyles, networks comparison between male and female residents was statistically different in overall structure (M = 0.126, P < 0.001) but not different in connectivity (S = 0.023, P = 0.84).
Network accuracy and stability analyses
After bootstrapping 500 times for all models, these networks presented high stability. All results about edge weights significance and strength centrality difference testing, as well as edge weight accuracy, have been visualized in the Supplementary Figures 8–13. The case-dropping bootstrap analyses showed that all correlations were >0.9, manifesting the networks remained stable, where 70% of observations were randomly excluded from the original sample, the estimated correlation of node centrality between the reduced sample and the original sample was 0.9 at least (Supplementary Figures 14, 15).
Discussion
To the best of our knowledge, this is the largest population-based study employing the network method to explore the interconnections between the symptoms of depression and anxiety as well as between those symptoms and various lifestyles in China. In the present study, a network around interrelated symptoms was established, such as fatigue or little energy, uncontrollable worry, and trouble relaxing. Furthermore, a number of distinct symptom-lifestyle connections have indeed been discovered, such as the correlations between current tobacco/alcohol consumption and suicidal thoughts and irritability; the correlations among habitual diet rhythm, physical exercise frequency and poor appetite or overeating, guilty, and suicidal thoughts. Suicidal thoughts have been recognized as common bridging symptoms in the network of depression, anxiety, and lifestyles. These results offer fresh information about targeted lifestyle-based regimens that can effectively cure individual depression and anxiety symptoms.
We first examined the interrelation between depression and anxiety symptoms in the general population. The majority of the strongest edges in the entire network of depression-anxiety symptoms lay in the depressive community, which is in line with previous research studies (41, 42). However, a study by Bai et al. (43) utilizing the college students population came to a different conclusion. The discrepancy may be the results from various populations and sample methods. This study discovered the strongest association between anhedonia and fatigue or little energy, which was also the second-strongest edge of the depression and anxiety symptoms network in another study on female nursing students (41). Anhedonia and fatigue are characteristic symptoms of psychodiagnostics and usually occur simultaneously, especially in major depressive disorder (MDD) and schizophrenia based on the Diagnostic and Statistical Manual of Mental Disorders (DSM-V) (44). Indeed, some reports suggested that fatigue and anhedonia share relevant or overlapping constructs (45). Interferon-induced inflammation-altered presynaptic striatal dopamine activity might help us to understand the potential collective mechanism of fatigue and anhedonia (46). In addition, fatigue or little energy has the largest expected influence in the overall model, followed by uncontrollable worry and trouble relaxing, demonstrating their substantial involvement in a comorbid depression-anxiety network and possibly targeted symptoms for intervention. Fatigue is prevalent among the population with a prevalence incidence of 5–45% (47). This is likely attributed to a sedentary lifestyle, a lack of physical activity, and poor sleep quality. Anxiety symptoms, such as uncontrollable worry and trouble relaxing, have also a high expected influence, which is in agreement with previous studies on college students (43). In today's fast-paced culture, people's lives have become riddled with anxious moods as a result of life stress, work rhythm, interpersonal relationships, and social difficulties. Relaxation, cognitive behavior therapy, graded exercise therapy, and other therapies could help to alleviate these symptoms. The centrality index of bridge strength is vital to identify influential bridge symptoms that are responsible for exciting and sustaining comorbid psychopathological networks (48). Guilt indicated the highest bridge strength, which was first noticed in the network of depressed mood and co-morbid anxiety states. Guilt is a central feature of depression, which is usually expressed as self-condemned, worthless, powerless, inferiority, hopeless, and helpless emotions (49, 50). Guilt can also contribute to the course of depression. The sad mood has also been observed as a bridge symptom in previous findings on the bridge symptoms in depression and anxiety (36, 41, 42). Additionally, a prior study on the network of female nursing students showed that moving slowly or restlessness was prioritized because of its connection to suicidal thoughts (41). Our findings suggest that targeted therapies that address these bridge symptoms may lower the incidence of co-occurring depression and anxiety.
When lifestyle factors were added into comorbid models, bridge connections between lifestyles and symptoms of depression and anxiety were elucidated. Suicidal thoughts, a serious symptom of depression, were identified as a common bridging symptom between depression-anxiety disorders and lifestyles. Suicidal behavior was portrayed as the outcome of a co-action of mental symptoms, medical conditions, and lifestyle choices (51, 52). The risk of suicide is increased by psychiatric diseases, such as MDD, which have lifestyle behaviors as part of their etiopathogenesis (53, 54). Furthermore, unwholesome lifestyles that contain poor diets, tobacco and alcohol abuse, and a lack of physical activity may enhance the risk of somatic diseases such as obesity, hypertension, metabolic syndrome, and cardiovascular diseases (55). Suicidal thoughts are more common in people suffering from somatic multi-morbidity (56), which is likely due to impairment to the body's system that regulates the stress response, immunologic function, and inflammation (57).
Additionally, the positive connection between current tobacco and alcohol consumption and irritability has also been reported in this study. Emotional disturbance, particularly in depression and anxiety comorbid conditions, has an impact on the construct that regulates aggression, irritability, and agitation, which is an interconnected triad known as “aggression-related behavioral states (ARBS)” (58). Existing preclinical evidence and animal models have shown that nicotinic acetylcholine receptors (nAChRs) affect ARBS (59, 60). Upregulation and desensitization of these receptors may be the cause of smokers' periodic emotional disorders who undergone chronic nicotine exposure (61). A controlled study for alcohol-dependent patients exhibited that drinkers had significantly higher levels of limbic irritability than healthy controls (62). Alcohol consumption is closely connected with the neuropeptides vasopressin (AVP) system in the brain (63). AVP has multiple functions in the cerebrum involving social behaviors, stress, and anxiety responses, and all of these are found to be related to alcohol misuse (64). Alcoholics typically exhibit alcohol cravings, uncontrollable alcohol consumption, and negative mood, including increased anxiety and irritability (65). Irregular diet rhythm was found to be associated with a variety of depressive symptoms including poor appetite or overeating, trouble sleeping, and guilt. There is mounting evidence that depressive disorders have notable lifestyle-driven components (66). Diet and nutrition may significantly alter how depression and anxiety are regulated (67). There are bidirectional relationships between irregular eating habits and poor appetite or overeating. The circadian rhythm is influenced by metabolic processes and energy balance (68). Poor nutrition and feeding schedules might disturb the sleep cycle and thus bring about sleep-related consequences. Physical inactivity was positively connected with fatigue or little energy, poor appetite or overeating, guilt, and restlessness. Long-term and continuous physical activity has been shown to have benefits for emotion management in numerous studies (69). Exercise may induce energy expenditure and heat the body to activate sleep and thus relieve fatigue and increase vigor (70). Physical exercises as one of the treatment strategies for depressive and anxiety disorders involve underlying possible mechanisms relying on the regulation of the hypothalamic-pituitary adrenal axis, upregulation of brain-derived neurotrophic factor, improvement of neurogenesis and cerebral blood flow, and so on (71–73).
The current study outperforms the previous findings in several ways. This is a population-based design that has a large sample size of 13,768 residents and a high response rate of 80.4% using a multistage stratified cluster sampling technique. With consistent results and a conceptual replication of the first presented symptom-lifestyle research, certain shared correlations between individual depression and anxiety symptoms and lifestyle factors were discovered. Notwithstanding, it was important to interpret these results discreetly. First, due to the cross-sectional design, any inferences about the causality were hindered. These associations might be validated by further longitudinal studies and intervention studies. Second, the measurement of depression and anxiety symptoms was performed through self-reported tools, which may introduce reporter bias. Finally, our identification of lifestyle factors was based on straightforward definitions, such as dietary rhythm and exercise frequency. Diet quality and specific patterns, as well as exercise types and intensity, can be explored in future fields.
Conclusion
Overall, this study was conducted on a big sample size and multiple variables to explore the association between depression and anxiety symptoms and lifestyles. We have not only investigated the comprehensive impact of multiple lifestyle factors but also examined the inner link between lifestyle factors and disease symptoms. Our findings did fill the gap in symptomatology-lifestyle connections. Moreover, the core and bridge symptoms found in this study were latent targets to prevent and intervene in comorbid depression and anxiety. Current research served as a reminder that when depressed and anxious symptoms are reported, clinical practitioners and disease managers should be aware of any potential unhealthy lifestyle concerns that may be present. Healthcare workers should not overlook the influence of personal lifestyles but rather raise the alarm and urge people to seek more precise disease management and follow-up.
Data availability statement
The raw data supporting the conclusions of this article will be made available by the authors, without undue reservation.
Ethics statement
The studies involving human participants were reviewed and approved by the Research Ethics Committee of the Guangdong Provincial People's Hospital, Guangdong Academy of Medical Sciences [Reference number: GDREC2018543H (R1)]. The patients/participants provided their written informed consent to participate in this study.
Author contributions
S-BW conceived the idea of this study, analyzed data, and drafted the manuscript. W-QX had been involved in manuscript original drafting, conceptualization, writing review and editing, and funding acquisition. L-JG assisted in designing the study and advised the data analysis process. W-YT and H-RZ conducted data curation and writing review and editing. C-LH and F-JJ provided critical feedback toward developing the research question and results interpretation. All authors contributed to the article and approved the submitted version.
Funding
This study was funded by the National Natural Science Foundation of China (Grant No. 81803302) and National Social Science Foundation of China (Grant No. 19ZDA360). The Guangdong Sleep and Psychosomatic Health Survey was supported by Guangdong Provincial Innovation Platform of Translational Medicine (Early Recognition and Intervention of Major Mental Diseases), Guangdong Provincial Innovation Platform of Public Health.
Acknowledgments
The authors sincerely thank all the interviewers and participants in the study.
Conflict of interest
The authors declare that the research was conducted in the absence of any commercial or financial relationships that could be construed as a potential conflict of interest.
Publisher's note
All claims expressed in this article are solely those of the authors and do not necessarily represent those of their affiliated organizations, or those of the publisher, the editors and the reviewers. Any product that may be evaluated in this article, or claim that may be made by its manufacturer, is not guaranteed or endorsed by the publisher.
Supplementary material
The Supplementary Material for this article can be found online at: https://www.frontiersin.org/articles/10.3389/fpsyt.2023.1104841/full#supplementary-material
References
1. Vigo D, Thornicroft G, Atun R. Estimating the true global burden of mental illness. Lancet Psychiatry. (2016) 3:171–8. doi: 10.1016/S2215-0366(15)00505-2
2. Lamers F, van Oppen P, Comijs HC, Smit JH, Spinhoven P, van Balkom AJ, et al. Comorbidity patterns of anxiety and depressive disorders in a large cohort study: The Netherlands Study of Depression and Anxiety (NESDA). J Clin Psychiatry. (2011) 72:341–8. doi: 10.4088/JCP.10m06176blu
3. Phongsavan P, Merom D, Bauman A, Wagner R. Mental illness and physical activity: Therapists' beliefs and practices. Aust N Z J Psychiatry. (2007) 41:458–9. doi: 10.1080/00048670701266862
4. Tremblay MS, Carson V, Chaput JP, Connor Gorber S, Dinh T, Duggan M, et al. Canadian 24-hour movement guidelines for children and youth: An integration of physical activity, sedentary behaviour, and sleep. Appl Physiol Nutr Metab. (2016) 41:S311–27. doi: 10.1139/apnm-2016-0151
5. Malhi GS, Bassett D, Boyce P, Bryant R, Fitzgerald PB, Fritz K, et al. Royal Australian and New Zealand College of Psychiatrists clinical practice guidelines for mood disorders. Aust N Z J Psychiatry. (2015) 49:1087–206. doi: 10.1177/0004867415617657
6. Firth J, Solmi M, Wootton RE, Vancampfort D, Schuch FB, Hoare E, et al. A meta-review of “lifestyle psychiatry”: The role of exercise, smoking, diet and sleep in the prevention and treatment of mental disorders. World Psychiatry. (2020) 19:360–80. doi: 10.1002/wps.20773
7. Liu M, Wu L, Yao S. Dose-response association of screen time-based sedentary behaviour in children and adolescents and depression: A meta-analysis of observational studies. Br J Sports Med. (2016) 50:1252–8. doi: 10.1136/bjsports-2015-095084
8. Schuch FB, Stubbs B, Meyer J, Heissel A, Zech P, Vancampfort D, et al. Physical activity protects from incident anxiety: A meta-analysis of prospective cohort studies. Depr Anxiety. (2019) 36:846–58. doi: 10.1002/da.22915
9. Taylor AE, Fluharty ME, Bjørngaard JH, Gabrielsen ME, Skorpen F, Marioni RE, et al. Investigating the possible causal association of smoking with depression and anxiety using Mendelian randomisation meta-analysis: The CARTA consortium. Br Med J Open. (2014) 4:e006141. doi: 10.1136/bmjopen-2014-006141
10. Saghafian F, Malmir H, Saneei P, Milajerdi A, Larijani B, Esmaillzadeh A. Fruit and vegetable consumption and risk of depression: Accumulative evidence from an updated systematic review and meta-analysis of epidemiological studies. Br J Nutr. (2018) 119:1087–101. doi: 10.1017/S0007114518000697
11. Choi KW, Chen CY, Stein MB, Klimentidis YC, Wang MJ, Koenen KC, et al. Assessment of bidirectional relationships between physical activity and depression among adults: A 2-Sample Mendelian Randomization Study. J Am Med Assoc Psychiatry. (2019) 76:399–408. doi: 10.1001/jamapsychiatry.2018.4175
12. Su Y, Wang SB, Zheng H, Tan WY, Li X, Huang ZH, et al. The role of anxiety and depression in the relationship between physical activity and sleep quality: A serial multiple mediation model. J Affect Disord. (2021) 290:219–26. doi: 10.1016/j.jad.2021.04.047
13. Jacobson NC, Newman MG. Anxiety and depression as bidirectional risk factors for one another: A meta-analysis of longitudinal studies. Psychol Bull. (2017) 143:1155–200. doi: 10.1037/bul0000111
14. Fried EI, Nesse RM. The impact of individual depressive symptoms on impairment of psychosocial functioning. PLoS ONE. (2014) 9:e90311. doi: 10.1371/journal.pone.0090311
15. Borsboom D. A network theory of mental disorders. World Psychiatry. (2017) 16:5–13. doi: 10.1002/wps.20375
16. Robinaugh DJ, Hoekstra RHA, Toner ER, Borsboom D. The network approach to psychopathology: A review of the literature 2008-2018 and an agenda for future research. Psychol Med. (2020) 50:353–66. doi: 10.1017/S0033291719003404
17. Epskamp S, Cramer A, Waldorp L, Schmittmann V, Borsboom D. qgraph: Network visualizations of relationships in psychometric data. J Stat Softw. (2012) 48:i04. doi: 10.18637/jss.v048.i04
18. van Loo HM, Schoevers RA, Kendler KS, de Jonge P, Romeijn JW. Psychiatric comorbidity does not only depend on diagnostic thresholds: An illustration with major depressive disorder and generalized anxiety disorder. Depr Anxiety. (2016) 33:143–52. doi: 10.1002/da.22453
19. Cramer AO, Waldorp LJ, van der Maas HL, Borsboom D. Comorbidity: A network perspective. Behav Brain Sci. (2010) 33:137–50. doi: 10.1017/S0140525X09991567
20. Xu WQ, Tan WY, Li XL, Huang ZH, Zheng HR, Hou CL, et al. Prevalence and correlates of depressive and anxiety symptoms among adults in Guangdong Province of China: A population-based study. J Affect Disord. (2022) 308:535–44. doi: 10.1016/j.jad.2022.04.089
21. Chen X, Wang SB, Li XL, Huang ZH, Tan WY, Lin HC, et al. Relationship between sleep duration and sociodemographic characteristics, mental health and chronic diseases in individuals aged from 18 to 85 years old in Guangdong province in China: A population-based cross-sectional study. BMC Psychiatry. (2020) 20:455. doi: 10.1186/s12888-020-02866-9
22. Kroenke K, Spitzer RL, Williams JB. The PHQ-9: Validity of a brief depression severity measure. J Gen Intern Med. (2001) 16:606–13. doi: 10.1046/j.1525-1497.2001.016009606.x
23. Levis B, Benedetti A, Thombs BD. Accuracy of Patient Health Questionnaire-9 (PHQ-9) for screening to detect major depression: Individual participant data meta-analysis. Br Med J. (2019) 365:l1476. doi: 10.1136/bmj.l1476
24. Chen S, Chiu H, Xu B, Ma Y, Jin T, Wu M, et al. Reliability and validity of the PHQ-9 for screening late-life depression in Chinese primary care. Int J Geriatr Psychiatry. (2010) 25:1127–33. doi: 10.1002/gps.2442
25. Spitzer RL, Kroenke K, Williams JB, Löwe B. A brief measure for assessing generalized anxiety disorder: The GAD-7. Arch Intern Med. (2006) 166:1092–7. doi: 10.1001/archinte.166.10.1092
26. Tong X, An D, McGonigal A, Park SP, Zhou D. Validation of the Generalized Anxiety Disorder-7 (GAD-7) among Chinese people with epilepsy. Epilepsy Res. (2016) 120:31–6. doi: 10.1016/j.eplepsyres.2015.11.019
27. Liu H, Han F, Yuan M, Lafferty J, Wasserman L. High-dimensional semiparametric gaussian copula graphical models. Ann Stat. (2012) 40:2293–326. doi: 10.1214/12-AOS1037
28. Haslbeck J, Waldorp L. mgm: Estimating time-varying mixed graphical models in high-dimensional data. J Stat Softw. (2020) 93:i08. doi: 10.18637/jss.v093.i08
29. Liu R, Chen X, Qi H, Feng Y, Su Z, Cheung T, et al. Network analysis of depressive and anxiety symptoms in adolescents during and after the COVID-19 outbreak peak. J Affect Disord. (2022) 301:463–71. doi: 10.1016/j.jad.2021.12.137
30. Robert A, Tibshirani A. Regression shrinkage and selection via the lasso. J Royal Stat Soc SerB. (1996) 1996:tb02080. doi: 10.1111/j.2517-6161.1996.tb02080.x
31. Foygel R, Drton M. Extended bayesian information criteria for gaussian graphical models. Adv Neural Inf Process Syst. (2010) 2010:604–12. doi: 10.48550/arXiv.1011.6640
32. Borsboom D, Cramer AO. Network analysis: An integrative approach to the structure of psychopathology. Annu Rev Clin Psychol. (2013) 9:91–121. doi: 10.1146/annurev-clinpsy-050212-185608
33. Bringmann LF, Elmer T, Epskamp S, Krause RW, Schoch D, Wichers M, et al. What do centrality measures measure in psychological networks? J Abnorm Psychol. (2019) 128:892–903. doi: 10.1037/abn0000446
34. Epskamp S, Rhemtulla M, Borsboom D. Generalized network psychometrics: Combining network and latent variable models. Psychometrika. (2017) 82:904–27. doi: 10.1007/s11336-017-9557-x
35. Jones P. Networktools: Assorted Tools for Identifying Important Nodes in Networks. R Package Version 100. (2022). Available online at: https://cran.r-project.org/package=networktools
36. Jones PJ, Ma R, McNally RJ. Bridge centrality: A network approach to understanding comorbidity. Multivariate Behav Res. (2021) 56:353–67. doi: 10.1080/00273171.2019.1614898
37. Haslbeck JMB, Fried EI. How predictable are symptoms in psychopathological networks? A reanalysis of 18 published datasets. Psychol Med. (2017) 47:2767–76. doi: 10.1017/S0033291717001258
38. Haslbeck JMB, Waldorp LJ. How well do network models predict observations? On the importance of predictability in network models. Behav Res Methods. (2018) 50:853–61. doi: 10.3758/s13428-017-0910-x
39. van Borkulo CD, van Bork R, Boschloo L, Kossakowski JJ, Tio P, Schoevers RA, et al. Comparing network structures on three aspects: a permutation test. Psychol Methods. (2022). doi: 10.1037/met0000476
40. Epskamp S, Borsboom D, Fried EI. Estimating psychological networks and their accuracy: A tutorial paper. Behav Res Methods. (2018) 50:195–212. doi: 10.3758/s13428-017-0862-1
41. Ren L, Wang Y, Wu L, Wei Z, Cui LB, Wei X, et al. Network structure of depression and anxiety symptoms in Chinese female nursing students. BMC Psychiatry. (2021) 21:279. doi: 10.1186/s12888-021-03276-1
42. Garabiles MR, Lao CK, Xiong Y, Hall BJ. Exploring comorbidity between anxiety and depression among migrant Filipino domestic workers: A network approach. J Affect Disord. (2019) 250:85–93. doi: 10.1016/j.jad.2019.02.062
43. Bai W, Cai H, Liu S, Chen X, Sha S, Cheung T, et al. Anxiety and depressive symptoms in college students during the late stage of the COVID-19 outbreak: A network approach. Transl Psychiatry. (2021) 11:638. doi: 10.1038/s41398-021-01738-4
44. First MB. Diagnostic and statistical manual of mental disorders, 5th edition, and clinical utility. J Nerv Ment Dis. (2013) 201:727–9. doi: 10.1097/NMD.0b013e3182a2168a
45. Billones RR, Kumar S, Saligan LN. Disentangling fatigue from anhedonia: A scoping review. Transl Psychiatry. (2020) 10:273. doi: 10.1038/s41398-020-00960-w
46. Capuron L, Pagnoni G, Drake DF, Woolwine BJ, Spivey JR, Crowe RJ, et al. Dopaminergic mechanisms of reduced basal ganglia responses to hedonic reward during interferon alfa administration. Arch Gen Psychiatry. (2012) 69:1044–53. doi: 10.1001/archgenpsychiatry.2011.2094
47. Finsterer J, Mahjoub SZ. Fatigue in healthy and diseased individuals. Am J Hosp Palliat Care. (2014) 31:562–75. doi: 10.1177/1049909113494748
48. Solmi M, Koyanagi A, Thompson T, Fornaro M, Correll CU, Veronese N. Network analysis of the relationship between depressive symptoms, demographics, nutrition, quality of life and medical condition factors in the Osteoarthritis Initiative database cohort of elderly North-American adults with or at risk for osteoarthritis. Epidemiol Psychiatr Sci. (2019) 29:e14. doi: 10.1017/S204579601800077X
49. Gambin M, Sharp C. The relations between empathy, guilt, shame and depression in inpatient adolescents. J Affect Disord. (2018) 241:381–7. doi: 10.1016/j.jad.2018.08.068
50. Bademci HZ, Karaday EF, Pur Karabulut G, Warfa N. Who is the helper? Who is being helped? The benefits of psychosocial support to correctional officers in Turkey. Psychodyn Practice. (2016) 22:1–15. doi: 10.1080/14753634.2016.1234946
51. Zhang J, Xiao S, Zhou L. Mental disorders and suicide among young rural Chinese: A case-control psychological autopsy study. Am J Psychiatry. (2010) 167:773–81. doi: 10.1176/appi.ajp.2010.09101476
52. Tousignant M, Pouliot L, Routhier D, Vrakas G, McGirr A, Turecki G. Schizophrenia, and schizoid-type psychosis: Role of life events and childhood factors. Suicide Life Threat Behav. (2011) 41:66–78. doi: 10.1111/j.1943-278X.2010.00002.x
53. Bruins J, Jörg F, Bruggeman R, Slooff C, Corpeleijn E, Pijnenborg M. The effects of lifestyle interventions on (long-term) weight management, cardiometabolic risk and depressive symptoms in people with psychotic disorders: A meta-analysis. PLoS ONE. (2014) 9:e112276. doi: 10.1371/journal.pone.0112276
54. Sharifi V, Eaton WW, Wu LT, Roth KB, Burchett BM, Mojtabai R. Psychotic experiences and risk of death in the general population: 24-27 year follow-up of the Epidemiologic Catchment Area study. Br J Psychiatry. (2015) 207:30–6. doi: 10.1192/bjp.bp.113.143198
55. Correll CU, Bobes J, Cetkovich-Bakmas M, Cohen D, Asai I, Detraux J, et al. Physical illness in patients with severe mental disorders. Prevalence I, impact of medications and disparities in health care. World Psychiatry. (2011) 10:52–77. doi: 10.1002/j.2051-5545.2011.tb00014.x
56. Xiong F, Wang L, Shen L, Guo W, Li S, Guan Q. The relationship between multimorbidity and suicidal ideation: A meta-analysis. J Psychosom Res. (2020) 138:110257. doi: 10.1016/j.jpsychores.2020.110257
57. Turecki G, Brent DA, Gunnell D, O'Connor RC, Oquendo MA, Pirkis J, et al. Suicide and suicide risk. Nat Rev Dis Prim. (2019) 5:74. doi: 10.1038/s41572-019-0121-0
58. Picciotto MR, Lewis AS, van Schalkwyk GI, Mineur YS. Mood and anxiety regulation by nicotinic acetylcholine receptors: A potential pathway to modulate aggression and related behavioral states. Neuropharmacology. (2015) 96:235–43. doi: 10.1016/j.neuropharm.2014.12.028
59. Lucidarme O, Seguin A, Daubin C, Ramakers M, Terzi N, Beck P, et al. Nicotine withdrawal and agitation in ventilated critically ill patients. Crit Care. (2010) 14:R58. doi: 10.1186/cc8954
60. Watkins SS, Koob GF, Markou A. Neural mechanisms underlying nicotine addiction: Acute positive reinforcement and withdrawal. Nicotine Tob Res. (2000) 2:19–37. doi: 10.1080/14622200050011277
61. Fenster CP, Whitworth TL, Sheffield EB, Quick MW, Lester RA. Upregulation of surface alpha4beta2 nicotinic receptors is initiated by receptor desensitization after chronic exposure to nicotine. J Neurosci. (1999) 19:4804–14. doi: 10.1523/JNEUROSCI.19-12-04804.1999
62. Jasova D, Bob P, Fedor-Freybergh P. Alcohol craving, limbic irritability, and stress. Med Sci Monit. (2007) 13:Cr543–7. doi: 10.1051/medsci/200723121173
63. Gulya K, Dave JR, Hoffman PL. Chronic ethanol ingestion decreases vasopressin mRNA in hypothalamic and extrahypothalamic nuclei of mouse brain. Brain Res. (1991) 557:129–35. doi: 10.1016/0006-8993(91)90125-F
64. Godino A, Renard GM. Effects of alcohol and psychostimulants on the vasopressin system: Behavioral implications. J Neuroendocrinol. (2018) 2018:e12611. doi: 10.1111/jne.12611
65. Godino A, Abate P, Amigone JL, Vivas L, Molina JC. Prenatal binge-like alcohol exposure alters brain and systemic responses to reach sodium and water balance. Neuroscience. (2015) 311:92–104. doi: 10.1016/j.neuroscience.2015.10.004
66. Marx W, Lane MM, Hockey M, Aslam H, Walder K, Borsini A, et al. Diet and depression: Future needs to unlock the potential. Mol Psychiatry. (2021) 21:2. doi: 10.1038/s41380-021-01360-2
67. Jacka FN, Pasco JA, Mykletun A, Williams LJ, Hodge AM, O'Reilly SL, et al. Association of Western and traditional diets with depression and anxiety in women. Am J Psychiatry. (2010) 167:305–11. doi: 10.1176/appi.ajp.2009.09060881
68. Godos J, Currenti W, Angelino D, Mena P, Castellano S, Caraci F, et al. Diet and mental health: Review of the recent updates on molecular mechanisms. Antioxidants. (2020) 9:40346. doi: 10.3390/antiox9040346
69. Cooney GM, Dwan K, Greig CA, Lawlor DA, Rimer J, Waugh FR, et al. Exercise for depression. Cochr Datab Syst Rev. (2013) 2013:CD004366. doi: 10.1002/14651858.CD004366.pub6
70. Driver HS, Taylor SR. Exercise and sleep. Sleep Med Rev. (2000) 4:387–402. doi: 10.1053/smrv.2000.0110
71. Deslandes A, Moraes H, Ferreira C, Veiga H, Silveira H, Mouta R, et al. Exercise and mental health: Many reasons to move. Neuropsychobiology. (2009) 59:191–8. doi: 10.1159/000223730
72. Sleiman SF, Henry J, Al-Haddad R, El Hayek L, Abou Haidar E, Stringer T, et al. Exercise promotes the expression of brain derived neurotrophic factor (BDNF) through the action of the ketone body β-hydroxybutyrate. Elife. (2016) 5:92. doi: 10.7554/eLife.15092
Keywords: network, depression, anxiety, lifestyles, population-based study
Citation: Wang S-B, Xu W-Q, Gao L-J, Tan W-Y, Zheng H-R, Hou C-L and Jia F-J (2023) Bridge connection between depression and anxiety symptoms and lifestyles in Chinese residents from a network perspective. Front. Psychiatry 14:1104841. doi: 10.3389/fpsyt.2023.1104841
Received: 28 February 2023; Accepted: 18 May 2023;
Published: 15 June 2023.
Edited by:
Steffen Schulz, Charité University Medicine Berlin, GermanyCopyright © 2023 Wang, Xu, Gao, Tan, Zheng, Hou and Jia. This is an open-access article distributed under the terms of the Creative Commons Attribution License (CC BY). The use, distribution or reproduction in other forums is permitted, provided the original author(s) and the copyright owner(s) are credited and that the original publication in this journal is cited, in accordance with accepted academic practice. No use, distribution or reproduction is permitted which does not comply with these terms.
*Correspondence: Wen-Qi Xu, winky181222@hotmail.com