Older Drivers' Experience With Automated Vehicle Technology: Interim Analysis of a Demonstration Study
 Sherrilene Classen
 Justin Mason
 James Wersal
 Virginia Sisiopiku
 Jason Rogers
- 1Department of Occupational Therapy, College of Public Health and Health Professions, University of Florida, Gainesville, FL, United States
- 2Department of Civil, Construction, and Environmental Engineering, School of Engineering, University of Alabama at Birmingham, Birmingham, AL, United States
Older adults (≥65 years) account for 20% of the US population but are over-represented in multiple-vehicle crashes. Automated vehicles (AVs) may hold safety benefits for older drivers, if they adopt this emerging technology. Therefore, this study is using a randomized, crossover design with pre- and post-exposure surveys, to quantify older drivers' perceptions, who were exposed to a simulator running in automated mode and riding in a highly automated shuttle (SAE Level 4). An interim analysis (N = 69) compares older drivers' perceptions before and after exposure to the automated simulator and automated shuttle. Early findings indicate that exposure to AV technology may positively affect older adults' perceptions to this emerging technology. In this study, older drivers' trust and perceived safety increased after being exposed to the driving simulator or automated shuttle compared to baseline. Older drivers' perceptions of perceived usefulness and cost of AVs, increased after being exposed to both modes of vehicle automation compared to baseline whereas their perceptions did not change after their first AV exposure (regardless of it was the simulator or shuttle). Exposing older adults to an automated simulator or on-road automated shuttle may promote older adults' acceptance and adoption of AVs.
Introduction
The number of older adults (≥65 years) is nearing 20% of the US population, and Florida is leading the nation with 25% of its population being older adults (US Census Bureau, 2020). In 2017, there were almost 44 million licensed drivers aged 65 and older in the United States, a 63% increase from 1999 (Federal Highway Administration, 2018). Driving is an important mode of transportation for older adults that ensures mobility and independence and yields many health, community and societal benefits (Dickerson et al., 2014, 2017a,b). But older drivers are at an increased risk for multiple-vehicle crashes and deleterious crash-related effects (Karthaus and Falkenstein, 2016). According to American Automobile Association (AAA), since older drivers are more fragile, their fatality rates are 17 times higher than those between the ages of 25–64 years old (American Automobility Association Senior Driving, 2014). As the number of adults over 65 years of age increases in North America, strategies and countermeasures emerge as critical factors in preventing crashes involving drivers. Mitigation strategies, i.e., older driver screening, assessment, and intervention (Classen et al., 2012, 2014); enhanced vehicles with improved safety features (Charlton et al., 2002; Koppel et al., 2013; Bengler et al., 2014; Centers for Disease Control Prevention, 2015); enhanced infrastructure, such as protected left hand turn lanes or extended receiving lanes (Shechtman et al., 2007; Classen et al., 2009); and stringent policies, such as visual testing after age 89 before license re-issuing or in-person (vs. mail) renewal (Levy, 1995; Morrisey and Grabowski, 2005; Classen and Awadzi, 2008; Staplin and Freund, 2013), afford older drivers the opportunity to stay on the road—longer and safer, while they receive the health-related benefits of being actively engaged in their communities and participating in societal events. One emerging alternative transportation strategy for older drivers who are reducing driving or can no longer drive, is the use of automated modes of transportation. Such modes may include automated ride sharing, ride hailing, or on-demand services (i.e., paratransit), that could support the mobility and independence of older adults while reducing their crash risk on the road (Robertson et al., 2019).
The deployment of automated vehicles (AVs) is viewed by many as an emerging option that holds potential health and safety benefits for older drivers. Older drivers may benefit from the use of four distinct AV scenarios: automated public transport with fixed routes and schedules; automated on-demand public transport (i.e., automated shuttle); fleet-based shared AVs; and privately owned AVs (Faber and van Lierop, 2020). Both urban and peripheral areas may benefit from the availability of AVs due to increasing needs of accessibility (Faber and van Lierop, 2020). Older adults have a strong interest in using AVs in their daily life to overcome current mobility and accessibility barriers via on-demand booking and using feeder AVs for access and egress to other modes of transport (Faber and van Lierop, 2020). However, for such benefits to materialize, elderly transportation users would need to accept, trust, and adopt AV technology. Recent studies (Abraham et al., 2016, 2017; Hulse et al., 2018; Rovira et al., 2019) assessed older adults' perceptions of AV technology but were limited to soliciting input via surveys. Direct interactive experience in AVs in combination with surveys are a valuable alternative as they may more accurately reveal the perceptions of older drivers before and after “driving” the automated simulator or riding in the automated shuttle (Penmetsa et al., 2019). Simulators are already, quite ubiquitously, used to assess driving performance, or to provide interventions, in a much safer (than on-road) yet realistic environment (Campos et al., 2017). Driving simulators are also frequently used to expose research participants to vehicle automation (Kauffmann et al., 2018). However, it is unclear whether an automated simulator will influence drivers' perceptions of AVs and thus needs to be explored as this technology may be used to train users on how to use this technology and to potentially promote technology acceptance. Vehicle capabilities may be better understood if users are exposed to this technology via a driving simulator or on-road use rather than conventional alternatives (i.e., demonstration videos or a user manual).
Highly automated vehicles are now becoming a reality and are expected to have enormous safety, societal, and environmental benefits. Particularly, vehicle automation has the potential to prevent older driver crashes occurring due to age-related declines in function resulting in human error, enhance lifelong mobility, while also reducing pollution and non-recurrent congestion impacts because of crash reduction (National Highway Traffic Safety Administration, 2013, 2017). However, highly automated vehicles can be less safe than human drivers under certain circumstances (i.e., inclement weather). The Society of Automotive Engineers (Society of Automotive Engineers International, 2016) defined six levels of AVs, ranging from no automation (Level 0) to full automation (Level 5). The focus of this paper will be on highly AVs at the SAE Level 4, because that is the classification of the EasyMile EZ10, automated shuttle used in this study. In this study, older drivers were exposed to the automated shuttle and to the driving simulator which is a representation of a privately-owned or shared-use AV.
Recent studies have suggested that AVs should be safer than human drivers if individuals are to adopt and accept this technology (Waycaster et al., 2018; Shladover and Nowakowski, 2019). However, in the context of highly automated vehicles, which is the focus of this study, full acceptance and trust may lead to complacency and misuse of the system. As such, trust must be calibrated with the capabilities of the system to prevent distrust, overtrust, or overreliance (Kraus et al., 2019). The public will be less likely to accept AVs if they have the same risk level as human driving (Waycaster et al., 2018). Specifically, Liu et al. (2019) found that AVs should be four to five times as safe (i.e., 75–80% reduction in traffic fatalities) as human drivers, if they are to be tolerated and widely accepted (Liu et al., 2019). Although safety is a critical predictor, several other factors influence user perceptions and behavioral intentions (i.e., trust, perceived usefulness, ease of use). Advantages and disadvantages are anticipated to arise from the emergence of AVs. Benefits include improved mobility for the elderly and disabled (Yang and Coughlin, 2014) and the liberating of parking spaces for other land uses (Fagnant and Kockelman, 2015). The potential disadvantages include concerns relating to privacy, security, insurance, and liability, as well as job losses (Taeihagh and Lim, 2019). The extent to which these positive and negative outcomes eventuate will be highly dependent on user acceptance and adoption of this emerging technology. Recent AV consumer preference studies, specifically among older adults, indicate that trust and hesitation are barriers in adopting full vehicle automation (Reimer, 2014; Hartford, 2015; American Automobile Association, 2016). Faber and van Lierop (2020) conducted focus groups in which older adults voiced concerns related to cost, trust, control, and safety of AVs. A weakness of these studies is that older drivers were not exposed to “driving” an AV either in real-world format or via simulator technology. As such, only the perceptions, and not direct interactive experiences of these participants are measured, meaning that they do not allow us to fully understand adoption and acceptance practices of older adults who were not exposed to the real life experience of driving or riding in an AV.
The scientific premise of this study is discussed in the next five points. (1) The number of older adults is nearing 20% of the population across the US. (2) Driving, a critical mode of transportation for older adults, yields many health, community and societal benefits but older drivers are at-risk for crashes and deleterious crash-related effects. (3) The deployment of automated shuttles and AVs are expected to have health and safety benefits for older drivers, positively impact the environment, and yield societal benefits (i.e., improved traffic flow). However, older drivers may not trust AVs and have additional concerns (i.e., perceived safety) about vehicle automation. (4) Interactive experiences in AV modes, in combination with surveys, may more accurately reveal the thoughts, beliefs, perceptions, or hesitations of older drivers before, during and after “driving” the automated simulator or the automated shuttle and (5) inform scientists and engineers of adjunctive strategies to enhance adoption practices among older drivers.
Thus, the purpose of this study is to quantify the perceptions of 69 older drivers, before and after “driving” in an interactive high-fidelity Realtime Technologies Inc. (RTI) driving simulator in Level 4 automated mode and riding in the Transdev operated EasyMile EZ10, Level 4 automated shuttle (Society of Automotive Engineers International, 2016). We expect that (1) drivers' perceptions (intention to use, trust, perceived usefulness, perceived ease of use, perceived safety, control and driving efficacy, cost, authority, and social influence), will improve after being exposed to “driving” the simulator and/or the automated shuttle and (2) the on-road experience in the shuttle may be a more positive experience compared to the driving simulator.
Information gained from such experiences will inform health care professionals, engineers, city managers, and transportation officials of opportunities and barriers to improve older drivers' interaction with AVs, facilitate their ease-of-use practices, and potentially empower them to adopt these technologies—and in so doing contribute to congestion mitigation and crash prevention—core components of a public health approach. Moreover, because Florida is a model state for older driver mobility issues (Classen and Awadzi, 2008), and Gainesville, Florida is an emerging “smart city” (Gonzalez, 2017), it is critical that scientists and engineers study and understand these adoption patterns of older drivers pertaining to automated technologies.
Materials and Methods
The University of Florida Institutional Review Board approved the study after a full board review. All participants provided informed consent for their enrollment into the study. This study used an experimental crossover-repeated measures design with a pre-visit survey, intake surveys, exposure to the automated mode driving simulator or the automated shuttle, post-visit survey 1, crossover to simulator or automated shuttle, and post-visit survey 2. Participants were recruited through the infrastructure and support of Oak Hammock and other residential communities, the older adult recruitment pool of UF's Institute for Mobility, Activity and Participation, and through UF's Institute on Aging. Participants received $25.00 for participation in the study.
Sixty-nine community dwelling drivers, 65 years of age or older, from North Central Florida, who had a valid driver's license and reported driving within the last 6 months were included in this study. Participants were excluded if they did not communicate in English or showed signs of cognitive impairment, i.e., scoring ≤ 26 on the Montreal Cognitive Assessment (MoCA) (Nasreddine et al., 2005). Participant intake and assessment were conducted in the living areas of the Smart House in the Oak Hammock Residential Community (5100 S.W. 25th Blvd., Gainesville, FL; see Figure 1), which provided a comfortable atmosphere for participants and research personnel. The simulated driving assessments occurred in the simulator laboratory, located in the garage of the Smart House. The on-road experience in the automated shuttle occurred at a formerly used bus depot in Gainesville, FL.
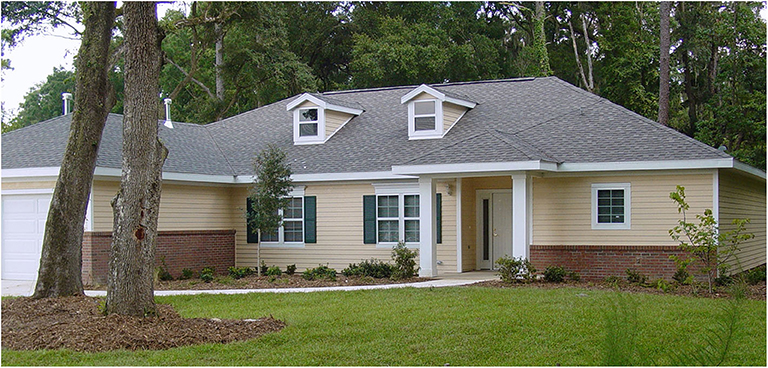
Figure 1. The Smart House houses the project's high-fidelity driving simulator and serves as a site for testing.
Equipment
Realtime Technologies Inc. Driving Simulator
The RTI driving simulator is integrated in a full car cab with seven high definition visual channels, including three forward channels creating a 180° field of view, three backward channels with behind-car views accomplished with one rear screen (seen through the rearview mirror), two built-in LCD side mirrors, and one virtual dash display (LCD panel) within the car. The RTI system has a high fidelity graphic resolution, component modeling, steering feedback, spatialized audio with realistic engine, transmission, wind and tire noises, and an autopilot feature to turn the simulator into automated driving mode (see Figure 1). The visual display operates at a 60 Hz refresh rate to support smooth graphics projected on three flat screens with high intensity projectors. The system allows for experimental drives with changing environmental conditions, video recording of the driver's simulator session, and incorporation of rural, urban, and highway driving. The simulator operating system drives are created with a combination of ambient and scripted traffic that interacts realistically with other vehicles based on human behavior/decision models and real-time physics-based vehicle dynamics calculations.
The scenario for this study utilized a 5-min acclimation drive, to enhance adaptation to the driving simulation environment. We utilized the simulator sickness questionnaire (Brooks et al., 2010) to determine pre- and post-drive experiences related to simulator sickness. The 10-min automated drive (SAE Level 4) occurred in a low to moderate speed (15–35 mph) residential and suburban area with realistic road infrastructure, buildings, and ambient traffic with the system handling all aspects of the designated driving task. A control area situated at the rear of the vehicle overlooks the driver, vehicle and screens (see Figure 2) allowing the operator to control and monitor all aspects of the experiment. During the simulated scenario, a researcher was seated in the front passenger seat to assess simulator sickness via the motion sickness assessment questionnaire (MSAQ) (Brooks et al., 2010).
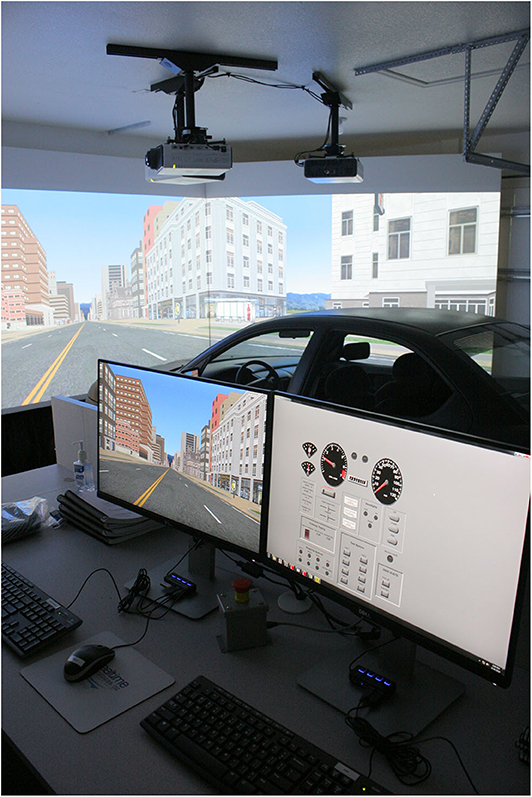
Figure 2. RTI High Fidelity Simulator with control station.
EasyMile EZ10 Automated Shuttle
This SAE Level 4 automated shuttle (see Figure 3) uses vision sensors, light detection, GPS tracking system, and ranging (LIDAR) to map its environment and to decide upon the best motion behavior at each instant. The EZ10 shuttle can drive automated on certain pre-mapped routes but is not yet able to drive on any road at any time. The shuttle does not have a steering wheel and can only be manually operated by a joystick remote control. The maximum speed of the vehicle is 25 miles per hour. The shuttle has six seats and six standing positions and can transport up to twelve passengers.
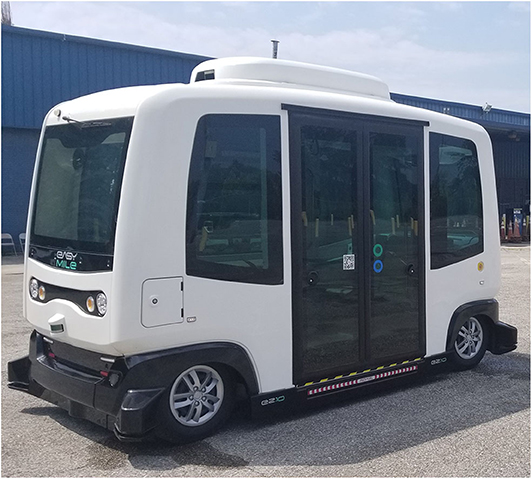
Figure 3. Transdev: EasyMile EZ10 autonomous shuttle (SAE Level 4).
The shuttle route (see Figure 4) lasted about 10 min and took place in a deserted bus depot. During testing, participants remained seated while the shuttle operated at a low speed (≈15 miles per hour) without the presence of ambient traffic or road users. During segments of the route, the safety operator explained vehicle capabilities and features to the participants. The number of participants in the shuttle, during testing, ranged from two to six participants.
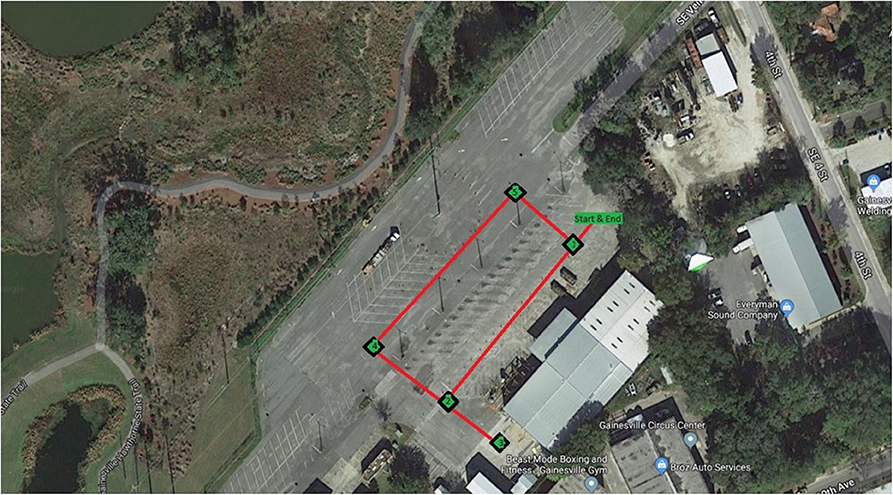
Figure 4. Ten-minute route of the EasyMile EZ10 autonomous shuttle.
Procedure
Each participant provided written informed consent, was screened for cognitive impairment using the MoCA, then completed pencil-and-paper surveys consisting of a demographic and medical history form, driving habits questionnaire (Owsley et al., 1999), technology acceptance model (Davis, 1989), technology readiness index 2.0 (Parasuraman and Colby, 2015), an autonomous vehicle user perception survey (AVUPS) (Mason et al., 2020). During participant intake, researchers explained that both the shuttle and simulator can drive automated pre-mapped routes but neither vehicle was able to drive on any road at any time. To minimize the effects of social interaction, participants were asked to remain silent while riding in the shuttle and in the driving simulator and to save their questions for after the experiment. Each participant (N = 69), was randomly assigned to complete the simulator (n = 31) or the automated shuttle (n = 38) drive, completed the AVUPS, cross-over to “drive” the modality not initially driven, and complete the AVUPS again. After riding in the shuttle or simulator, each participant completed the Motion Sickness Assessment Questionnaire (MSAQ).
Simulator Sickness Protocol
Participants driving the simulator may be prone to developing simulator sickness. We implemented a simulator sickness protocol to mitigate the occurrence of simulator sickness (Brooks et al., 2010; Classen et al., 2011). These measures include: offering dietary recommendations prior to the drive; utilizing an acclimation protocol; employing a simulator sickness questionnaire; reducing the sensory incongruence between the visual, kinesthetic, and vestibular systems by removing visual clutter in the peripheral field, including engine sounds, and vibrations for vestibular sensation; supplying environmental adaptations (5 min acclimation drive, 10 min simulator drive, cool comfortable conditions at 72 degrees Fahrenheit, air circulating via fan; avoidance of complex sensory scenes (e.g., introduced “calmer” traffic scenes, with some vehicles, a few pedestrians, a few parked vehicle alongside the road, only necessary infrastructure, e.g., road marking, speed signs, and traffic lights); and determining/managing the extent of simulator sickness symptoms (Stern et al., 2017). All these strategies areproven to be successful in our previous older adult studies (Shechtman et al., 2007; Classen et al., 2011).
Measures
Demographic and Medical History Form
The demographic and medical history form was modified from the National Institute on Aging Clinical Research Toolbox and used to collect age, gender, race, education, relationship status, and employment data (US Department of Health & Human Services, 2019).
Automated Vehicle User Perception Survey (Mason et al., 2020)
This AVUPS1 was used to measure older drivers' perceptions of AVs before and after each exposure (simulator and shuttle). The survey consisted of 4 open-ended items, and 28 visual analog scale items—ranging from disagree to agree. The scale was a 100 mm horizontal line and participants placed a vertical dash to signify their level of agreement/disagreement for each item. Responses were treated as a continuous variable that ranged from 0 (negative perception of AVS) to 100 (positive perception of AVs). The survey items represent 11 dimensions including, experience with technology (3 items; e.g., “I use technology in my vehicle to make tasks easier for me”), intention to use (3 items; e.g., “I am open to the idea of using an AV”), trust (4 items; e.g., “I am suspicious of an AV”), perceived usefulness (5 items; e.g., “I believe AVs will allow me to stay active”), perceived ease of use (2 items; e.g., “It will require a lot of effort to figure out how to use an AV”), perceived safety (3 items; e.g., “I feel safe riding in an AV”), control/driving efficacy (3 items; e.g., “My driving abilities will decline due to relying on an AV”), cost (2 items; e.g., “I will be willing to pay more for an AV compared to what I would pay for a traditional car”), authority (1 item; “I would use an AV if National Highway Traffic Safety Administration deems them as being safe”), media (1 item; “Media portrays AVs in a positive way”), and social influence (1 item; “My family and friends will encourage/support me when I use an AV”). Both media and experience with technology, have been shown to influence users' perceptions of AVs (Talebian and Mishra, 2018) and AVUPS items were designed to assess users' experience with technology (i.e., not just AV technology) and the media they consumed, during a longitudinal study.
Item responses were averaged into their respective dimensions which produced dimension scores ranging from 0 (negative perceptions of AVs) to 100 (positive perceptions of AVs). The dimensions' internal consistency ranged from acceptable (α = 0.75) to excellent (α = 0.91). During scale development, the AVUPS content validity index (CVI) had a rating of 1.00, with 32 of 32 items rated ≥0.86 and a scale CVI of 0.96 (mean CVI of all items), indicating acceptable content validity (i.e., subject-matter experts indicated that the items in the survey are representative of users' perceptions of AVs). The scale is currently undergoing further reliability testing and factor analysis.
Motion Sickness Assessment Questionnaire (Brooks et al., 2010)
The MSAQ questionnaire consisted of 4 items (sweaty, queasy, dizzy, nauseous) ranging from 0 (not at all) to 7 (severely). The survey was developed and validated for assessing simulator sickness symptoms.
For the purposes of this interim analysis, we only focus on the demographic information, descriptive statistics of simulator and motion sickness, and all 11 domains from the AVUPS measured with a visual analog scale.
Data Analysis
Descriptive statistics were conducted on participants' age, race, education, and employment status. A series of paired sample t-tests were performed on older drivers' simulator/motion sickness comparing baseline with post-simulator exposure as well as baseline with post-shuttle exposure. Continuous data are presented as mean and standard deviation (SD) whereas categorical data are presented as frequency (%). The 11 domains (previously described) of AVUPS were used as dependent variables and were assessed for normality to determine use of parametric vs. non-parametric analyses via visual examination (i.e., probability plots, histograms, stem, and leaf plots) and statistical tests (i.e., Fisher's skewness and kurtosis and Shapiro-Wilks tests). A one-way repeated measures ANOVA with three levels was conducted to assess differences between older drivers' perceptions at baseline, after exposure to the simulator, and after exposure to the automated shuttle. A one-way repeated measures ANOVA with three levels was performed to assess differences between older drivers' perceptions at baseline, after being exposed to one AV technology (i.e., post-exposure 1), and after being exposed to both AV technologies (i.e., post-exposure 2). Post-hoc tests (i.e., paired t-tests), were performed if repeated measures ANOVAs reached significance (p < 0.05). No adjustments were made for multiple comparisons (Rothman, 1990). Study data were collected and managed using Research Electronic Data Capture (REDCap) hosted at the UF (Harris et al., 2019). R Studios and R version 3.6.1 (R Core Team, 2019) were used for data collation and analyses. Significance level was set at α = 0.05 with an accompanying 95% confidence level.
Results
A total of 69 participants (mean age = 74.64, SD = 6.17), consisting of 29 males (mean age = 77.03, SD = 5.42) and 40 females (mean age = 72.90, SD = 6.16) completed our study. Twenty females and 18 males were first exposed to the shuttle (n = 38), whereas 20 females and 11 males were first exposed to the simulator (n = 31). The racial distribution indicated that participants were self-identifying as 60 (87%) White, 6 (9%) Black, and 3 (4%) Other. The study participants demonstrated a high level of education as 73% had either a doctorate (26%), master's (28%) or bachelor's degree (19%); whereas 26% had an associate, some college or a technical school certification, and 1% had either a GED or high school education. Participants reported their current employment status, 58 (84%) retired, 10 (14.5%) working part-time, and 1 (1%) working full-time. All participants were able to complete their ride in the shuttle and driving simulator.
The paired-sample t-tests for simulator sickness revealed differences for queasy, dizzy, and nauseous after experiencing the driving simulator compared to baseline. Older drivers' ratings of feeling queasy, dizzy, and nauseous increased after riding in the simulator compared to baseline. The paired-sample t-tests for motion sickness revealed differences for feeling sweaty after riding in the automated shuttle compared to baseline. Older drivers' ratings of feeling sweaty decreased after riding in the automated shuttle. Motion sickness and simulator sickness results are displayed in Table 1.
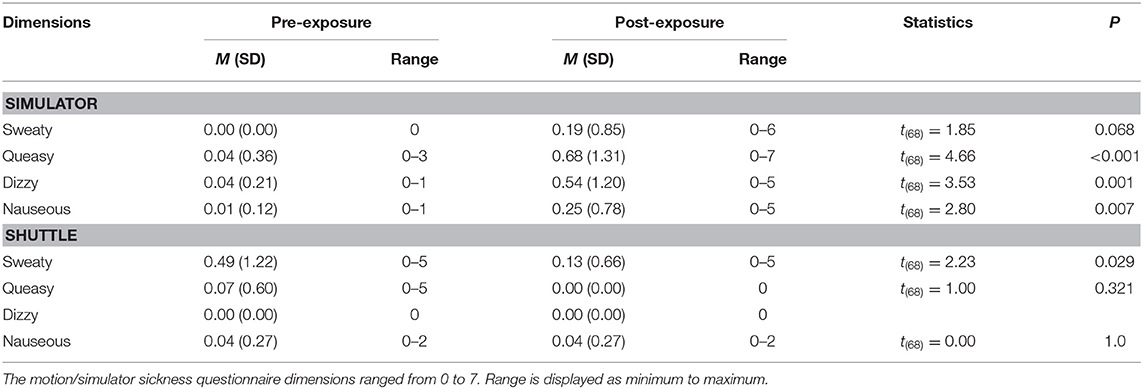
Table 1. Older drivers' simulator and motion sickness before and after being exposed to the automated shuttle and simulator.
Older Drivers' Perceptions Before, Post-shuttle, and Post-simulator
The repeated measures ANOVA revealed differences between exposure to AV technologies for drivers' intention to use, F(2,136) = 3.360, p = 0.038, ηp2 = 0.047, trust, F(2,136) = 13.565, p < 0.001, ηp2 = 0.166, perceived usefulness, F(2,136) = 5.018, p = 0.008, ηp2 = 0.069, perceived safety, F(2,136) = 11.140, p < 0.001, ηp2 = 0.141, and control and driving efficacy, F(2,136) = 3.724, p = 0.027, ηp2 = 0.052. However, older drivers' intention to use was not statistically significant after being exposed to the simulator (p = 0.076) and shuttle (p = 1.00) compared to baseline. Older drivers' trust was enhanced after being exposed to the simulator (p = 0.013) and shuttle (p < 0.001) compared to baseline. Older drivers' perceived usefulness (p = 0.005) was enhanced after the shuttle compared to baseline. Older drivers' perceived safety was enhanced after being exposed to the simulator (p = 0.006) and shuttle (p < 0.001) compared to baseline. Older drivers' control and driving efficacy were enhanced after riding in the shuttle compared to after the simulator (p = 0.043, Cohen's d = 0.30). The repeated measures ANOVA revealed no significant differences for older drivers' experience with technology, F(1.8, 123.5) = 0.166, p = 0.827, ηp2 = 0.002, perceived ease of use, F(2,136) = 0.172, p = 0.842, ηp2 = 0.003, cost, F(2,136) = 2.838, p = 0.062, ηp2 = 0.040, authority, F(2,136) = 1.598, p = 0.206, ηp2 = 0.023, media, F(2,136) = 1.773, p = 0.174, ηp2 = 0.025, or social influences, F(2,136) = 1.364, p = 0.259, ηp2 = 0.020. Table 2 indicates the descriptive statistics from the repeated measures ANOVA comparing older drivers' perceptions at baseline and after being exposed to the simulator and automated shuttle. The bar graphs (Figure 5) display descriptive trends for the AVUPS domains at baseline, after the shuttle, and after the simulator.
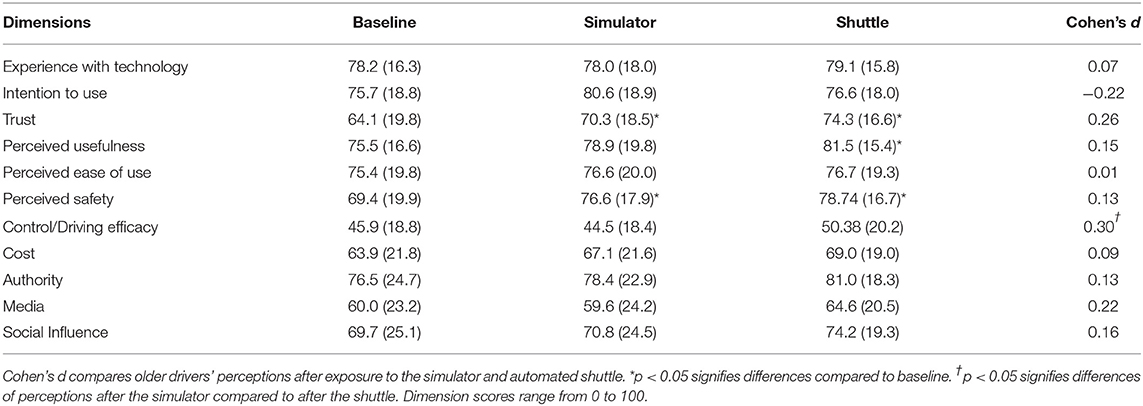
Table 2. Older drivers' perceptions at baseline, post-simulator, and post-shuttle.
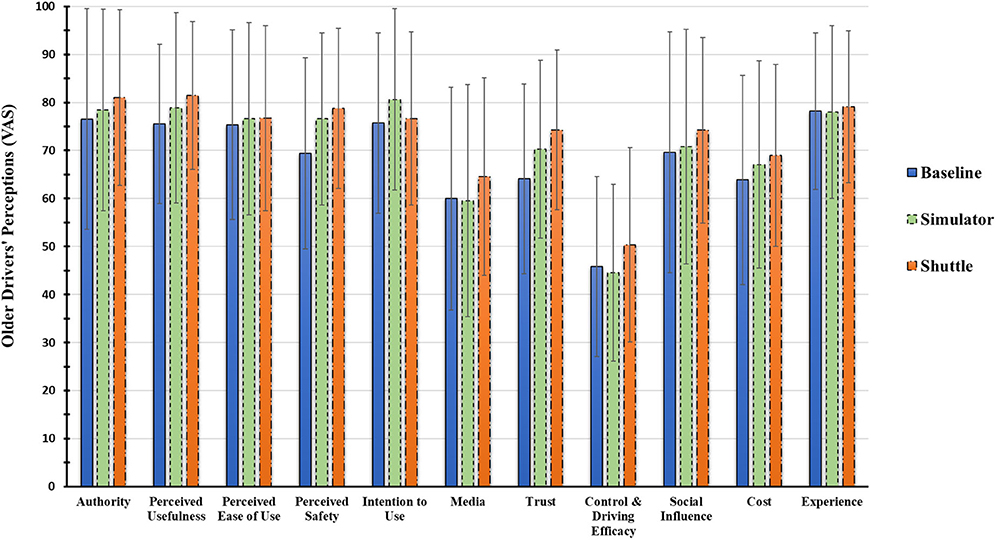
Figure 5. Bar graph for older drivers' perception of AVs, via a visual analog scale, at baseline, post-simulator, and post-shuttle.
Older Drivers' Perceptions Before, Post-exposure 1, and Post-exposure 2
The repeated measures ANOVA revealed differences between the number of exposures (i.e., baseline, post-exposure 1, post-exposure 2) to AV technologies for older drivers' trust, F(2,136) = 13.565, p < 0.001, ηp2 = 0.168, perceived usefulness, F(2,136) = 3.360, p = 0.038, ηp2 = 0.057, and perceived safety, F(2,136) = 13.565, p < 0.001, η2 = 0.148. Older drivers' trust was enhanced at post-exposure 1 (p = 0.010) and post-exposure 2 (p < 0.001) compared to baseline. Older drivers' perceived usefulness (p = 0.028) and cost (p = 0.029) increased after being exposed to both forms of AV technology. The repeated measures ANOVA revealed no significant differences for older drivers' experience with technology, F(1.8, 124.2) = 0.074, p = 0.915, ηp2 = 0.001, intention to use, F(2,136) = 2.761, p = 0.067, ηp2 = 0.039, perceived ease of use, F(2,136) = 0.185, p = 0.832, ηp2 = 0.003, control and driving efficacy, F(2,136) = 0.332, p = 0.718, ηp2 = 0.005, cost, F(2,136) = 2.784, p = 0.065, ηp2 = 0.039, authority, F(2,136) = 1.200, p = 0.304, ηp2 = 0.017, media, F(2,136) = 0.837, p = 0.435, ηp2 = 0.012, or social influences, F(2,136) = 1.747, p = 0.178, ηp2 = 0.025. Older drivers' perceived safety increased at post-exposure 1 (p = 0.013) and post-exposure 2 (p < 0.001) compared to baseline. Table 3 indicates the descriptive statistics from the repeated measures ANOVA comparing older drivers' perceptions at baseline, post-exposure 1, and post-exposure 2.
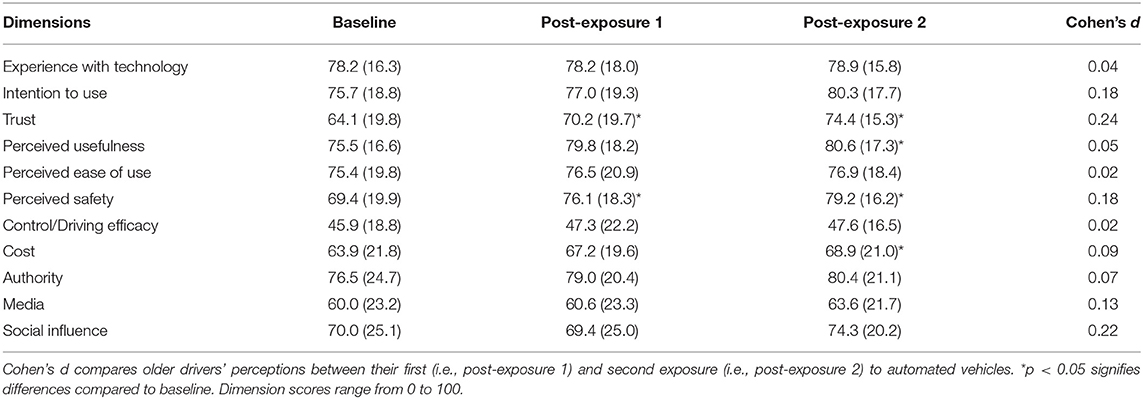
Table 3. Older drivers' perceptions at baseline, post-exposure 1, and post-exposure 2.
Discussion
This interim analysis was conducted to quantify the perceptions of 69 older drivers, who have been exposed to “driving” the interactive high-fidelity RTI driving simulator and riding in the Transdev manufactured EasyMile EZ10 automated shuttle.
We had two expectations: Expectation 1: Older drivers' perceptions in 9 of the 11 domains (all except for media and experience with technology) will change after being exposed to riding in the simulator and/or the automated shuttle. This was indeed the case for 3 of the 9 domains indicating older drivers' perceptions of AVs. Specifically, older drivers' trust and perceived safety increased after being exposed to either the simulator or shuttle whereas older drivers' perceived usefulness increased after begin exposed to the automated shuttle. Older drivers' trust and perceived safety increased after their first exposure to AVs (regardless of whether it was the simulator or shuttle) whereas trust, perceived safety, perceived usefulness, and cost increased after being exposed to both modes of AV technology. Expectation 2: The on-road experience in the automated shuttle may increase drivers' perceptions of AV technology compared to the driving simulator. Interestingly, when comparing perceptions after the simulator vs. after the shuttle, only control and driving efficacy, reached statistical significance. It is possible that older drivers' on-road experience was more realistic compared to the driving simulation, thus increasing their perceived control of AVs after riding in the automated shuttle. The on-board engineer, remote control to take over control of the automated shuttle, and accessible control panel may have influenced their sense of control.
Older drivers did not experience motion sickness in the automated shuttle, which may have influenced their perceptions compared to their experience in the driving simulator, resulting in increased simulator sickness severity. All participants completed the driving simulation, which suggests that feelings of simulator sickness were manageable. The lack of motion sickness experienced by older adults in the automated shuttle is promising for AV acceptance and adoption. Although, further investigation is required to discern differences between simulator sickness and motion sickness. Specifically, researchers should strive to develop congruent routes, settings, and vehicle speeds when comparing sickness that occurs due to vehicle automation or driving simulation. Another interesting finding is that the older drivers' perceptions of perceived usefulness and cost, were enhanced after riding in both modes of vehicle automation compared to baseline whereas these perceptions did not change after their first AV exposure. One potential reason may be that the participants experience in the simulator and shuttle provided them with more thorough understanding of vehicle automation. Older drivers may need to be exposed to different modes of vehicle automation or be exposed to AVs on multiple occasions. However, these interpretations needs to occur with caution as Type 1 (i.e., due to multiple comparisons) and/or Type II error (i.e., inadequate power to detect a true difference) may be evident in this interim analysis that only accounts for the perceptions of 69 older drivers.
Descriptively, all 11 domains increased after being exposed to the automated shuttle compared to baseline (see Figure 5). Furthermore, participants reported more positive perceptions for 10 domains (all except for intention to use), after being exposed to the automated shuttle compared to the driving simulator. Older drivers' perceptions descriptively increased after their first exposure (i.e., regardless of it was the simulator or shuttle) to AV technology and continued to increase after being exposed to both modes of AV technology. Older drivers in the current study were exposed to the simulator and shuttle, which operated in very predictable conditions with a closed route, during clear environmental conditions, with clear road markings, and few interferences. Results from the current study align with similar studies where older drivers were exposed to a SAE Level 4 automated shuttle (Eden et al., 2017; Nordhoff et al., 2019) and a Level 4 driving simulator (Li et al., 2019) during ideal circumstances. However, as seen in findings from Walker et al. (2018), drivers that have negative interactions with AVs have decreased perceptions (i.e., trust) of AVs. Thus, drivers should be exposed to scenarios and routes that realistically portray automated system capabilities and limitations. Furthermore, the negative interactions with on-road vehicle automation may decrease perceptions of AVs at a greater magnitude than being exposed to driving simulation.
The results of this study align with findings from Penmetsa et al. (2019), indicating that as the public increasingly interacts with AVs, their attitudes toward the technology are more likely to be positive. Similar to Penmetsa et al. (2019), we recommend that policy makers provide opportunity for the public to interact with AVs. The interactive experience with AVs, ideally on public roads may increase the acceptance and adoption of AV technology. Numerous limitations in this study occurred due to the restrictions imposed by the federal government, which delayed our study timeline and required amendments to our research design and protocol. For example, the National Highway Traffic Safety Administration (NHTSA) issued a waiver approving pilot testing of participants, but the shuttle could not operate on public roads. As such, we modified our original plan—and operated the shuttle, not on a congruent road course to that in the simulator—but in a deserted bus depot, where there was no traffic, road users or road signs. The differences (i.e., shuttle speed, road-type, and traffic) between the shuttle route and simulator scenario must be noted as a limitation to this study. The physics experienced during driving simulation affects cognitive awareness that there would be no real consequences in the case of an adverse event, such as a crash. Moreover, the automated shuttle traveled at a restricted speed of 15 miles per hour, whereas the driving simulator scenario had speeds ranging from 15 to 35 miles per hour. Of course, this arrangement may have impacted the perceptions of the older drivers—and we may see a resulting effect following this arrangement. That means that the study may be prone to bias and an underestimation or overestimation of the actual effects of the exposure, especially pertaining to the experiences in the automated shuttle. Furthermore, the NHTSA waiver that was issued, expired after 6 months, and the study team is still awaiting permission to continue with the participant testing—hence the interim analysis. Lastly, in February 2020, NHTSA ordered a nationwide suspension affecting all 16 operating EZ10 automated shuttles. An EZ10 automated shuttle operating in Columbus, Ohio traveling 7 miles per hour made an emergency stop which caused a passenger to fall from their seat in a “minor incident” (EasyMile, 2020). Finally, participants in our study were mainly white and highly educated, which may have caused sampling bias—as the views of minorities and less educated groups were not adequately represented.
This study is one of the first that actually presents data on user perceptions after participants have been exposed to two forms of vehicle automation (i.e., simulator and automated shuttle). The findings of this interim analysis suggest that the simulator, when programmed to run in the SAE Level 4 mode of autonomy, can be used to gauge user experiences of being exposed to autonomous technology. However, the participants' experiences showed a greater increase in perception pertaining to especially trust and perceived safety, when exposed to the automated shuttle. This suggest that the automated shuttle may be a superior mode of automation to influence user acceptance. However, the simulator may also influence users' perceptions and be a viable training device to provide specific scenarios that highlight capabilities and limitations of vehicle automation. For example, in cities where automated shuttles are not a reality yet, the autonomous simulator may be used as a reasonable substitute to gauge user experience and potential adoption of the AV technology.
Next steps for this project are to increase and balance (i.e., match for gender and age) the study sample size, by collecting and analyzing the perceptions of the total sample (N = 106). A robust analysis of the complete data set will include linear modeling as well as repeated measure ANOVAs to explore gender, age, and group by time (i.e., order) interactions. Additionally, we will analyze drivers' qualitative feedback, given in the four open ended questions of the AVUPS, to better understand their interactive experience pertaining to the acceptance and adoption of AVs. Information from this completed study will be used to develop strategies to further improve upon older driver adoption practices of AV, suggest practical hints to engineers for design elements, and provide information to shape city and state policies for regulatory purposes of AV deployment, adoption and use.
Data Availability Statement
The raw data supporting the conclusions of this article will be made available by the authors, without undue reservation.
Ethics Statement
The studies involving human participants were reviewed and approved by University of Florida Institutional Review Board. The patients/participants provided their written informed consent to participate in this study.
Author Contributions
SC and VS: study conception and design. SC, JR, JW, and JM: develop driving simulation. JW and JM: data collection. JM and SC: analysis and interpretation of results. SC, JM, JW, and VS: draft manuscript preparation. All authors reviewed the results and approved the final version of the manuscript.
Funding
This research project (#69A3551747104) was funded through the US Department of Transportation and the Southeastern Transportation Research, Innovation, Development, and Education Center.
Conflict of Interest
The authors declare that the research was conducted in the absence of any commercial or financial relationships that could be construed as a potential conflict of interest.
Acknowledgments
The Institute for Mobility, Activity, and Participation provided infrastructure and support for this study.
Footnote
1. ^The Automated Vehicle User Perception Survey can be obtained from the corresponding author: justinmason@phhp.ufl.edu.
References
Abraham, H., Lee, C., Brady, S., Fitzgerald, C., Mehler, B., Reimer, B., et al. (2016). “Autonomous vehicles, trust, and driving alternatives: a survey of consumer preferences,” in Transportation Research Board 96th Annual Meeting (Washington, DC).
Abraham, H., Lee, C., Craig, F., Mehler, B., Brady, S., and Reimer, B. (2017). “Autonomous vehicles and alternatives to driving: trust, preferences, and effects of age,” in Proceedings of theTransportation Research Board 96th Annual Meeting, 1–16. Available online at: http://agelab.mit.edu/system/files/2017_TRB_Abraham.pdf#overlay-context=2017-publications%0Ahttp://agelab.mit.edu/system/files/2017_TRB_Abraham.pdf
American Automobile Association (2016). Fact Sheet: Vehicle Technology Survey. Available online at: newsroom.aaa.com
American Automobility Association Senior Driving (2014). Facts & Research. Available online at: http://seniordriving.aaa.com/resources-family-friends/conversations-about-driving/facts-research
Bengler, K., Dietmayer, K., Farber, B., Maurer, M., Stiller, C., and Winner, H. (2014). Three decades of driver assistance systems: review and future perspectives. IEEE Intell. Transp. Syst. Mag. 6, 6–22. doi: 10.1109/MITS.2014.2336271
Brooks, J. O., Goodenough, R. R., Crisler, M. C., Klein, N. D., Alley, R. L., Koon, B. L., et al. (2010). Simulator sickness during driving simulation studies. Accid. Anal. Prev. 42, 788–796. doi: 10.1016/j.aap.2009.04.013
Campos, J. L., Bédard, M., Classen, S., Delparte, J. J., Hebert, D. A., Hyde, N., et al. (2017). Guiding framework for driver assessment using driving simulators. Front. Psychol. 8:1428. doi: 10.3389/fpsyg.2017.01428
Centers for Disease Control Prevention (2015). Injury Prevention & Control: Motor Vehicle Safety. Available online at: http://www.cdc.gov/MotorVehicleSafety/Teen_Drivers/teendrivers_factsheet.html#sthash.ql10vxnE.dpuf
Charlton, J. L., Fildes, B., and Andrea, D. (2002). Vehicle safety and older occupants. Gerontechnology 1, 274–286. doi: 10.4017/gt.2002.01.04.006.00
Classen, S., and Awadzi, K. D. (2008). “Model state programs on licensing older drivers,” in Proceedings of the North American License Policies Workshop (NALPW), eds. D. W. Eby, and L. J. Molnar (Washington, DC: AAA Foundation for Traffic Safety).
Classen, S., Bewernitz, M., and Shechtman, O. (2011). Driving simulator sickness: an evidence-based review of the literature. Am. J. Occup. Ther. 65, 179–188. doi: 10.5014/ajot.2011.000802
Classen, S., Dickerson, A. E., and Justiss, M. D. (2012). “Occupational therapy driving evaluation: using evidence-based screening and assessment tools,” in Driving and Community Mobility: Occupational Therapy Across the Lifespan, eds M. J. McGuire, and E. Schold-Davis (Bethesda, MD: AOTA Press), 221–277.
Classen, S., Monahan, M., Auten, B., and Yarney, A. K. (2014). Evidence-based review of rehabilitation interventions for medically at-risk older drivers. Am. J. Occup. Ther. 68, 107–114. doi: 10.5014/ajot.2014.010975
Classen, S., Shechtman, O., Stephens, B., Davis, E., Lanford, D. N., and Mann, W. (2009). The impact of roadway intersection design of young and senior adults' driving performance in the recovery phase. Br. J. Occup. Ther. 27, 472–481. doi: 10.4276/030802209X12577616538591
Davis, F. D. (1989). Perceived usefulness, perceived ease of use, and user acceptance of information technology. MIS Quart. 13, 319–340. doi: 10.2307/249008
Dickerson, A. E., Meuel, D. B., Ridenour, C. D., and Cooper, K. (2014). Assessment tools predicting fitness to drive in older adults: a systematic review. Am. J. Occup. Ther. 68, 670–680. doi: 10.5014/ajot.2014.011833
Dickerson, A. E., Molnar, L., Bedard, M., Eby, D. W., Classen, S., and Polgar, J. (2017b). Transportation and aging: an updated research agenda for advancing safe mobility. J. Appl. Gerontol. 38, 1643–1660. doi: 10.1177/0733464817739154
Dickerson, A. E., Molnar, L. J., Bedard, M., Eby, D. W., Berg-Weger, M., Choi, M., et al. (2017a). Transportation and aging: An updated research agenda for advancing safe mobility among older adults transitioning from driving to non-driving. Gerontologist 59, 215–221. doi: 10.1093/geront/gnx120
EasyMile (2020). Low Speed Emergency Stop for Safety Triggers Partial US Suspension. Available online at: https://easymile.com/low-speed-stop-triggers-temporary-suspension/
Eden, G., Nanchen, B., Ramseyer, R., and Evéquoz, F. (2017). “On the Road with an autonomous passenger shuttle,” in Proceedings of the 2017 CHI Conference Extended Abstracts on Human Factors in Computing Systems (Denver, CO), 1569–1576.
Faber, K., and van Lierop, D. (2020). How will older adults use automated vehicles? Assessing the role of AVs in overcoming perceived mobility barriers. Transport. Res. A Pol. 133, 353–363. doi: 10.1016/j.tra.2020.01.022
Fagnant, D. J., and Kockelman, K. (2015). Preparing a nation for autonomous vehicles: 2 opportunities, barriers and policy recommendations for capitalizing on self-driven vehicles. Transport. Res. A Pol. 77, 167–181. doi: 10.1016/j.tra.2015.04.003
Federal Highway Administration (2018). US Department of Transportation. Highway Statistics (2017). Washington, DC: FHWA. Available online at: https://www.fhwa.dot.gov/policyinformation/statistics/2017/
Gonzalez, E. (2017). Driverless Shuttle Coming to Gainesville as Part of the Smart City Initiative. Gainesville, FL: WUFT 5.
Harris, P. A., Taylor, R., Minor, B. L., Elliott, V., Fernandez, M., O'Neal, L., et al. (2019). The REDCap consortium: building an international community of software platform partners. J. Biomed. Inf. 95:103208. doi: 10.1016/j.jbi.2019.103208
Hartford, T. (2015). Vehicle Technology Adoption. Available online at: https://www.thehartford.com/resources/mature-marketexcellence/vehicle-technology-adoption
Hulse, L. M., Xie, H., and Galea, E. R. (2018). Perceptions of autonomous vehicles: Relationships with road users, risk, gender and age. Saf. Sci. 102, 1–13. doi: 10.1016/j.ssci.2017.10.001
Karthaus, M., and Falkenstein, M. (2016). Functional changes and driving performance in older drivers: assessment and interventions. Geriatrics 1:12. doi: 10.3390/geriatrics1020012
Kauffmann, N., Winkler, F., and Vollrath, M. (2018). “What makes an automated vehicle a good driver?” in Proceedings of the 2018 CHI Conference on Human Factors in Computing Systems–CHI '18 (Montreal, QC), 1–9.
Koppel, S., Clark, B., Hoareau, E., Charlton, J. L., and Newstead, S. V. (2013). How important is vehicle safety for older consumers in the vehicle purchase process? Traffic Inj. Prev. 14, 592–601. doi: 10.1080/15389588.2012.740642
Kraus, J., Scholz, D., Stiegemeier, D., and Baumann, M. (2019). The more you know: trust dynamics and calibration in highly automated driving and the effects of take-overs, system malfunction, and system transparency. Hum. Factors. doi: 10.1177/0018720819853686. [Epub ahead of print].
Levy, D. T. (1995). The relationship of age and state license renewal policies to driving licensure rates. Accident Analy. Prevent. 27, 461–467. doi: 10.1016/0001-4575(94)00081-V
Li, S., Blythe, P., Guo, W., and Namdeo, A. (2019). Investigation of older drivers' requirements of the human-machine interaction in highly automated vehicles. Transp. Res. F Traffic. Psychol. Behav. 62, 546–563. doi: 10.1016/j.trf.2019.02.009
Liu, P., Yang, R., and Xu, Z. (2019). How safe is safe enough for self-driving vehicles? Risk Analy. 39, 315–325. doi: 10.1111/risa.13116
Mason, J., Classen, S., Wersal, J., and Sisiopiku, V. (2020). Establishing Face and Content Validity of a Survey to Assess Users' Perceptions of Automated Vehicles. Washington, DC: Transportation Research Records.
Morrisey, M. A., and Grabowski, D. C. (2005). State motor vehicle laws and older drivers. Health Econ. 14, 407–419. doi: 10.1002/hec.955
Nasreddine, Z. S., Phillips, N. A., Bédirian, V., Charbonneau, S., Whitehead, V., Collin, I., et al. (2005). The montreal cognitive assessment, MoCA: a brief screening tool for mild cognitive impairment. J. Am. Geriatr. Soc. 53, 695–699. doi: 10.1111/j.1532-5415.2005.53221.x
National Highway Traffic Safety Administration (2013). Preliminary Statement of Policy Concerning Automated Vehicles. Washington, DC: National Highway Traffic Safety Administration.
National Highway Traffic Safety Administration (2017). Automated Driving Systems 2.0: A Vision for Safety. US Department of Transportation. Available online at: https://www.nhtsa.gov/sites/nhtsa.dot.gov/files/documents/13069a-ads2.0_090617_v9a_tag.pdf
Nordhoff, S., de Winter, J., Payre, W., van Arem, B., and Happee, R. (2019). What impressions do users have after a ride in an automated shuttle? an interview study. Transport. Res. Part F Traffic Psychol. Behav. 63, 252–269. doi: 10.1016/j.trf.2019.04.009
Owsley, C., Stalvey, B., Wells, J., and Sloane, M. E. (1999). Older drivers and cataract: driving habits and crash risk. J. Gerontol. Med. Sci. 54A, M203–M211. doi: 10.1093/gerona/54.4.M203
Parasuraman, A., and Colby, C. (2015). An updated and streamlined technology readiness index: TRI 2.0. J. Serv. Res. 18, 59–74. doi: 10.1177/1094670514539730
Penmetsa, P., Adanu, E. K., Wood, D., Wang, T., and Jones, S. L. (2019). Perceptions and expectations of autonomous vehicles – a snapshot of vulnerable road user opinion. Techn. Forecast. Soc. Change 143, 9–13. doi: 10.1016/j.techfore.2019.02.010
R Core Team (2019). R: A Language and Environment for Statistical Computing Version 3.6.1. Vienna: R Foundation for Statistical Computing. Available online at: http://www.R-project.org/
Reimer, B. (2014). Driver assistance systems and the transition to automated vehicles: a path to increase older adult safety and mobility? Public Policy Aging Rep. 24, 27–31. doi: 10.1093/ppar/prt006
Robertson, R. D., Woods-Fry, H., Vanlaar, W. G. M., and Hing, M. M. (2019). Automated vehicles and older drivers in Canada. J. Saf. Res. 70, 193–199. doi: 10.1016/j.jsr.2019.07.003
Rothman, K. J. (1990). No adjustments are needed for multiple comparisons. Epidemiology 1, 43–46. doi: 10.1097/00001648-199001000-00010
Rovira, E., McLaughlin, A. C., Pak, R., and High, L. (2019). Looking for age differences in self-driving vehicles: examining the effects of automation reliability, driving risk, and physical impairment on trust. Front. Psychol. 10:800. doi: 10.3389/fpsyg.2019.00800
Shechtman, O., Classen, S., Stephens, B., Bendixen, R., Belchior, P., Sandhu, M., et al. (2007). The impact of intersection design on simulated driving performance of young and senior adults. Traffic Inj. Prev. 8, 78–86. doi: 10.1080/15389580600994321
Shladover, S. E., and Nowakowski, C. (2019). Regulatory challenges for road vehicle automation: lessons from the california experience. Transport. Res. A Pol. 122, 125–133. doi: 10.1016/j.tra.2017.10.006
Society of Automotive Engineers International (2016). Taxonomy and Definitions for Terms Related to Driving Automation Systems for On-road Motor Vehicles (J3016_201609). Warrendale, PA: Society of Automotive Engineers International.
Staplin, L., and Freund, K. (2013). Policy prescriptions to preserve mobility for seniors—a dose of realism. Accid. Anal. Prev. 61, 212–221. doi: 10.1016/j.aap.2013.01.014
Stern, E. B., Akinwuntan, A., and Hirsch, P. (2017). “Simulator sickness: strategies for mitiation and prevention,” in Driving Simulation for Assessment, Intervention, and Training: A Guide for Occupational Therapy and Health Care Professionals, ed S. Classen (Bethesda, MD: AOTA Press), 107–120.
Taeihagh, A., and Lim, H. S. M. (2019). Governing autonomous vehicles: emerging responses for safety, liability, privacy, cybersecurity, and industry risks. Transport Rev. 39, 103–128. doi: 10.1080/01441647.2018.1494640
Talebian, A., and Mishra, S. (2018). Predicting the adoption of connected autonomous vehicles: A new approach based on the theory of diffusion of innovations. Transp. Res. C Emerg. Technol. 95, 363–380. doi: 10.1016/j.trc.2018.06.005
US Census Bureau (2020). Quick Facts: Florida. Available online at: https://www.census.gov/quickfacts/F.L
US Department of Health & Human Services (2019). Clinical Research Study Investigator's Toolbox. Available online at: https://www.nia.nih.gov/research/clinical-research-study-investigators-toolbox#forms
Walker, F., Boelhouwer, A., Alkim, T., Verwey, W. B., and Martens, M. H. (2018). Changes in trust after driving level 2 automated cars. J. Adv. Transport. 2018, 1–9. doi: 10.1155/2018/1045186
Waycaster, G. C., Matsumura, T., Bilotkach, V., Haftka, R. T., and Kim, N. H. (2018). Review of regulatory emphasis on transportation safety in the United States, 2002–2009: public versus private modes. Risk Analy. 38, 1085–1101. doi: 10.1111/risa.12693
Keywords: automated shuttle, automated vehicles, driving simulation, survey, randomized experimental design, older drivers
Citation: Classen S, Mason J, Wersal J, Sisiopiku V and Rogers J (2020) Older Drivers' Experience With Automated Vehicle Technology: Interim Analysis of a Demonstration Study. Front. Sustain. Cities 2:27. doi: 10.3389/frsc.2020.00027
Received: 18 March 2020; Accepted: 14 May 2020;
Published: 12 June 2020.
Edited by:
Krzysztof Goniewicz, Military University of Aviation, PolandReviewed by:
Jennifer Campos, University Health Network, CanadaEmily Schryer, University of Waterloo, Canada
Dea Van Lierop, Utrecht University, Netherlands
Copyright © 2020 Classen, Mason, Wersal, Sisiopiku and Rogers. This is an open-access article distributed under the terms of the Creative Commons Attribution License (CC BY). The use, distribution or reproduction in other forums is permitted, provided the original author(s) and the copyright owner(s) are credited and that the original publication in this journal is cited, in accordance with accepted academic practice. No use, distribution or reproduction is permitted which does not comply with these terms.
*Correspondence: Justin Mason, justinmason@phhp.ufl.edu