A Labeled Image Dataset for Deep Learning-Driven Rockfall Detection on the Moon and Mars
 V. T. Bickel
 L. Mandrake1
 - 1Jet Propulsion Laboratory, California Institute of Technology, Machine Learning and Instrument Autonomy Group, Pasadena, CA, United States
- 2Department Planets and Comets, Max Planck Institute for Solar System Research, Goettingen, Germany
- 3Department of Earth Sciences, ETH Zurich, Zurich, Switzerland
1 Background
The term rockfall describes the rapid displacement of a large, usually meter–sized block of rock down–slope, triggered by, for example, endogenic or exogenic events like impacts, quakes or rainfall (Hungr et al., 2014; Xiao et al., 2013). In a remote sensing context, the term rockfall is also being used to describe the characteristic geomorphic deposit of a rockfall event that can be identified from an air- or space–borne perspective, i.e., the combination of a displaced boulder and the track it carved into the slope substrate while bouncing, rolling, and sliding over the surface (also called “boulder with track” or “rolling boulder”) (Hovland and Mitchell, 1973; Filice, 1967; Moore, 1970) (see Figure 1). In planetary science, the spatial distribution and frequency of rockfalls provide insights into the global erosional state and activity of a planetary body (Bickel et al., 2020a; Tesson et al., 2020) while their tracks act as tools that allow for the remote estimation of the surface strength properties of yet unexplored regions in preparation of future ground exploration missions (Eggleston et al., 1968), such as the lunar pyroclastic (Bickel et al., 2019), polar sunlit (Bickel and Kring, 2020) and permanently shadowed regions of the Moon (Sargeant et al., 2020). Due to their small physical size (meters), the identification and mapping of rockfalls in planetary satellite imagery is challenging and very time–consuming, however. For this reason, Bickel et al. (2018) and Bickel et al. (2020b) trained convolutional neural networks to automate rockfall mapping in lunar and martian satellite imagery. Parts of the unpublished datasets used for earlier work have now been complemented with newly labeled data to create a well-balanced dataset of 2,822 lunar and martian rockfall labels (which we call “RMaM–2020”—Rockfall Mars Moon 2020, 416 MB in total, available here: https://edmond.mpdl.mpg.de/imeji/collection/DowTY91csU3jv9S2) that can be used for deep learning and other data science applications. Here, balanced means that the labels have been derived from imagery with a wide and continuous range of properties like spatial resolution, solar illumination, and others. So far, this dataset has been used to analyze the benefits of multi–domain learning on rockfall detector performance (Mars & Moon vs. Moon–only or Mars–only), but there are numerous other (non–planetary science) applications such as for featurization, feature or target recognition (aircraft/spacecraft autonomy), and data augmentation experiments.
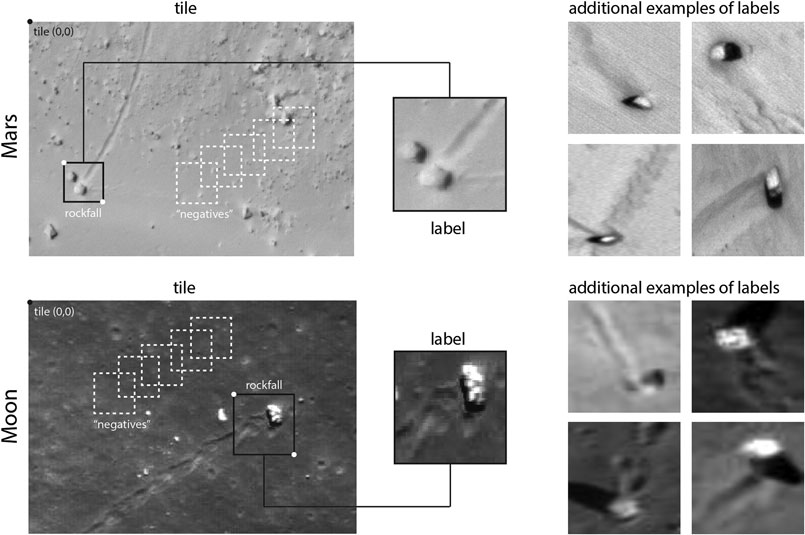
FIGURE 1. Examples of martian HiRISE (top) and lunar NAC (bottom) rockfall labels (bright boulder and elongated track); each example has been cropped from its respective positive tile using its label bounding box coordinates, as indicated in the figure. Tile (0–0) is at the top left (pythonian style). Unlabelled parts of each tile can act as negatives, as indicated in the shown tiles.
2 Methodology
All labels represent the localization of a rockfall instance in a satellite image, i.e., mark the position of the characteristic combination of boulder and track in an image (see e.g., Bickel et al., 2018).
2.1 Data Source
All labels have been either derived with subnadir, calibrated, non map–projected High Resolution Imaging Science Experiment red–channel.jp2 (HiRISE on board the Mars Reconnaissance Orbiter, MRO, McEwen et al., (2007)) or subnadir, calibrated, non map–projected pyramid–tiff.tif (PTIF) Narrow Angle Camera (NAC on board the Lunar Reconnaissance Orbiter, LRO, Robinson et al., (2010)) imagery. HiRISE provides images with spatial resolutions between
2.2 Data Preprocessing and Labeling
The HiRISE images have subsequently been reduced to 8 bit (PTIF NAC images are distributed as 8 bit images already). Using QGIS (https://www.qgis.org/en/site/) a series of approximately 300 × 300 to 1000 × 1000 pixel–sized image tiles have been cropped from the full 109 lunar and 44 martian parent images; these tiles either contain rockfalls (positive tiles) or do not (negative tiles). For Mars, there are 484 positive tiles and 330 negative tiles, for the Moon there are 377 positive tiles and 317 negative tiles for training and testing. All positive tiles have then been processed in Matlab R2017a, where one experienced (with domain knowledge) human operator manually labeled all rockfalls with rectangular bounding boxes (bboxes)—a particularly time–expensive and tedious process. Some examples of these user–derived labels are showcased in Figure 1. A label always contains a boulder and its associated track to guarantee instance uniqueness, i.e., to avoid confusion with static boulders or track sections without boulders (see Figure 1).
The authors would like to note that, due to the complexity as well as the limited quality and spatial resolution of the available imagery, very small rockfalls could potentially be overlooked or confused with other geomorphic features such as static boulders with a sand tail that got deposited by aeolian processes (on Mars), especially in complex geomorphic contexts like talus cones. While this dataset represents a best effort approach, the potential occurrence of false positives (labels which describe non–rockfall features), false negatives (rockfall features in image tiles which have not been labeled) and duplicates in the dataset cannot be excluded completely. Particular care has been taken to remove all FPs and FNs from the designated testing label sets, to maximize the accuracy of model validation.
3 Dataset
This dataset has been tailor–made for a Python, Keras, and TensorFlow implementation of RetinaNet (Keras RetinaNet by Fizyr: https://github.com/fizyr/keras-retinanet, based on Lin et al. (2018)) and consists of positive and negative image tiles (.jp2 and .tif) as well as labels and classes (.csv). There are a total of 1,000 positive rockfall training labels per planetary domain and an additional 300 negative training tiles without any rockfalls that can be used to further stimulate detector training. The martian testing set contains 91 positive labels and 31 negative tiles, while the lunar testing set contains 83 positive labels and 17 negative tiles, respectively. In total, there are 2,174 positive labels and 648 negative tiles for training and testing. All training and testing labels and tiles can be mixed without any limitations, if required. Each label .csv file consists of 6 column entries (each row represents one label), 1) the path to the image the label belongs to, 2–5) the upper left column and row, and the lower right column and row image coordinates of the label bounding box (the pythonian image 0–0 is the top left of the image), and 6) the label class (here: rockfall). After deployment of the dataset, the label paths need to be adapted to point to the correct image tile directory. Each classes. csv file contains 2 column entries, 1) the class (here rockfall) and 2) the class ID (here 0). The class ID can be adapted in case the data are used to train a multi–class detector. The. csv–file structure of RMaM–2020 meets the input criteria for RetinaNet, but can be easily adapted to fit to any other object detection framework. Similarly, all labels can be augmented using geometric operations, as long as the same operations are applied to the labels and the images. The dataset consists of 2 main folders which hold 8 sub–folders and a series of .jp2 (HiRISE), .tif (NAC), .csv files, and one ReadMe file.
4 Analysis
The RMaM–2020 labels cover a large range of spatial resolutions and solar illumination conditions. For Mars, RMaM–2020 contains images with spatial resolutions between 0.25 and 0.5 m/pixel as well as solar incidence and phase angles between 35 and 65 degrees. The solar phase angle describes the angle between the light that comes from the Sun and the light that is reflected into the camera (Sun–Planet–Satellite); the solar incidence angle describes the angle between the incoming light and the surface of a planet, where 0 degrees denote vertical and 90 degrees horizontal illumination conditions. For the Moon, RMaM–2020 contains images with a wider range of spatial resolutions (due to the nature of LRO’s orbit and NAC’s technical setup) between 0.5 and 2.2 m/pixel as well as a wider range of solar incidence and phase angles between 15 and 87 degrees. For both planetary domains, the pairings of differing spatial resolutions and solar incidence angle are relatively well–distributed, i.e., there are low- and high-resolution images for low- and high–incidence angle conditions. The ratio of label x and y dimensions (the bbox aspect ratio) is consistent for both planetary domains, reflecting the fact that both datasets have been labeled by the same human operator. The shape of each bounding box has been adapted to 1) the orientation of the respective boulder and track and 2) the local geologic background, to avoid that other, non–rockfall objects fall within the label (see Figure 1). The good alignment of absolute bbox dimensions across the two planetary domains is surprising, given that the lunar image data have slightly lower spatial resolutions than the martian image data; this could potentially indicate that either 1) martian rockfalls are slightly smaller on average or 2) that the human operator subconsciously increased the size of the bboxes when looking at lower resolution rockfall examples during labeling. The discussed properties of RMaM–2020 are visualized in Figure 2 and the IDs of all used HiRISE and NAC images are listed in Tables 1, 2, respectively.
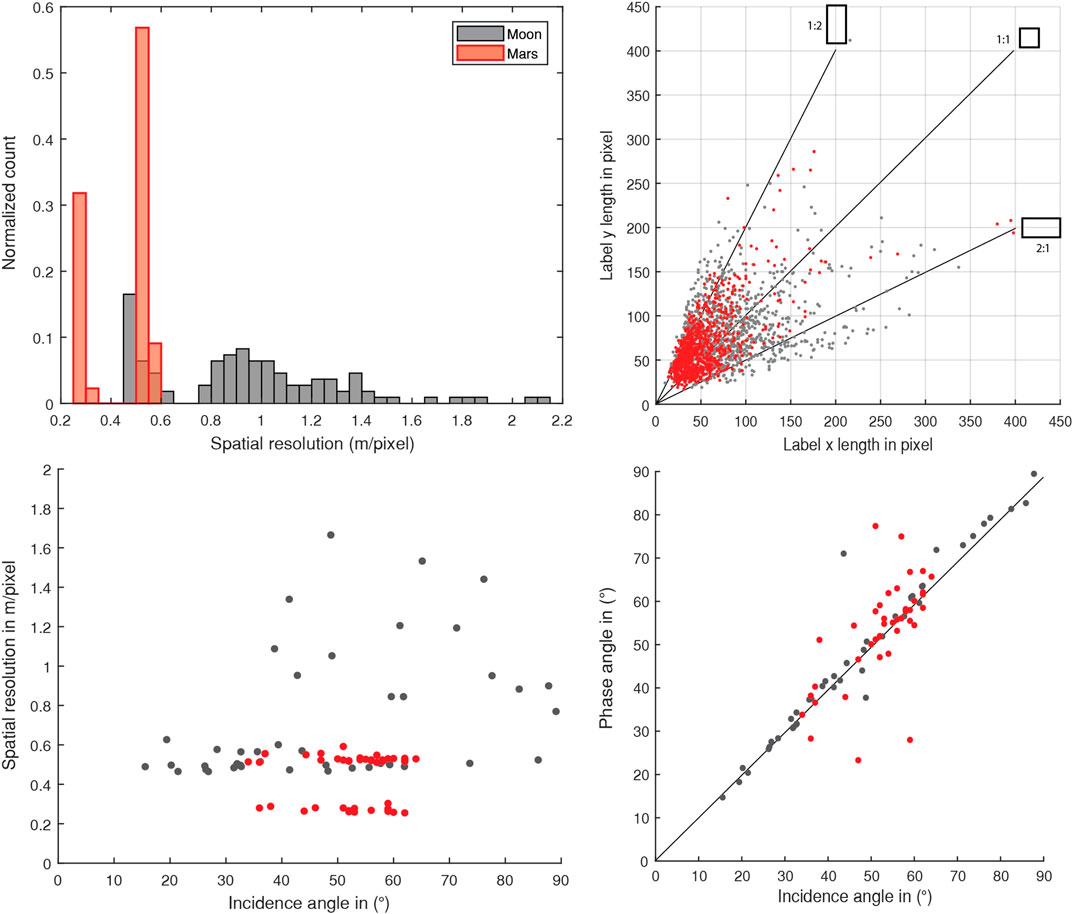
FIGURE 2. Distribution of spatial resolutions of the imagery used for training and testing from Mars (MRO HiRISE, red) and the Moon (LRO NAC, gray) and visualizations of the relations between label dimensions (label aspect ratio), illumination condition (solar incidence and phase), and spatial resolution. The label aspect ratio varies as labels need to adapt to the geomorphic appearance and spatial orientation of rockfalls.
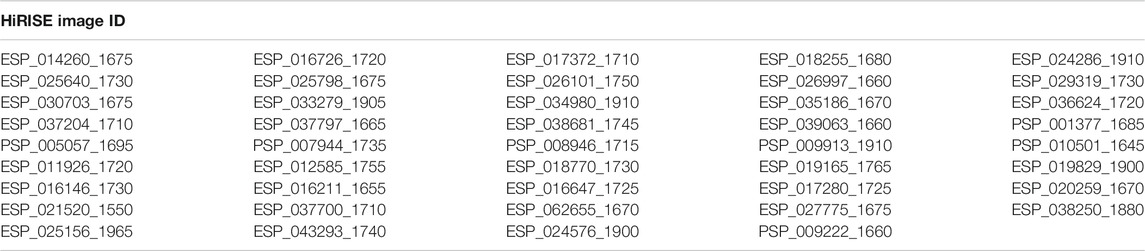
TABLE 1. All HiRISE image IDs used for RMaM–2020.
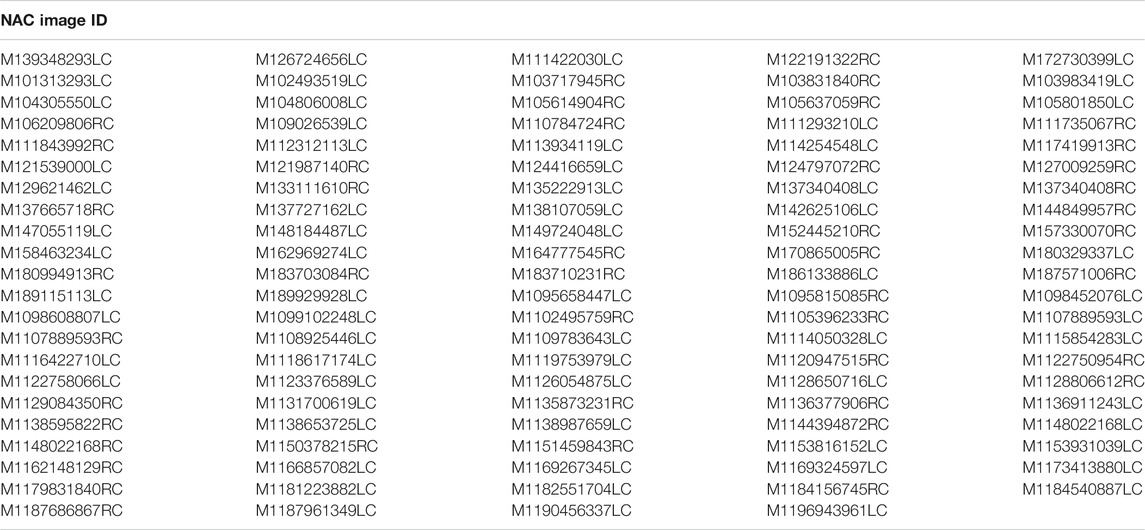
TABLE 2. All NAC image IDs used for RMaM–2020.
5 Future Work
Our goal is to complement RMaM–2020 with more rockfall labels over the next years, not only from the Moon and Mars, but from other planetary bodies such as Ceres (NASA’s Dawn Mission), comet 67P (ESA’s Rosetta Mission), and from potential future datasets such as from ESA’s BepiColombo Mission to Mercury. This way RMaM–2020 (and its successors) would remain a valuable resource for deep learning–driven rockfall detection across the Solar System in the future.
Data Availability Statement
The dataset presented in this study can be found in the online repository of the Max Planck Society: https://edmond.mpdl.mpg.de/imeji/collection/DowTY91csU3jv9S2.
Author Contributions
VB was involved with data selection, download, labeling, curation, & visualization, as well as paper writing. LM and GD were involved with project supervision and manuscript revision. All authors were involved with conceptualization, project administration, and formal analysis.
Funding
Funding for VB has been provided by the International Max Planck Research School at the Max Planck Institute for Solar System Research and by a fellowship within the IFI programme of the German Academic Exchange Service (DAAD). Funding for LM and GD has been provided by the NASA Jet Propulsion Laboratory and the California Institute of Technology.
Conflict of Interest
The authors declare that the research was conducted in the absence of any commercial or financial relationships that could be construed as a potential conflict of interest.
Acknowledgments
This work has been performed as part of the NASA JPL Visiting Student Research Program (JVSRP). VB would like to thank the NASA JPL COSMIC team (MLIA 398J) for the welcoming working culture.
References
Bickel, V., Aaron, J., Manconi, A., Loew, S., and Mall, U. (2020a). Impacts drive lunar rockfalls over billions of years. Nat. Commun. 11, 2862. doi:10.38/s41467-020-16653-3
Bickel, V., Conway, S., Tesson, P.-A., Manconi, A., Loew, S., and Mall, U. (2020b). Deep learning-driven detection and mapping of rockfalls on Mars. IEEE JSTARS 13, 2831–2841. doi:10.1109/jstars.2020.2991588
Bickel, V., and Kring, D. (2020). Lunar south pole boulders and boulder tracks: implications for crew and rover traverses. Icarus 348, 113850. doi:10.1016/j.icarus.2020.113850
Bickel, V., Lanaras, C., Manconi, A., Loew, S., and Mall, U. (2018). Automated detection of lunar rockfalls using a convolutional neural network. IEEE TGRS 57, 3501–3511. doi:10.1109/TGRS.2018.2885280
Bickel, V., Sargeant, H., Honniball, C., Martinez, S., Rogaski, A., Bell, S., et al. (2019). Analysis of lunar boulder tracks: implications for trafficability of pyroclastic deposits. JGR: Plan 124, 1296–1314. doi:10.1029/2018JE005876
Eggleston, J., Patterson, A., Throop, J., Arant, W., and Spooner, D. (1968). Lunar rolling stone. Photogramm. Eng. 34, 246–255.
Filice, A. L. (1967). Lunar surface strength estimate from orbiter ii photograph. Science 156, 1486. doi:10.1126/science.156.3781.1486
Hovland, H., and Mitchell, J. (1973). Boulder tracks and nature of lunar soil. Moon 6, 164–175. doi:10.1007/bf02630660
Hungr, O., Leroueil, S., and Picarelli, L. (2014). The varnes classification of landslide types, an update. Landslides 11, 167–194. doi:10.1007/s10346-013-0436-y
Lin, T., Goyal, P., Girshick, R., He, K., and Dollár, P. (2018). Focal loss for dense object detection. arXiv.
McEwen, A., Eliason, E., Bergstrom, J., and Bridges, N. The HiRISE Team (2007). Mars reconnaissance orbiter’s high resolution imaging science experiment (hirise). JGR: Planets 112, 5. doi:10.1029/2005JE002605
Moore, H. J. (1970). Estimates of the mechanical properties of lunar surface using tracks and secondary impact craters produced by blocks and boulders. NASA Int. Rep.: Astrogeol. 22.
Robinson, M., Brylow, S., Tschimmel, M., and Humm, D.The NAC team (2010). Lunar reconnaissance orbiter camera (lroc) instrument overview. Space Sci. Rev. 150, 81–124. doi:10.1007/s11214-010-9634-2
Sargeant, H., Bickel, V., Honniball, C., Martinez, S., Rogaski, A., Bell, S., et al. (2020). Using boulder tracks as a tool to understand the bearing capacity of permanently shadowed regions of the moon. JGR: Plan 125, e2019JE006157. doi:10.1029/2019je006157
Tesson, P.-A., Conway, S., Mangold, N., Ciazela, J., Lewis, S., and Mègea, D. (2020). Evidence for thermal-stress-induced rockfalls on mars impact crater slopes. Icarus 342, 113503. doi:10.1016/j.icarus.2019.113503
Keywords: rockfall, Mars, Moon, dataset, object detection
Citation: Bickel VT, Mandrake L and Doran G (2021) A Labeled Image Dataset for Deep Learning-Driven Rockfall Detection on the Moon and Mars. Front. Remote Sens. 2:640034. doi: 10.3389/frsen.2021.640034
Received: 10 December 2020; Accepted: 11 January 2021;
Published: 26 February 2021.
Edited by:
Hong Tang, Beijing Normal University, ChinaReviewed by:
Lachezar Filchev, Space Research and Technology Institute (BAS), BulgariaSaygin Abdikan, Hacettepe University, Turkey
Copyright © 2021 Bickel, Mandrake and Doran. This is an open-access article distributed under the terms of the Creative Commons Attribution License (CC BY). The use, distribution or reproduction in other forums is permitted, provided the original author(s) and the copyright owner(s) are credited and that the original publication in this journal is cited, in accordance with accepted academic practice. No use, distribution or reproduction is permitted which does not comply with these terms.
*Correspondence: V. T., Bickel; bickel@mps.mpg.de; vbickel@jpl.nasa.gov