Microbial Signatures in Fertile Soils Under Long-Term N Management
 María B. Villamil1*
  Nakian Kim1
  Chance W. Riggins1
  María C. Zabaloy2
  Marco Allegrini3
  Sandra L. Rodríguez-Zas4
- 1Department of Crop Sciences, University of Illinois, Urbana, IL, United States
- 2Departamento de Agronomía, Centro de Recursos Naturales Renovables de la Zona Semiárida (CERZOS, Universidad Nacional del Sur - Consejo Nacional de Investigaciones Científicas y Técnicas), Universidad Nacional del Sur, Bahía Blanca, Argentina
- 3Laboratorio de Biodiversidad Vegetal y Microbiana, Instituto de Investigaciones en Ciencias Agrarias Rosario (IICAR-Consejo Nacional de Investigaciones Científicas y Técnicas), Universidad Nacional de Rosario, Zavalla, Argentina
- 4Department of Animal Sciences, University of Illinois, Urbana, IL, United States
Long-term reliance on inorganic N to maintain and increase crop yields in overly simplified cropping systems in the U.S. Midwest region has led to soil acidification, potentially damaging biological N2 fixation and accelerating potential nitrification activities. Building on this published work, rRNA gene-based analysis via Illumina technology with QIIME 2.0 processing was used to characterize the changes in microbial communities associated with such responses. Amplicon sequence variants (ASVs) for each archaeal, bacterial, and fungal taxa were classified using the Ribosomal Database Project (RDP). Our goal was to identify bioindicators from microbes responsive to crop rotation and N fertilization rates following 34–35 years since the initiation of experiments. Research plots were established in 1981 with treatments of rotation [continuous corn (Zea mays L.) (CCC) and both the corn (Cs) and soybean (Glycine max L. Merr.) (Sc) phases of a corn-soybean rotation], and of N fertilization rates (0, 202, and 269 kg N/ha) arranged as a split-plot in a randomized complete block design with three replications. We identified a set of three archaea, and six fungal genera responding mainly to rotation; a set of three bacteria genera whose abundances were linked to N rates; and a set with the highest number of indicator genera from both bacteria (22) and fungal (12) taxa responded to N fertilizer additions only within the CCC system. Indicators associated with the N cycle were identified from each archaeal, bacterial, and fungal taxon, with a dominance of denitrifier- over nitrifier- groups. These were represented by a nitrifier archaeon Nitrososphaera, and Woesearchaeota AR15, an anaerobic denitrifier. These archaea were identified as part of the signature for CCC environments, decreasing in abundance with rotated management. The opposite response was recorded for the fungus Plectosphaerella, a potential N2O producer, less abundant under continuous corn. N fertilization in CCC or CS systems decreased the abundance of the bacteria genera Variovorax and Steroidobacter, whereas Gp22 and Nitrosospira only showed this response under CCC. In this latter system, N fertilization resulted in increased abundances of the bacterial denitrifiers Gp1, Denitratisoma, Dokdonella, and Thermomonas, along with the fungus Hypocrea, a known N2O producer. The identified signatures could help future monitoring and comparison across cropping systems as we move toward more sustainable management practices. At the same time, this is needed primary information to understand the potential for managing the soil community composition to reduce nutrient losses to the environment.
Introduction
Due to the excessive rates and inefficiencies associated with N fertilizer use, agricultural soil management is a major source of N losses to the environment (1, 2). Although the consequences are global, the challenges and potential solutions are local because the main players in the biological N cycle are soil microorganisms. All major transformative steps of the N cycle, fixation, mineralization, nitrification, and denitrification are microbially mediated (3).
Previous studies aimed to characterize the distribution and diversity of N relevant microorganisms in agroecosystems have used cultivation independent techniques targeting genes encoding phylogenic genes and critical enzymes of the microbial N cycle: nif H (N2 fixation), amoA (first step of nitrification), nirK and nirS (second step of denitrification), and nosZ (last step of denitrification) (1, 4–6) yet only a few long-term studies provided a complete picture of N-fertilization effects on the N transformation cycle within a single agroecosystem (7–9). New metagenomics tools allow for exploration of the changes in the composition of the soil microbiota that accompany the reported functional changes brought about by agricultural practices, thereby granting the identification of bioindicators of agricultural use (8, 10).
Although the soil microbiota is thought to be functionally redundant, the biodiversity loss commonly observed under intensive agricultural management, could seriously impair ecosystem functioning (11–13). Therefore, identifying bioindicators can provide primary information to monitor longitudinal responses to management practices, categorize core microbiota, and provide the raw material to further study microbial networks and their potential for manipulation to increase the sustainability of current operations (13, 14). To that end, the identification of bioindicators from well-replicated, long-term agricultural experiments are essential, as these systems represent a unique “steady” setting to characterize baselines and evidence changes in microbiota abundance and diversity in relation to management practices (15).
The Midwest region of the US is predominantly an area of corn and soybean production where corn crops are cultivated continuously or in short rotation with soybeans. Throughout the region, the rotated crops typically return higher yields compared to monocultures due to increased N availability, residue management, and improved yield stability (16, 17). Higher volumes of residue are left in the field following corn compared to soybeans due to higher yields. In turn, greater residue production and slower decomposing residues of corn compared to soybean crops lead to an accumulation of stable soil organic matter (SOM) in rotations that feature corn crops more frequently (18, 19). Soybean residues with characteristically low C:N ratio are quick to decompose and have been shown to increase the rates of nitrification and denitrification (20), while increasing the soil susceptibility to erosion (21). Nutrient requirements and removal rates also differ among crops: the removal of P and S per hectare is greater for corn, while K removal is greatest for soybean (22).
Although the N supply for soybean is carried out with biological N fixation, the crop must still obtain N from the soil and it is known to be a net N user (23). By altering the quantity and quality of residues, and of root exudates added to the soil, crop rotation influences the soil environment (24). Likewise, the differing requirement of N fertilizers among crops affects not only N cycling within the soil, but also several other soil properties, mainly pH (22, 25). In a meta-analysis by Ouyang et al. (25) crop rotation and soil pH influenced N cycling by changing the ammonia-oxidizing bacteria (AOB) and archaea (AOA) community dynamics as well as the community of denitrifiers in the soil. Fertilization accelerates each step of the microbial N cycle by loading the system with inorganic N (7, 25). Nitrification increases substantially, leading to greater losses of N to the environment through leaching and denitrification. Similarly, biological N fixation is reduced as the selective pressure for this function is relieved due to an abundance of easily accessible N in the system. Lower pH under continuous corn management has been reported to favor both the abundance and diversity of fungi (26). Another meta-analyses by Carey et al. (27) reported that additions of N increased both AOB and AOB abundances, with AOB showing increases an order of magnitude larger than AOA, correlated to increases in nitrification potential from agroecosystems.
Despite being economically successful, the widespread use of short rotations and continuous cropping systems in the Midwest region pose negative environmental consequences as these oversimplified intensive agricultural systems are driving global declines in biodiversity and soil health leading to reductions in agroecosystem functions and services (24, 28).
In a previous study, Huang et al. (7), reported that the long-term use of N fertilizers in continuous corn management, has led to acidification of the soils in the region. The reduction in soil pH was accompanied by increases in the abundance of fungal ITS and bacterial amoA counts, and parallel reductions in the abundance of nif H genes, potentially hampering biological N2 fixation while accelerating potential nitrification activities (7). However, that previous work restricted the analyses to quantification of genes such as ITS (fungal), 16S rRNA (bacteria and archaea), and those involved in the microbial N cycle, that are broad indicators of microbial community structure, while did not assess the signatures of long term management on the whole soil metagenome. Thus, because the main reported changes in these agroecosystems are strongly associated with the microbial cycling of N, we hypothesized that microbial groups responsive to crop rotation and N fertilization regimes, will be identified within each of the archaeal, bacterial, and fungal domains. Based on the results of our previous study, our goal was to identify bioindicators from those responsive microbes in a long-term experiment following 34–35 years since its initiation of experiments. We anticipate the identified signatures could help future monitoring and comparison across cropping systems and provide primary information to understand the potential for managing the soil community composition to reduce nutrient losses to the environment as we move toward more sustainable management practices.
Materials and Methods
Experimental Site, Treatment Layout, and Field Management Practices
The long-term agronomic trial is located at the Northwestern Illinois Agricultural Research and Demonstration Center (40°55'50” N, 90°43'38” W), approximately 8 km northwest of Monmouth, Illinois. The research site was established in 1981 to study the effects of five rates of N fertilization (0, 67, 135, 202, and 269 kg N/ha) on corn crop yields in monoculture (CCC) or in a short rotation with soybeans, with each phase present every year (Cs, Corn phase within corn-soybean rotation; Sc, Soybean phase within corn-soybean rotation). The two systems together represent 11.2 million ha in Illinois alone (29). Soils belong to the Muscatune silt loam series (fine-silty, mixed, mesic Aquic Argiudoll), a series of dark and deep, prime agricultural soils, on nearly flat topography. Muscatune series is representative of the loess-derived soils of the glaciated region of Illinois, covering over 207,000 ha in the state (30). The mean annual precipitation at Monmouth is 978 mm with a mean annual temperature of 16°C (31).
Treatments were arranged as a split plot of rotation (Rot) and N fertilization rates (N rate) in a randomized complete block design with three replications. Rotation was assigned to the main plots (18 m long by 30 m wide) and N fertilization rates to the subplots (18 m long by 6 m wide). Only three of the original fertilization rates (N rate: 0, 202, and 269 kg N/ha) were used in the current study representing unfertilized controls, current average annual application of N in the region, and what can be considered over application of N for corn, respectively. No N fertilizer was added to the soybean crops.
Tillage occurred in late fall following harvest using a chisel plow 20–25 cm deep, and a field cultivator was used to prepare the seedbeds the next spring. Corn (DK 63–33 both years) and soybeans (Munson 8,364 in 2015; 8,366 in 2016) were planted in mid-April–May each year in 76 and 38 cm rows, respectively, using 75,000–85,000 seeds per ha for corn and 340,000–350,000 seeds per ha for soybeans. Corn was fertilized in the spring at or before planting with N in the form of urea (46% N) until 1996, and thereafter as incorporated urea ammonium nitrate solution (UAN 28%). For all treatments, the same P rate of 40 kg P per ha was applied every 2 years as diammonium phosphate, and additional K fertilizer and lime were occasionally added to the entire experimental area based on soil test results (last application occurred in 2011). Fertilizer and pest management decisions were based on best management practices for the site according to the Illinois Agronomy Handbook (32).
Soil Sampling, DNA Extraction, and Sequencing
Soil sampling occurred following the harvest of the cash crops in October 2015 and again in October 2016, after 34 and 35 years, respectively, since the experiment was set up inspired by renewed interest in soil health research. Each year, three composited soil subsamples to a depth of 10 cm were taken with an Eijelkamp grass plot sampler (Eijkelkamp Soil & Water, Morrisville, NC, USA) within each experimental unit. Each subsample consisted of about 10 plugs totaling about 500 g of soil, collected walking in a zig-zag pattern. Samples were preserved with ice packs in the field, and frozen to −20°C upon arrival at our lab facilities. A complete, multivariate examination of soil properties at the sampled depth (10 cm) was presented in Huang et al. (7), and a summary table of baseline properties is included as Supplementary Table 1. Baseline soil properties include soil pH (1:1 soil-water), soil organic matter determined by loss-on ignition (SOM, %), nitrate and ammonium [ and , ln(ppm)], and available phosphorus [Pa, ln(ppm)], all by flow injection analysis with a Lachat Quick-Chem 8000 (LachatQuickchem Analyzer, Lachat Instruments, Loveland, CO, USA) (7).
Soil DNA was extracted using the PowerSoil® DNA isolation kits (MoBio Inc., Carlsbad, CA, USA), using 0.25 g of the composited soil samples, with the soils carefully homogenized before subsampling and following manufacturer's instructions. The extracted DNA quantity and quality were examined using a Nanodrop 100 Spectrophotometer (Thermo Fisher Scientific, Waltham, MA, USA). An Illumina MiSeq compatible amplicon library containing individual barcodes for each sample was constructed using 25 μL volumes with 1 × buffer (GoTaq Flexi buffer; Promega Corp., Madison, WI, USA), 2.5 mM MgCl2, 200 μM dNTPs, 0.4 μM each primer (forward and reverse), 1.0 μL template DNA (pooled amplicons), and 1.0 unit of GoTaq polymerase. The primer sets used for amplification were 349F (GTGCASCAGKCGMGAAW) and 806R (GGACTACVSGGGTATCTAAT) for the archaeal 16S rRNA gene (33); 515F (GTGYCAGCMGCCGCGGTAA) and 806R (GGACTACVSGGGTWTCTAAT) for the bacterial 16S rRNA gene (34), and 3F (GCATCGATGAAGAACGCAGC) and 4R (TCCTCCGCTTATTGATATGC) for the fungal ITS (internal transcribed spacer) region (35). The primers were designed as a 5′-PCR-specific + gene region + 3′-PCR-specific + 10 nt barcode, and the Fluidigm platform used two primer sets concurrently in the creation of the final DNA amplicon. A Qubit Fluorometer (Thermo Fisher Scientific, Waltham, MA, USA) was used to quantify the resulting amplicon libraries, which were then computed on a bioanalyzer (Agilent, Santa Clara, CA, USA) to assess the profile of fragment lengths. The barcoded libraries were pooled in equimolar concentrations, diluted to 10 nM, and sequenced at the Roy Carver Biotechnology Center, Functional Genomics lab at the University of Illinois at Urbana-Champaign (Urbana, IL, USA) using paired-end sequencing on the Illumina MiSeq (Illumina, San Diego, CA, USA), resulting in reads 250 nt in length.
Bioinformatic Processing and Microbial Diversity Analyses
Quality control and processing of sequences were conducted with QIIME2 (36, 37). Demultiplexed sequences were trimmed using a Q score threshold of 30 (38), leading to retention of base pair positions between 5 and 250 for forward sequences of all three taxa, and reverse sequences between 5 and 221 for archaea, 5 and 231 for bacteria, and 5 and 223 for fungi. The plugin DADA2 (39) was used for denoising, the removal of chimeric and low-quality sequences, with the chimera-method consensus option, and the resulting sequences were clustered into amplicon sequence variants (ASVs).
The rarefaction curves plateaued at sampling depths of 500 archaeal sequences per sample 24,000 bacterial sequences per sample, and 4,000 fungal sequences per sample (Supplementary Figure 1). The α-diversity measures calculated were observed number of ASVs, Faith' phylogenetic diversity index (PD), Pielou's evenness parameter (J'), and Shannon's diversity index (H') (Table 1). To calculate β-diversity measures for each taxon in QIIME2, the ASV sequences were aligned using MAFFT (40) to build a maximum likelihood phylogenetic tree with fasttree and midpoint-root methods. The β-diversity measures for each microbial group were obtained based on weighted UniFrac distances (Supplementary Tables 2–4).
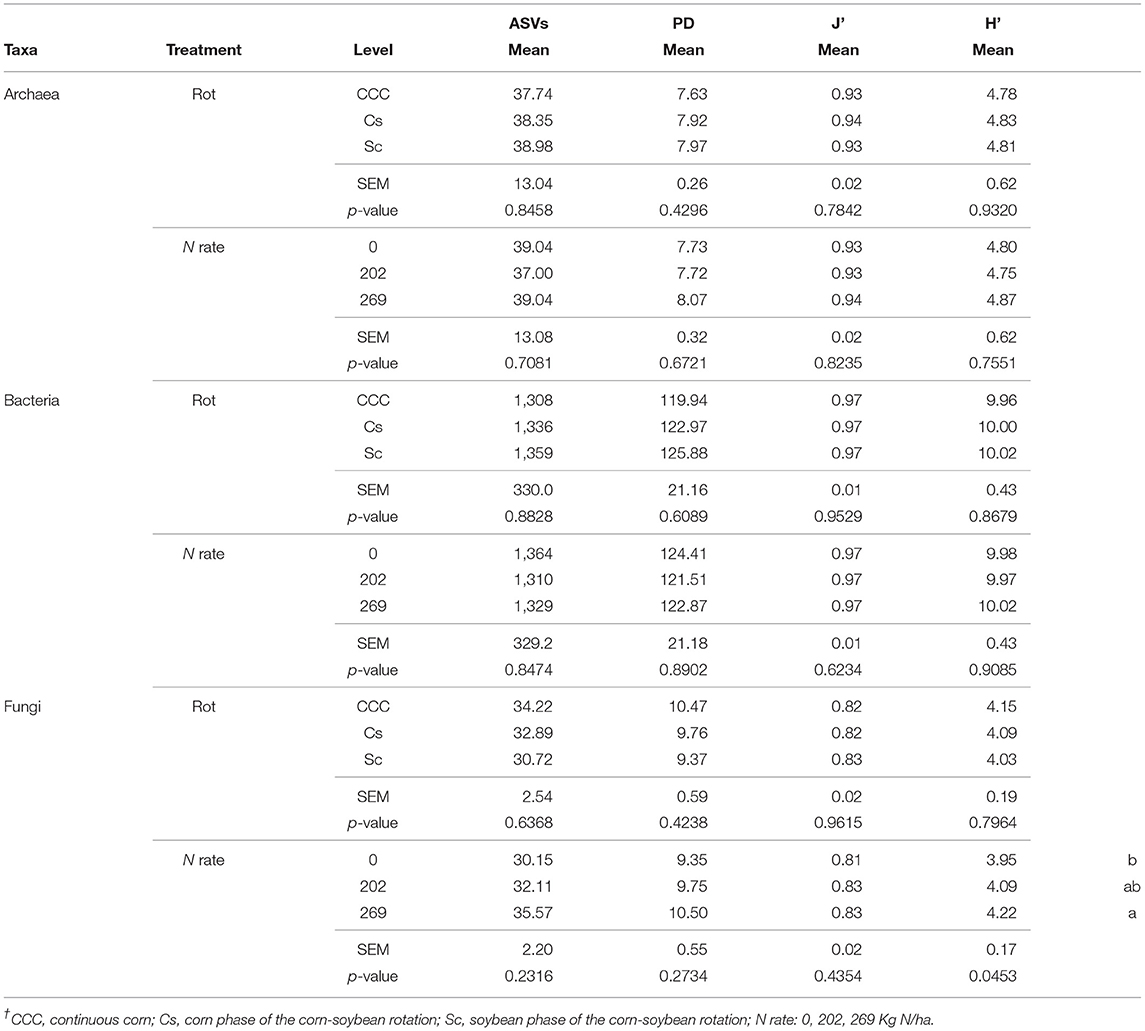
Table 1. Mean values, standard error of the mean (SEM), and probability values (p-values) associated with the ANOVA for the α-diversity parameters amplicon sequence variants (ASVs), Faith' phylogenetic diversity index (PD), Pielou Evenness Index (J'), and Shannon's Diversity Index (H') for bacteria, fungi, and archaea taxa, following 35 years of Rotation (Rot) and N fertilization (N rate)†.
Amplicon sequence variants (ASVs) for each taxon were classified with the Ribosomal Database Project (RDP) naïve Bayesian classifier (41), or with the RDPTool package (42) using 16S rRNA training set 18 and Warcup Fungal ITS trainset 2. The classified ASVs for each taxon were then grouped by genus and those with low (<0.1 %) per-sample relative abundances, averaged across all samples, were filtered out to reduce the sparsity of the dataset (43) using package dplyr (44) in R (45). The resulting data sets were comprised of eight genera of archaea, 195 genera of bacteria, and 128 genera of fungi.
Statistical Analysis and Visualization
The data sets of genera with their ASV reads for archaea, bacteria and fungi were input into the JMP® predictor screening platform to provide an initial identification of the microbes responsive to treatment effects using a bootstrap forest partitioning method (10, 26, 46). This led to the selection of 6 archaea, 39 bacteria, and 45 fungi genera (Supplementary Table 5) each contributing at least one percent to the variability of the model algorithms for each set. Next, each data set was centered log-ratio (clr) transformed after replacing zero values with the zCompositions package (47) in R (45), as recommended for compositional data (48).
Principal Component Analyses (PCA), were then deployed as a data reduction technique on the top contributing genera for each taxon to further remove redundancy. Using the FACTOR procedure in SAS software version 9.4 (SAS Institute, Cary, NC) with priors = 1 (default), the ASV reads of each set of genera were summarized into new sets of uncorrelated composite variables, or Principal Components (PCs). PCs with eigenvalues ≥1 that also explained at least 5% of the variability in each data set, were retained and used as independent variables for further analysis. Genera with an important correlation with each PC (PC loading value > |0.45|) were considered responsive microbes and used as descriptors of such PC (Tables 2–4). The “List of Prokaryotic Names with Standing in Nomenclature” or LPSN (49), as well as primary research, were used to find reports on the characteristics of the responsive genera. The GLIMMIX procedure in SAS was deployed to fit linear mixed models to each of the α-diversity measures (Table 1), and the extracted PCs for each microbial group (Table 5). Rotation (Rot) and N fertilization (Nrate) were considered fixed effects whereas blocks, years, and their interactions with fixed effects were considered random terms in the analyses of variance that ensued. When appropriate, least-square means of the response variables were separated by treatment levels, using the lines option of the lsmeans statement, setting the probability of Type I error at α = 0.05. Probability values 0.05–0.10 are reported and deemed “marginally” significant; by providing complete information on all studied variables up to this threshold (0.1), we are enabling readers to prioritize the biological and statistical information and make their own decisions when considering our assertions.
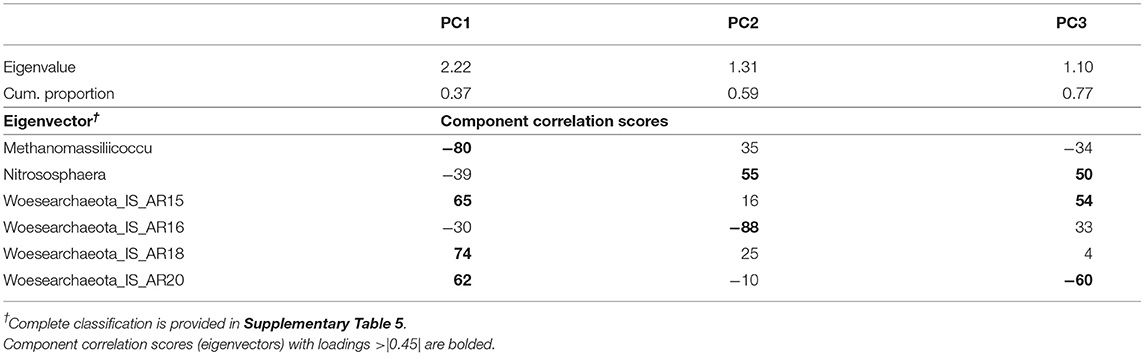
Table 2. Results of the principal component analysis of archaea genera showing the eigenvalues, the cumulative proportion of variability explained, and the eigenvectors for each of the three principal components (PC) extracted.
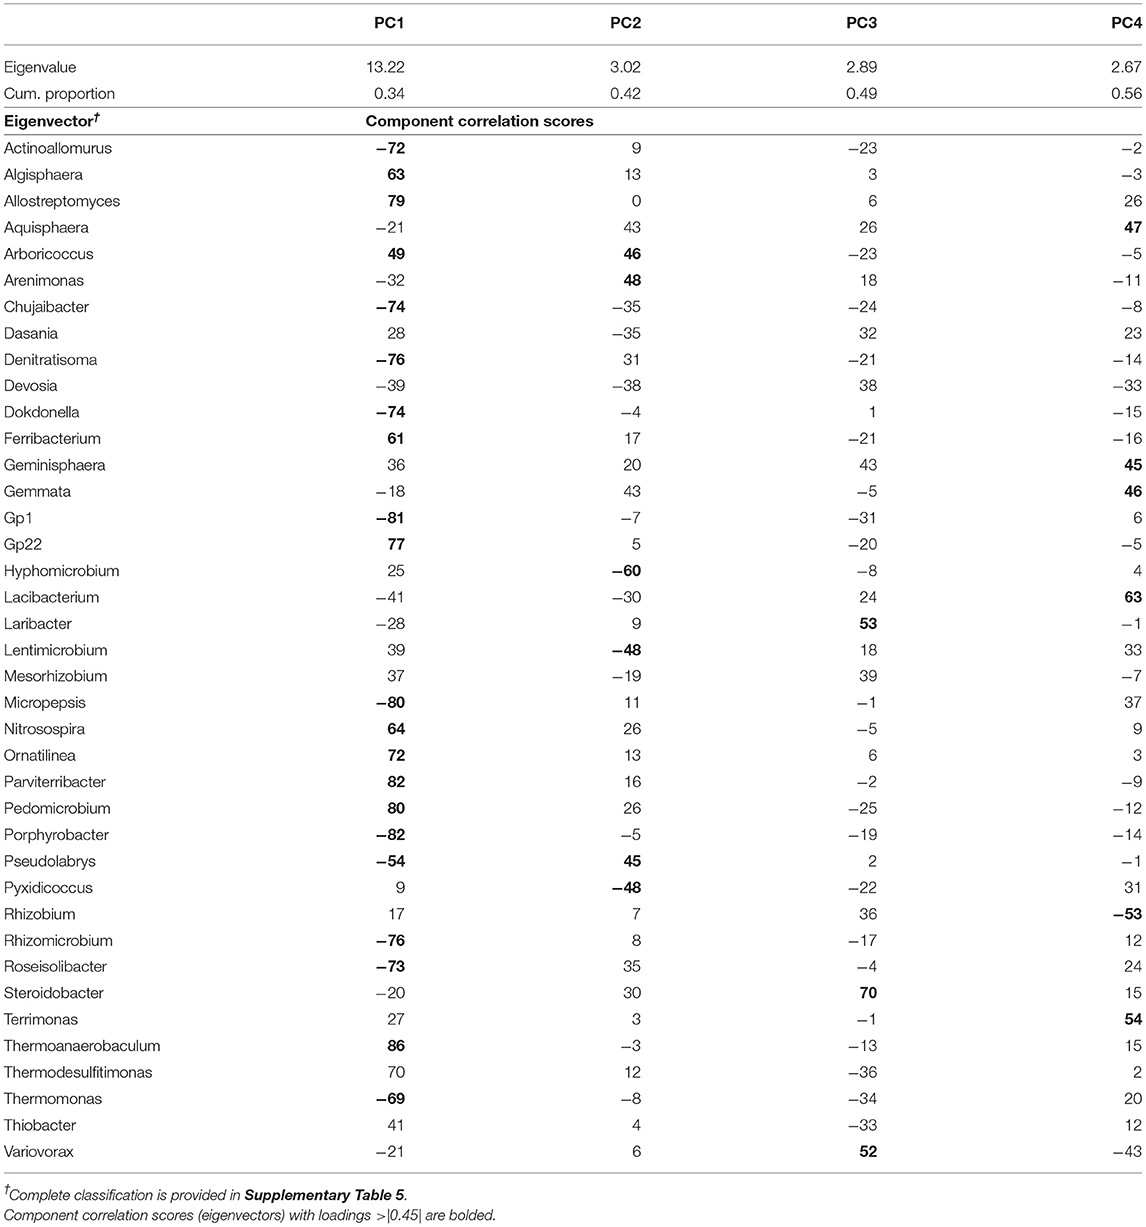
Table 3. Results of the principal component analysis of bacteria genera showing the eigenvalues, the cumulative proportion of variability explained, and the eigenvectors for each of the four principal components (PC) extracted.
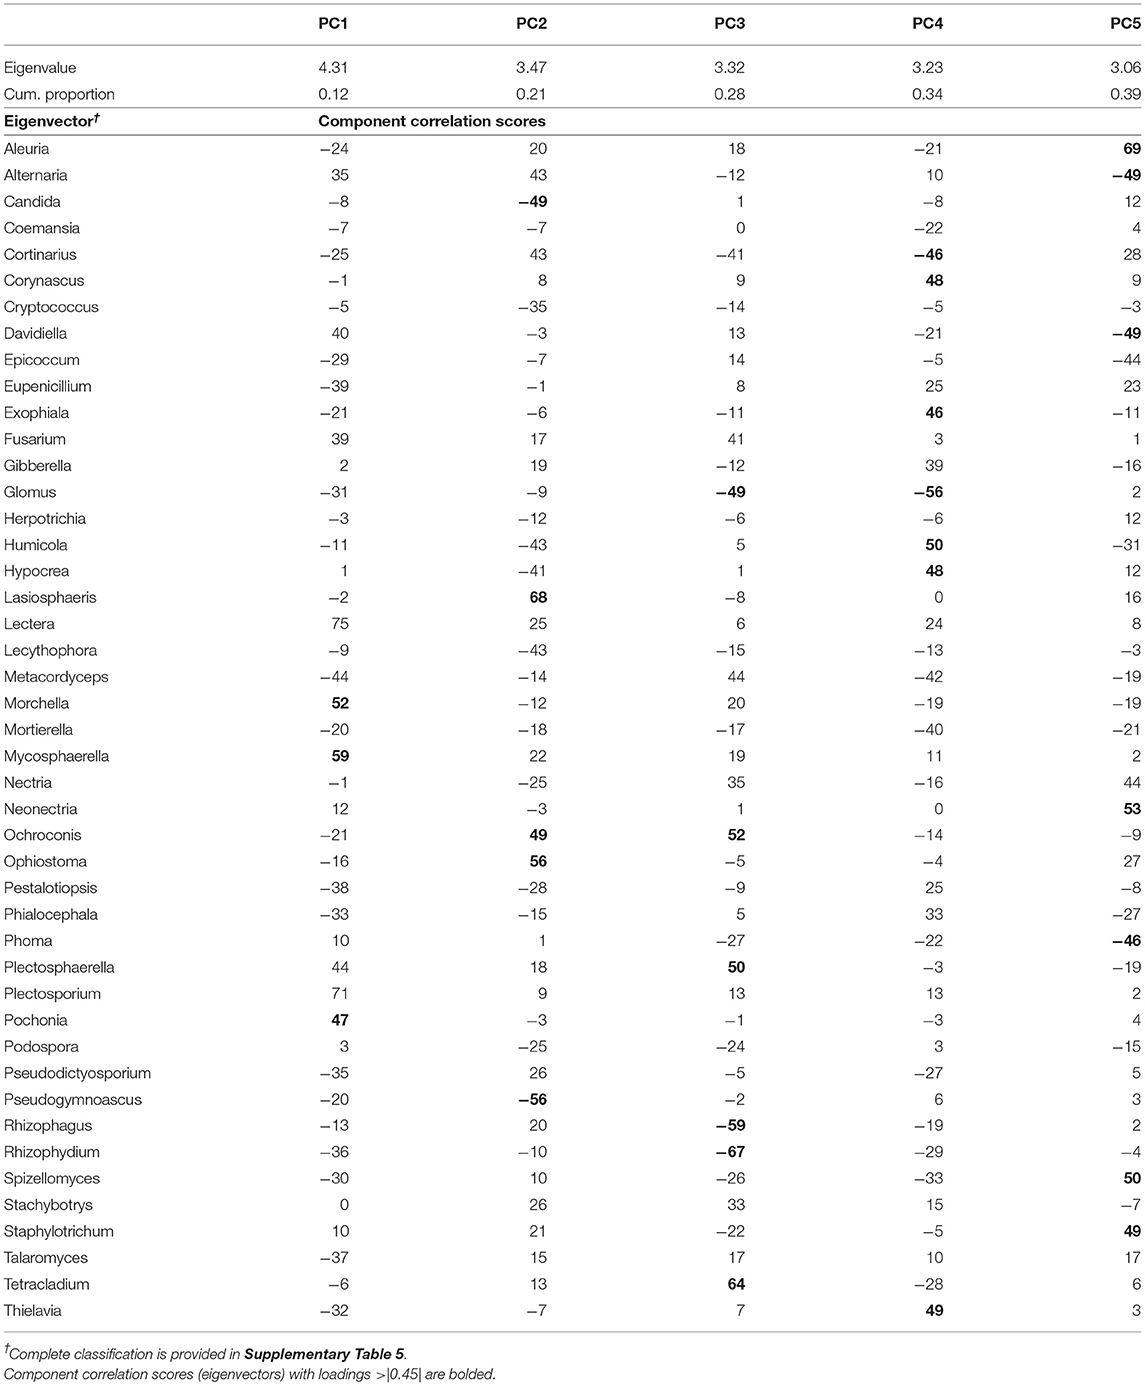
Table 4. Results of the principal component analysis of fungal genera showing the eigenvalues, the cumulative proportion of variability explained, and the eigenvectors for each of the five principal components (PC) extracted.
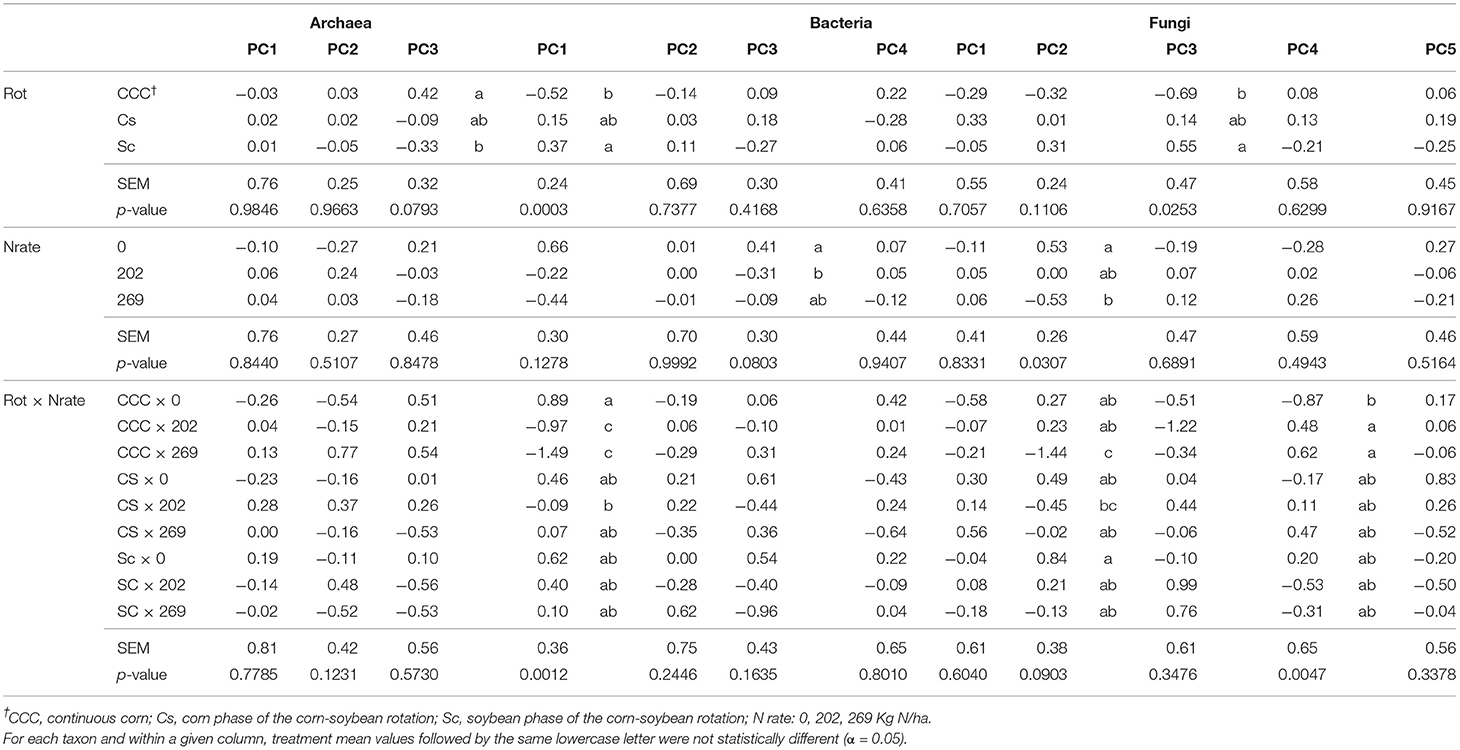
Table 5. Mean values, standard error of the mean (SEM), and probability values (p-values) associated with the analysis of variance (ANOVA) results for the effects of Rotation (Rot), N fertilization (Nrate), and their interaction on each group of principal components (PCs) calculated for archaea, bacteria, and fungi taxa datasets comprised of indicator ASVs.
The β-diversity measures were calculated with pairwise permutational analysis of variance [PERMANOVA, (50)] in QIIME2, a non-parametric multivariate approach to compare distances between treatment levels. The approach uses pseudo-F test statistics, rendering pseudo-F probability values (p-values) and q-values to correct for multiple hypothesis testing, both based on false discovery rate (FDR) (51).
Package ggplot2 (52) in R (45), was used to plot the statistically indicative relationship detected between PCs and treatments for a given taxon. Figures 1–6, each has two panels, where one panel depicts the PC means and their standard errors (as whiskers) for a given treatment, and the second panel shows the contribution of each responsive microbe to the PC mean value for each treatment. This contribution is thus calculated as the mean PC value for a given treatment (from Table 5) multiplied by the loading of the specific genera within the PC (from Tables 2–4), named MxL in each plot.
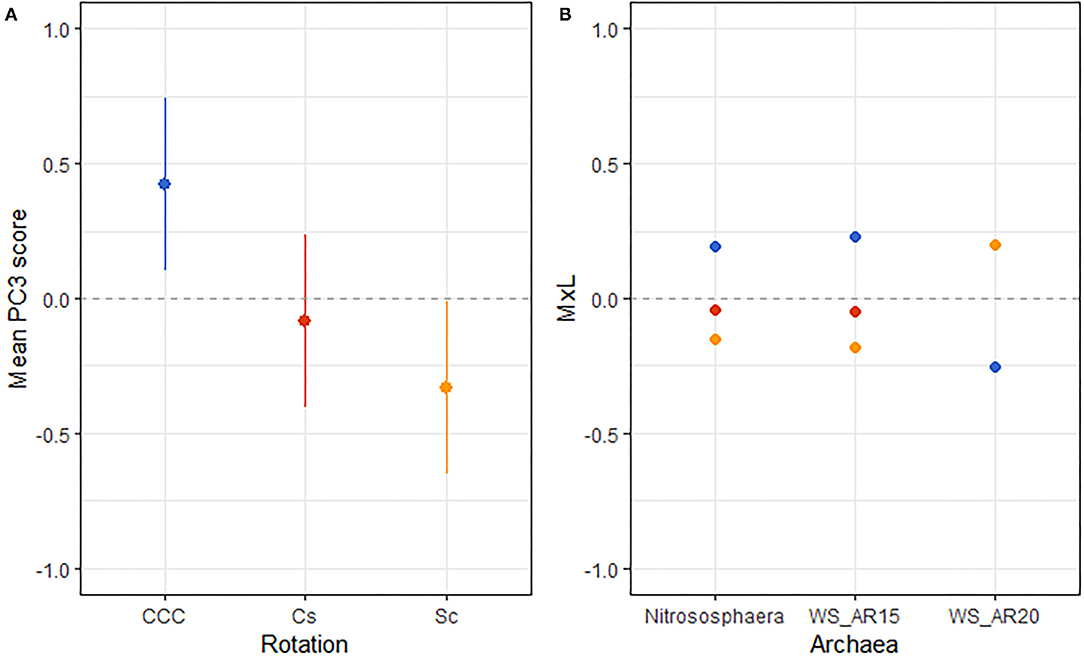
Figure 1. (A) Mean value of the archaeal PC3 for each rotation treatment with their standard errors (as whiskers). (B) Contribution of each indicator archaeon to the PC mean value (MxL) for each rotation treatment: continuous corn (blue), corn phase of the corn-soybean rotation (red), and soybean phase of the corn-soybean rotation (orange).
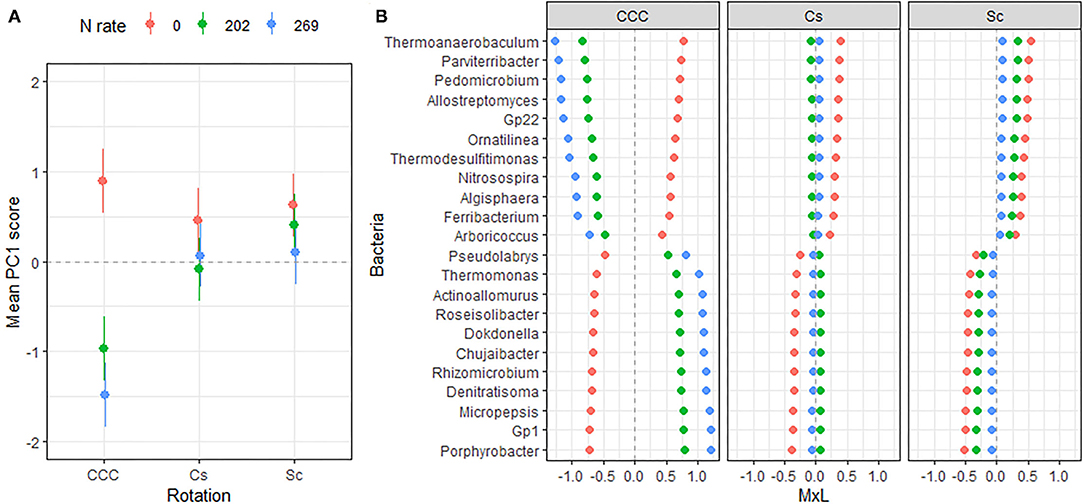
Figure 2. (A) Mean value of the bacterial PC1 scores for each rotation at each level of N fertilization. Standard errors are indicated as whiskers. (B) Contribution of each indicator genera to the PC mean value (MxL) for each rotation at each level N fertilization: CCC, continuous corn; Cs, corn phase of the corn-soybean rotation; Sc, soybean phase of the corn-soybean rotation.
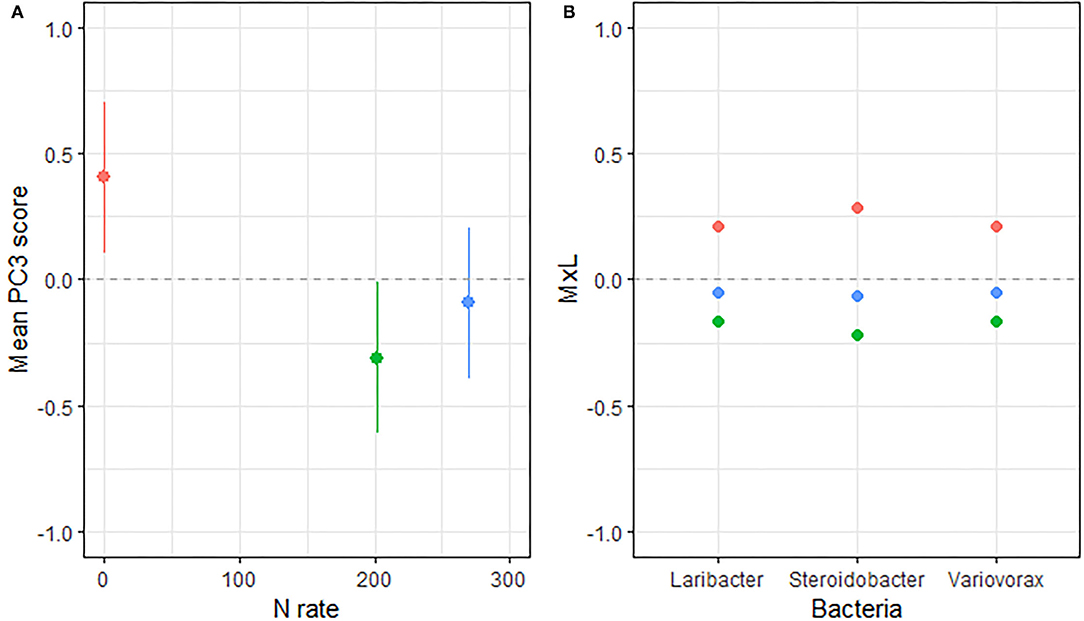
Figure 3. (A) Mean value of the bacterial PC3 scores for each level of N fertilization with their standard errors (as whiskers). (B) Contribution of each indicator genera to the PC mean value (MxL) for each level of N fertilization: 0 kg N/ha (pale red), 202 kg N/ha (pale green), and 269 kg N/ha (pale blue).

Figure 4. (A) Mean value of the bacterial PC2 scores for each rotation at each level of N fertilization. Standard errors are indicated as whiskers. (B) Contribution of each indicator genera to the PC mean value (MxL) for each rotation (panels) at each level of N fertilization: CCC, continuous corn; Cs, corn phase of the corn-soybean rotation; Sc, soybean phase of the corn-soybean rotation.
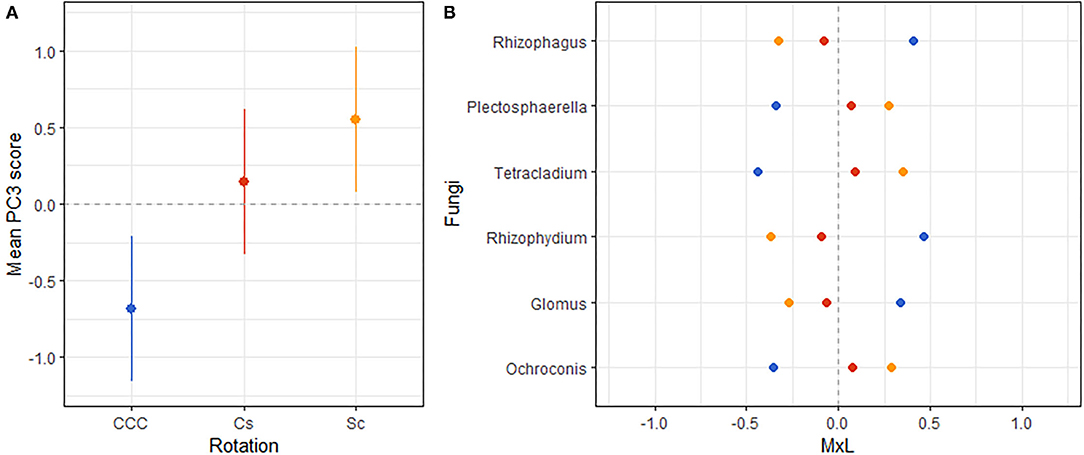
Figure 5. (A) Mean value of the fungal PC3 for each rotation treatment with their standard errors (as whiskers). (B) Contribution of each indicator fungi to the PC mean value (MxL) for each rotation treatment: continuous corn (blue), corn phase of the corn-soybean rotation (red), and soybean phase of the corn-soybean rotation (orange).
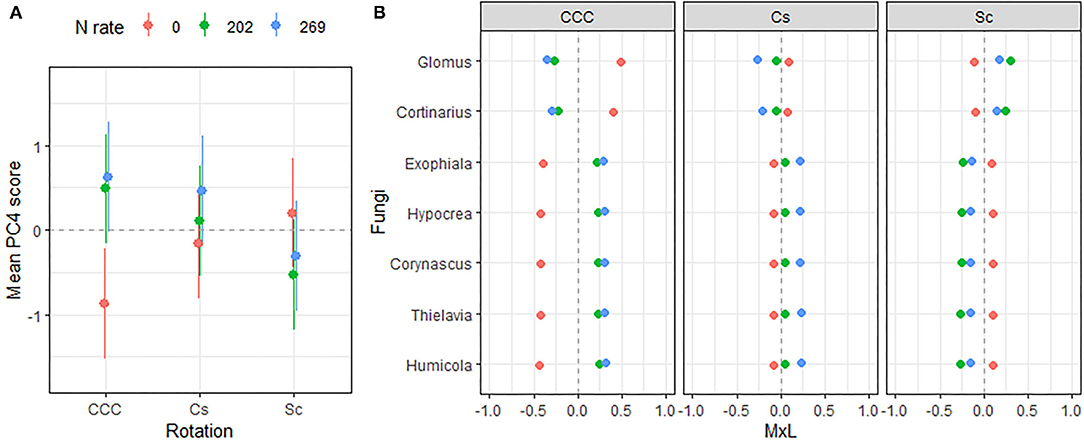
Figure 6. (A) Mean value of the fungal PC4 scores for each rotation at each level of N fertilization. Standard errors are indicated as whiskers. (B) Contribution of each indicator genera to the PC mean value (MxL) for each rotation (panels) at each level of N fertilization: CCC, continuous corn; Cs, corn phase of the corn-soybean rotation; Sc, soybean phase of the corn-soybean rotation.
To link our findings with concurrently published research, Pearson's correlation coefficients obtained with the CORR procedure of SAS, were used to evaluate the relationships among the statistically indicative PCs extracted for each taxon in this study, with the baseline soil properties (Supplementary Table 1) determined in the study of Huang et al. (7). The baseline soil properties were here analyzed using the above-mentioned linear mixed models and the results included within Supplementary Table 1.
Results
Overall Characterization of the Soil Microbiota
The archaeal taxa had 118,618 archaeal 16S rRNA region sequences clustered into 8 ASVs, the bacterial taxa had 14,136,085 16S V4 region sequences clustered into 1701 ASVs, whereas the fungal kingdom had 3,166,008 ITS region sequences clustered into 342 ASVs. The α-diversity measurements of ASV count, Faith' phylogenetic diversity index (PD), Pielou's evenness index (J'), and Shannon's diversity index (H'), for bacteria and archaea, revealed no statistical differences for effects of crop rotation and N rate (Table 1) or their interaction. On the other hand, the J' index for fungi showed a statistically significant effect of the Rot × Nrate interaction term (p = 0.01) with the highest value of J' determined for Cs-202 (0.85), the lowest J' determined for both CCC-202 (0.80) and Cs-0 (0.80), and the remaining combinations showing intermediate values between these two sets of responses. Fertilization rate had a statistically significant effect on fungal H' measurements (p = 0.04) where the diversity index under 269 kg N/ha was statistically higher compared to the unfertilized controls, with intermediate values for the 202 kg N/ha treatments (Table 1).
The β-diversity of the archaeal communities was not statistically different for any of the 36 pairwise comparisons of the Rot × Nrate treatment interactions according to the q-values obtained, correcting for multiple comparisons (Supplementary Table 2). The β-diversity of Bacteria differed significantly for 16 out of the 36 Rot × Nrate treatment interactions, driven largely by differences between the continuous corn system (CCC) and the Cs or SC phases of the corn-soybean rotations (Supplementary Table 3). The bacterial β-diversity of the CCC controls (CCC-0) also differed from the diversity measured at higher N rates (CCC-202 and CCC-269), with similar levels of β-diversity between them. Bacterial β-diversity under CCC-0 however, did not differ from that measured under the Cs controls (Cs-0) or at the highest N rate (Cs-269) for that phase. Likewise, the β-diversity under CCC-0 did not differ from that measured within soybean phases, at any N fertilization rate (Sc-0, Sc-202, Sc-269 kg N/ha). The β-diversity of the fungal community structure differed significantly only for the rotation treatment, and within those, β-diversity was statistically different under CCC compared to the Cs or Sc phases of the corn-soybean rotation (Supplementary Table 4).
The indicator ASVs extracted for the archaeal community (Supplementary Table 5) belong mainly to the phylum Thaumarchaeota (54%), followed by Euryarchaeota (27%), and in much lower percentages to the Woesearchaeota (2%), and Pacearchaeota (0.1%) phyla. Bacterial reads at the phylum level showed that Proteobacteria (44%) was the most abundant, followed by Planctomycetes (15%), Gemmatimonadetes (13%), Acidobacteria (10%), Bacteroidetes (7%), Chloroflexi (6%), Actinobacteria (4%), Firmicutes (1%), and Verrucomicrobia (1%) (Supplementary Table 5). The fungal community was dominated by the phylum Ascomycota (63%), followed by Zygomycota (19%), Chytridiomycota (9%), Glomeromycota (6%), and Basidiomycota (3%) (Supplementary Table 5).
Soil Microbiota Responses to Crop Rotation and N Fertilization
Archaea
The PCA on the 16S rRNA archaeal domain rendered a set of three uncorrelated PCs (PC1-PC3; Table 2), explaining a total of 77% of the variability contained within the top-contributing archaeal dataset. Archaeal indicators with a significant correlation with a given PC, loadings ≥ |0.45|, were considered important contributors and used in the description of such PC. Thus, PC1 explained 37% of the dataset variability and contained negative loadings for Methanomassiliicoccus, and positive loadings from three Woesearchaeota incerta sedis (IS): AR15, AR18, and AR20. PC2 explained an additional 22% of the variability, representing a contrast between Nitrososphaera (positive loading) and AR16 (negative loading). PC3 explained an additional 18% and showed a contrast between the abundance of Nitrososphaera and AR15, both with positive loadings, and the abundance of AR20, with negative loadings.
Results from linear mixed model ANOVAs assessing effects of crop rotation (Rot) and N fertilization rate (Nrate) on each of the PCs representing the archaeal community (Table 5) indicate no statistically significant effects for either PC1 or PC2, and a marginal yet statistically significant effect of rotation on PC3 (p = 0.079). A plot of PC3 mean values for each Rot level with its standard error bars is shown in Figure 1A, accompanying the means separation results included in Table 5. Means separation procedures on this relation showed CCC with the largest and Sc with the lowest treatment means, while the Cs showed intermediate values. Looking at the contributions from each indicator archaea to these mean separation results in Figure 1B, differences were driven by higher relative abundances of Nitrososphaera and AR15 and lower relative abundance of AR20 in CCC when compared to Sc.
Bacteria
The PCA on top bacterial indicators rendered a set of four uncorrelated PCs (PC1–PC4; Table 3) that together explained 56% of the variability of the data set. PC1 explained 34% of the variability and its eigenvector contained a contrast between two groups of microbes, those with positive loadings: Algisphaera, Allostreptomyces, Arboricoccus, Ferribacterium, Gp22, Nitrosospira, Ornatilinea, Parviterribacter, Pedomicrobium, Thermoanaerobaculum, and Thermodesulfitimonas; whereas the group with negative loadings included Actinoallomurus, Chujaibacter, Denitratisoma, Dokdonella, Gp1, Micropepsis, Porphyrobacter, Pseudolabrys, Rhizomicrobium, Roseisolibacter, and Thermomonas. PC2 explained an additional 8% of the variability and its eigenvector contained a contrast between two groups of microbes, those with positive loadings: Arboricoccus, Arenimonas, and Pseudolabrys; whereas the group with negative loadings included Hyphomicrobium, Lentimicrobium, and Pyxidicoccus. PC3 explained an additional 7% and was represented by three genera all with positive loadings, Laribacter, Steroidobacter, and Variovorax. Lastly, PC4 contrasted the abundance of Rhizobium (negative loading) with that of a group of bacteria including Aquisphaera, Geminisphaera, Gemmata, Lacibacterium, and Terrimonas.
Linear mixed model ANOVAs assessing effects of Rot and Nrate and their interaction, on each of the PCs representing the bacterial community (Table 5), indicate statistically significant interaction effects (Rot × Nrate) on PC1 (p = 0.0012), and a marginal yet statistically significant main effect of Nrate on PC3 (p = 0.0803). No statistically significant effects were detected for PC2 or PC4 and thus, there will not be further discussed. A graph of the PC1 means for each Rotation and N rate level with their respective standard error bars is shown in Figure 2A, accompanying the means separation results included in Table 5. The contribution of each bacterial genera to these results is depicted in Figure 2B. Thus, it became evident that the differential pattern of the response observed for the rotations at successive N rates was mainly driven by a greater magnitude of the response of the microbial groups under CCC compared to the response to N observed for the Cs or Sc phases of the corn-soybean rotation. Compared to the CCC-0 controls, the group of indicator microbes with positive loadings within PC1, significantly decreased with the addition of N at either rate of 202 or 269 kg N/ha, and the opposite behavior was observed for those indicators with negative loadings (Figure 2B). This marked response to Nrate was however not observed within each of the Cs or Sc rotation phases, which showed intermediate values to the CCC-0 on one end, and the Cs-202 on the other, yet were all statistically different from the strong response to N under CCC. A graph of the PC3 means for each N rate level with their respective standard error bars is shown in Figure 3A, which accompanies the means separation results included in Table 5. The contribution of each bacterial genera to these results is depicted in Figure 3B. The three bacteria genera statistically decreased in abundance at 202 kg N/ha yet their relative abundance at the maximum Nrate showed values intermediate between those registered at 0 and 202 kg N/ha.
Fungi
The PCA on top fungal indicators rendered a set of five uncorrelated PCs (PC1–PC5; Table 4) that together explained 39% of the variability of the data set. PC1 explained 12% of the variability and its eigenvector was dominated by three genera with positive loadings: Morchella, Mycosphaerella, and Pochonia. PC2 explained an additional 9% of the variability and its eigenvector contained a contrast between two groups of microbes, with positive loadings: Lasiosphaeris, Ochroconis, and Ophiostoma, and Candida and Pseudogymnoascus with negative loadings. PC3 explained an additional 7% presenting a contrast of two microbial groups: Ochroconis, Plectosphaerella, and Tetracladium with positive loadings, and Glomus and Rhizophagus, with negative loadings. PC4 explained an additional 6% contrasting the abundance of Corynascus, Exophiala, Humicola, Hypocrea, and Thielavia, with that of Cortinarius and Glomus (both with negative loading). Lastly, PC5 explained the remaining 6% of the variability in the fungal dataset and contained a contrast between Aleuria, Neonectria, Spizellomyces, and Staphylotrichum and the group of indicators with negative loadings comprised of Alternaria, Davidiella, and Phoma.
Linear mixed model ANOVAs assessing effects of Rot and Nrate and their interaction, on each of the PCs representing the fungal community (Table 5), indicate statistically significant interaction effects (Rot × Nrate) on PC2 (p = 0.0903), and PC4 (p = 0.0047), and a statistically significant main effect of Rot on PC3 (p = 0.0025). No statistically significant effects were detected for PC1 or PC5 and thus, there will not be further discussed. A graph of the fungal PC2 means for each Rotation and N rate level with their respective standard error bars is shown in Figure 4A, the means separation results included in Table 5. The contribution of each fungal genera to these results is depicted in Figure 4B. Again, the differential pattern of the response observed for the rotations at contrasting N rates (0 vs. 269 kg N/ha), was mainly driven by a greater magnitude of the response of the fungal groups under CCC. Thus, compared to the CCC-0 and CCC-202, the group of fungal indicator genera with positive loadings within PC2 significantly decreased in abundance at 269 kg N/ha whereas those with negative loadings increased with more N in the system (Figure 4B). Thought the highest PC2 means were registered for the Sc-0 controls, no differences in the response to Nrate was observed within Sc or the Cc rotation phases, which showed intermediate values to the Sc-0 and the Cs-202. With the exemption of Cs-202, they were all statistically different than the strong response to the maximum N rate under CCC (Figure 4A). PC3 means for each Rot level with their respective standard error bars are shown in Figure 5A, which accompanies the means separation results included in Table 5. The contribution of each fungal indicator genera to these results is depicted in Figure 5B. Thus, PC3 means showed a statistically significant increase within the Sc compared to the CCC, with the Cs showing intermediate values. The fungal indicators with positive loadings increased in abundance with Sc, while those with negative loadings increased with CCC. Last, Figure 6A shows PC4 treatment means for each Rot × Nrate level with their respective standard error bars, alongside the contribution of each fungal indicator genera to the PC4 means separation results (Figure 6B, Table 5). Once again, the interaction is driven by a strong response of the PC4 microbial groups to the addition of N under CCC, not observed under either phase of the rotated crops (Figure 6A). Thus, compared to the fertilized systems, the CCC-0 system is characterized by a higher relative abundance of Glomus and Cortinarius and lower abundances of Corynascus, Exophiala, Humicola, Hypocrea, and Thelavia. However, once N is added at either 202 or 269 kg N/ha, the group dominance is reverted. Fungal indicators within Cs and Sc at any given N rate, all showed relative abundances intermediate to those registered under CCC (Figure 6B).
Relations Between Soil Microbiota and Soil Properties
Linear mixed model ANOVAs assessing effects of Rot and Nrate and their interaction, on each of soil parameters determined for the site at the time of sampling (Supplementary Table 1), indicate statistically significant interaction effects (Rot × Nrate) on pH (p = 0.0021), and (p = 0.0285), and a statistically significant main effect of Nrate on Pa (p = 0.0066). At 0 Nrate, pH was similar across rotations; the interaction effect on pH becomes evident once N is added within the CCC system, a response that is not observed within the Sc phase of the corn-soybean rotation, and that is only partially evident within the Cs phase. Within the latter, the reduction in pH occurs when N is added at the lowest rate, Cs-202, yet the pH measured at higher Nrate was intermediate between that of the control Cs-0, and the pH at Cs-202. No significant differences associated with the treatments were detected for SOM and . The lowest levels of were measured within the CCC-0 and the Cs-0 controls, and the highest within CCC- 269 kg N/ha, the remaining combinations showing intermediate values between these responses. Regardless of the rotation, however, Pa showed a statistically significant decrease with the addition of N.
Table 6 shows the matrix of Pearson' correlation coefficients among pH, SOM, , , and Pa and the PCs responsive to treatments for each taxon, Archaea PC3 (APC3), Bacteria PC1 and PC3 (BPC1 and BPC3), Fungi PC2, PC3, and PC4 (FPC2, FPC3, FPC4). Nineteen of the 25 statistically significant correlation coefficients found in the analyses (bolded, Table 6) fell within the “weak” (|0.2–0.4|) association range, whereas 3/25 correlations were classified as “moderate” (|0.4–0.6|) range, and only 2/25 and 1/25 correlations were within the “strong” (|0.6–0.8|) and very strong (>|0.8|) association ranges, respectively. Thus, APC3 was weakly and positively associated with BPC3 values (r = 0.25, p = 0.0706), and to Pa (r = 0.27, p = 0.0464) and weakly and negatively associated with (r = −0.26, p = 0.0563). Bacterial PC1 was positively associated with FPC2 scores (r = 0.68, p <0.0001), soil pH (r = 0.92, p < 0.0001), and Pa (r = 0.43, p = 0.0012), relations that fell within the strong, very strong, and moderate association ranges, respectively. At the same time, BPC1 was found to be weakly and negatively associated to FPC4 (r = −0.37, p = 0.0054), SOM (r = −0.30, p = 0.0298), and (r = −0.30, p = 0.0253). Bacterial PC3 had a weak and negative association with FPC3 (r = −0.25, p = 0.0675), and a weak positive association with Pa (r = 0.23, p = 0.0932). Fungal PC2 was strongly and positively associated with soil pH (r = 0.69, p < 0.0001), and weakly associated with Pa (r = 0.27, p = 0.0458), while showing a negative weak association to (r = −0.25, p = 0.0690). Fungal PC3 displayed weak and negative associations to both (r =-0.25, p = 0.0662), and Pa (r = −0.33, p = 0.0134). Fungal PC4 was moderately and negatively associated with pH (r = −0.42, p = 0.0015), and positively associated with SOM (r = 0.51, p < 0.0001) while showing a weak negative relation to Pa (r = −0.25, p = 0.0706). Among the soil properties examined, pH was weakly and negatively associated to SOM (r = −0.36, p = 0.0074), and (r = −0.25, p = 0.0642), and positively related to Pa (r = 0.37, p = 0.0060). Likewise, was found to be weakly and negatively associated with SOM (r = −0.40, p = 0.0031), (r = −0.31, p = 0.0213), and Pa (r = −0.25, p = 0.0721).
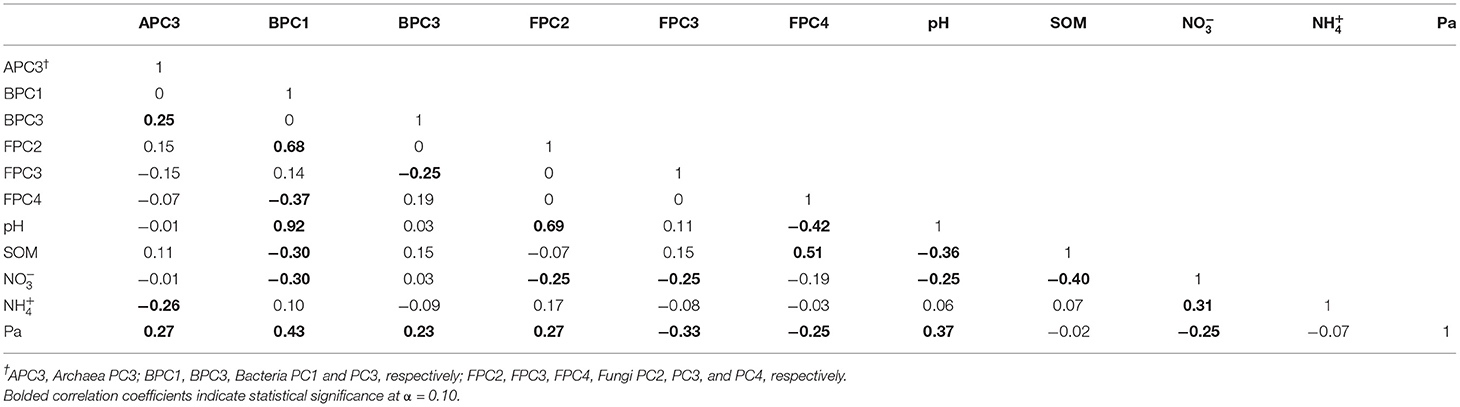
Table 6. Matrix of Pearson' correlation coefficients among microbial indicator groups for each taxa responsive to treatments (Archaea PC3, Bacteria PC1 and PC3, Fungi PC2, PC3, and PC4) and soil properties of pH, soil organic matter (SOM), nitrate and ammonium (, ), and available P (Pa).
Discussion
Overall, results from this study indicate that both agronomic practices of crop rotation and N fertilization rates leave a significant imprint on the soil microbial groups following over three decades of management. Continuously cropped corn had distinct microbial taxa, while annually rotated communities were similar in both crop phases. These findings agree with those of Chamberlain et al. (53) in southern Wisconsin, Ashworth et al. (54) in Tennessee, and Behnke et al. (26) in Illinois, who studied the long-term impacts of rotating corn and soybean compared to their monocultures on bulk soil microbial communities. The general lack of differences between the corn and soybean phases of the corn-soybean rotation supports a legacy rotational effect rather than an immediate yearly impact of each crop of the rotation on the structure of microbial communities, as observed in other studies (26, 53).
Because of the annual addition of fertilizers within the continuous corn system compared to the every-other-year application in the rotated ones, when interactions between crop rotation and N fertilization were present, the responses were closely associated with the changes in soil pH and total inorganic N within the continuously cropped corn systems compared to the rotated ones. As it was observed for the crop rotation, alternating corn and soybean phases seemed to ameliorate the response of the soil microbiota to N fertilization detected in the continuous corn system. This ameliorated response could be further supported by similar levels of SOM and Pa measured across monocropped and rotated corn crops despite obvious differences in amount and quality of residue returned, consistent with previous studies in soils of the region (26, 53, 55). Across rotations, however, N fertilization had a significant impact on increasing in the soil while reducing pH and available P. The latter is attributed to the enhanced P uptake by crops in rotation, that yielded 10% more grain on average than monocropping (56), as well as to the potential damage to microbial acid phosphatase activities with N-fertilization (57).
The following subsections Archaeal indicators, Bacterial indicators, and Fungal indicators provide an overview of the archaeal, bacterial, and fungal indicators identified and their relations with soil properties. Lastly, subsection Final remarks and future directions delineates future directions and integrates these findings with previously published information and relevant literature pertaining to crop rotation and N fertilization in agroecosystems.
Archaeal Indicators
Archaeal indicators found for the rotation factor in this study clearly distinguished between the continuous corn and the rotated corn and soybean phases. Higher abundances of Nitrososphaera and the Woesearchaeota IS AR15 along with the reduced abundance of the Woesearchaeota IS AR20 were the signature of the continuous corn management when compared to the rotated systems (Figure 1).
Nitrososphaera is an aerobic, neutrophilic, ammonia-oxidizing archaea (AOA), predominantly found in terrestrial ecosystems (58). Due to its high abundance in agricultural soils and strong positive correlation of Nitrososphaera with agricultural management, in particular with soil pH and ammonium levels, Zhalnina et al. (59) proposed this genus as a signature microorganism for agricultural land use. Likewise, Kim et al. (10) looking for microbial indicators from corn-soybean rotations with and without cover crops, identified Nitrososphaera as the only archaeal indicator, prospering under the oligotrophic conditions of the corn-soybean rotations without cover crops. The higher abundance of this genus in the continuous corn management relative to the rotated system could be explained by differences in the quality of organic matter supplied to the soil (including straw and root exudates). Labile organic matter favors the growth of the soil AOA community (60, 61) and thus, a higher supply of this labile SOM in CCC could be a potential explanation for the observed results.
Woesearchaeota represents a newly established member of the superphylum DPANN (Diapherotrites, Parvarchaeota, Aenigmarchaeota, Nanoarchaeota, and Nanohaloarchaea) that are predicted to have fermentation-based lifestyles and/or are symbionts (62). Both ecological distribution patterns and metabolic predictions conducted by Liu et al. (63, 64) support a key role of woesearchaeotal lineages of anoxic environments in the cycling of carbon, nitrogen, and sulfur. Because nirK and nosZ genes are detected in Woesearchaeota, they may play a role in the nitrogen cycle under anoxic conditions, typical of inner aggregates, such as denitrification from nitrite to N2 (63, 64). Representative sequences from the AR15 genome were only previously identified in samples from hypersaline anoxic environments (63), while the metabolic reconstruction of the AR20 genome indicate the ability to play a role in sulfur cycling (62, 64). The negative correlation with soil detected for these archaeal indicators as a group (APC3), and the different behavior of AR20 could be hinting to an ammonium sensitivity of this archaeon compared to AR15 and Nitrososphaera. With their potential importance in soil N cycling, more efforts should be dedicated to culturing and studying archaeal metabolism and ecology.
Bacterial Indicators
Indicators of N Fertilization Within Rotations
A distinct bacterial signature for the continuous corn systems was found in response to N additions. Two groups, each comprised of 11 genera, behaved oppositely when N fertilizer was applied within the continuous corn systems, regardless of the rate supplied (Figure 2). Compared to their abundances within the unfertilized controls, the abundance of Thermoanaerobaculum, Parviterribacter, Pedomicrobium, Allostreptomyces, Acidobacteria subgroup 22 (Gp22), Ornatilinea, Thermodesulfitimonas, Nitrosospira, Algisphaera, Ferribacterium, and Arboricoccus, decreased when N was added to the system. On the other hand, the abundance of Pseudolabrys, Thermomonas, Actinoallomurus, Roseisolibacter, Dokdonella, Chujaibacter, Rhizomicrobium, Denitratisoma, Micropepsis, Acidobacteria subgroup 1 (Gp1), and Porphyrobacter increased with N fertilization.
The mirrored segregation between the groups of genera is likely driven by soil pH and nutrient levels, supported by the strong positive correlation measured between bacterial BPC1 (Table 6) and soil pH (r = 0.92), the moderate association with available P (Pa, r = 0.43), and the negative weak correlations detected between the bacterial groups with SOM and (Table 6). Changes in soil properties associated with N fertilization are noticeable within continuous corn rotations (Supplementary Table 1), i.e., addition of N caused reductions in pH and available P, while increasing total inorganic N. Within this system, there seems to be a trend to increased SOM with increased fertilization, yet no statistically significant effect was detected. Thus, while the relative abundances of the first group of genera decreased in response to reductions in soil pH and available P, and parallel increases in N with fertilization, the second group thrived under those same conditions. These results agree with other reports from long-term agricultural systems in the region (26, 53, 54), who found that soil pH, SOM, and nutrient levels, are the main soil factors modeling the responses of the microbiota to crop rotation and tillage practices. Relevant literature at the level of phyla generally supports these findings as well, although specifics remain unknown for many genera (65–69).
Both Acidobacteria in this group (Thermoanaerobaculum, and Gp22) of indicators that responded negatively to N fertilization, have previously shown a positive correlation to pH (67, 70). Most other acidobacteria subgroups, like the dominant Gp1, which showed a negative correlation with soil pH, have a preference for acidic growth conditions that characterizes the phylum (71). Acidobacteria has been proposed as a keystone taxon (72), associated with the decomposition of SOM in soils and playing a major role in denitrification processes, thus central in carbon and N cycling (71).
The two actinobacteria in this group were Allostreptomyces, originally isolated from the endorhizosphere of Psammosilene tunicoides in southeast China (73), and Parviterribacter (74), isolated from a dark loam grassland soil. The endophyte might confer protection to the plant from pathogens and environmental stresses, as well as promoting plant growth (69). Ornatilinea responded negatively to fertilization and it was the only indicator genus identified from the phylum Chloroflexi. Ornatilinea is the first representative of the family Anaerolineacea, characterized as strictly anaerobic chemoautotrophs, capable of growth on cellulose as the sole source of energy and carbon whose niche may be favored under unfertilized treatment poorer in C and N (75).
Thermodesulfitimonas is also the only identified indicator from the phylum Firmicutes in our study; it is a thermophilic, anaerobic, chemolithoautotrophic bacterium, isolated from a terrestrial hot spring (76). Their lithoautotrophic metabolism may explain their positive responses to comparatively nutrient poor unfertilized continuous corn system. Another lone representative of its phylum, Algisphaera (Planctomycetes) belongs to the group of indicators that decreased in abundance with the addition of N in the systems. The phylum Planctomycetes constitutes a significant proportion of aquatic and terrestrial environments, although most of them are uncultivated and the known ecophysiological types of planctomycetes are quite limited, as is the case with Algisphaera, a strictly aerobic bacterium isolated from algae (77). However, without much knowledge about this genus, it is difficult to explain their response to N rate treatment.
Four members of the Proteobacteria phylum, belong to the group of indicators with a negative relation to fertilization: Pedomicrobium, Arboricoccus (both Alphaproteobacteria), and Nitrosospira and Ferribacterium (both Betaproteobacteria). Though phylogenetically related, members of this phylum are physiologically, morphologically, and ecologically extremely diverse; they include various pathogens of humans, animals, and plants, as well as several taxa that play key roles in the carbon, sulfur, and nitrogen cycles (65). Arboricoccus is a facultative aerobic bacterium isolated from the endophytic microbiome of pine trees (78), grown in acidic soil environments. Nitrosospira includes the most relevant ammonia oxidizing bacteria (AOB) in soil environments and an increase in diversity and abundance of this taxa have been reported under long-term N applications (60, 79). The negative response observed in our study is likely associated to the uniformity of ammonium levels across treatments, indicating that the gradual pH decreases induced by the fertilizer was the main controller of this AOB abundance. Our results agree with Pereira e Silva et al. (80) who reported that fluctuations in ammonia oxidizing communities in agricultural soils are mainly influenced by pH and soil type.
The group of 11 indicator genera with a positive response to N fertilization, included one member of each of the Acidobacteria, Actinobacteria, and Gemmatimmonadetes phyla, genera Acidobacteria subgroup 1 (Gp1), Actinoallomurus, and Roseisolibacter, respectively. The group also included eight Proteobacteria, four Alphaproteobacteria (Micropepsis, Rhizomicrobium, Pseudolabrys, and Porphyribacter), one Betaproteobacteria (Denitratisoma), and three Gammaproteobacteria (Dokdonella, Chujaibacter, and Thermomonas).
Acidobacteria is one of the nine dominant phyla in soil with critical roles as decomposers and denitrifiers, and as previously stated, the response of Gp1 to fertilization is typical of most members of the phylum, which prefer acidic conditions (70). The Actinomycetes are well-established as prolific producers of a wide range of bioactive secondary metabolites, among them, Actinoallomurus is one of the newly discovered genera, known as an endophyte of rice (Oryza sativa), and Acacia spp. Like other endophytes, they might confer plants resistance to stress and pathogenic invasions, aid in the solubilization and availability of phosphates, and facilitate the solubilization of iron via the production of siderophores (69).
Representatives of the phylum Gemmatimonadetes have been detected in a wide range of soil environments, where they seem to be well-adapted to the low moisture/low oxygen conditions of inner aggregates (81). Roseosolibacter, an aerobic bacterium, was recently isolated from an agricultural floodplain (82). Within the Alphaproteobacteria, genera Micropepsis and Rhizomicrobium are chemoheterotrophic bacteria widespread in soils, strict or facultative anaerobes capable of fermenting a wide range of carbon sources in neutral or mildly acid soils, which make them well-adapted to the soil environment under heavily fertilized continuous corn (83). Pseudolabrys, described by Kampfer et al. (84), were isolated from acidic soils whereas Porphyrobacter, an aerobic bacterium, is often associated with aquatic environments (85, 86). The Betaproteobacteria in this second group of microbial indicators is represented by Denitratisoma, a denitrifying bacterium isolated from activated sludge of a wastewater treatment plant able to perform anaerobic oxidation of estradiol to CO2 using nitrate as the electron acceptor, thus reduced to a mixture of N2O and N2 (87).
The last three genera of this indicator group with a positive response to N fertilization, were all members of the Gammaproteobacteria phylum. Dokdonella genera are strictly aerobic rods isolated from soil; a few species can perform the aerobic reduction of nitrate (88). Chujaibacter is an aerobic rod isolated from soil shown to be unresponsive to land management in a metagenomic survey of Polish soils (89). However, this genus was recently identified in agricultural soils as belonging to a cluster of microbes favoring the low pH and high SOM environments found under continuous corn systems, which agrees with our results (26). Thermomonas is an aerobic genus isolated from a variety of habitats, i.e., soils, hot springs, slurry, and biofilms (90). A few species of this genus are proven denitrifiers isolated from denitrification reactors (91).
Indicators of N Fertilization Across Rotations
Three Proteobacteria genera decreased in abundance when N was added to the systems (Figure 3) and the response was consistent for continuous and rotated corn phases. Though the abundances of these genera seem to follow the overall decrease in soil pH and available P across rotations (Supplementary Table 1), they did not show a statistically significant correlation with soil pH, and they were only weakly and positively correlated to Pa (Table 6, BPC3). Among them, the genera Variovorax is an aerobic or facultative anaerobic group of denitrifying bacteria isolated from soils (92). Lastly, the genera Steroidobacter (closely related to Denitratisoma mentioned in the previous group of indicators) are rod-shaped denitrifying Gammaproteobacteria that degrade steroids (oestradiol and testosterone) as the sole source of carbon and energy with nitrate as the electron acceptor (93).
Fungal Indicators
Indicators of N Fertilization Within Rotations
Rotation and N fertilization, alone and in combination, all favored distinct fungal groups that suggest an important role of fungi within these simplified agroecosystems typical of production agriculture. Within continuous corn, maximum N rate increased the abundances of Pseudogymnoascus and Candida, while decreasing those of Ochroconis, Ophiostoma, and Lasiosphaeris (Figure 4). The abundances of all these genera within the continuous corn systems did not differ between unfertilized control and intermediate N rate (202 kg N/ha). Interestingly, the highest PC2 mean score is found under the unfertilized controls of the soybean phase of the corn-soybean rotation, although not statistically different from the microbial abundances found under N fertilization (Table 5). Therefore, the abundances of these five fungal indicators contrasted the most between unfertilized soybean phase of the corn-soybean rotation and continuous corn with highest N rate (Figure 4B). The fungal abundances within the corn phase of the corn-soybean rotation reflect again the suggested legacy effect of the rotation, with abundances and responses intermediate between those observed under continuous corn and the soybean phase of the rotation.
As it was the case for the bacterial indicators of N fertilization and rotation, the segregation between the groups of fungal genera are likely driven by soil pH and nutrient levels, supported by the strong positive correlation measured between fungal FPC2 (Table 6) and soil pH, the weak association with available P, and the negative weak correlation detected with . Changes in soil properties associated with N fertilization are most noticeable within continuous corn rotations, yet soil pH is similar among unfertilized controls while available P decreases with N additions regardless of the rotation (Supplementary Table 1). On the other hand, the measured within the soybean phases tends to decrease as N is added yet they are all statistically similar to measured under the intermediate N rate application within continuous corn. Thus, while the relative abundances of Pseudogymnoascus and Candida increased in response to the strongest reductions in soil pH and available P and increases at the maximum N rate fertilization within the continuous corn system, Ochroconis, Ophiostoma, and Lasiosphaeris abundances suffered under those same conditions.
All these indicator genera belong to the Ascomycota phylum, dominant in agricultural soils consistent with other studies (10, 26, 94–96). Pseudogymnoascus species are cellulolytic saprotrophs and usually grow in low temperatures (97). Ubiquitous in soil, species of this genus are known to form ericoid mycorrhizae with the roots of alpine Ericales and other perennial hosts, helping these plants adapt to low-nutrient environments (98, 99). The genera Ochroconis, Ophiostoma, and Lasiosphaeris are all known saprobes on wood and plant litter. Ochroconis species are usually found in moist environments poor in nutrients (100), while Lasiosphaeris are typically isolated from decaying wood yet their role in nutrient and energy cycling remains poorly understood (101).
Another group of fungi shown in Figure 6, created a distinct microbial signature for the fertilized continuous corn; this time discriminating the unfertilized controls from both N systems, regardless of N rate. Thus, we detected that Glomus and Cortinarius relative abundances were greater within the unfertilized controls and decreased in the presence of N at any rate. On the other hand, the abundances of Exophiala, Hypocrea, Corynascus, Thielavia, and Humicola increased with N fertilization. The genus Glomus comprise arbuscular mycorrhizal fungi (AMF) that forms obligate symbioses with plant roots, where it obtains carbon from the host plant in exchange for water and nutrients, mainly P (98). Cortinarius is an ectomycorrhizal mycobiont (102), suspected to be the largest genus of order Agaricales, containing over 2,000 widespread species.
All the genera that increased in abundance with N fertilization belong to the Ascomycota phylum, a response consistent with their dominance in agricultural soils. Exhophiala is a mesophilic black yeast and member of the dark septate endophytes found commonly in soil environments, colonizing maize roots (103), and sorghum plants (68). In soils of the U.S. Midwest region, Exhophiala has been found to parasite eggs and adult females of the soybean cyst nematode (SCN), Heterodera glycines Ichinohe (Phylum Nematoda), the most important pest affecting soybean production worldwide (104, 105). Hypochrea species, also known as Trichoderma (106), are widespread in agricultural fields providing important benefits to cultivated plants such as plant growth promotion, yet Trichoderma species have also been reported to be active producers of N2O in agroecosystems (107). The three genera representative of the Chaetomiacea family of the Sordariales order, Corynascus, Thielavia, and Humicola, are saprobes commonly found in agricultural soils (108, 109).
Indicators of Crop Rotations
A clear fungal signature emerged for the rotation factor (Figure 5) where the abundances of Rhizophagus, Rhizophydium, and Glomus increased within the continuous corn systems compared to rotated corn-soybean systems. Genera Rhyzophagus and Glomus belong to the Glomeromycota phylum and include known AMF that trade P, water, and other nutrients with the photosynthates (C) of their plant hosts. Rhyzophydium was the only genus represented in this study from the phylum Chytridiomycota, which is abundant in soils as decomposers of recalcitrant materials such as cellulose, chitin, and keratin, and parasitize plants and other fungi (110). Rhyzophydium, is common in nutrient-deficient soils, where they may have a role in nutrient recycling (110). The detrimental effect of increased soil nutrient levels on these potentially beneficial genera in our study is supported by their weak and negative association with available P and with (FPC3, Table 6). On the other hand, these soil conditions favored the increased abundances of the Ascomycota genera Plectosphaerella, Tetrachladium, and Ochroconis within the rotated corn-soybean systems. Plectosphaerella (an anamorph of Fusarium spp) is well-known as a pathogen of several plant species of agricultural and horticultural importance worldwide (111). Fusarium spp have also been reported to be potent N2O producers in agricultural soils (107), and as its anamorph, Plectosphaerella potentially possess this capacity.
Final Remarks and Future Directions
A previous report from this research site explored shifts in the microbiota and the main steps of the microbial N cycle, using targeted gene abundances as proxies, with soil properties (7). Results indicate that long-term N fertilization under continuous corn management acidified the topsoil leading to a parallel increase in the abundance of fungal counts (ITS), potentially damaging biological N2 fixation and accelerating potential nitrification activities, as was evidenced by the reduced abundance of nif H genes, and increased abundance of bacterial amoA genes (7). Likewise, Benhke et al. (8), in a long-term study comparing tillage options within monocropped and rotated corn and soybean systems, found that the acidification measured within continuous corn systems following 20 years of management, resulted in increased abundance of fungal ITS and bacterial amoA counts (AOB), and parallel reductions in archaeal amoA copy numbers (AOA), regardless of tillage. The authors posed that the continuous corn system, with its increased and yearly need for N fertilization, intensifies the microbial N cycle, enhancing bacterial nitrification and exacerbating acidification, thus creating an environment primed for N leaching and increased N2O emissions (8).
The observed increase in ITS abundances under continuous corn management, and the higher diversity found with increased N fertilization (Table 1), show that typical corn crops create a favorable environment for the proliferation of fungal populations. Not only the acidic conditions associated with fertilization but also the large volume of residues and root exudates returned to the soil by corn crops, seem to guarantee their ecological success (94–96, 112). Huang et al. (7) attributed the strong positive correlations detected between ITS counts and nirK and nosZ counts in our previous study, to the overall acidification of the systems preferred equally by fungi and main denitrifier groups. Yet the observed relations could also suggest an important contribution of fungal denitrification within these agroecosystems, recognized as an important biological process for N2O emissions (107). Ninety percent of the fungi reported producing N2O belong to the phylum Ascomycota, and in our data set, they are represented by species of Trichoderma and potentially, Plectosphaerella, as the Fusarium anamorph (107, 113). However, it should be acknowledged that detection of these genera in the soil metagenome does not necessarily mean that they are active members of the microbiome at the time of sampling. Future studies should explore the signatures of long-term nitrogen fertilization in CCC focusing on the soil meta-transcriptome.
In contrast, N fertilization and rotation have no measurable effect on the abundance (7) and alpha diversity (Table 1) of either archaeal or bacterial groups in this study. Although much less researched than bacteria, members of the archaea domain show homologous genes that allow them to perform different reductive pathways of the N-cycle, including both assimilatory processes, such as nitrate assimilation and N2 fixation, and dissimilatory reactions, such as nitrate respiration and denitrification (114). Here, we identified Nitrososphaera, an AOA nitrifier archaeon, and Woesearchaeota AR15, an anaerobic denitrifier, both as markers for continuous corn environments, decreasing in abundance with rotated management. Seven out of the eight bacteria indicators associated with the N cycle (Variovorax, Steroidobacter, Acidobacteria Gp22, and Gp1, Denitratisoma, Dokdonella, and Thermomonas), are known denitrifiers, and only one is known as an AOB (Nitrosospira).
Interestingly, in our previous study by Huang et al. (7), no significant impacts of fertilization rates or rotations were detected on the estimated abundance of denitrifiers using the nirS, nirK, and nosZ gene counts in the soil as proxies. In the present study, the indicator genera identified as potential denitrifiers were evenly represented in both unfertilized and high N rate treatments, in agreement with the results reported by Huang et al. (7). Nonetheless, sensitivity of some of these denitrifying indicators to N rate was only detected under continuous corn system. Therefore, we could speculate that the pool of indicators identified in this study that are suspected as denitrifiers might be responsible for typical increase in N2O emission recorded under continuous corn in fertilized conditions (56). However, both meta-transcriptomic as well as functional studies of potential nitrification and denitrification rates yet to be performed for these systems, could shed light on the role of these microbes in the CCC system.
This study identified potential bioindicators that could represent the important soil microbial processes under N fertilization and crop rotation. These processes included decomposition, plant-microbe symbiosis, nitrification, and denitrification. The behaviors of the indicators were largely consistent with the responses of soil properties and functional microbial genes reported in the literature. Moreover, some of the indicator genera are closely associated with important soil properties, namely SOM, , available P, and especially soil pH, thereby suggesting these microbes as potential markers of microbially driven changes in these soil properties.
Overall, we identified a set of three archaea, and six fungal genera responding mainly to rotation; a set of three bacteria genera whose abundances were linked to N rates; and the set with the highest number of indicator genera from both bacteria (22) and fungal (12) taxa responded to N fertilizer additions within the CCC system. We then focused our discussion on those indicators with a known or a suspected role in the N cycle. Thus, a nitrifier archaeon Nitrososphaera, and Woesearchaeota AR15, an anaerobic denitrifier, were identified as part of the signature for continuous corn environments, decreasing in abundance with rotated management while the opposite response was recorded for the fungus Plectosphaerella, less abundant under continuous corn. Regarding fertilizer addition, bacteria of the genera Variovorax and Steroidobacter decreased in abundance once N was added to the rotations, whereas Gp22 and Nitrosospira only showed this response under continuous corn. Within the latter system as well, the addition of N fertilizer resulted in increased abundances of the bacterial and fungal denitrifiers Gp1, Denitratisoma, Dokdonella, Thermomonas, and Hypocrea.
To fully appreciate the agricultural significance and environmental impacts of these bioindicators, we urge researchers to further explore these groups of genera from our results, especially the uncultured and ecologically obscure microbes. At the same time, additional research should identify indicator microbes in other systems and regions to expand the index of bioindicators to help in further monitoring strategies of soil health restoration programs, as we move toward more sustainable management practices worldwide.
Data Availability Statement
The data have been deposited with links to BioProject accession number PRJNA771382 in the NCBI BioProject database (https://www.ncbi.nlm.nih.gov/bioproject/).
Author Contributions
MV and MZ: conceptualization. NK, MA, CR, MZ, MV, and SR-Z: methodology. MV, SR-Z, and NK: formal analysis. MV, SR-Z, and CR: resources. MV, MZ, CR, and NK: data curation. MV: visualization, writing—original draft preparation, supervision, project administration, and funding acquisition. NK, MA, and MZ: writing—review and editing. All authors have read and agreed to the published version of the manuscript.
Funding
This research was funded by awards ILLU-802-978 and AG 2018-67019-27807, both from the United States Department of Agriculture, USDA-NIFA.
Conflict of Interest
The authors declare that the research was conducted in the absence of any commercial or financial relationships that could be construed as a potential conflict of interest.
Publisher's Note
All claims expressed in this article are solely those of the authors and do not necessarily represent those of their affiliated organizations, or those of the publisher, the editors and the reviewers. Any product that may be evaluated in this article, or claim that may be made by its manufacturer, is not guaranteed or endorsed by the publisher.
Acknowledgments
We acknowledge Drs. Alvaro Hernandez and Mark Band from the Roy Carver Biotechnology Center for Functional Genomics lab at the University of Illinois at Urbana-Champaign for their assistance in creating the amplicon libraries. We are thankful to Dr. Greg Steckel, and Mr. Marty Johnson for their contribution in managing the experimental plots, and to Dr. Gevan Behnke for his assistance with soil sampling and overall lab management.
Supplementary Material
The Supplementary Material for this article can be found online at: https://www.frontiersin.org/articles/10.3389/fsoil.2021.765901/full#supplementary-material
References
1. Bender SF, Wagg C, Van Der Heijden MGA. An underground revolution: biodiversity and soil ecological engineering for agricultural sustainability. Trends Ecol Evol. (2016) 31:440–52. doi: 10.1016/j.tree.2016.02.016
3. Hirsch PR, Mauchline TH. The importance of the microbial N cycle in soil for crop plant nutrition. Adv Appl Microbiol. (2015) 93:45–71. doi: 10.1016/bs.aambs.2015.09.001
4. De Vries M, Schöler A, Ertl J, Xu Z, Schloter M. Metagenomic analyses reveal no differences in genes involved in cellulose degradation under different tillage treatments. Fems Microbiol Ecol. (2015) 91:fiv069. doi: 10.1093/femsec/fiv069
5. Hink L, Nicol GW, Prosser JI. Archaea produce lower yields of N2O than bacteria during aerobic ammonia oxidation in soil. Environ Microbiol. (2017) 19:4829–37. doi: 10.1111/1462-2920.13282
6. Hink L, Gubry-Rangin C, Nicol GW, Prosser JI. The consequences of niche and physiological differentiation of archaeal and bacterial ammonia oxidisers for nitrous oxide emissions. ISME J. (2018) 12:1084–93. doi: 10.1038/s41396-017-0025-5
7. Huang L, Riggins CW, Rodriguez-Zas S, Zabaloy MC, Villamil MB. Long-term N fertilization imbalances potential N acquisition and transformations by soil microbes. Sci Total Environ. (2019) 691:562–71. doi: 10.1016/j.scitotenv.2019.07.154
8. Behnke GD, Zabaloy MC, Riggins C, Rodriguez-Zas S, Huang L, Villamil M. Acidification in corn monocultures favor fungi, ammonia oxidizing bacteria, nirK-denitrifier groups. Sci Total Environ. (2020) 720:137514. doi: 10.1016/j.scitotenv.2020.137514
9. Kim N, Riggins CW, Rodriguez-Zas S, Zabaloy MC, Villamil MB. Long-term residue removal under tillage decreases amoA-nitrifiers and stimulates nirS- denitrifier groups in the soil. Appl Soil Ecol. (2021) 157:103730. doi: 10.1016/j.apsoil.2020.103730
10. Kim N, Zabaloy MC, Riggins CW, Rodríguez-Zas S, Villamil MB. Microbial shifts following five years of cover cropping and tillage practices in fertile agroecosystems. Microorganisms. (2020) 8:1773. doi: 10.3390/microorganisms8111773
11. Philippot L, Spor A, Hénault C, Bru D, Bizouard F, Jones CM, et al. Loss in microbial diversity affects nitrogen cycling in soil. ISME J. (2013) 7:1609–19. doi: 10.1038/ismej.2013.34
12. Dudley N, Alexander S. Agriculture and biodiversity: a review. Biodiversity. (2017) 18:45–9. doi: 10.1080/14888386.2017.1351892
13. Xun W, Liu Y, Li W, Ren Y, Xiong W, Xu Z, et al. Specialized metabolic functions of keystone taxa sustain soil microbiome stability. Microbiome. (2021) 9:35. doi: 10.1186/s40168-020-00985-9
14. Berg G, Rybakova D, Fischer D, Cernava T, Vergès MC, Charles T, et al. Microbiome definition re-visited: old concepts and new challenges. Microbiome. (2020) 8:103. doi: 10.1186/s40168-020-00875-0
15. Ding JL, Jiang X, Ma MC, Zhou BK, Guan DW, Zhao BS, et al. Effect of 35 years inorganic fertilizer and manure amendment on structure of bacterial and archaeal communities in black soil of northeast China. Appl Soil Ecol. (2016) 105:187–195. doi: 10.1016/j.apsoil.2016.04.010
16. Gentry LF, Ruffo ML, Below FE. Identifying factors controlling the continuous corn yield penalty. Agron J. (2013) 105:295–303. doi: 10.2134/agronj2012.0246
17. Daigh ALM, Dick WA, Helmers MJ, Lal R, Lauer JG, Nafziger E, et al. Yields and yield stability of no-till and chisel-plow fields in the Midwestern US Corn Belt. Field Crops Res. (2018) 218:243–53. doi: 10.1016/j.fcr.2017.04.002
18. Kladivko EJ. Residue effects on soil physical properties. In: Unger PW, editor. Managing Agricultural Residues. Boca Raton, FL: Lewis Publishers (1994). p. 123–41.
19. Zuber SM, Behnke GD, Nafziger ED, Villamil MB. Crop rotation and tillage effects on soil physical and chemical properties in Illinois. Agron J. (2015) 107:971–8. doi: 10.2134/agronj14.0465
20. Baggs EM, Stevenson M, Pihlatie M, Regar A, Cook H, Cadisch G. Nitrous oxide emissions following application of residues and fertiliser under zero and conventional tillage. Plant Soil. (2003) 254:361–70. doi: 10.1023/A:1025593121839
21. Martens DA. Management and crop residue influence soil aggregate stability. J Environ Qual. (2000) 29:723–7. doi: 10.2134/jeq2000.00472425002900030006x
22. Zuber SM, Behnke GD, Nafziger ED, Villamil MB. Multivariate assessment of soil quality indicators for crop rotation and tillage in Illinois. Soil Tillage Res. (2017) 174:147–55. doi: 10.1016/j.still.2017.07.007
23. Salvagiotti F, Specht JE, Cassman KG, Walters DT, Weiss A, Dobermann A. Growth and nitrogen fixation in high-yielding soybean: impact of nitrogen fertilization. Agron J. (2009) 101:958–70. doi: 10.2134/agronj2008.0173x
24. McDaniel MD, Grandy AS, Tiemann LK, Weintraub MN. Crop rotation complexity regulates the decomposition of high and low quality residues. Soil Biol Biochem. (2014) 78:243–54. doi: 10.1016/j.soilbio.2014.07.027
25. Ouyang Y, Evans SE, Friesen ML, Tiemann LK. Effect of nitrogen fertilization on the abundance of nitrogen cycling genes in agricultural soils: a meta-analysis of field studies. Soil Biol Biochem. (2018) 127:71–8. doi: 10.1016/j.soilbio.2018.08.024
26. Behnke GD, Kim N, Zabaloy MC, Riggins CW, Rodriguez-Zas S, Villamil MB. Soil microbial indicators within rotations and tillage systems. Microorganisms. (2021) 9:1244. doi: 10.3390/microorganisms9061244
27. Carey CJ, Dove NC, Beman JM, Hart SC, Aronson EL. Meta-analysis reveals ammonia-oxidizing bacteria respond more strongly to nitrogen addition than ammonia-oxidizing archaea. Soil Biology & Biochemistry. (2016) 99:158–66. doi: 10.1016/j.soilbio.2016.05.014
28. Petersen B, Snapp S. What is sustainable intensification? Views from experts. Land Use Policy. (2015) 46:1–10. doi: 10.1016/j.landusepol.2015.02.002
29. USDA NASS. Quick Stats, Illinois County Data, Crops. (2017). Available online at: http://quickstats.nass.usda.gov/ (accessed July 27, 2021).
30. Soil Survey Staff,. Official Soil Series Descriptions. (2019). Available online at: https://www.nrcs.usda.gov/wps/portal/nrcs/detail/soils/home/?cid=nrcs142p2_053587 (accessed September 18, 2019).
31. Illinois Climate Network, Survey, ISW, Editor. Illinois State Water Survey. Champaign, IL. (2019). Available online at: http://www.sws.uiuc.edu/warm/ (accessed August 1, 2019).
32. Fernandez FG, Hoeft RG. Managing soil pH and crop nutrients. In: Nafziger E, editor. Illinois Agronomy Handbook, Crop Science Extension and Outreach. Urbana, IL: University of Illinois (2009) 91–112.
33. Colman DR, Thomas R, Maas KR, Takacs-Vesbach CD. Detection and analysis of elusive members of a novel and diverse archaeal community within a thermal spring streamer consortium. Extremophiles. (2015) 19:307–13. doi: 10.1007/s00792-014-0715-0
34. Fierer N, Jackson JA, Vilgalys R, Jackson RB. Assessment of soil microbial community structure by use of taxon-specific quantitative PCR assays. Appl Environ Microb. (2005) 71:4117–20. doi: 10.1128/AEM.71.7.4117-4120.2005
35. Crawford JW, Deacon L, Grinev D, Harris JA, Ritz K, Singh BK, et al. Microbial diversity affects self-organization of the soil-microbe system with consequences for function. J R Soc Interface. (2012) 9:1302–10. doi: 10.1098/rsif.2011.0679
36. Hall M, Beiko RG. 16S rRNA Gene Analysis with QIIME2. Methods Mol Biol. (2018) 1849:113–29. doi: 10.1007/978-1-4939-8728-3_8
37. Bolyen E, Rideout J, Dillon M, Bokulich N, Abnet C, Al-Ghalith G, et al. Reproducible, interactive, scalable and extensible microbiome data science using QIIME 2. Nat Biotechnol. (2019) 37:852–7. doi: 10.1038/s41587-019-0209-9
38. Li X, Nair A, Wang S, Wang L. Quality control of RNA-seq experiments. In: Picardi E, editor. RNA Bioinformatics. New York, NY: Springer (2015). p. 137–46. doi: 10.1007/978-1-4939-2291-8_8
39. Callahan BJ, Mcmurdie PJ, Rosen MJ, Han AW, Johnson AJ, Holmes SP. DADA2: High resolution sample inference from amplicon data. bioRxiv. (2015) 13:024034. doi: 10.1101/024034
40. Rozewicki J, Li S, Amada KM, Standley DM, Katoh K. MAFFT-DASH: integrated protein sequence and structural alignment. Nucleic Acids Res. (2019) 47:W5–10. doi: 10.1093/nar/gkz342
41. Wang Q, Garrity GM, Tiedje JM, Cole JR. Naive Bayesian classifier for rapid assignment of rRNA sequences into the new bacterial taxonomy. Appl Environ Microbiol. (2007) 73:5261–7. doi: 10.1128/AEM.00062-07
42. Cole JR, Wang Q, Fish JA, Chai B, Mcgarrell DM, Sun Y, et al. Ribosomal database project: data and tools for high throughput rRNA analysis. Nucleic Acids Res. (2014) 42:D633–42. doi: 10.1093/nar/gkt1244
43. Gloor GB, Reid G. Compositional analysis: a valid approach to analyze microbiome high-throughput sequencing data. Can J Microbiol. (2016) 62:692–703. doi: 10.1139/cjm-2015-0821
44. Wickham H, Francois R, Henry L, Muller K. dplyr: A Grammar of Data Manipulation. R package version 1.0.5 (2021).
45. R Core Team,. R: A Language Environment for Statistical Computing. R Foundation for Statistical Computing (2021). Available online at: https://www.R-project.org/
47. Palarea-Albaladejo J, Martín-Fernández JA. zCompositions — R package for multivariate imputation of left-censored data under a compositional approach. Chemometr Intell Lab. (2015) 143:85–96. doi: 10.1016/j.chemolab.2015.02.019
48. Gloor GB, Macklaim JM, Pawlowsky-Glahn V, Egozcue JJ. Microbiome datasets are compositional: and this is not optional. Front Microbiol. (2017) 8:2224. doi: 10.3389/fmicb.2017.02224
49. Parte AC. LPSN – list of prokaryotic names with standing in nomenclature (bacterio.net), 20 years on. Int J Syst Evol Micr. (2018) 68:1825–9. doi: 10.1099/ijsem.0.002786
50. Anderson MJ. A new method for non-parametric multivariate analysis of variance. Austral Ecology. (2001) 26:32–46. doi: 10.1111/j.1442-9993.2001.01070.pp.x
51. Storey JD. The positive false discovery rate: a Bayesian interpretation and the q -value. Ann. Statist. (2003) 31:2013–35. doi: 10.1214/aos/1074290335
52. Wickham H. Ggplot2: Elegant Graphics for Data Analysis. New York, NY: Springer-Verlag (2016). doi: 10.1007/978-3-319-24277-4
53. Chamberlain LA, Bolton ML, Cox MS, Suen G, Conley SP, An é .-M. Crop rotation, but not cover crops, influenced soil bacterial community composition in a corn-soybean system in southern Wisconsin. Appl Soil Ecol. (2020) 154:103603. doi: 10.1016/j.apsoil.2020.103603
54. Ashworth AJ, Debruyn JM, Allen FL, Radosevich M, Owens PR. Microbial community structure is affected by cropping sequences and poultry litter under long-term no-tillage. Soil Biol Biochem. (2017) 114:210–9. doi: 10.1016/j.soilbio.2017.07.019
55. Hoss M, Behnke GD, Davis AS, Nafziger ED, Villamil MB. Short corn rotations do not improve soil quality, compared with corn monocultures. Agron J. (2018) 110:1274–88. doi: 10.2134/agronj2017.11.0633
56. Behnke GD, Pittelkow CM, Nafziger ED, Villamil MB. Exploring the relationships between greenhouse gas emissions, yields, and soil properties in cropping systems. Agric Basel. (2018) 8:62. doi: 10.3390/agriculture8050062
57. Yang K, Zhu JJ, Gu JC, Yu LZ, Wang ZQ. Changes in soil phosphorus fractions after 9 years of continuous nitrogen addition in a larix gmelinii plantation. Ann For Sci. (2015) 72:435–42. doi: 10.1007/s13595-014-0444-7
58. Kerou M, Schleper C. Nitrososphaera. Hoboken, NJ: John Wiley & Sons, Inc (2016). doi: 10.1002/9781118960608.gbm01294
59. Zhalnina K, De Quadros P, Gano K, Davis-Richardson A, Fagen J, Brown C, et al. Ca nitrososphaera and bradyrhizobium are inversely correlated and related to agricultural practices in long-term field experiments. Front Microbiol. (2013) 4:104. doi: 10.3389/fmicb.2013.00104
60. Ai C, Liang G, Sun J, Wang X, He P, Zhou W. Different roles of rhizosphere effect and long-term fertilization in the activity and community structure of ammonia oxidizers in a calcareous fluvo-aquic soil. Soil Biol Biochem. (2013) 57:30–42. doi: 10.1016/j.soilbio.2012.08.003
61. Wessén E, Hallin S, Philippot L. Differential responses of bacterial and archaeal groups at high taxonomical ranks to soil management. Soil Biol Biochem. (2010) 42:1759–65. doi: 10.1016/j.soilbio.2010.06.013
62. Castelle CJ, Wrighton KC, Thomas BC, Hug LA, Brown CT, Wilkins MJ, et al. Genomic expansion of domain archaea highlights roles for organisms from new phyla in anaerobic carbon cycling. Curr Biol. (2015) 25:690–701. doi: 10.1016/j.cub.2015.01.014
63. Liu X, Li M, Castelle CJ, Probst AJ, Zhou Z, Pan J, et al. Insights into the ecology, evolution, and metabolism of the widespread woesearchaeotal lineages. Microbiome. (2018) 6:102. doi: 10.1186/s40168-018-0488-2
64. Liu X, Wang Y, Gu JD. Ecological distribution and potential roles of Woesearchaeota in anaerobic biogeochemical cycling unveiled by genomic analysis. Comput Struct Biotec. (2021) 19:794–800. doi: 10.1016/j.csbj.2021.01.013
65. Kersters K, De Vos P, Gillis M, Swings J. Proteobacteria. In: Encyclopedia of Life Sciences (eLS). John Wiley & Sons, Ltd. (2006). doi: 10.1038/npg.els.0004312
66. Navarrete AA, Venturini AM, Meyer KM, Klein AM, Tiedje JM, Bohannan BJM, et al. Differential response of acidobacteria subgroups to forest-to-pasture conversion and their biogeographic patterns in the western brazilian amazon. Front Microbiol. (2015) 6:1443. doi: 10.3389/fmicb.2015.01443
67. Kielak AM, Barreto CC, Kowalchuk GA, Van Veen JA, Kuramae EE. The ecology of acidobacteria: moving beyond genes and genomes. Front Microbiol. (2016) 7:744. doi: 10.3389/fmicb.2016.00744
68. Zhang Q, Gong M, Yuan J, Hou Y, Zhang H, Wang Y, et al. Dark septate endophyte improves drought tolerance in sorghum. Int J Agric Biol. (2017) 19:53–60. doi: 10.17957/IJAB/15.0241
69. Singh R, Dubey AK. Diversity and applications of endophytic actinobacteria of plants in special and other ecological niches. Front Microbiol. (2018) 9:1767. doi: 10.3389/fmicb.2018.01767
70. Ivanova AA, Zhelezova AD, Chernov TI, Dedysh SN. Linking ecology and systematics of acidobacteria: distinct habitat preferences of the acidobacteriia and blastocatellia in tundra soils. PLoS ONE. (2020) 15:e0230157. doi: 10.1371/journal.pone.0230157
71. Kalam S, Basu A, Ahmad I, Sayyed RZ, El-Enshasy HA, Dailin DJ, et al. Recent understanding of soil acidobacteria and their ecological significance: a critical review. Front Microbiol. (2020) 11:580024. doi: 10.3389/fmicb.2020.580024
72. Banerjee S, Schlaeppi K, Van Der Heijden MGA. Keystone taxa as drivers of microbiome structure and functioning. Nat Rev Microbiol. (2018) 16:567–76. doi: 10.1038/s41579-018-0024-1
73. Huang MJ, Rao MPN, Salam N, Xiao M, Huang HQ, Li WJ. Allostreptomyces psammosilenae gen. nov., sp. nov., an endophytic actinobacterium isolated from the roots of Psammosilene tunicoides and emended description of the family Streptomycetaceae [Waksman and Henrici (1943)AL] emend. Rainey et al. (2017) 1997: emend. Kim et al. 2003, emend. Zhi et al. 2009. Int J Syst Evol Microbiol. (2017) 67:288–93. doi: 10.1099/ijsem.0.001617
74. Foesel BU, Geppert A, Rohde M, Overmann J. Parviterribacter kavangonensis gen. nov., sp. nov. and Parviterribacter multiflagellatus sp. nov., novel members of Parviterribacteraceae fam. nov. within the order Solirubrobacterales, and emended descriptions of the classes Thermoleophilia and Rubrobacteria and their orders and families. Int J Syst Evol Micr. (2016) 66:652–65. doi: 10.1099/ijsem.0.000770
75. Podosokorskaya OA, Bonch-Osmolovskaya EA, Novikov AA, Kolganova TV, Kublanov IV. Ornatilinea apprima gen. nov., sp. nov., a cellulolytic representative of the class Anaerolineae. Int J Syst Evol Micr. (2013) 63:86–92. doi: 10.1099/ijs.0.041012-0
76. Slobodkina GB, Baslerov RV, Novikov AA, Bonch-Osmolovskaya EA, Slobodkin AI. Thermodesulfitimonas autotrophica gen. nov., sp. nov., a thermophilic, obligate sulfite-reducing bacterium isolated from a terrestrial hot spring. Int J Syst Evol Micr. (2017) 67:301–5. doi: 10.1099/ijsem.0.001619
77. Yoon J, Jang JH, Kasai H. Algisphaera agarilytica gen. nov., sp. nov., a novel representative of the class Phycisphaerae within the phylum Planctomycetes isolated from a marine alga. Antonie van Leeuwenhoek. (2014) 105:317–24. doi: 10.1007/s10482-013-0076-1
78. Proença DN, Whitman WB, Varghese N, Shapiro N, Woyke T, Kyrpides NC, et al. Arboriscoccus pini gen. nov., sp. nov., an endophyte from a pine tree of the class Alphaproteobacteria, emended description of Geminicoccus roseus, and proposal of Geminicoccaceae fam. nov. Syst Appl Microbiol. (2018) 41:94–100. doi: 10.1016/j.syapm.2017.11.006
79. Xue C, Zhang X, Zhu C, Zhao J, Zhu P, Peng C, et al. Quantitative and compositional responses of ammonia-oxidizing archaea and bacteria to long-term field fertilization. Sci Rep. (2016) 6:28981. doi: 10.1038/srep28981
80. Pereira E Silva MC, Poly F, Guillaumaud N, Van Elsas JD, Falcão Salles J. Fluctuations in ammonia oxidizing communities across agricultural soils are driven by soil structure and pH. Front Microbiol. (2012) 3:77. doi: 10.3389/fmicb.2012.00077
81. DeBruyn JM, Nixon LT, Fawaz MN, Johnson AM, Radosevich M. Global biogeography and quantitative seasonal dynamics of gemmatimonadetes in soil. Appl Environ Microbiol. (2011) 77:6295–300. doi: 10.1128/AEM.05005-11
82. Pascual J, Foesel BU, Geppert A, Huber KJ, Boedeker C, Luckner M, et al. Roseisolibacter agri gen. nov., sp. nov., a novel slow-growing member of the under-represented phylum Gemmatimonadetes. Int J Syst Evol Micr. (2018) 68:1028–36. doi: 10.1099/ijsem.0.002619
83. Bräuer S, Harbison A, Ueki A. Micropepsales. In: Trujillo ME, Dedysh S, Devos P, Hedlund B, Kämpfer P, Rainey FA, Whitman WB, editors. Bergey's Manual of Systematics of Archaea and Bacteria. John Wiley & Sons, Inc., in association with Bergey's Manual Trust (2018). doi: 10.1002/9781118960608.obm00146
84. Kämpfer P, Young C-C, Arun AB, Shen F-T, Jäckel U, Rosselló-Mora R, et al. Pseudolabrys taiwanensis gen. nov., sp. nov., an alphaproteobacterium isolated from soil. Int J Syst Evol Micr. (2006) 56:2469–2472. doi: 10.1099/ijs.0.64124-0
85. Imhoff JF, Hiraishi A. Aerobic bacteria containing bacteriochlorophyll and belonging to the alphaproteobacteria. In: Trujillo ME, Dedysh S, Devos P, Hedlund B, Kämpfer P, Rainey FA, Whitman WB, editors. Bergey's Manual of Systematics of Archaea and Bacteria John Wiley & Sons, Inc., in association with Bergey's Manual Trust (2015) 1–7. doi: 10.1002/9781118960608.bm00001
86. Hördt A, López MG, Meier-Kolthoff JP, Schleuning M, Weinhold LM, Tindall BJ, et al. Analysis of 1,000+ type-strain genomes substantially improves taxonomic classification of alphaproteobacteria. Front Microbiol. (2020) 11:468. doi: 10.3389/fmicb.2020.00468
87. Fahrbach M, Kuever J, Meinke R, Kämpfer P, Hollender J. Denitratisoma oestradiolicum gen. nov., sp. nov., a 17beta-oestradiol-degrading, denitrifying betaproteobacterium. Int J Syst Evol Microbiol. (2006) 56:1547–52. doi: 10.1099/ijs.0.63672-0
88. Yoo SH, Weon HY, Anandham R, Kim BY, Hong SB, Jeon YA, et al. Dokdonella soli sp. nov., a gammaproteobacterium isolated from soil. Int J Syst Evol Micr. (2009) 59:1965–8. doi: 10.1099/ijs.0.005348-0
89. Wolińska A, Kuzniar A, Zielenkiewicz U, Banach A, Błaszczyk M. Indicators of arable soils fatigue – bacterial families and genera: a metagenomic approach. Ecol Indicat. (2018) 93:490–500. doi: 10.1016/j.ecolind.2018.05.033
90. Wang L, Zheng S, Wang D, Wang L, Wang G. Thermomonas carbonis sp. nov., isolated from the soil of a coal mine. Int J Syst Evol Micr. (2014) 64:3631–5. doi: 10.1099/ijs.0.063800-0
91. Mergaert J, Cnockaert MC, Swings J. Thermomonas fusca sp. nov. and Thermomonas brevis sp. nov., two mesophilic species isolated from a denitrification reactor with poly(ε-caprolactone) plastic granules as fixed bed, and emended description of the genus Thermomonas. Int J Syst Evol Micr. (2003) 53:1961–6. doi: 10.1099/ijs.0.02684-0
92. Im WT, Liu QM, Lee KJ, Kim SY, Lee ST, Yi TH. Variovorax ginsengisoli sp. nov., a denitrifying bacterium isolated from soil of a ginseng field. Int J Syst Evol Micro. (2010) 60:1565–9. doi: 10.1099/ijs.0.014514-0
93. Fahrbach M, Kuever J, Remesch M, Huber BE, Kämpfer P, Dott W, et al. Steroidobacter denitrificans gen. nov., sp. nov., a steroidal hormone-degrading gammaproteobacterium. Int J Syst Evol Micro. (2008) 58:2215–23. doi: 10.1099/ijs.0.65342-0
94. Galazka A, Grzadziel J. Fungal genetics and functional diversity of microbial communities in the soil under long-term monoculture of maize using different cultivation techniques. Front Microbiol. (2018) 9:76. doi: 10.3389/fmicb.2018.00076
95. Wang QF, Ma MC, Jiang X, Guan DW, Wei D, Zhao BS, et al. Impact of 36 years of nitrogen fertilization on microbial community composition and soil carbon cycling-related enzyme activities in rhizospheres and bulk soils in northeast China. Appl Soil Ecol. (2019) 136:148–57. doi: 10.1016/j.apsoil.2018.12.019
96. Wang Q, Ma M, Jiang X, Zhou B, Guan D, Cao F, et al. Long-term N fertilization altered 13C-labeled fungal community composition but not diversity in wheat rhizosphere of Chinese black soil. Soil Biol Biochem. (2019) 135:117–26. doi: 10.1016/j.soilbio.2019.04.009
97. Rice AV, Currah RS. Two new species of pseudogymnoascus with geomyces anamorphs and their phylogenetic relationship with gymnostellatospora. Mycologia. (2006) 98:307–18. doi: 10.1080/15572536.2006.11832703
98. Marmeisse R, Girlanda M. 10 mycorrhizal fungi and the soil carbon and nutrient cycling. In: Druzhinina IS, Kubicek CP, editors. Environmental and Microbial Relationships. Cham: Springer International Publishing (2016). p. 189–203. doi: 10.1007/978-3-319-29532-9_10
99. Benjamin RK, Blackwell M, Chapela IH, Humber RA, Jones KG, Klepzig KD, et al. 18 - insect- and other arthropod-associated fungi. In: Mueller Gm, Bills GF, Foster MS, editors. Biodiversity of Fungi. Burlington: Academic Press (2004). p. 395–433. doi: 10.1016/B978-012509551-8/50021-0
100. Samerpitak K, Van Der Linde E, Choi HJ, Gerrits Van Den Ende AHG, Machouart M, Gueidan C, et al. Taxonomy of ochroconis, genus including opportunistic pathogens on humans and animals. Fungal Divers. (2014) 65:89–126. doi: 10.1007/s13225-013-0253-6
101. Huhndorf SM, Miller AN, Fernández FA. Molecular systematics of the sordariales: the order and the family lasiosphaeriaceae redefined. Mycologia. (2004) 96:368–87. doi: 10.2307/3762068
102. Teasdale SE, Beulke AK, Guy PL, Orlovich DA. Environmental barcoding of the ectomycorrhizal fungal genus cortinarius. Fungal Divers. (2013) 58:299–310. doi: 10.1007/s13225-012-0218-1
103. Li T, Liu MJ, Zhang XT, Zhang HB, Sha T, Zhao ZW. Improved tolerance of maize (Zea mays L.) to heavy metals by colonization of a dark septate endophyte (DSE) Exophiala pisciphila. Sci Total Environ. (2011) 409:1069–74. doi: 10.1016/j.scitotenv.2010.12.012
104. Carris LM, Glawe DA, Smyth CA, Edwards DI. Fungi associated with populations of heterodera glycines in two illinois soybean fields. Mycologia. (1989) 81:66–75. doi: 10.2307/3759452
105. Hu W, Strom N, Haarith D, Chen S, Bushley KE. Mycobiome of cysts of the soybean cyst nematode under long term crop rotation. Front Microbiol. (2018) 29:386. doi: 10.3389/fmicb.2018.00386
106. Kredics L, Hatvani L, Naeimi S, Körmöczi P, Manczinger L, Vágvölgyi C, et al. Chapter 1 - biodiversity of the genus hypocrea/trichoderma in different habitats. In: Gupta VK, Schmoll M, Herrera-Estrella A, Upadhyay RS, Druzhinina I, Tuohy MG, editors. Biotechnology and Biology of Trichoderma. Amsterdam: Elsevier (2014). p. 3–24. doi: 10.1016/B978-0-444-59576-8.00001-1
107. Chen H, Yu F, Shi W. Detection of N2O-producing fungi in environment using nitrite reductase gene (nirK)-targeting primers. Fungal Biol. (2016) 120:1479–92. doi: 10.1016/j.funbio.2016.07.012
108. Ibrahim SRM, Altyar AE, Mohamed SGA, Mohamed GA. Genus thielavia: phytochemicals, industrial importance and biological relevance. Nat Product Res. (2021) 1–16. doi: 10.1080/14786419.2021.1919105
109. Ibrahim SRM, Mohamed SGA, Altyar AE, Mohamed GA. Natural products of the fungal genus humicola: diversity, biological activity, industrial importance. Curr Microbiol. (2021) 78:2488–509. doi: 10.1007/s00284-021-02533-6
110. Letcher PM, Powell MJ, Chambers JG, Holznagel WE. Phylogenetic relationships among rhizophydium isolates from North America and Australia. Mycologia. (2004) 96:1339–51. doi: 10.2307/3762150
111. Farr DF, Rossman, AY,. Fungal Databases, U.S. National Fungus Collections, ARS. USDA (2021). Available online at: https://nt.ars-grin.gov/fungaldatabases/ (accessed July 23, 2021).
112. Bahram M, Hildebrand F, Forslund SK, Anderson JL, Soudzilovskaia NA, Bodegom PM, et al. Structure and function of the global topsoil microbiome. Nature. (2018) 560:233–7. doi: 10.1038/s41586-018-0386-6
113. Mothapo N, Chen H, Cubeta MA, Grossman JM, Fuller F, Shi W. Phylogenetic, taxonomic and functional diversity of fungal denitrifiers and associated N2O production efficacy. Soil Biol Biochem. (2015) 83:160–75. doi: 10.1016/j.soilbio.2015.02.001
Keywords: archaea, bacteria, fungi, nitrogen, maize, soybean, monoculture, rotation
Citation: Villamil MB, Kim N, Riggins CW, Zabaloy MC, Allegrini M and Rodríguez-Zas SL (2021) Microbial Signatures in Fertile Soils Under Long-Term N Management. Front. Soil Sci. 1:765901. doi: 10.3389/fsoil.2021.765901
Received: 27 August 2021; Accepted: 10 November 2021;
Published: 02 December 2021.
Edited by:
Patricia Dorr De Quadros, University of Waterloo, CanadaReviewed by:
Durgesh Kumar Jaiswal, Savitribai Phule Pune University, IndiaRodrigo Gouvea Taketani, Rothamsted Research, United Kingdom
Copyright © 2021 Villamil, Kim, Riggins, Zabaloy, Allegrini and Rodríguez-Zas. This is an open-access article distributed under the terms of the Creative Commons Attribution License (CC BY). The use, distribution or reproduction in other forums is permitted, provided the original author(s) and the copyright owner(s) are credited and that the original publication in this journal is cited, in accordance with accepted academic practice. No use, distribution or reproduction is permitted which does not comply with these terms.
*Correspondence: María B. Villamil, villamil@illinois.edu