Simulation of the Optimum Planting Windows for Early and Intermediate-Maturing Maize Varieties in the Nigerian Savannas Using the APSIM Model
 Aloysius Beah1,2
  Alpha Yaya Kamara2* Jibrin Mohamed Jibrin1
  Folorunso Mathew Akinseye3
  Abdullahi Ibrahim Tofa2 Temitope Damian Ademulegun2
- 1Centre for Dryland Agriculture, Bayero University, Kano, Nigeria
- 2International Institute of Tropical Agriculture (IITA), Ibadan, Nigeria
- 3International Crops Research Institute for the Semi-Arid Tropics (ICRISAT), Kano, Nigeria
The Agricultural Production Systems Simulator (APSIM) model was calibrated and validated and used to identify the optimum planting windows for two contrasting maize varieties for three agro-ecologies in the Nigeria savannas. The model was run for 11 planting windows starting from June 1 and repeated every 7 days until 16 August using long-term historical weather data from the 7 selected sites representing three agro-ecological zones (AEZs). The evaluation with the experimental data showed that the model performance was reasonable and accurately predict crop phenology, total dry matter (TDM) and grain yield for both maize varieties. The seasonal planting date analysis showed that optimum planting windows for 2009EVDT and IWDC2SynF2 depend on the variety, agro-ecozones and sites. Planting from June 15 to 28 simulated the highest mean grain yield for both varieties in all the agro-ecologies. In the Southern Guinea savanna (SGS) where the length of growing season is 180–210 days, the best planting window was June 8–July 19 for 2009EVDT and June 8–July 26 for IWDC2SynF2 in Abuja. The planting window that gives attainable yield at Yelwa, is June 15–July 5 for 2009EVDT and June 8–28 for IWDC2SynF2. In the Northern Guinea savannah (NGS) where the length of growing season is 150–180 days, the optimum planting window is June 15–July 19 for both varieties at Zaria and June 8–July 19 for 2009EVDT and June 8–August 2 for IWDC2SynF2 at Sabon Gari. In the Sudan savannah (SS) where the growing season is 90–120 days, planting of 2009EVDT can be delayed up to the third week of July. For the medium-maturing variety, IWDC2SynF2, planting should be done by the first week of July. Though Yelwa is in the SGS, lower yields and narrower sowing windows were simulated for both varieties than for those of the other locations. This is probably due to the poor soil fertility in this location.
Introduction
Maize (Zea mays L.) is a principal food security and a major commercial crop in Nigeria providing food, animal feed, and industrial raw materials (Badu-Apraku et al., 2009). Significant increase has been witnessed in its production in the past three decades in the savannas of Nigeria, even in the semi-arid Sudan Savanna (SS) zone where rainfall is erratic (Kamara et al., 2009; FAOSTAT, 2017). Despite the increase in production, maize yields in Nigeria have remained low over the last decades hovering around 1.8–2 t ha−1 (FAOSTAT, 2018). This is far less than the yield of about 7–8 t ha−1 observed in research fields (Shehu et al., 2019).
Poor soils (Jibrin et al., 2012), frequent droughts (Kamara et al., 2009), and pest and disease (Badu-Apraku et al., 2009) limit maize production. Drought and rainfall variability due to climate change are the major threats to maize production in the Nigeria savannas (Kamara et al., 2009; Ayanlad et al., 2018). Uncertainties due to changing weather patterns are making rain-fed agricultural production to become more variable and riskier to farmers. The onset and end of rainy season vary, making it difficult for farmers to take decision about planting (Odekunle, 2004; Tofa et al., 2020). Most farmers normally plant maize when the rains are perceived to be persistent and this activity is also influenced by labor availability (Jagtap and Abamu, 2003). In most cases farmers usually plant with the first rains in order to capture the flush of soil N that comes with the first rains (Sachs et al., 2010). Delay in onset of the rainy season leading to total crop failure has been consistently reported in many areas of West and Central Africa (Graef and Haigis, 2001; Marteau et al., 2011). Long dry spells at the beginning, mid and end of the rainy season are also becoming more frequent even in the wetter southern and Northern Guinea savannas (NGS) (Adnan et al., 2017). In this situation farmers' decision to plant is associated with risks of crop failure. For example, if the rain stops after farmers plant their crops, they would have to replant, thereby increasing cost spent on seeds otherwise they might encounter complete crop failure or low yields (Jibrin et al., 2012). The perception in northern Nigeria is that maize should be planted around late June to early July, to avoid pollination stage occurring during possible drought stress toward the end of the season (Kamara et al., 2009). Planting during this period carries the risk of intermittent drought and poor crop establishment in the SS zone (Kamara et al., 2009). Decision about date of planting is important to minimize low crop establishment and ultimately avoid the extra cost of seed and labor required for replanting in the semi-arid regions (Santos et al., 2017). More importantly, the response of maize varieties to other inputs such as fertilizer is dependent upon planting time (Iken and Amusa, 2014). Therefore, selecting an appropriate planting window will enhance efficient nutrient uptake and utilization and hence increase crop yield.
Some field experimental studies have suggested that improved crop management practices such as the selection of optimum planting window could improve maize yields by avoiding moisture stress at the critical growth stages in the Nigerian savannas (Kamara et al., 2009; Iken and Amusa, 2014). For example, Iken and Amusa (2014) reported last week in April to third week in May as the optimum planting date for the Southern Guinea Savanna and last week in May to first 2 weeks in June for the SS. Kamara et al. (2009) reported that extra-early maturing maize varieties should be planted in the SS between the last week of June and the first week of July to reduce risk of drought stress.
The International Institute of Tropical Agriculture (IITA) has in collaboration with national partners developed and deployed intermediate and early maturing drought-tolerant maize varieties in the Nigeria savannas. These drought-tolerant varieties have been promoted in the Nigeria savannas to help farmers adapt to drought and climate variability (Jibrin et al., 2012; Adnan et al., 2017; Tofa et al., 2020). Information on the optimum sowing dates across Nigeria for these varieties is limited. Where available the results of these evaluations are largely site-specific and have only been evaluated in a few locations. Therefore, the results obtained cannot be extrapolated to other sites.
If well calibrated and validated, the use of crop simulation models will provide opportunity for large-scale testing of agricultural technologies in the savanna agro-ecologies including planting windows (Adnan et al., 2017). For example, using the CERES-Maize model, Jibrin et al. (2012) simulated late June to early July as the optimum planting window for the early-maturing varieties in the SS region of Nigeria. Using the same model, Adnan et al. (2017) simulated late July for extra early maize varieties and mid-June for early maturing maize as optimum planting window for the Sudan Savanna zone. In the Northern Guinea Savanna planting extra-early maturing maize in mid-July and early maturing maize in late July produced the highest grain yields. Using the CERES–Maize model, Tofa et al. (2020) showed that sowing the intermediate maize varieties from early to mid-June produced the highest grain yields in the Sudan savanna. In the northern Guinea savanna, sowing from late June to late July produced the highest yields. In the Southern Guinea savanna, the optimum sowing window was early June to late July for the variety SAMMAZ-15 and mid-June to late-July for SAMMAZ-16. Akinseye et al. (2020) used the APSIM model to understand the response of sorghum varieties to nitrogen applications in the semi-arid Nigeria. The results show that the model replicated the observed yield accounting for yield differences and variations in phenological development between two sorghum varieties. For the two varieties, optimum grain yield was simulated at 60 kg N ha−1 in the Sudano-Sahelian zone, 80 kg N ha−1 in the Sudan savanna zone and 40 kg ha−1 in the Northern Guinea savanna.
To the authors knowledge APSIM has only been evaluated for predicting performance of sorghum varieties in the Nigeria savannas. The reported planting dates using seasonal analysis of CERES-maize model in Decision Support System for Agricultural Technology Transfer (DSSAT) in Nigeria mostly considered locations in northwest Nigeria where the soils and climate conditions are different from that elsewhere in the Nigerian savannas (Adnan et al., 2017; Tofa et al., 2020). In view of this, the current study was carried out to evaluate the performance of the APSIM model for simulating growth and yield of early and intermediate drought-tolerant varieties and to determine optimum sowing dates for these varieties under rain-fed conditions in the selected sites across the savannas of central, northeast and northwest Nigeria.
Materials and Methods
Experiments for Model Calibration and Evaluation
Experiments were conducted to collect data for the calibration and evaluation of the APSIM-maize model. For model calibration, nine experiments were conducted in three locations during the 2017 and 2018 cropping season across three sites in the southern Guinea savanna, northern Guinea savanna, and Sudan savannas of Nigeria. The experiments were conducted in the raining season (June–October) at Bayero University, Kano agricultural research farm (11°59′N8°25′E 466 m a.s.l.), Audu Bako College of Agriculture Danbatta (12°19′N8°31′E 504 m a.s.l.) in the Sudan savanna (SS) and the Institute of Agricultural Research (IAR) irrigation farm at Kurmin Bomo, Zaria (11°1′N7°37′E 681 m a.s.l.) in the northern Guinea savanna (NGS). In 2017 one experiment was conducted in each location making a total of three experiments. In 2018, two experiments were conducted in each location on different dates to make a total of six experiments. Each experiment was replicated three times to make a total of 27 replication across years and locations. In each experiment, two maize varieties, 2009EVDT and IWDC2SynF2 were laid out in a randomized complete block design (RCBD) with three replications. The variety 2009EVDT is an early maturing variety (matures between 90 and 95 days) and yields up to 3,000 kg ha−1 whereas IWDC2SYNF2 is a medium maturing variety (matures between 100 and 110 days) and yields up to 4,000 kg ha−1 (Badu-Apraku personal communication). These experiments were conducted under optimum management practices to avoid stresses from water, nutrients, pests, and diseases.
The experiments for model evaluation were conducted at the IITA research station in Abuja; (9°9′N7°20′E 447 m a.s.l.) in the southern Guinea savanna zone (SGS) and the IAR farm Ahmadu Bello University, Zaria (11°11′N7°38′E 686 m a.s.l.) in the NGS during the 2016 and 2017 cropping seasons. A split-plot design with three replications was used for each experimental field. Five nitrogen rates (0, 30, 60, 90, and 120 kg N ha−1) formed the main plot and the two maize varieties used in the calibration experiment were assigned to the subplots. Each subplot measured 3 × 5 m (15 m2) containing four rows of 0.75 m apart and 5 m in length with intra row spacing of 0.25 m between stands which gave a plant population of 53,333 plants ha−1. Phosphorus (P) and potassium (K) were applied at planting; P was applied using single super phosphate (SSP) while K was applied using muriate of potash (MOP) at the rate of 60 kg ha−1 for each nutrient and this was applied to all plots including the control plots. The five rates of N fertilizer were applied in form of urea. One half of each rate was applied one week after sowing (WAP) and the remaining half at five WAP.
Soils and Weather Data
A detailed soil characterization and profiling was done at each experimental site and at the sites selected for seasonal analysis. The soil samples were collected from profile horizons and were analyzed for physio-chemical properties. Specific soil characteristics in each location were determined according to the analytical procedures of IITA (1989). Total organic carbon (total C) was measured using modified Walkley-Black chromic wet chemical oxidation and spectrophotometric method (Heanes, 1984). Total nitrogen (total N) was determined using micro-Kjeldahl digestion method (Bremner, 1996). Soil pH in water was measured using glass electrode pH meter and particle size distribution using hydrometer method (Gee and Or, 2002). Available Phosphorus (avail. P), available Sulfur (avail. S), exchangeable cations (K, Ca, Mg, and Na) and micronutrients (Zn, Fe, Cu, Mn, and B) were analyzed based on Mehlich 3 extraction procedure (Mehlich, 1984) and reading with inductively-coupled plasma optical emission spectroscopy (ICP-OES). Exchangeable acidity (H+ + Al3+) was determined by shaking soil with 1N KCl and titration with 0.5N NaOH (Anderson and Ingram, 1993). Effective cation exchange capacity (ECEC) was calculated as the summation of exchangeable cations (K, Ca, Mg, and Na) and exchangeable acidity (H+ + Al3+). Soil water characteristics such as lower limit, (LL), drain upper limit (DUL), and saturated water content (SAT) were derived from pedo-transfer functions developed by Saxton and Rawls (2006). The generic horizons of the profiles and soil types were classified using the FAO guidelines (FAO, 2006).
Weather information on daily rainfall, minimum and maximum temperature, and solar radiation, representing daily weather conditions were monitored at each experimental site using automatic weather station (WatchDog 2000 Series, manufactured by Spectrum Technologies Inc., USA) installed close to experimental sites for model calibration and evaluation. For the long-term simulation of maize response to planting date, a 31-year weather data (1985–2015) were also obtained from the Nigeria Meteorological Agency (NIMET) for Abuja in the Federal Capital Territory, Kano in Kano State, and Zaria in Kaduna State. For Balbayo in Borno State, Sabon Gari in Adamawa State savanna, and Yelwa-Jambore in Adamawa State the 31 year's records of daily precipitation were sourced from downscaled CHIRPS rainfall at 5.5 km resolution (Funk et al., 2015), then merged with data (daily minimum and maximum temperatures, and daily solar radiation) from National Aeronautics and Space Administration (NASA) database for Climatology Resource for Agro-climatology (http://power.larc.nasa.gov/). R scripts were developed to append CHIRPS and NASA power data together. The raw data were inputted into APSIM 7.9 met file and was arranged according to name of the location, latitude, years, days, rainfall (mm), minimum and maximum temperature (°C), reference evapotranspiration (mm d−1), solar radiation (MJ m−2), the annual average ambient temperature (TAV), and the annual amplitude in monthly temperature (AMP) where it was checked for errors before use.
Plant Measurements
Number of days to 50% pollen shed (anthesis date) and days to 95% physiological maturity were determined from plants in the two middle rows of each plot. Leaf area index (LAI) was measured at R2 stage using AccuPAR model LP-80 PAR/LAI Ceptometer (Decagon Devices, Pullman, WA). At maturity, all the plant in a 1 m2 quadrat placed across the two-middle row were harvested, divided into leaves, stems, and grain for dry matter determination. Grain yield was determined by harvesting the remaining plants from the two middle rows, the cobs were shelled, oven dried and weighed. The grains were added to those in the quadrant area and final grain yield was calculated in kg ha−1, adjusted to 12% moisture content using a Dickey-John moisture tester (Model 14998, Dickey-John Corporation, Auburn, AL).
APSIM Model Description
The Agricultural Production Systems Simulator (APSIM) is a farming systems model that consists of several modules that are integrated to perform farming systems simulation based on environmental variables (Holzworth et al., 2014). The APSIM modeling structure includes biophysical modules, management modules, data input and output modules, and a simulation engine module (Keating et al., 2003). In APSIM, any module can be added by the user when needed and removed when no longer needed as described in Kirschbaum et al. (2001). Several modules and sub-modules developed by many different researchers have been integrated into the APSIM framework for farm system analysis. The APSIM simulates yield in response to inputs of daily weather, crop, soil, and management practices (Keating et al., 2003). Soil hydraulic characteristics in the model are specified by the drained upper limit (DUL), lower limit of plant extractable water (LL15), and saturated water content (SAT). Soil water content measurements before sowing defined the initial soil water content of the soil. The APSIM model utilizes information on daily climate data (solar radiation, rainfall, minimum and maximum temperature), crop genetic information, soil physical (such as field capacity, wilting point, bulk density, and saturated soil water content) and chemical (such as soil OC, pH, nitrate, and labile P) characteristics and crop management data such as details on planting (date, depth, density, etc.) and fertilization (dates, quantities, type of fertilizer, type of placement, and depth) to simulate plant growth and yield. The model uses two soil water balance approaches described by either SoilWat (a “cascading bucket” approach) or APSWIM (Richards' equation approach) (Kirschbaum et al., 2001). The soil water module (soilwat2) utilizes the cascading soil water balance model (Keating et al., 2003) which works on a daily time step basis to simulate water balance. Soil water varies between lower limit (ll) and the saturated upper limit (SAT). Excess water above the upper limit drains to the next lower layer. It is specified by the field capacity (dul), lower limit (ll) of extractable water and the saturated water content of the soil (sat). The bare soil runoff curve number (cn2_bare) determines the proportion of rainfall that infiltrates and how much is lost through surface runoff. Soil evaporation is assumed to take place in two stages (i) constant and the falling rate stages. Further details on the APSIM model are provided by Keating et al. (2003).
Model Calibration Procedure
The maize module was calibrated within the APSIM v.7.9 framework for the two maize varieties calibration was done to adjust some of the parameters and functions of the model so that predicted values are the same or at least very close to data obtained from field experiment. For this study, five in-built modules which include maize crop module (APSIM-maize), soil water module (SoilWat), soil nitrogen module (Soiln), residue module (Residue), and the manure module (manure) were used accordingly. During the calibration set up, the planting density was set to 5.3 plants m−2 indicating the plant population; planting dates were set based on the dates of establishment of each experiment, nitrogen was set to 120 kg ha−1 and all other management conditions were considered nearly optimal, with the general assumption that there was no disease prevalence. The calibration of the crop characteristics was conducted for phenology first and then for yield. Since, the varieties used in this have not been incorporated into the model; varieties of the same maturity period within the APSIM-maize model were selected, to derive the new genetic coefficients. The parameter set selected were cultivar code B105, an early maturing hybrid and hybrid B110 an intermediate maturing generic cultivar as reference cultivars which best represented the general characteristics (days to anthesis, days to physiological maturity, and yield) of the experimental maize (2009EVDT and IWDC2SynF2) varieties, respectively.
The coefficients that influence maize phenological development; duration from emergence to end of juvenile (tt_emerg_to_endjuv) and duration from flowering to maturity (tt_flower_to_maturity) were adjusted based on the phenological data collected. Similarly, the coefficients grain maximum number per head (head_grain_no_max) and duration from flowering to start of grain filling (tt_flower_to_start_grain) was used to adjust for grain yield. Calibration was carried out first by adjusting each phenological characters (emergence to end of juvenile, flowering to maturity etc.) and then followed by adjusting the growth and yield characters (grain growth rate, grain number, etc.) based on available measured or estimated data. After several iterations of adjustments, calibration was completed when the reference cultivar (base cultivar) satisfactorily reproduced the behavior of the cultivars of interest.
Model Validation With an Independent Datasets
The calibrated cultivar-specific coefficient was further validated using an independent data obtained from nitrogen trials described above. This was done to confirm if the predicted or simulated results adequately represent or mimic the real life situation. Using the genetic coefficients obtained for the two varieties, a simulation tree was set up to evaluate the model under varying nitrogen applications rates (0, 30, 60, 90, and 120 kg N ha−1). Management information (date of sowing, established plant population, dates and amounts of fertilizer application) was also inputted. The soil or crop residue variables were reset during the simulation, thus testing the ability of the model to simulate changes of soil water and nitrogen over the cropping seasons. The model was run to compare the observed parameters with simulated output. The parameters evaluated include: days to anthesis, days to physiological maturity, LAI, final biomass and grain yield. The model was run from 2 weeks before sowing to 2 weeks after the observed date of physiological maturity. Observed values obtained from the field trials were compared with model simulated values based on statistical indices.
The performance of the model was assessed using a set of statistics such as root mean square error (RMSE), normalized root mean square error (RMSEn), and coefficient of determination (R2). Simulation output is considered excellent if RMSEn < 10%, good when RMSEn is ≥ 10 and ≤ 20%, fair when RMSEn is ≥ 20 and ≤ 30% and poor if RMSEn is ≥ 30% (Jamieson et al., 1991). The coefficient of determination (R2) was also computed according to Archontoulis et al. (2014) to provide a measure of the predictive ability of the model. A model reproduces experimental data perfectly when R2 is 1. Statistical indices were calculated using the following: -
Where n: number of observations, Pi: predicted value for the ith measurement and Oi: observed value for the ith measurement and O and P represent the mean of the observed values for all studied parameters.
Model Application
The calibrated and evaluated APSIM-Maize model was used to access the response of contrasting maize varieties to different sowing windows. This was done to predict the effect of 11 sowing windows (starting from 15th June and repeated every 7 days until 16th August) on grain yield of two drought tolerant maize (2009EVDT and IWDC2SynF2) in six contrasting locations in Nigeria. The planting windows were: PW1 = June 1–June 7, PW2 = June 8–June 14, PW3 = June 15–June 21, PW4 = June 22–June 28, PW5 = June 29–July 5, PW6 = July 5–July 12, PW7 = July 13–July 19, PW8 = July 20–July 26, PW9 = July 27–August 2, PW10 = August 3–August 9, PW11 = August 10–August 16. The locations were Abuja (North-central) and Yelwa Jambore (Northeast) in the southern Guinea savanna (SGS) zone, Balbaya (northeast) and Kano (northwest) in the Sudan savanna (SS) zone and Sabon-Gari (northeast) and Zaria (northwest) in the northern Guinea savanna zone (NGS). The model initial water, nitrogen and organic matter contents were reset at the beginning of each simulation (first of April) to eliminate the residual effect of these parameter in the soil profile on crop growth and development for current season. Generally, sowing was done at soil depth of 5 cm, with a sowing density of 5.3 plants m−2. The recommended nitrogen rate (120 kg ha−1) was set in split to run the model for all planting windows. The model was set to harvest when the crop reached harvest maturity. Mean, minimum and maximum yields with their standard deviations and coefficient of variation (CV) for the 31 years' simulation for each variety and location were calculated and presented accordingly. Probability of exceedance graphs were used to present the chance of obtaining a yield threshold under each planting window for each variety for the 31-year simulations. Yield thresholds of 3,000 kg ha−1 for 2009EVDT and 4,000 kg ha−1 for IWDC2SynF2 were used based on the reported yields from on-station trials in northern Nigeria (Kamara et al., 2012; Tofa et al., 2020).
Results
Soils Physio-Chemical Properties in the Study Sites
As shown in Table 1 the soils vary significantly in physio-chemical properties in the experimental and model application sites. In Abuja the soil has a sand content of 34.9%, silt content of 16.0%, and clay content of 49.1% and is slightly acidic with a pH of 4.9 and bulk density of 1.9 g cm−3 at the surface layer. It has a low organic carbon of 0.6%, NO3 and NH4 content of 1.67 and 0.64 kg ha−1, respectively. In Yelwa-Jambore, the surface soil was sandy loam in texture with a sand content of 77.2%, silt content of 11.2%, and clay content of 11.6%. The surface soils have a pH of 4.99 with bulk density of 2.2 g/cm3, low organic carbon of 0.4%, and NO3, and NH4 content of 1.3 and 0.5 kg ha−1, respectively. In Zaria, the surface horizon has a silty loam texture with a sand content of 38.0%, silt content of 42%, and clay content of 20% with bulk density of 1.25 g cm−3, pH of 5.6, OC of 0.6%, low NO3 (2.6 kg ha−1), and NH4 (0.74 kg ha−1). The surface soils in Sabon Gari have a sandy clay loam texture, with a sand content of 24.4%, silt content of 33.2%, and 42.4% of clay with organic carbon content of 0.7 %, bulk density of 1.7 g cm−3, pH of 6.2 and NO3, and NH4 content of 1.2, and 1.1 kg ha−1, respectively. In Kano, the soil surface horizon has a loamy sand texture with sand content of 82.4%, silt content of 13.0%, and clay content of 5.0%. The soil bulk density was 1.7 g cm−3 with organic carbon content of 0.3%, pH of 6.6 and very low content of NO3 (2.8 kg ha−1) and NH4 (0.6 kg ha−1). The surface soil in Balbaya has a sandy-loam texture with sand content of 82.40%, silt content of 7.2%, and clay content of 10.4% with bulk density of 1.59 g cm−3, organic carbon of 0.29 %, pH of 6.1 and NO3 and NH4 content of 1.5 and 0.94 kg ha−1.
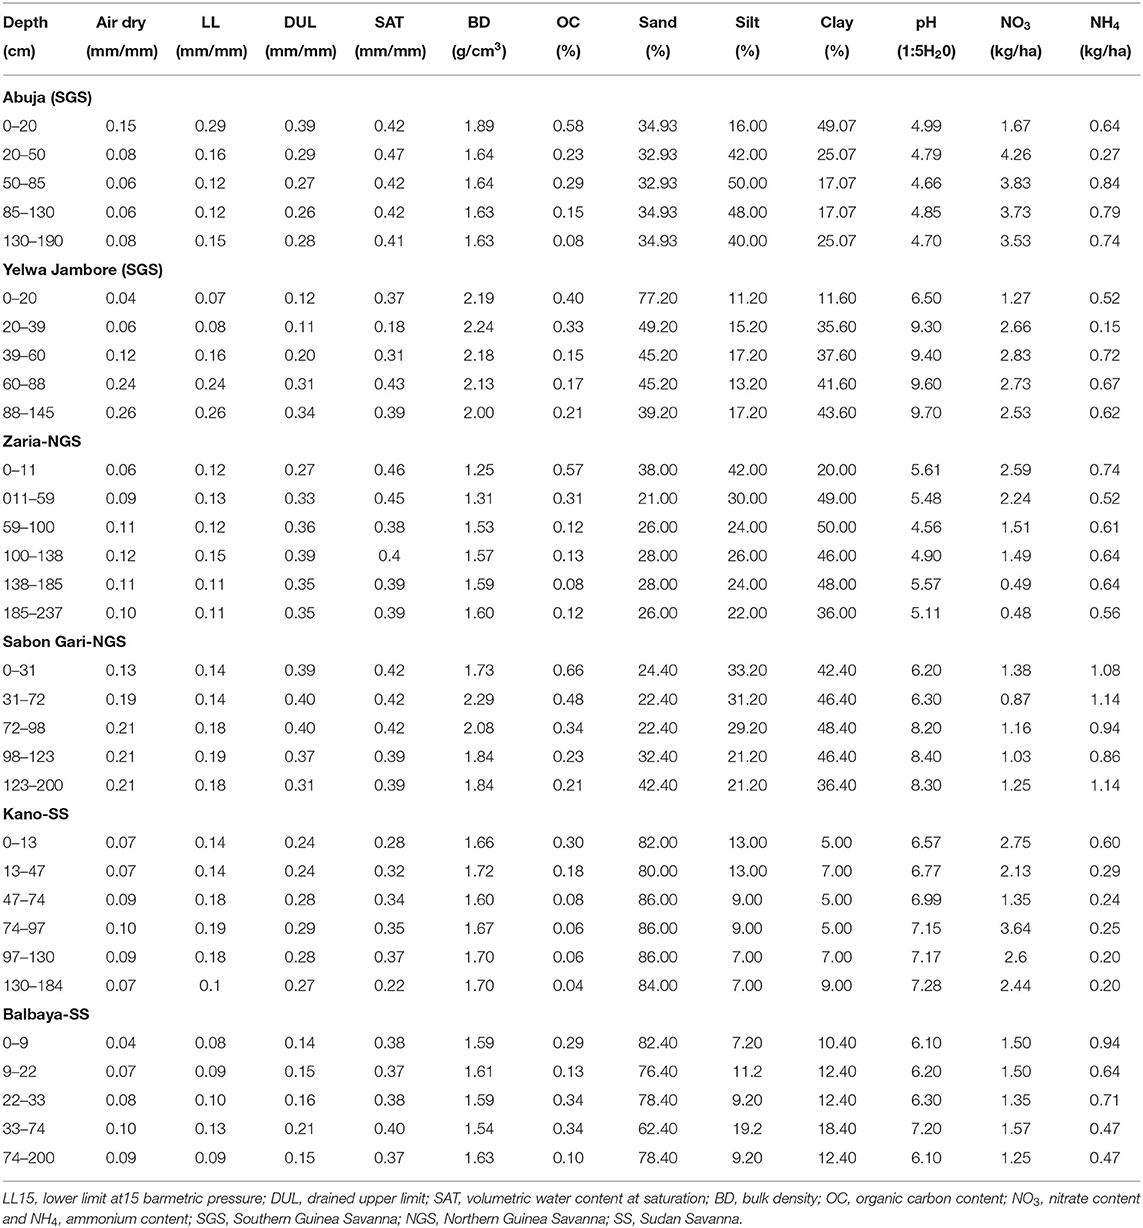
Table 1. Soil physical and chemical properties used for APSIM soil parameterization, evaluation and model application of the study sites.
Rainfall and Temperature in Model Application Sites
The cumulative monthly rainfall and temperature in the model application sites across the 31-year period are presented in Figures 1A–F. Average monthly minimum temperature was 21°C in Abuja and Yelwa, 19°C in Zaria, 21°C in Sabon Gari, 20°C in Kano and Balbaya. Maximum temperature was 33°C in Abuja and Yelwa, 32°C in Zaria and Sabon Gari, 34°C in Kano and 33°C in Balbayo. The mean annual rainfall recorded for Abuja was 1,603 mm, 910 mm for Yelwa, 1,047 mm for Zaria, 968 mm for Sabon Gari, 810 mm for Kano, and 956 mm for Balbaya. Overall total rainfall amount was higher in the SGS, followed by the NGS and SS. The peak of the rainy season across the selected locations were recorded in the month of July and August with more than 60% of rains occurring in these months. High variations in rainfall amount among the years for each location was also observed.
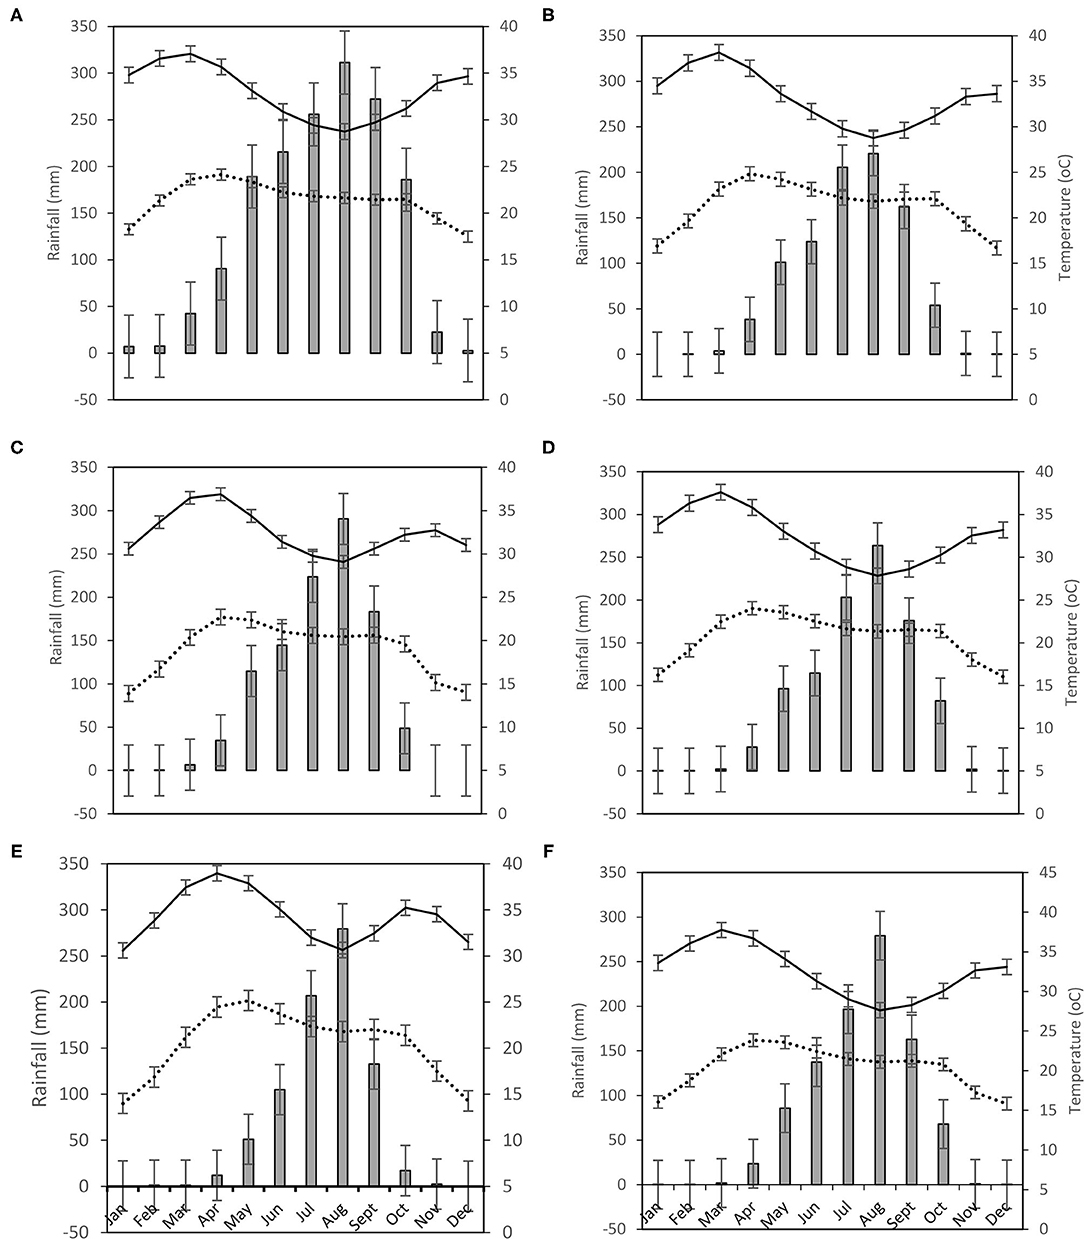
Figure 1. (A–F) Cumulative monthly rainfall and temperature over a 31-year period (1985–2015) for Abuja (A), Yelwa (B), Zaria (C), Sabon Gari (D) Kano (E), and Balbaya (F) Source of data: NIMET (2016) and CHIRPS, Funk et al. (2015).
Analysis of Model Calibration
Table 2 shows the estimated cultivar coefficients for 2009EVDT and IWDC2 SynF2. The calibrated values for the medium maturing variety (IWDC2 SynF2) were found to be higher than that of early maturing variety (2009EVDT), except for duration from flowering to start of grain filling and grain growth rate that were found to be higher for early maturing variety. There was good agreement between the observed and simulated values for days to flowering and maturity for both varieties (Table 3). The statistical values for the simulated and measured values were 3–4 days for RMSE with normalized RMSE of < 10% for both varieties. The LAI was also calibrated with high accuracy as evidenced by RMSE below 0.4 for both varieties and RMSEn below 9 % for 2009EVDT and 12% for IWDC2SynF2. Model statistics for grain yield indicates low RMSE of 301 kg ha−1, RMSEn of 5% and strong coefficients of determination (R2) of 0.82 for 2009EVDT. The TDM was evaluated with low RMSE of 517 kg ha−1, RMSEn of 4%, and R2 of 0.87. For IWDC2SynF2, the model evaluation indices for grain yield shows low RMSE of 383 kg ha−1, excellent RMSEn of 6%, and high R2 of 0.90. The TDM for this variety was slightly under predicted with 988 kg ha−1 RMSE, 6.4% RMSEn, and R2 of 0.89.
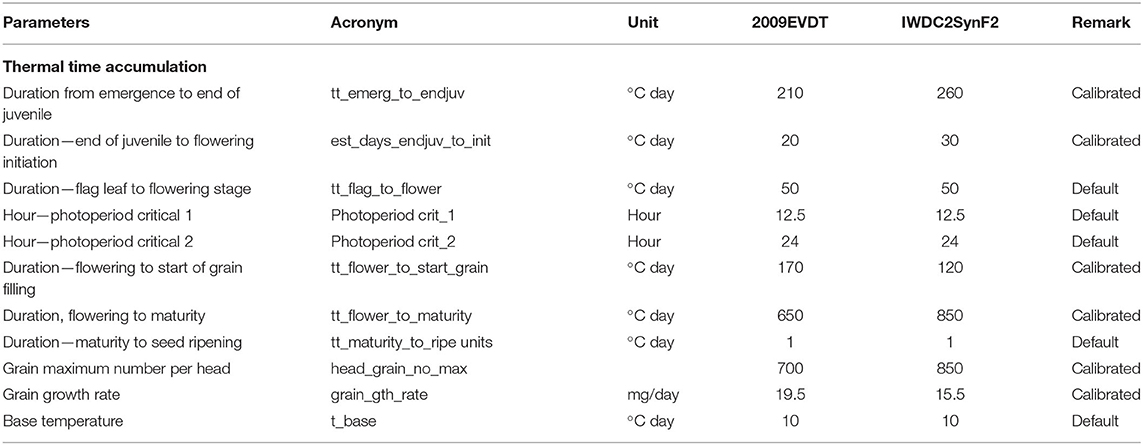
Table 2. Calibrated cultivar specific parameters for 2009EVDT and IWDC2SynF2 maize varieties.
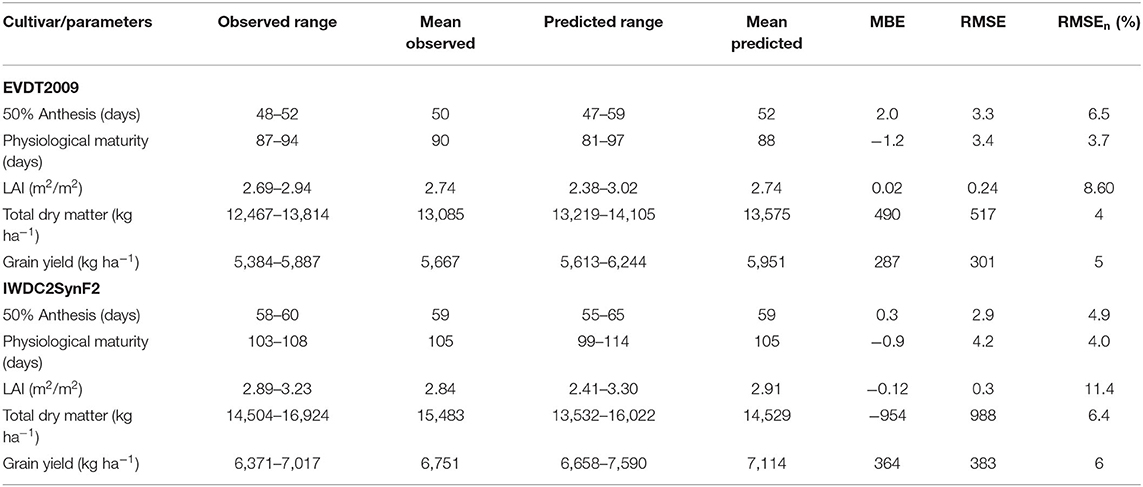
Table 3. Evaluation analysis after model calibration between observed and simulated parameters for phenological development, leaf area index (LAI), total dry matter (TDM), and grain yield.
Analysis of Model Validation
The model validation with an independent data sets for both maize varieties showed good agreement between simulated and observed values for grain yield and TDM (Figures 2A–D, 3A–D) in the two representative sites (Abuja and Zaria). The model predicted grain yields well for both varieties in both locations with RMSE values ranging between 212 and 262 kg ha−1, R2 values ranging between 0.97 and 0.98, and RMSEn values below 8%. Validation of TDM at harvest was also accurate for the two varieties. For the variety 2009EVDT, model evaluation statistics were RMSE < 800 kg ha−1, RMSEn < 12%, R2 = 0.94 in both locations. The variety IWDC2SynF2 also had good evaluation statistics for TDM with RMSE value of < 100 kg ha−1, RMSEn of ≤ 12%, and R2 of above 0.84. Overall, the model evaluation statistics were within acceptable ranges for both varieties across the two locations. The accurate predictions of both varieties under optimum condition and at different N levels with low RMSE values implies that the model could be used to optimize production.
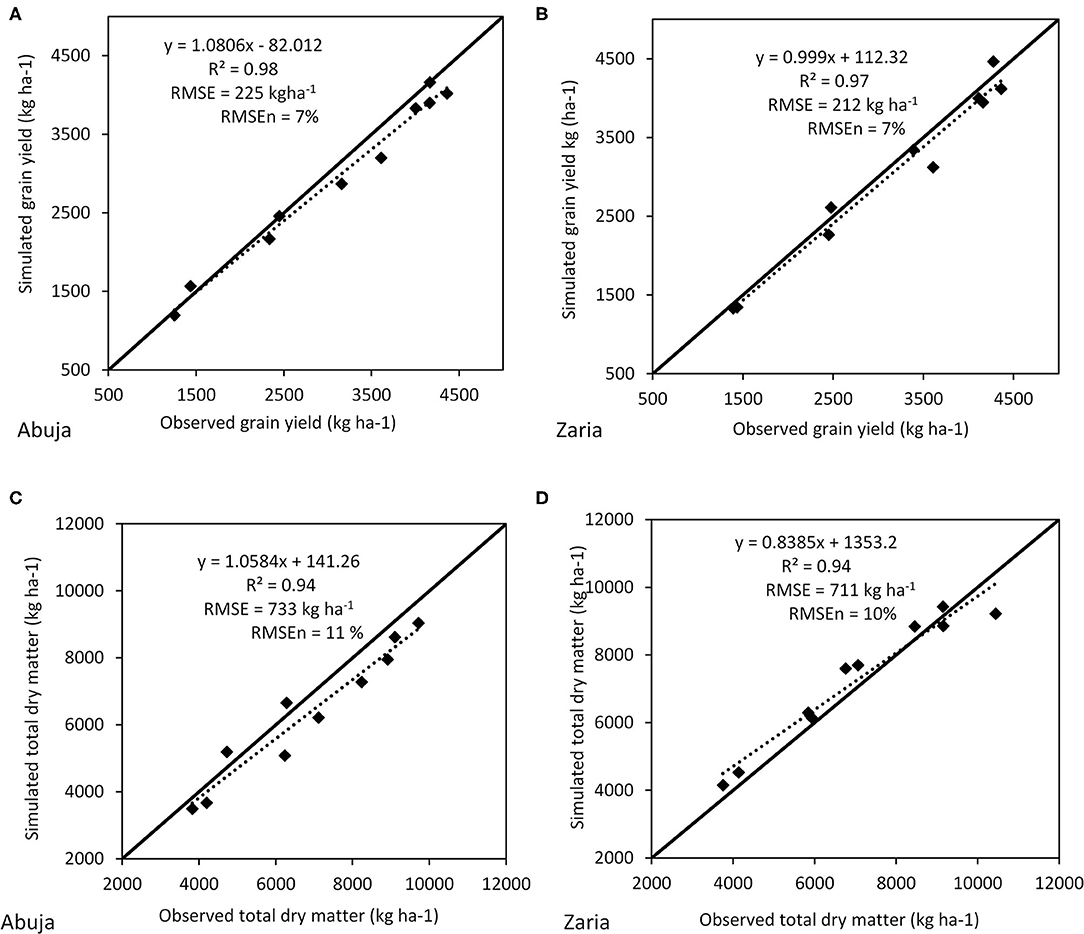
Figure 2. (A–D) Comparison of observed and simulated outputs of model validation data for grain yield and total dry matter (TDM) at varying N-fertilizer applications for 2009EVDT in Abuja and Zaria (each point is average of treatment during 2016 and 2017 cropping seasons).
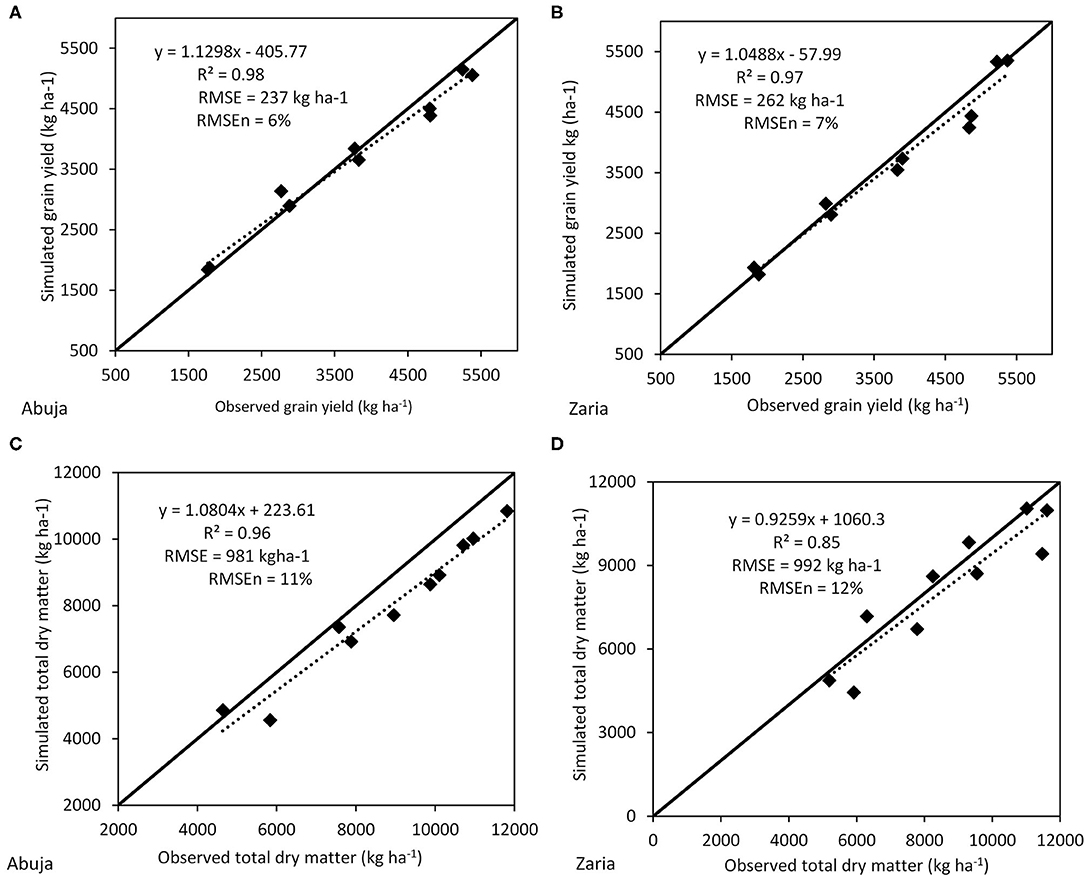
Figure 3. (A–D) Comparison of observed and simulated outputs of model validation data for grain yield and total dry matter (TDM) at varying N-fertilizer applications for IWDC2SynF2 in Abuja and Zaria (each point is average of treatment during 2016 and 2017 cropping seasons).
Seasonal Analysis for Maize Yield Grown Under Different Planting Window
The simulated grain yields for different planting windows and location using 31-year of weather data (1985–2015) for the two maize varieties are presented in Table 4. Generally, higher grain yield was simulated for the medium-maturing IWDC2SynF2 than that of early-maturing 2009EVDT across the selected sites. In southern Guinea savannah zone (Abuja and Yelwa) and for both varieties, the planting windows from PW1 (June 1)—PW8 (July 26) indicated stable grain yield from year-to-year with low CV below 15%. Highest mean yield of 3,774 and 3,360 kgha−1 for 2009EVDT, 5,340 and 4,410 kgha−1 for IWDC2SynF2 were simulated at PW3 (June 15–June 21) in both sites. The simulated mean grain yield was lower for planting window PW 1 and for planting windows between PW9 and PW 11 with higher CV ≥ 15% for both varieties. In the NGS, the simulated mean grain yield was higher in Sabon Gari than Zaria. Sowing the variety 2009EVDT on PW1-PW8 in Zaria simulated average grain yield of 2,064–3,970 kg ha−1 with low CV below 15% planting windows before PW3 reduced mean simulated grain yield by 37% and planting window beyond PW8 significantly reduced grain yield by 11–18%. In Sabon Gari, sowing this variety from PW1–PW7 simulated mean grain yield ranging from 2,549 to 4,160 kg ha−1 with CV% ranged from 2 to 14%. Sowing on PW1 simulated the lowest mean grain yield (2,549 kgha−1) and highest mean grain yield (4,160 kg ha−1 was simulated at PW3). Planting beyond PW8, reduced simulated yield by 9% for PW9, 17% for PW10, and 18% for PW11. Our results showed that the best planting window with optimum yield for 2009EVDT could be obtained from PW3 to PW8 at Zaria and PW2 to PW7 at Sabon Gari. Sowing IWDC2SynF2 on PW2–PW8 at Zaria gave mean yield of 4,075–5,670 kg ha−1; while sowing on PW2–PW9 at Sabon Gari gave high and stable grain yield of 4,523–5,920 kg ha−1. Highest mean yields of 5,670 kg ha−1 in Zaria and 5,920 kg ha−1 in Sabon Gari are simulated at PW3 in both locations. The best sowing window with optimal yield for IWDC2SynF2 could be obtained from PW3 to PW8 at Zaria and PW2 to PW9 at Sabon Gari. Delaying sowing beyond PW8 at Zaria reduced yield by 18–45%. In Sabon Gari, delaying sowing beyond PW9 reduced yield by 30% for PW10 and 39% for PW11. In Kano in the SS, the highest mean grain yield was simulated at PW3. Yield decline by 70% when 2009EVDT is sown at PW1 and 36% when sown at PW2 compared to PW3. However, a reasonable and stable yield could be achieved from PW3–PW9 in Kano. In Balbaya, the highest grain yield was also obtained with sowing window of PW3 (June 15–21) for both varieties. The results show that the mean simulated yield are stable for IWDC2SynF2 when sowing from PW2 to PW7 in both sites. Sowing IWDC2SynF2 beyond PW7 in Kano reduced grain yield by 22–58% and in Balbaya, sowing the same variety beyond PW7 reduced grain yield by 25–43%.
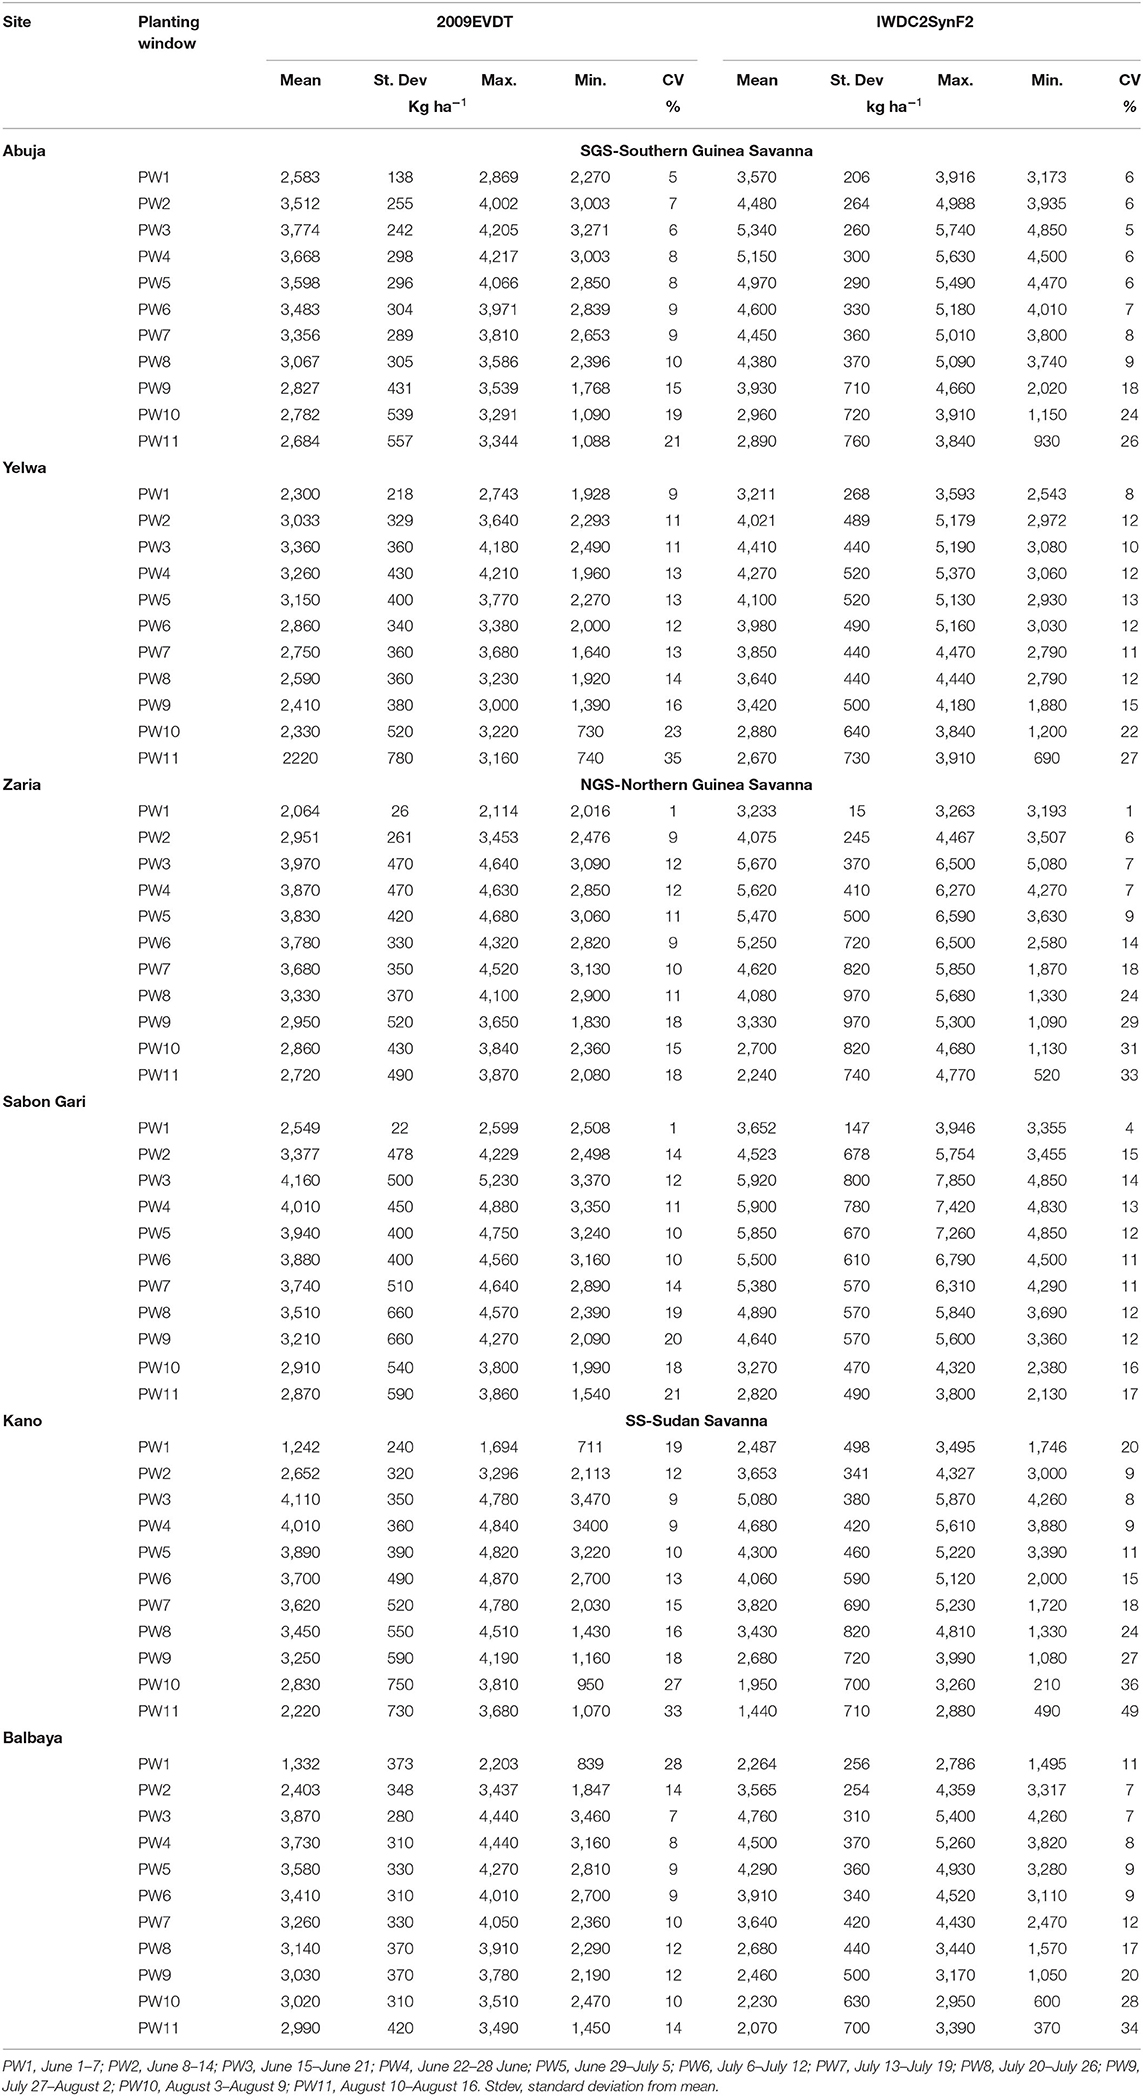
Table 4. Simulated maize grain yield (1985–2015) for different planting windows (PW) in the Southern Guinea savanna (SGS), Northern Guinea Savanna (NGS), and Sudan Savanna (SS) zones respectively Nigeria.
The probability of exceedance was used to further assess the best planting window relative to the risk associated to each planting window based on the attainable yield threshold for each variety simulated (Figures 4–6). In SGS zone, the probability of exceeding the attainable grain yield threshold of 3,000 kg ha−1 for 2009EVDT would be expected to occur in > 75% of the years when sowing from PW2 to PW7, 60% of the years for PW8 and only 35% of the years when sowing is delayed beyond PW8 in Abuja. In Yelwa, the probability of exceeding the grain yield threshold of 3,000 kg ha−1 would be expected in > 75% of the years when sowing from PW3 to PW5, 50% of the years when sowing occur in PW2, and below 35% of the years when sowing from PW6 to PW11 (Figures 4A,B). For IWDC2SynF2, the probability of exceeding a attainable grain yield of 4,000 kg ha−1 would be expected to occur in > 75% of the years when sowing from PW2 to PW8 and decline for other planting windows in Abuja. At Yelwa, the probability of exceeding the grain yield threshold of 4,000 kg ha−1 will occur in > 75% of the years when sowing occur in PW3–PW4, 68% of the years when sowing during PW2, 55% of the years in PW5–PW6 while the chance of attainable yield threshold decline with early sowing date (PW1) and sowing date beyond PW7 (Figures 4C,D).
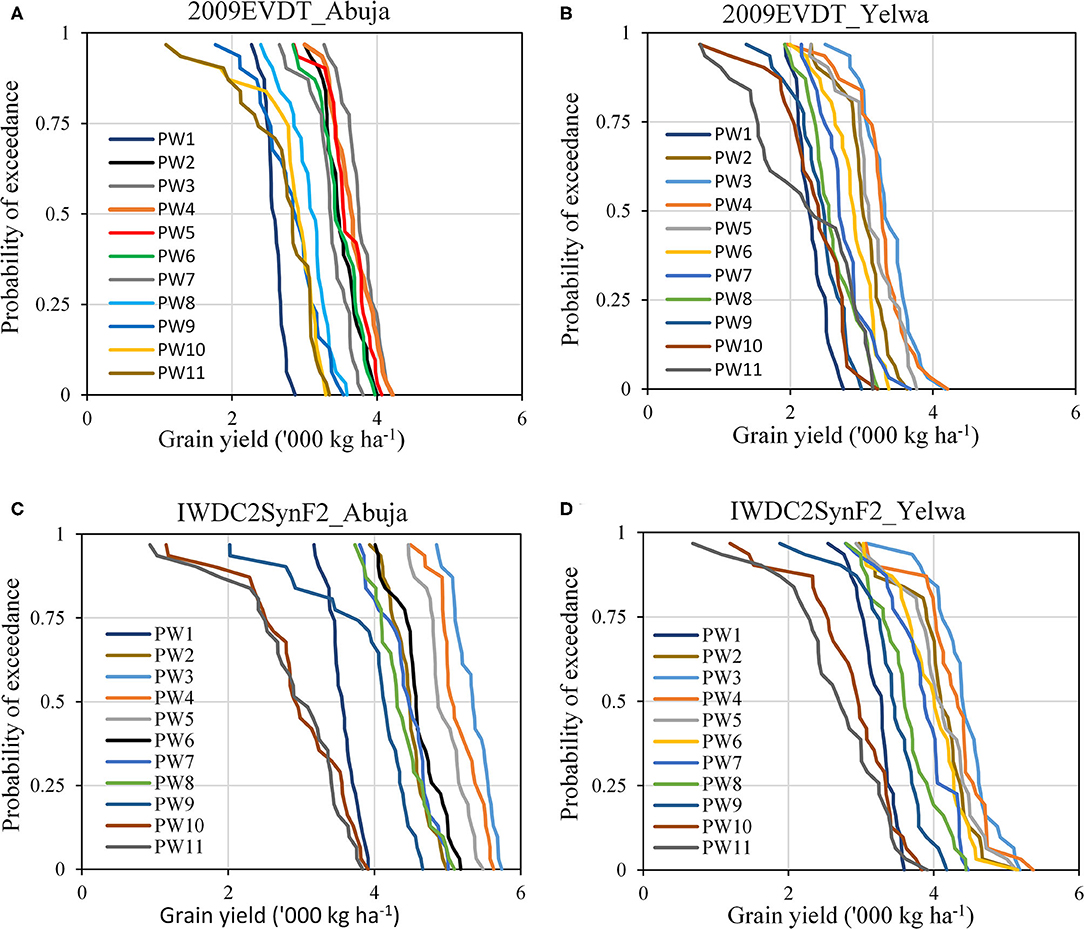
Figure 4. (A–D) Probability of exceedance for simulated grain yield (1985–2015) of EVDT2009 and IWDC2SynF2 across 11 planting windows in Abuja and Yelwa representing the Southern Guinea savannah agro-ecological zone.
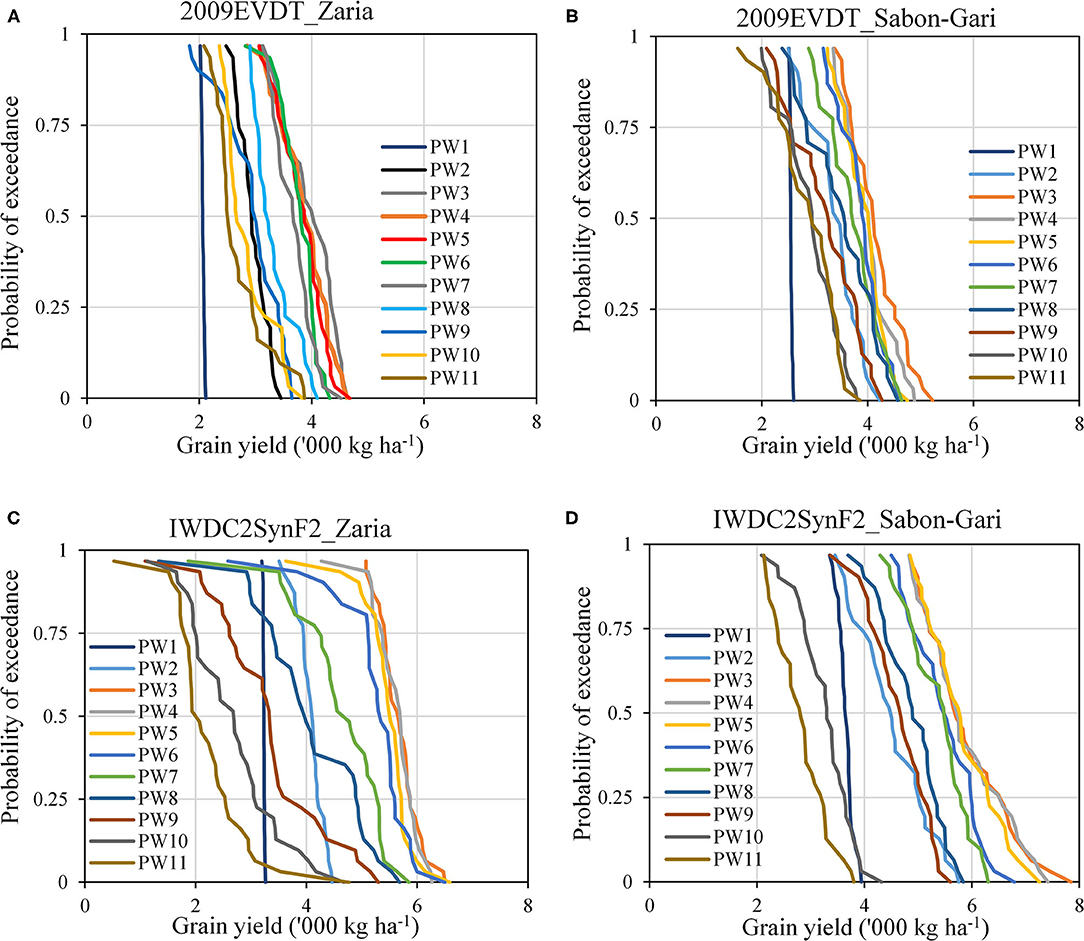
Figure 5. (A–D) Probability of exceedance for simulated grain yield (1985–2015) of EVDT2009 and IWDC2SynF2 across 11 planting windows in Zaria and Sabon-Gari representing the Northern Guinea savannah agro-ecological zone.
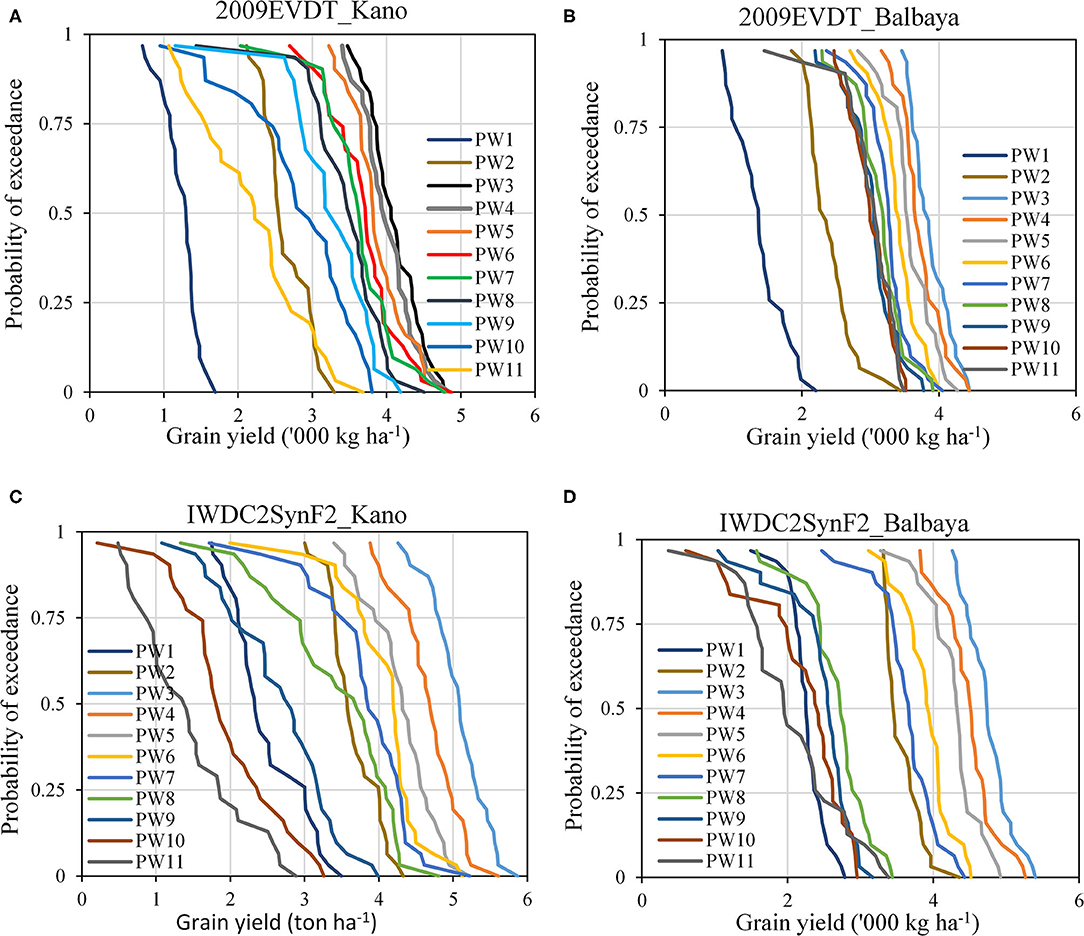
Figure 6. (A–D) Probability of exceedance for simulated grain yield (1985–2015) of EVDT2009 and IWDC2SynF2 across 11 planting windows in Kano and Balbaya representing the Sudan savannah agro-ecological zone.
In NGS zone, the probability of exceeding 3,000 kg ha−1 of grain yield threshold for 2009EVDT would be expected to occur in 0% of the years when sowing during PW1 and 38% of the years when sowing during PW2. The probability of attaining the same yield threshold will be > 75% of the years when sowing from PW3 to PW7; 70% of the years with sowing during PW8 and far below 70% with sowing beyond PW9 (Figure 5A). Similarly, at Sabon-Gari (Figure 5B), the probability of exceeding 3,000 kg ha−1 of grain yield for 2009EVDT would occur in 0% when sowing during PW1 and 74% of the years when sowing during PW2; > 75% of the years when sowing from PW3 to PW7 and far below 75% when sowing occur after PW8. For IWDC2SynF2, the probability of exceeding a attainable grain yield of 4,000 kg ha−1 would be expected to occur in 0% of the years when sowing during PW1 and 60% of the years when sowing during PW2, > 75% of the years with sowing from PW3 to PW7 and below 48% of the year when sowing is delayed beyond PW5 in Zaria (Figure 5C). In contrast, the probability of exceeding attainable grain yield of 4,000 kg ha−1 in Sabon Gari would be expected to occur in in 0% of the years when sowing during PW1 and 70% of the years when sowing during PW2, > 75% of the years with sowing on PW3–PW9 and thereafter decline beyond PW9 (Figure 5D). These results suggest that the length of planting window for attainable yield threshold would occur within 35 days (June 15–July 19) at Zaria and 42 days (June 8–July 19) at Sabon-Gari for 2009EVDT. The best planting window for IWDC2SynF2 indicates PW3 (June 15)—PW7 (July 19) ~35 days at Zaria. Longer planting window is estimated for Sabon Gari and varied from June 8 to August 2.
In SS zone, the probability of exceeding a desired grain yield of 3,000 kg ha−1 for 2009EVDT would be expected to occur in < 20 % of the years when sowing during PW1 and PW2, > 75% of the years with sowing from PW3 to PW8 and significantly decline below 75% of the years with sowing occur beyond PW8 in Kano (Figure 6A). In Balbaya, the probability of exceeding yield threshold of 3,000 kg ha−1 would be expected to occur in < 10% of the years when sowing during PW1 and PW2, > 75% of the years with sowing from PW3 to PW7 and decline significantly below 75% of the years with sowing occur beyond PW7. The probability of exceeding yield of 4,000 kg ha−1 for IWDC2SynF2 would be expected to occur in < 20 % of the years when sowing during PW1 and PW2, > 75% of the years with sowing from PW3 to PW5 (Figures 6C,D), and far below 75% of the years when sowing is delayed beyond PW5 in both sites (Kano and Balbaya). A long planting window of 42 days (June 15–July 26) in Kano is simulated for 2009EVDT. This is shorter than the 35 days (June 15–July 19) simulated for this variety in Balbaya. The optimum planting window of 21 days (June 15–July 5) simulated for IWDC2SynF2 in both locations is shorter than that simulated for 2009EVDT.
Discussion
Cropping system models offer opportunities to predict different management strategies including optimum planting windows for crops over a large area using information on soils and long-term weather (Adnan et al., 2017; Tofa et al., 2020). In this study the model statistics show that the APSIM model was well calibrated and evaluated. The high model accuracy (RMSEn) and low RMSE values indicate good agreements between observed and model predicted values suggesting that the APSIM model is a good decision-making tool for crop production in northern Nigeria. Akinseye et al. (2020) reported a good agreement between observed and predicted values for sorghum yield in the dry savannas of Nigeria and suggested that the APSIM model can be used to predict crop performance in the Nigeria savannas.
Following the successful calibration and validation of the APSIM model for both maize varieties in the Nigerian savannas, the model was applied for different planting windows analysis. Several studies have shown that models can be rather useful for planting date analysis, compared to resource intensive experimental studies (Mavromatis et al., 2001; Saseendran et al., 2005; Soler et al., 2008; Adnan et al., 2017; Tofa et al., 2020). The recommended sowing date for maize in the Nigeria savannas is early to mid-June in the major three agro-ecozones irrespective of maize varietal differences, seasonal and spatial variations (Tofa et al., 2020). These recommendations are made from field experiments in few sites and years. However, results from the seasonal analysis for simulated grain yield with the APSIM model shows that optimum planting windows are dependent on maize variety, agro-ecological zone and the sites within the zones. Our results further revealed high magnitude of yield loss with early and late sowing especially in SS compared to NGS and SGS. In the SGS, the model simulation results show that the highest average yield of the two varieties are obtained with sowing on June15–21 (PW3) in Abuja and Yelwa. The probability of exceeding attainable mean grain yields of 3,000 kg ha−1 for 2009EVDT is high when planting from June 8 to July 19 while attainable yield of 4,000 kg ha−1 is obtained for IWDC2SynF2 with high probability when sowing from June 8 to July 26. In addition, the risk analysis reveal a yield decline by 26% for 2009EVDT and 20% for IWDC2SynF2 when sowing earlier than June 8. Sowing after July 19 resulted to estimated yield loss of 9–20% for 2009EVDT. For IWDC2SynF2, sowing beyond July 26 resulted to estimated yield decline by 10–34%. Similar to Abuja, the highest average yields were simulated when the two varieties are planted on June 15–21 in Yelwa. The desirable yield of 3,000 kg ha−1 is obtained when 2009EVDT is sown on June15–July 5 while the desirable yield of 4,000 kg ha−1 for IWDC2SynF2 is obtained with planting on June 8–28. These results suggest that optimum planting window for attainable yield could be best achieved from PW3 (June 15) to PW5 (July 19) for 2009EVDT and PW2 (June 8) to PW8 (July 26) for IWDC2SynF2 in Abuja while both varieties in Yelwa site would have shorter optimum planting windows of PW3 (June 15) to PW5 (July 5) for 2009EVDT and PW2 to PW4 for IWDC2SynF2 for attainable yield threshold. These results are consistent with those of Adnan et al. (2017) who simulated mid-June to late July as optimum time to plant early-maturing maize in the SGS. Our results also agree with Tofa et al. (2020) who reported that optimum and stable yield of the medium-maturing maize variety IWDC2SynF2 was simulated with planting from mid-June to end of July for Abuja in the SGS. The results simulated for Yelwa is however, different from the simulations results obtained by Tofa et al. (2020) for SGS. The differences in the two sites within the same zones may be due to the differences in soil characteristics and rainfall distribution. The Yelwa site has high sand content and very low clay content with resultant low levels of organic carbon (Table 1). This reduces nutrient and water retention capacity that leads to fast drying. The soils in Abuja are heavier with higher clay contents than those in Yelwa and could therefore retain more water to allow for late planting and crop growth throughout the season.
In the NGS, highest mean grain yields were simulated with sowing at the June15–21 window for both varieties and both locations. Higher yields were simulated in Sabon Gari than in Zaria for both varieties suggesting that Sabon Gari is more productive for maize production. For 2009EVDT, the attainable yield of 3,000 kg ha−1 was simulated at sowing window of June 15–July 26 in Zaria and June 8–July 26 in Sabon-Gari indicating optimum planting windows for this variety in this location. Guaranteed yield of 4000 kg ha−1 for IWDC2SynF2 is obtained with sowing from June 15 to July 19 in Zaria and June 8 to August 2 in Sabon-Gari. This is an estimated average yield decline of 48% for PW1 and 26% for PW2 when the variety 2009EVDT is sown earlier than June 15 in Zaria. Sowing earlier than June 8 carries the risk of yield decline of 39% in Sabon-Gari. Farmers in both locations can delay planting of 2009EVDT to as late as third week of July while planting of IWDC2SynF2 can be delayed to third week of July in Zaria and to as late as August 2 in Sabon Gari. Using the CERES-Maize model, Tofa et al. (2020) showed that sowing IWDC2SynF2 in NGS from early June to late July produced optimal grain yield in Zaria. Delaying the sowing of this variety beyond late July reduced grain yields by 8–46%. Using the same model, Adnan et al. (2017) recommended the sowing of early-maturing maize like 2009EVDT from mid-June to late July. The differences in optimum sowing windows for the two locations within the same agro-ecological zone for the medium maturing maize may be due to differences in rainfall distribution and soil characteristics. The soils in Sabon Gari have high organic carbon and high clay content (Table 1) which help to retain water and nutrients.
Results show that a stable and guaranteed yield of 3,000 kg ha−1 can be obtained by planting the early-maturing 2009EVDT in both locations (Balbayo and Kano) in the SS up to last week of July. This variety provides an opportunity for farmers to delay planting if the rains are late in the SS zone. However, there is a high risk of crop failure when sowing earlier than June 15 resulting to significant yield decline of 70% for PW1 and 36% for PW2 in Kano; and 66% for PW1 and 38% for PW2 in Balbaya. Narrow planting windows were simulated for the medium-maturing IWDC2SynF2 in the SS zone with minimum guaranteed yield of 4,000 kg ha−1 when sowing was done between June 15 and July 5. Delaying sowing of this variety beyond July 5 will cause significant reduction in yield. This suggests that there is high risk of planting this variety in the Sudan savanna. The two locations are in the SS where the active growing period is < 5 months and the soils are relatively sandy and do not hold much water. Rainfall amount is in most of the years lower than the sites in the other zones. In contrast sowing can be delayed up to PW8 (July 26) for the early maturing variety 2009EVDT consistent with the findings of Adnan et al. (2017). Across planting windows, higher yields were simulated for the NGS than the other zones irrespective of length of growing season. This is probably due to the good soil conditions in this zone where the clay content and organic carbon contents are higher (Table 1). With the exception of Yelwa in the SGS of northeast Nigeria where optimum sowing window was simulated from mid-June to early July for the two varieties, the sowing of the two varieties can be delayed to the third week of July in the other locations. This is contrary to the blanket recommendations of early to mid-June for all the varieties (NAERLS, 2013) for the Nigeria savannas irrespective of the maize variety and agro-ecozones. The large planting window suggested for each agro-ecozone gives more flexibility with regard to the variable onset of the rainy seasons in a given locality. The suggested planting windows are good for the planning well ahead of the cropping season. However, they need to be adjusted based on seasonal forecasts and within season short term forecasts.
In general, the risk associated with the optimal sowing period for both maize varieties simulated is higher in Yelwa than Abuja in SGS; the risk is low for both varieties and sites in the NGS; while risk associated with medium-maturing variety (IWDC2SynF2) is higher than the early-maturing variety (2009EVDT) at both sites in the Sudan Savanna zone. Thus, the optimum planting windows provide a good pathway for planning ahead of the cropping season, but they need to be adjusted based on seasonal rainfall forecasts.
Conclusion
Results from this study show that the APSIM model was able to simulate accurately growth and yield of maize grown under rain fed conditions in the Guinea and Sudan savannas of Nigeria suggesting that the model can be used to identify appropriate crop management practices for maize in the target zones. Although planting from June 15 to 28 gave the highest yield for both varieties in all the agro-ecologies, planting windows that gave the desirable yields of 3,000 kg ha−1 for 2009EVDT and 4,000 kg ha−1 for IWDC2SynF2 varied with agro-ecozones and sites. In the SGS, the best planting window that gives the desirable yield was June 8–July 19 for 2009EVDT and June 8–July 26 for IWDC2SynF2 for Abuja. At Yelwa, the planting window that gives desirable yield could start from June 15 to July 5 for 2009EVDT and June 8 to 28 for IWDC2SynF2. In the NGS, the optimum planting window that gives the desirable yield was June 15–July 19 for both varieties in Zaria. At Sabon Gari, farmers can start planting maize as early as June 8 and delay planting to July 19 for 2009EVDT and August 2 for IWDC2SynF2 to attain the desirable yields. In the SS where the growing season is short, planting of 2009EVDT can be delayed up to the third week of July at both locations. In order to obtain the desirable yield for the medium-maturing IWDC2SynF2, planting should be done by the first week of July. For the SS, the risk of growing IWDC2SynF2 is high given the narrow sowing window simulated for this zone. The early-maturing variety is therefore recommended for this zone.
Data Availability Statement
The raw data supporting the conclusions of this article will be made available by the authors, without undue reservation.
Author Contributions
AB, AK, and JJ: experimental design. AB, AT, and TA: experimentation. AK, JJ, and AB: methods. JJ and AK: supervision. AB, FMA, AT, and TA: statistical analysis. FMA and AB: manuscript draft. AK: final manuscript. All authors: read and approved the final manuscript.
Funding
This research was funded by the Bill and Melinda Gates Foundation through the Project Taking Maize Agronomy to Scale in Africa (TAMASA) with Grant No. OPP1113374.
Conflict of Interest
The authors declare that the research was conducted in the absence of any commercial or financial relationships that could be construed as a potential conflict of interest.
Acknowledgments
We wish to thank the Centre for Dryland Agriculture, Bayero University Kano for their partial support to undertake the field work. We thank the Nigerian Meteorological Agency (NIMET) for providing climate data. The staff of Agronomy unit of IITA, Kano office are also acknowledged for managing the field experiments and collecting the experimental data in this study.
References
Adnan, A. A., Jibrin, M. J., Kamara, A. Y., Bassam, L. A., Abdulwahab, S. S., and Ismail, I. G. (2017). CERES–Maize model for determining the optimum planting dates of early maturing maize varieties in northern Nigeria. Front. Plant Sci. 8:1118. doi: 10.3389/fpls.2017.01118
Akinseye, F. M., Ajeigbe, H. A., Traore, P. C. S., Agele, S. O., Zemadim, B., and Whitbread, A. (2020). Improving sorghum productivity under changing climatic conditions: a modelling approach. Field Crops Res. 246, 1–11. doi: 10.1016/j.fcr.2019.107685
Anderson, J. M., and Ingram, J. S. I. (1993). Tropical Soil Biology and Fertility: A Handbook of Methods, 2nd Edn. Aberstwyth: CAB International, the Cambrian News, p. 221.
Archontoulis, V. S., Fernando, E. M., and Kenneth, J. M. (2014). A methodology and an optimization tool to calibrate phenology of short-day species included in the APSIM PLANT model: application to soybean. Environ. Model. Softw. 62, 465–477. doi: 10.1016/j.envsoft.2014.04.009
Ayanlad, E. A., Radeny, M., Morton, J. F., and Muchaba, T. (2018). Rainfall variability and drought characteristics in two agro-climatic zones: an assessment of climate change challenges in Africa. Sci. Total Environ. 630, 728–737. doi: 10.1016/j.scitotenv.2018.02.196
Badu-Apraku, B., Fakorede, M. A. B., Lum, A. F., and Akinwale, R. (2009). Improvement of yield and other traits of extra-early maize under stress and non-stress environments. Agron. J. 101, 381–389. doi: 10.2134/agronj2008.0089x
Bremner, J. M. (1996). “Organic forms of nitrogen,” in Methods of Soils Analysis. Part 2. Chemical and Microbiological Properties, ed C. A. Black (Madison, WI: SSSA), 1238–1255. doi: 10.2134/agronmonogr9.2.c34
FAO (2006). Base Reference Base for Soil Resources. A Framework for International Classification, Correlation And Communication. World Soil Resources Reports 103, FAO, Rome.
FAOSTAT (2017). Food and Agricultural Organization of the United Nations (FAO), FAO Statistical Database. Available online at: http://faostat.fao.org (accessed 30 April, 2019).
FAOSTAT (2018). Production Statistics (prodstat). Food and Agriculture Organization of the United Nations, Rome. Available online at: http://www.fao.org/faostat/en/#country/159 (accessed June 30, 2019).
Funk, C., Peterson, P., Landsfeld, M., Pedreros, D., Verdin, J., Shukla, S., et al. (2015). The climate hazards infrared precipitation with stations—a new environmental record for monitoring extremes. Sci. Data 2:150066. doi: 10.1038/sdata.2015.66
Gee, G. W. Or D. (2002). “Particle size analysis,” in Methods of Soil Analysis, Part 4, Physical Methods, Soils Science Society of America, Book Series No. 5, eds J. H. Dane and G. C. Topp (Madison, WI), 255–293. doi: 10.2136/sssabookser5.4.c12
Graef, F., and Haigis, J. (2001). Spatial and temporal rainfall variability in the Sahel and its effects on farmers' management strategies. J. Arid. Environ. 48, 221–231. doi: 10.1006/jare.2000.0747
Heanes, D. L. (1984). Determination of total organic-C in soils by an improved chromic acid digestion and spectrophotometric procedure. Commun. Soil Sci. Plant Anal. 15, 1191–1213. doi: 10.1080/00103628409367551
Holzworth, D. P., Huth, N. I., deVoil, P. G., Zurcher, E. J., Herrmann, N. I., McLean, G., et al. (2014). APSIM evolution towards a new generation of agricultural systems simulation. Environ. Model. Softw. 62, 327–350. doi: 10.1016/j.envsoft.2014.07.009
IITA (1989). Automated and semi-automated methods for soil and plant analysis. Manual Series No. 7, wIITA, Ibadan, Nigeria.
Iken, J. E., and Amusa, N. A. (2014). Maize research and production in Nigeria. Afr. J. Biotechnol. 3, 302–307. doi: 10.5897/AJB2004.000-2056
Jagtap, S. S., and Abamu, F. J. (2003). Matching improved maize production technologies to the resource base of farmers in a moist savanna. Agric. Syst. 76, 1067–1084. doi: 10.1016/S0308-521X(02)00040-9
Jamieson, P. D., Porter, J. R., and Wilson, D. R. (1991). A test of computer simulation model ARCWHEAT1 on wheat crops grown in New Zealand. Field Crops Res. 27, 337–350. doi: 10.1016/0378-4290(91)90040-3
Jibrin, M. J., Kamara, A. Y., and Ekeleme, F. (2012). Simulating planting date and cultivar effects on dryland maize production using CERES-maize model. Afr. J. Agric. Res. 7, 5530–5536.
Kamara, A. Y., Ekeleme, F., Chikoye, D., Omoigui, L. O., and Dugje, I. Y. (2009). Planting date and cultivar effects on grain yield in dry land corn production in north-east Nigeria. Agron. J. 101, 91–98. doi: 10.2134/agronj2008.0090
Kamara, A. Y., Ewansiha, S. U., Menkir, A. I., and Tofa (2012) Agronomic response of drought-tolerant Striga-resistant maize cultivars to nitrogen fertilization in the Nigerian Guinea savannas. Maydica 57, 114–120.
Keating, B. A., Carberry, P. S., Hammer, G. L., Probert, M. E., Robertson, M. J., Holzworth, D., et al. (2003). An overview of APSIM, a model designed for farming systems simulation. Eur. J. Agron. 18, 267–288. doi: 10.1016/S1161-0301(02)00108-9
Kirschbaum, M. U., Carter, J. O., Grace, P. R., Keating, B. A., Keenan, R. J., Landsberg, J., et al. (2001). “Brief description of several models for simulating net ecosystem exchange in Australia,” in Nee Workshop Proceedings (New York, NY), 18–20.
Marteau, R., Sultan, B., Moron, V., Alhassane, A., Baron, C., and Traore, S. B. (2011). The onset of the rainy season and farmer's sowing strategy for pearl millet cultivation in South-west Niger. Agric. For. Meteorol. 151, 1356–1369. doi: 10.1016/j.agrformet.2011.05.018
Mavromatis, T., Boote, K. J., Jones, J. W., Irmak, A., Shinde, D., and Hoogenboom, G. (2001). Developing genetic coefficients for crop simulation models with data from crop performance trials. Crop Sci. 41, 40–51. doi: 10.2135/cropsci2001.41140x
Mehlich, A. (1984). Mehlich 3 soil test extractant: a modification of Mehlich 2 extractant. Commun. Soil Sci. Plant Anal. 15, 1409–1416. doi: 10.1080/00103628409367568
NAERLS (2013). “Wet season in Nigeria. Services,” in Agricultural Performance Survey of 2012; National Agricultural Extension and Research Liaison Federal Ministry of Agriculture and Rural Development Ahmadu Bello University (Zaria).
Odekunle, T. O. (2004). Rainfall and the length of the growing season in Nigeria. Int. J. Climatol. 24, 467–479. doi: 10.1002/joc.1012
Sachs, W. J., Deryng, D., Foley, J. A., and Ramankutty, N. (2010). Crop planting dates: an analysis of global patterns. Glob. Ecol. Biogeogr. 19, 1–14. doi: 10.1111/j.1466-8238.2010.00551.x
Santos, R. D., Boote, K. J., Sollenberger, L. E., Neves, A. L. A., Pereira, L. G. R., Scherer, C. B., et al. (2017). Simulated optimum sowing date for forage pearl millet cultivars in multilocation trials in Brazilian semi-arid region. Front. Plant Sci. 8:02074. doi: 10.3389/fpls.2017.02074
Saseendran, S. A., Ma, L., Nielsen, D. C., Vigil, M. F., and Ahuja, L. R. (2005). Simulating planting date effects on corn production using RZWQM and CERES-Maize models. Agron. J. 97, 58–71. doi: 10.2134/agronj2005.0058
Saxton, K. E., and Rawls, W. J. (2006). Soil water characteristic estimates by texture and organic matter for hydrologic solutions. Soil Sci. Soc. Am. J. 70, 1569–1578. doi: 10.2136/sssaj2005.0117
Shehu, B. M., Lawan, B. A., Jibrin, J. M., Kamara, A. Y., Mohammd, I. B., Rurinda, J., et al. (2019). Balanced nutrient requirements for maize in the Northern Nigerian Savanna: Parameterization and validation of QUEFTS model. Field Crop Res. 241:107585. doi: 10.1016/j.fcr.2019.107585
Soler, C. M. T., Maman, N., Zhang, X., Mason, S. C., and Hoogenboom, G. (2008). Determining optimum planting dates for pearl millet for two contrasting environments using a modeling approach. J. Agric. Sci. 146, 445–459. doi: 10.1017/S0021859607007617
Keywords: APSIM, maize, modelling, optimum planting window, productivity
Citation: Beah A, Kamara AY, Jibrin JM, Akinseye FM, Tofa AI and Ademulegun TD (2021) Simulation of the Optimum Planting Windows for Early and Intermediate-Maturing Maize Varieties in the Nigerian Savannas Using the APSIM Model. Front. Sustain. Food Syst. 5:624886. doi: 10.3389/fsufs.2021.624886
Received: 01 November 2020; Accepted: 16 February 2021;
Published: 22 March 2021.
Edited by:
Jan Verhagen, Wageningen University and Research, NetherlandsReviewed by:
Jules Bayala, World Agroforestry Centre, KenyaRoberto Quiroz, Centro Agronomico Tropical De Investigacion Y Ensenanza Catie, Costa Rica
Copyright © 2021 Beah, Kamara, Jibrin, Akinseye, Tofa and Ademulegun. This is an open-access article distributed under the terms of the Creative Commons Attribution License (CC BY). The use, distribution or reproduction in other forums is permitted, provided the original author(s) and the copyright owner(s) are credited and that the original publication in this journal is cited, in accordance with accepted academic practice. No use, distribution or reproduction is permitted which does not comply with these terms.
*Correspondence: Alpha Yaya Kamara, A.Kamara@cgiar.org