Continuous Volatile Fatty Acid Production From Acid Brewery Spent Grain Leachate in Expanded Granular Sludge Bed Reactors
 Juan Castilla-Archilla
 Jonas Heiberger
  Simon Mills
 Julia Hilbig
 Gavin Collins
- National University of Ireland, Galway, Ireland
The production of volatile fatty acids (VFAs) in expanded granular sludge bed (EGSB) reactors using leachate from thermal diluted acid hydrolysis of brewery spent grain was evaluated. Partial inhibition of the anaerobic digestion process to induce VFA accumulation was achieved by applying a high organic loading rate [from 15.3 to 46.0 gCOD/(L·day)], and using a feed with an inlet concentration of 15 g/L total carbohydrates. Two EGSB reactors were operated under identical conditions, both inoculated with the same granular sludge. However, granular sludge in one reactor (R1) was subsequently disaggregated to flocculent sludge by a pH shock, whereas granules remained intact in the other reactor (R2). The hydraulic retention time (HRT) of both reactors was decreased from 36 to 24, 18 and 12 h. The main fermented compounds were acetic acid, butyric acid, propionic acid and ethanol. Despite fluctuations between these products, their total concentration was quite stable throughout the trial at about 134.2 (±27.8) and 141.1 (±21.7) mmol/L, respectively, for R1 and R2. Methane was detected at the beginning of the trial, and following some periods of instability in the granular sludge reactor (R2). The hydrogen yield increased as the HRT decreased. The highest VFA production was achieved in the granular sludge reactor at a 24 h HRT, corresponding to 120.4 (±15.0) mmol/L of VFAs. This corresponded to an acidification level of 83.4 (±5.9) g COD of VFA per 100 gram of soluble COD.
Introduction
Anaerobic digestion (AD) has been widely implemented as a method of biological wastewater treatment, where mixed microbial communities convert organic matter to biogas (CH4 and CO2). However, in the last decade there has been a growing interest in hydrogen production via dark fermentation, facilitated by the partial inhibition of the anaerobic digestion process (Cisneros-Pérez et al., 2015). During the acidogenesis step of AD, hydrogen and carbon dioxide are produced, along with fermented products such as ethanol and/or volatile fatty acids (VFAs). To improve this process and maximize hydrogen production, different pre-treatments have been applied to the inoculum and during reactor start up, including heat treatment (Cisneros-Pérez et al., 2015; Carrillo-Reyes et al., 2016), wash-out of methanogens (Cisneros-Pérez et al., 2015; Carrillo-Reyes et al., 2016) or pH shocks (Kan, 2013). The alteration of different operational conditions, such as pH or organic loading rate, can however, change the metabolic activity microorganisms. Different reactor configurations can also influence microbial community composition by altering selection pressures such as solids retention time, resulting in the wash out of microorganisms with slower growth rates, e.g., methanogens, or enriching faster growing organisms, e.g., acidogens (Etchebehere et al., 2016; Lim et al., 2020).
The VFAs produced simultaneously with hydrogen are valuable chemicals, currently obtained from fossil sources. Their potential production from renewable sources has not yet been developed at industrial scale. The development of hydrogen production from wastewater into more sophisticated technologies for VFA production could allow VFAs to be produced independently of fossil sources. One of the difficulties is, however, to maintain consistent VFA production, despite shifts in microbial community composition and changes in bioreactor performance (Cisneros-Pérez et al., 2017). The accumulation of organic compounds in the reactor mixed liquor can alter reaction kinetics in the microbial metabolic pathways of acidogenesis and methanogenesis (Ciranna et al., 2014; Pugazhendhi et al., 2017; de Menezes and Silva, 2019). This can activate or inactivate the consumption of hydrogen by different microorganisms, resulting in unstable hydrogen and VFA production (Saady, 2013; Regueira et al., 2020). In addition, the main problem with VFA production from wastewater is that their recovery is difficult and energy demanding, due to low VFA concentrations and complex composition of the bioreactor mixed liquor (Reyhanitash et al., 2016). The current state of-the-art for VFA extraction enables their recovery when operating at a low pH and with VFA concentrations exceeding 200–500 mmol/L (Reyhanitash et al., 2017; Rocha et al., 2017; Saboe et al., 2018).
Many wastewaters are low or medium strength and do not contain high carbohydrate concentrations, making them unsuitable for VFA production and recovery. Various reactor configurations have been optimized to use such wastewaters for hydrogen production via dark fermentation, without focusing on VFA production. Some of these reactors were operated with a synthetic feed concentration of about 60 g/L total carbohydrates (TC) (Zhang et al., 2008), and an organic loading rate (OLR) of up to 240 g TC/(L·d) (Zhang et al., 2008; de Menezes and Silva, 2019). However, waste streams with a higher TC concentration would be required for targeted VFA production, such as those originating from the agroindustry (de Menezes and Silva, 2019). The agriculture and food industry could, therefore, become a supplier of renewable feedstock for VFA production. These wastes, mostly lignocellulosic materials, are abundant and can be obtained with low or no cost. For example, the brewing industry produces high amounts of brewery spent grain (BSG), which is a solid, lignocellulosic material rich in carbohydrates, proteins and lignin. After the hydrolysis process, most of these carbohydrates are present in the leachate at concentrations up to 30–70 g/L of TC (Patel et al., 2017). This leachate can be used for VFA production without any further treatment (Castilla-Archilla et al., 2021).
The aim of this work was to study the production of VFAs from BSG by two different sludge types, in a continuous high rate EGSB system with a long HRT (36–12 h) and high OLR [10–30 gTC/(L·d)]. Two continuous EGSB systems were used, seeded with the same granular sludge. After seeding, the granular sludge in one reactor was disaggregated by providing a pH shock. This allowed the effects of the microbial selection pressure on the resulting flocculent sludge to be studied. The effectiveness of this strategy for targeted VFA production was determined by monitoring subsequent sludge development and measuring VFA and hydrogen production in both reactors.
Materials and Methods
Origin of Feedstocks
A thermal diluted acid hydrolysate from BSG, described by Castilla-Archilla et al. (2021), was used as feedstock for VFA production. Briefly, BSG at 7% TS concentration (w/w) was mixed with 1.5% sulfuric acid (v/v), and autoclaved at 121°C for 20 min. Two modifications were added in the present work, the remaining solids following hydrolysis were washed with water of an equal volume to the extracted hydrolysate, obtaining a second liquid with a TC concentration between 6 and 8 g/L. This extract was used to dilute the initial feedstock to a final concentration of 15 g/L of TC. In addition, the hydrolysate was centrifuged after neutralization to remove any further precipitate in the liquid fraction. Thus, the feed was mainly composed of 6.5 (±1.4) g/L glucose, 5.5 (±0.4) g/L xylose, 2.8 (±1.0) g/L arabinose and 2.1 (±0.4) g/L proteins.
Once the feedstock was prepared, it was placed in a fridge at 4°C and connected to the inlet of the EGSB reactors. The feedstock was continuously stirred using a magnetic stirrer (Stuart UC151, UK) operated at 1,500 rpm. Initially, the feedstock was replaced every 3 days. However, after the first 2 weeks of operation it was noticed that the TC concentration in the feedstock tank decreased slightly 3 days after preparation. The feedstock was, subsequently, replaced every 2 days and the bottle was closed with a rubber bung to prevent contamination. A needle with a 25 μm filter connected was used to pierce the bung and prevent vacuum formation. Consequently, no further degradation of TC was noticed in the feedstock.
Source of Inoculum
Granular sludge was sourced from an industrial up-flow anaerobic sludge bed (UASB) reactor treating dairy wastewater at ambient temperature and was described previously (Castilla-Archilla et al., 2021).
To study the selection pressure of the EGSB reactor system, two biomass types derived from the same UASB inoculum were studied: flocculent and granular sludge. Both reactors were seeded with the same granular sludge at an inoculum concentration of 1.5 g/L of volatile suspend solid (VSS). Granules in Reactor 1 (R1) were disaggregated into flocculent sludge by increasing the pH from 5.9 to 10.5 for 12 h on day 21, similarly to Kan (2013). In contrast, Reactor 2 (R2) was operated with intact granular sludge during the whole experiment.
Due to a decrease in VFA production in R1 beginning on day 67, the reactor was reseeded with fresh granular sludge on day 81, with the same initial concentration of 1.5 g/L VSS. The fresh granular sludge was added without emptying the reactor, the flocculent sludge already present inside of the reactor was not removed.
Experimental Set-Up
Two EGSB reactors (total volume of 2.27 L; working volume of 1.78 L) were operated under the same conditions (Figure 1). The feedstock was introduced from the bottom of the reactor using a pump (Master-Flex L/S, USA). To keep the up-flow velocity constant, a recycling line was connected from the fourth port of the reactor (70 cm from the bottom) to a connection tube placed below the feed inlet. Reactor mixed liquor was circulated through this line by a pump (Watson-Marlow 323, UK). A gas meter (Omega, USA) was connected to the outlet gas line, with a port for sampling purposes. A Cole-Parmer 300 (China) pH controller, connected to a Master-Flex pump, was used for sodium hydroxide addition (3 M), maintaining the pH at 5.90 (±0.05). The pH probe of the pH controller was placed in the third port from the bottom of the reactor (40 cm) and the NaOH addition tube was connected to the recycling line of the reactor. The temperature was kept at 37°C using a water bath (Grant Instruments TC120).
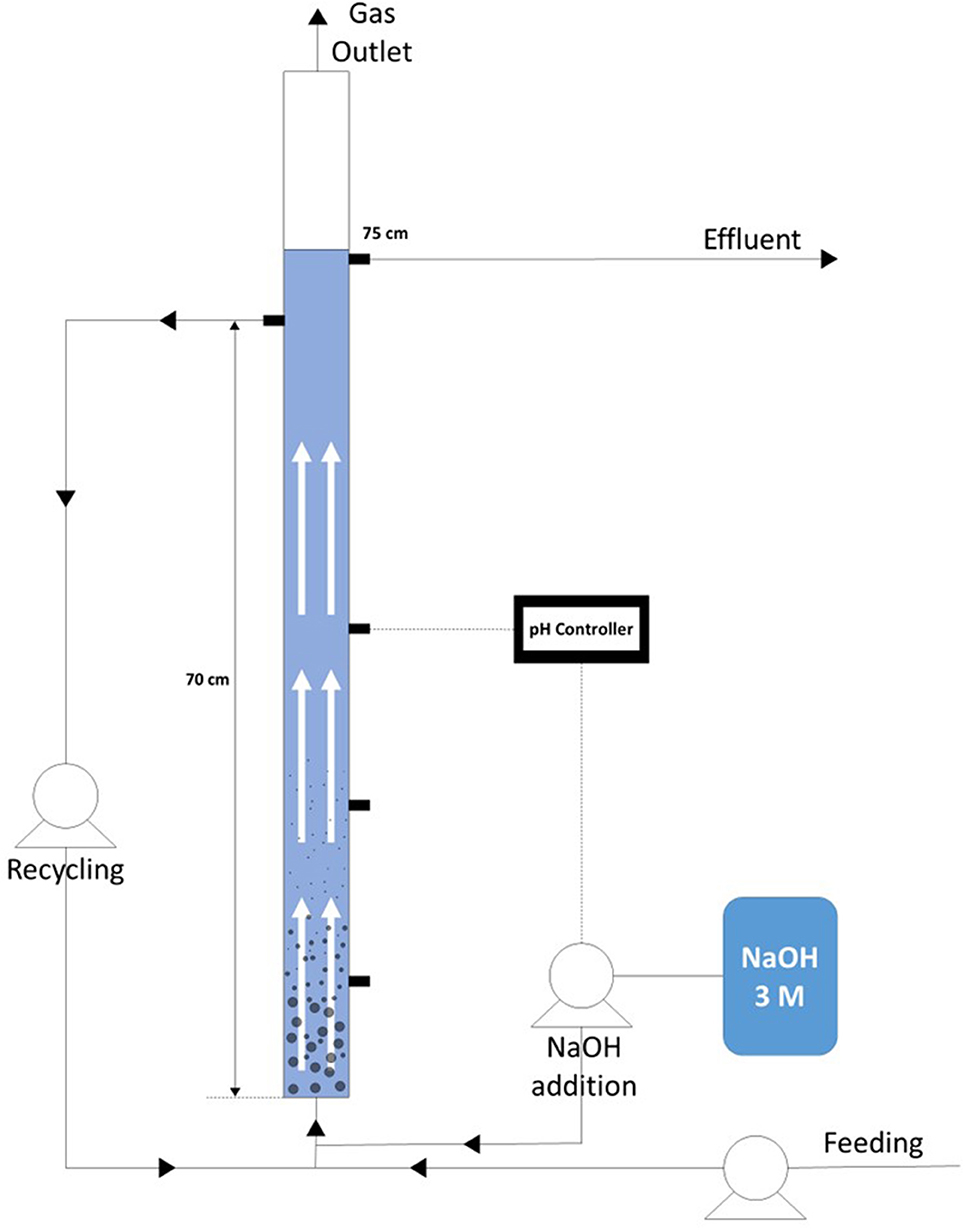
Figure 1. Schematic set up of the EGSB reactor used for the continuous production of VFAs. Pump for the influent supply, recycling pump and base addition (3M NaOH) connected to a pH controller are shown.
Experimental Design
Initially, during the first 12 h of operation, the reactors were operated in batch mode, with a feedstock concentration of 10 g/L TC to allow the acclimatization of the anaerobic granular sludge. After the acclimatization period both reactors were fed with a constant TC concentration of approximately 15 g/L. R1 was started in advance, and 15 days later, R2 was started-up in a similar way. R1 was operated for 108 days and R2 was operated for 93 days. The trial was divided into four different phases in which the HRT was gradually decreased from 36 h (Phase I) to 12 h (Phase IV), as indicated in Table 1. All the changes in the reactor, HRT and up-flow velocity were carried out simultaneously in both reactors.
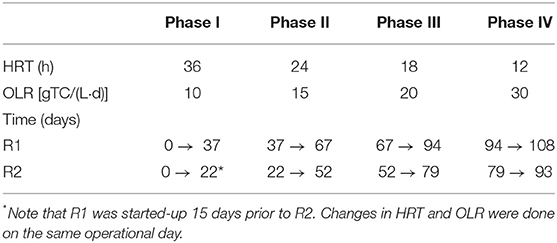
Table 1. Hydraulic retention time and organic loading rate for each of the different phases during the continuous acidogenic fermentation of brewery spent grain hydrolysate using in an expanded granular sludge bed reactor.
The initial up-flow velocity was 6 m/h, which was decreased to 3.0 m/h, at day 29 for R1 and day 14 for R2. A further reduction from 3.0 to 2.0 m/h in R1 (flocculent sludge) and from 3.0 to 2.5 m/h in R2 (granular sludge) was done on days 81 and 66, respectively.
Analytical Methods
Total suspend solids (TSS) and VSS were sampled twice weekly from the effluent and the recycling ports at 70 and 75 cm height, respectively, in order to determine any possible wash-out and biomass flotation within the reactor due to the settleability of the biomass. Samples for chemical analysis were centrifuged at 9,000 rpm for 5 min and the supernatant was filtered using a syringe filter with 0.22 μm pore size. The samples were then frozen for further analysis. TC analysis was performed by the Dubois method (DuBois et al., 1956). Ammonia, sulfate and total proteins were analyzed by using a discrete nutrient analyser (Gallery Plus, ThermoFisher) as described by Castilla-Archilla et al. (2021). The sCOD was analyzed using a continuous Seal Analytical AA3 flow autoanalyser (Norderstedt, Germany) (SEAL, 2019).
VFAs, glucose, xylose, arabinose, lactic acid and ethanol were measured using a 1260 Infinity II liquid chromatograph (Agilent, Germany) equipped with a Hi Plex H 7.7 × 300 mm and 8 μm (p/n PL1170-6830) column (Agilent, UK) kept at 60°C and an RI detector at 55°C. The mobile phase was sulfuric acid with a concentration of 5 mM and a flow rate of 0.7 mL/min (Castilla-Archilla et al., 2021). The composition of the gas in terms of H2, CH4 and CO2 was analyzed by gas chromatography (7890B, Agilant, USA) as reported by Oliva et al. (2020).
Calculations
All gas was converted to standard conditions (1 atm, 273 K). The gas production rate was calculated using the fraction for each of the gases multiplied by the total gas accumulated between two points and divided by the time elapsed (Equation 1) (Mota et al., 2018):
where: VT,n, VT,n−1 are total gas produced at time n and n – 1; YG,n, YG,n−1: fraction of the gas at time n and n – 1; tn, tn−1: time at point n and previous point.
The volumetric gas production rate (VGPR) was calculated by dividing the gas rate production by the working volume of the reactor (Equation 2):
where Vw is the working volume of the reactor.
The hydrogen yield (HY) was considered as the amount of hydrogen (mmol) per amount of the TC consumed (mmol) (Fernández et al., 2011). The molecular weight of the TC was calculated based on the contribution of each of the monosaccharides (Equation 3):
Where, rH2 is the hydrogen production rate (mL/day), (TC) the total carbohydrates concentration, Qf the feeding flow, P.m. the molecular weight for the total carbohydrates, i: the inlet of the reactor and e: effluent of the reactor. This was used to compare how much of the TC was used for hydrogen production in each of the phases.
Results
Total Carbohydrate Fermentation in Acidifying EGSB Reactors
The main fermented compounds obtained in both reactors were acetic acid, butyric acid, propionic acid and ethanol, their concentrations fluctuated in both reactors during the different phases (Figure 2A). In both EGSB systems, propionic acid concentrations decreased when a lower HRT was applied. In R1, acetic acid was the major compound, followed by ethanol, propionic and butyric acid during Phase I. After disaggregation of the granular sludge by increasing the pH, the butyric acid concentration increased and the ethanol and propionic acid concentrations decreased. A similar trend was observed during Phase II until day 50, when butyric acid was the major fermentation product and propionic acid concentrations were much lower than in the previous phase (Figure 2A).
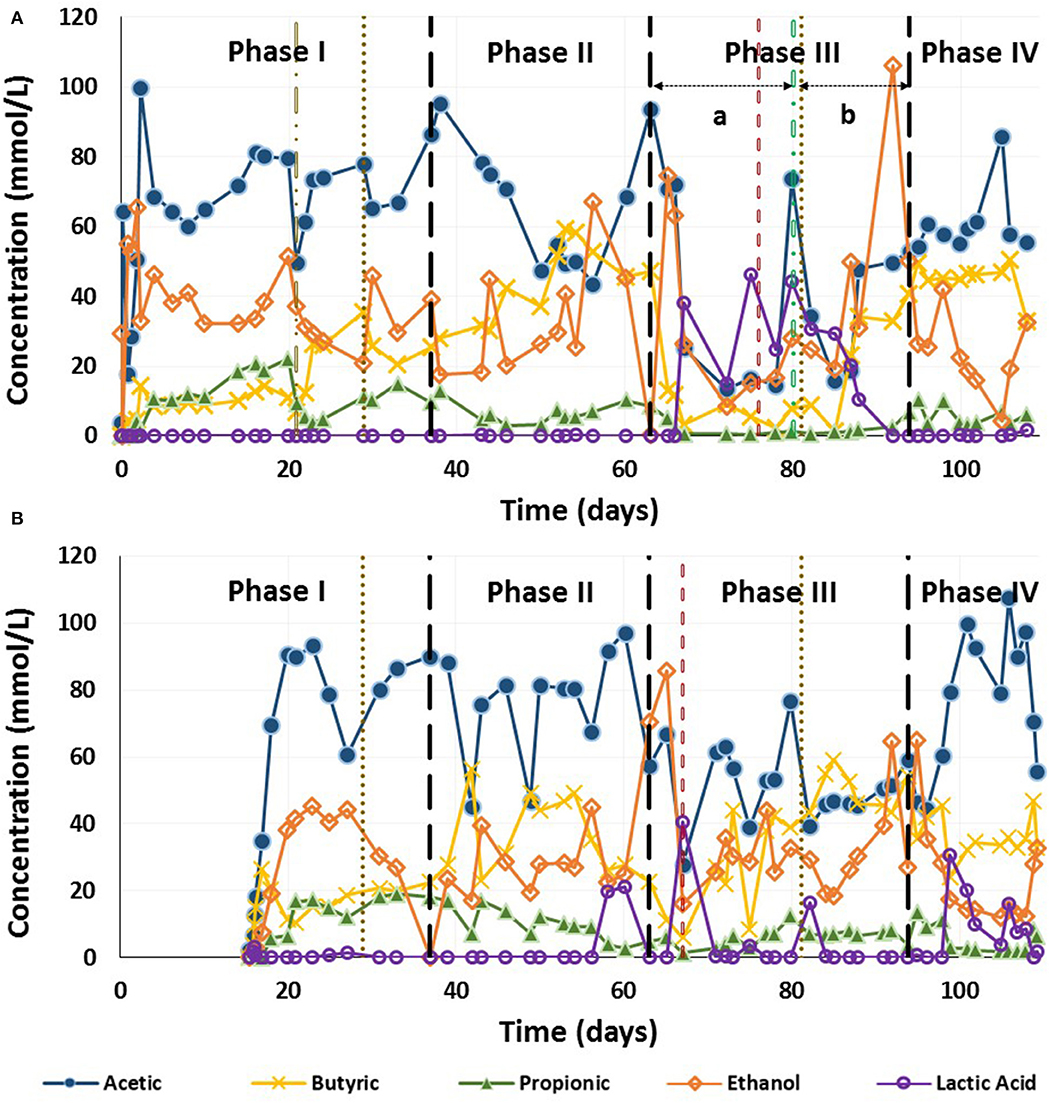
Figure 2. Production of main fermentation compound along the trial for the continuous acidogenesis of brewery spent grain hydrolysate in an expanded granular sludge bed reactor. (A) Reactor 1 (flocculent sludge) and (B) Reactor 2 (granular sludge).  flocculation of the granular biomass;
  change in up-flow velocity;
  change in HRT;
  biomass addition. Note that R2 started 15 days after R1, as an independent system. The changes for the operational conditions were applied simultaneously for both reactors.
Lactic acid was produced in R1 during Phase III, and during periods of instability in R2. In R1, when the OLR was increased on day 66 up to 20 g TC/(L·d) (Phase III), lactic acid became the major product replacing all the other compounds (Figure 2A). On day 80, R1 was reseeded with the same fresh granular sludge and lactic acid was still the major compound until day 86. Subsequently, lactic acid concentrations decreased and were depleted by day 92. At the same time, the concentration of acetic acid, butyric acid and ethanol started to increase 5 days after the reseeding of the reactor. Ethanol achieved its maximum concentration during this phase. By phase IV, butyric and acetic acid became the major fermentation products (Figure 2A).
In R2, the trend was quite similar during each phase, with acetic acid as the major compound throughout its operation (Figure 2B). During Phase III, the pH of R2 dropped to 4.85 on day 52 due to a problem with the NaOH addition pump. As a result of this instabiltity, the lactic acid concentration increased, while the butyric acid and ethanol concentrations decreased (Figure 2B). Lactic acid was detected on some other days, however no pH instabilities or operational problems corresponded with these peaks. During Phase-III the acetic acid concentration increased until the upflow velocity was reduced from 3.0 to 2.0 m/h on day 66, resulting in a decrease in acetic concentration from 76.5 to 39.2 mmol/L (Figure 2B). Acetic acid then fluctuated with butyric acid and ethanol as the major compound, throughout Phase III. Acetic acid was once again the major compound in Phase IV (Figure 2B).
Both reactors performed similarly in terms of the TC reduction, which exceeded 98% during all phases. The total amount of ethanol, acetic acid, butyric acid and propionic acid remained almost constant throughout the trial (Figure 3), except when lactic acid became the major product, during periods of instability such as the beginning of Phase III in R1 until 5 days after the reactor was reseded (days 63–85) (Figure 2A). During this period, when lactic acid was the major product, the combined concentration of ethanol, acetic acid, butyric acid and propionic acid decreased from day 67 to day 87 (Figure 3). In addition, both reactors presented similar fluctuations between the main fermentation products.
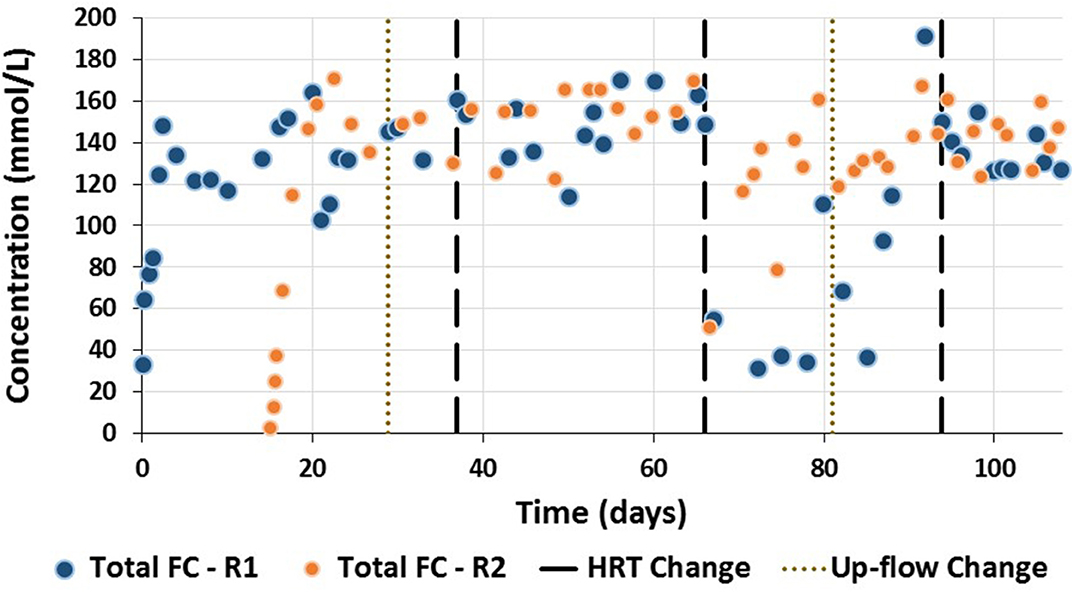
Figure 3. Total concentration of the fermentation products (acetic acid, propionic acid, butyric acid and ethanol) for R1 and R2 during the continuous acidogenic fermentation of brewery spent grain hydrolysate in expanded granular sludge bed reactors. Note that R2 started 15 days after R1. The changes for the operational conditions were applied simultaneously for both reactors (see Table 1).
Biomass Behavior
Flocculent Sludge (R1)
R1 was initially operated for 3 weeks with intact granular sludge before granules were disaggregated by increasing the pH on day 21 for 12 h. During these initial 3 weeks, some changes in the biomass characteristics were observed. The granules, which were initially black, compact and spherical, began to peel (Figure 4A), resulting in the formation of gray flocculent sludge. By day 9, the sludge bed had three different stratified layers despite the upflow velocity in the reactor being 6 m/h (Figure 4B). The bottom layer was composed of black granular sludge similar in appearance to the seed sludge. The top layer was mostly gray-brown flocculent sludge, with some aggregates. The intermediate layer consisted of black granules coated with flocculent biomass, similar to that of the top layer. By day 15, further disaggregation of the new gray-brown aggregates in the top layer occurred and the black granules in the middle layer were no longer covered by the gray flocculent sludge (Figure 4C), resulting in the wash-out of some of this biomass. Initially, the VSS concentration in the recycling and effluent lines was lower than 2 g VSS/L. After natural disaggregation of the new aggregates, this increased to above 6.0 g VSS/L on day 18 (Figure 5).
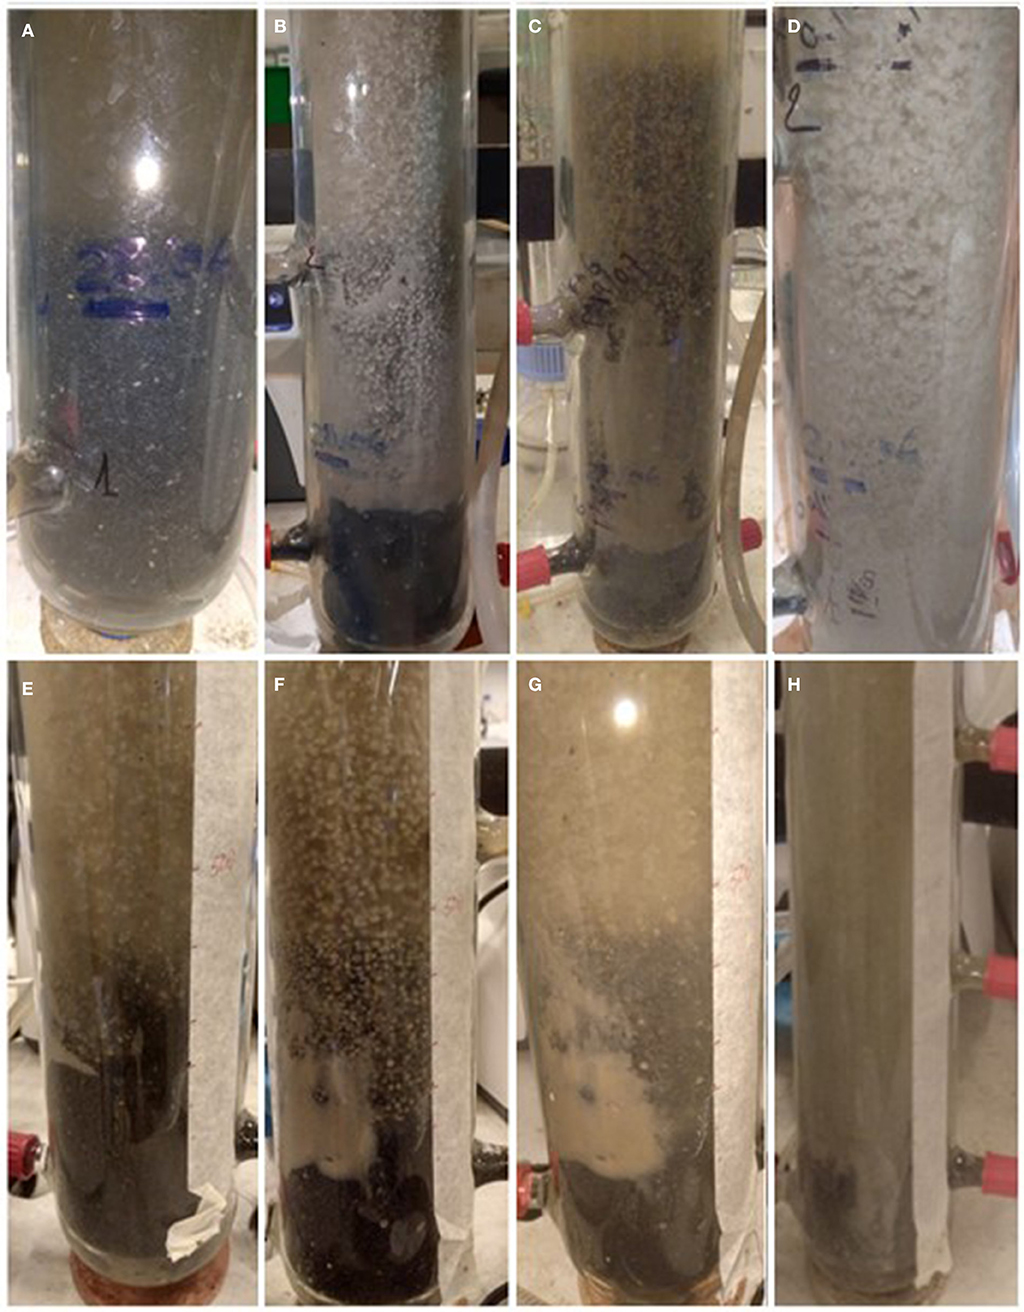
Figure 4. Granular sludge development in an EGSB reactor aimed at acidogenesis of brewery spent grain hydrolysate. (A–D) corresponds to Reactor 1 (R1) and (E–H) corresponds to Reactor 2 (R2). (A) R1 day 0, the fresh granular sludge (inoculum); (B) R1 day 9, three different layers in the sludge bed; (C) R1 day 19, the granular sludge and the new flocculent sludge prior pH disaggregation; (D) R1 day 30, flocculent sludge after the pH disaggregation. (E) R2 day 4, granular sludge and new flocs; (F) R2 day 13, three layers within the sludge bed; (G) R2 day 16, granular sludge and flocs after natural disaggregation; and (H) R2 day 40, two different layers in the sludge bed with granular sludge at the bottom and flocculent sludge on top.
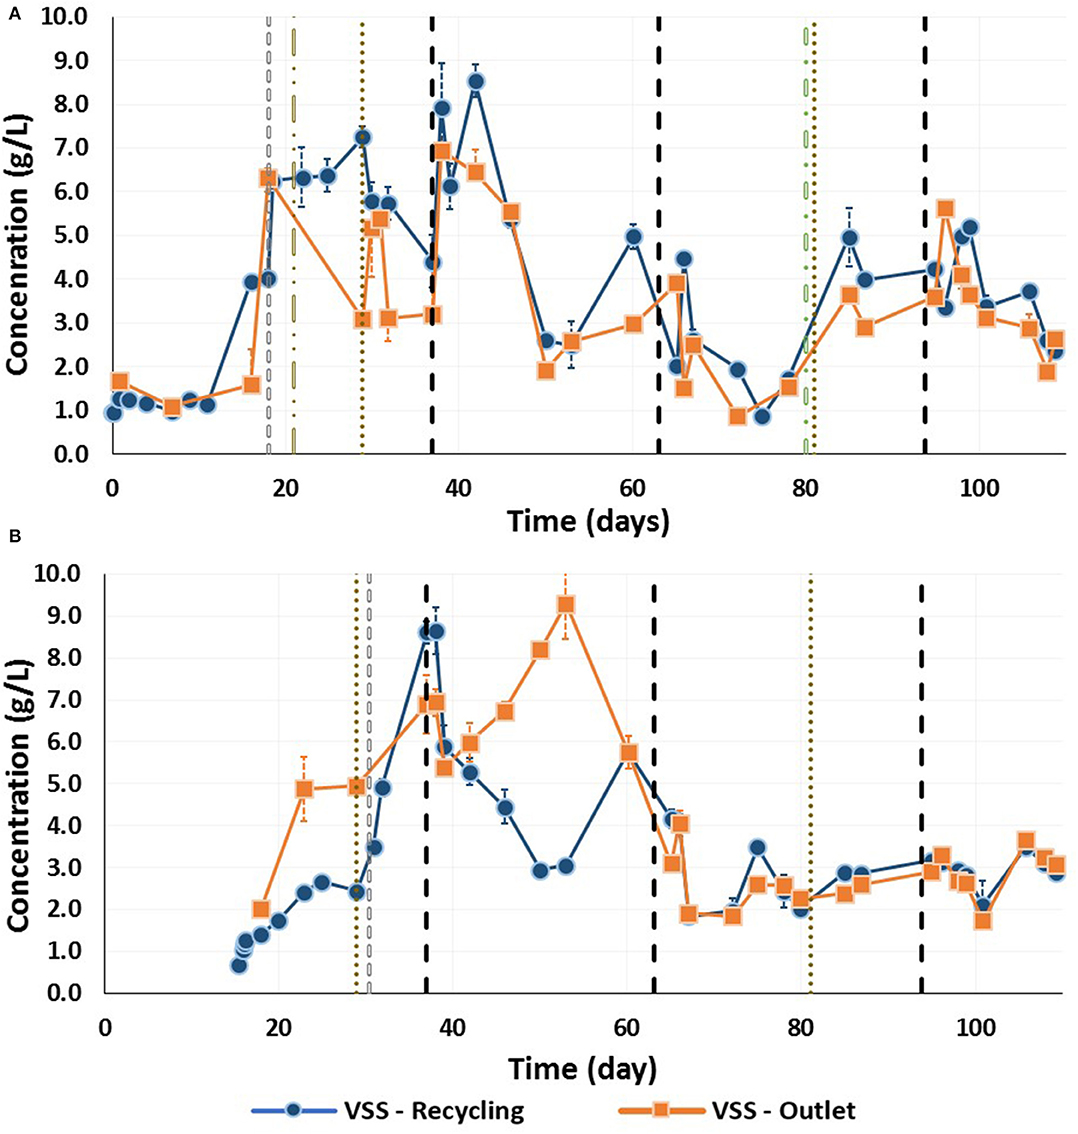
Figure 5. Volatile suspended solids in the recycling and effluent sampling ports during the continuous acidogenic fermentation using brewery spent grain leachate in an expanded granular sludge bed reactor throughout the trial for (A) Reactor 1 (flocculent sludge), and (B) Reactor 2 (granular sludge) ( natural disaggregation of the new gray biomass; flocculation of the granular biomass by pH increase;
  up-flow changes;
  HRT changes; biomass addition). Note that R2 started 15 days after R1. The changes for the operational conditions were applied simultaneously for both reactors (see Table 1).
To fully disaggregate the remaining granules in R1, the pH was increased to 10.5 for 12 h on day 21. Subsequently, all granules were disintegrated and only flocculent sludge was present in R1 (Figure 4D). On day 29, the up-flow velocity was decreased from 6 to 3 m/h, which resulted in a reduction in the VSS content in the recycling and effluent lines (Figure 5A). When the HRT was further shortened from 36 to 24 h (Phase II), the VSS concentration in the effluent ports increased, to reach its highest concentration of over 8 g VSS/L. Beyond this point the VSS concentration decreased, with the lowest values in Phase III-a [0.87 (±0.03) and 0.86 (±0.11) g VSS/L for the recycling and effluent lines, respectively]. On day 80 due to low VFA production, R1 was reseeded with granular sludge. The up-flow velocity was decreased on day 81 to 2 m/h. The VSS during the end of this Phase III-b was around 4.0 and 3.6 g VSS/L in the recycling and effluent lines. Finally, during Phase IV the VSS in both sampling ports decreased to a similar value of 2.6 g VSS/L (Figure 5A).
Intact Granular Sludge (R2)
R2 was seeded with the same granular sludge, which developed in a similar manner to R1 for the first 15 days of operation, i.e., the granular sludge peeled and flocculent sludge of a lighter color appeared in the upper part of the sludge bed (Figure 4E). This flocculent sludge started to form aggregates and cover some of the original black granular sludge, which resulted in three layers in the bed of the reactor: (i) black granules at the bottom, (ii) black granular sludge covered by the flocculent sludge in the middle section, and (iii) new aggregates and granules of gray-brown color formed at the top section of the bed sludge (Figure 4F). The VSS concentration in the recycling line increased from 0.67 (±0.01) g VSS/L on day 0 to 2.44 (±0.01) g VSS/L on day 13.5 (Figure 5). In order to prevent disaggregation of the newly formed aggregates due to the shear forces, the up-flow velocity was changed from 6 to 3 m/h. Nevertheless, the biomass followed a similar trend to R1, and on day 15 the new gray flocculent sludge coating the black granules, as well as the new aggregates and granules with a lighter color were naturally disaggregated (Figure 4G). This resulted in an increase in the VSS concentration in the effluent and to a greater extent, the recycle line (Figure 5B).
For the remainder of the trial, the bottom of the sludge bed in R2 was composed of mainly black granules. The top section was composed of flocculent sludge and the middle section of a mixture of both (Figure 4H). The flocculent sludge bed section expanded through Phase I and by Phase II reached the recycle line. However, the VSS content in the effluent was higher during Phase I, with the highest concentration corresponding to 9.30 (±0.85) g VSS/L. When the HRT was decreased to 18 h the VSS content in both the effluent and recycle lines decreased until the end of the trial (Figure 5).
Gas Production
H2 and CO2 were the major components of the biogas (Figure 6). At the beginning of the trial, methane was detected in both reactors until day 21 in R1 and day 19 in R2 (Figures 6A,B). Methane was also detected in R2 from day 55 to 57, albeit below quantification level as the signal during GC analysis was below the lower standard value (5%). Following the reseeding of R1 on day 81, methane was detected between days 88 and 90 at a concentration of 7%. Prior to this, H2 was the major compound of the total biogas and no methane was detected. For all other gas phase samples in both reactors methane was below than the detection limit.
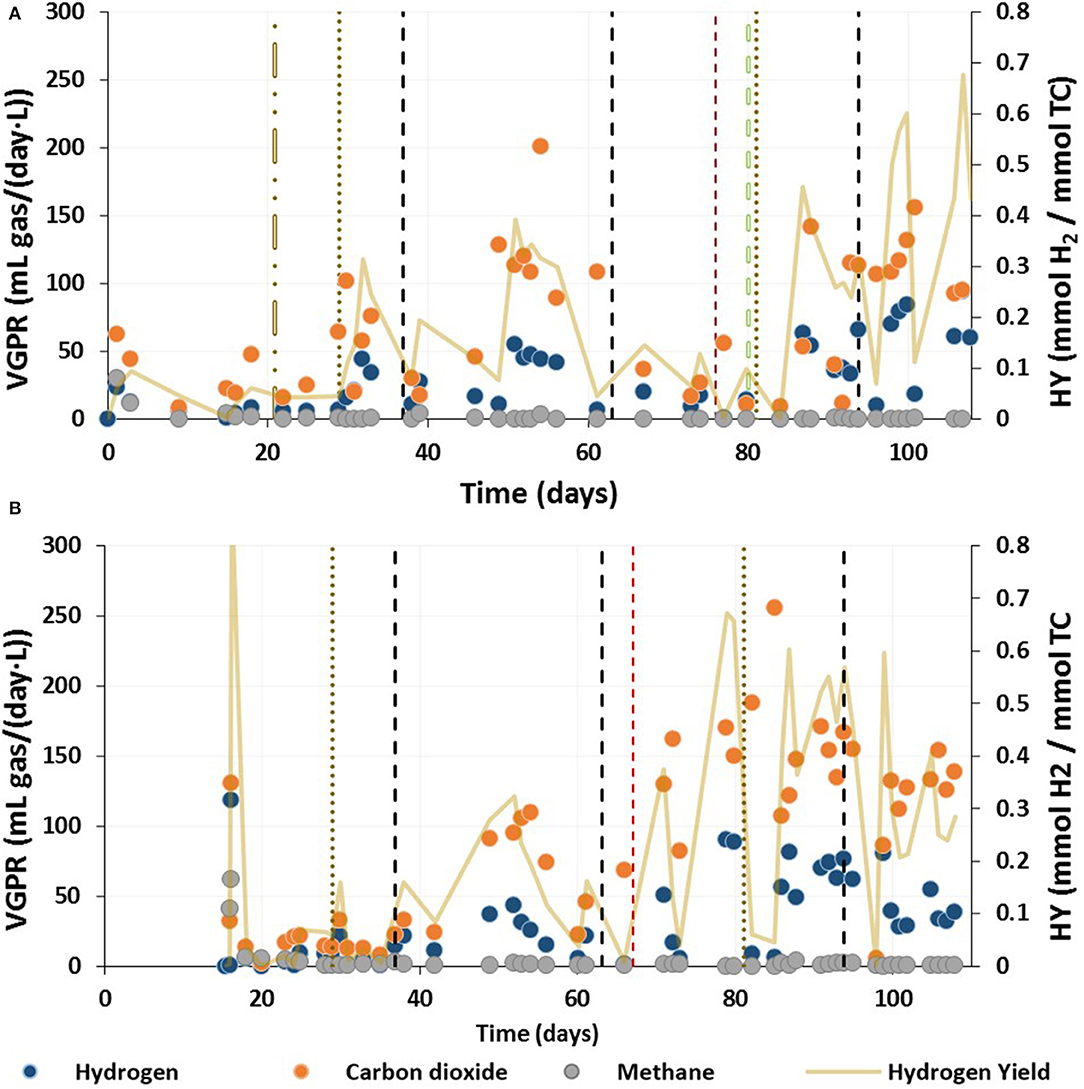
Figure 6. Volumetric gas production and hydrogen yield during the continuous acidogenic fermentation of brewery spent grain leachate in an expanded granular sludge bed reactor for (A) Reactor 1 (flocculent sludge) and (B) Reactor 2 (granular sludge). VGPR, Volumetric Gas Production Rate; HY, Hydrogen Yield. Note that R2 started 15 days after R1. The changes for the operational conditions were applied simultaneously for both reactors (see Table 1).
Generally, in R1, the VGPR increased when operating at a lower HRT (Figure 5A). Although during Phase III the VGPR decreased until the reactor was reseeded, after which, the VGPR increased. In R2, the gas production was more stable for Phase I than Phase III, when the VGPR increased with decreasing HRT (Figure 5B). The highest VGPR and HY were achieved during Phase III before reducing the up-flow velocity from 3.0 to 2.5 m/h. By Phase IV, the VGPR and HY decreased further until the end of the trial (Figure 5B).
Sulfate and Nitrogen Compounds
The highest sulfate effluent concentration occurred during Phase I in both reactors (Figure 7). In R1, the sulfate concentration decreased during Phase II and the sulfate removal efficiency was 50.9%. When the HRT was decreased to 18 h, the sulfate concentration increased. The final sulfate removal efficiency was 29.5% at the end of the trial (HRT = 12). For R2, the sulfate concentration decreased at the end of Phase I and during Phase II. The lowest sulfate concentration was achieved during Phase III, with a sulfate removal efficiency corresponding to 29.1%.
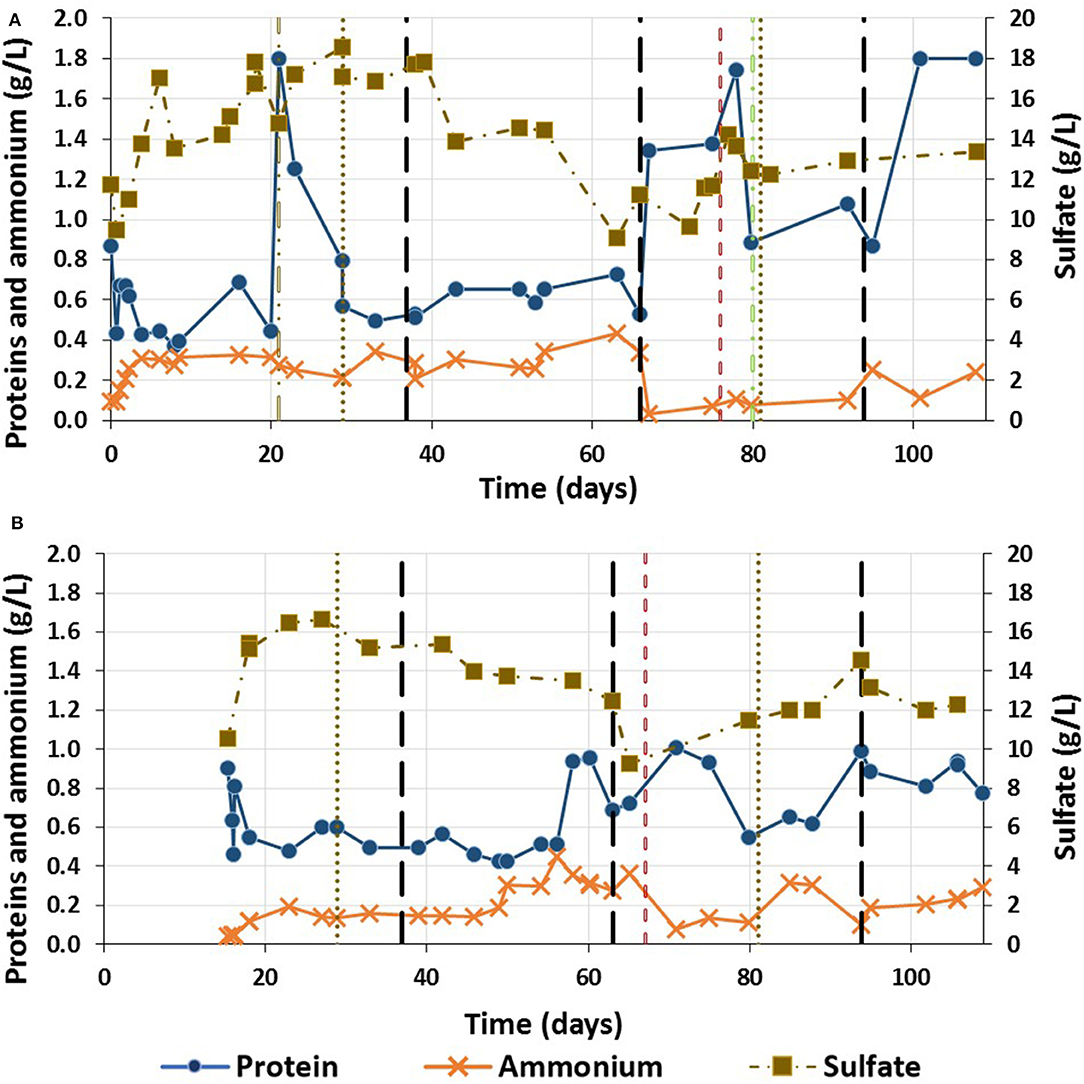
Figure 7. Sulfate, protein and ammonium concentration during the continuous acidogenic fermentation using brewery spent grain leachate in and expanded granular sludge bed reactor along the trial in (A) Reactor 1 (flocculent sludge) and (B) Reactor 2 (granular sludge)( flocculation of the granular biomass; up-flow changes; HRT changes; biomass addition). Note that R2 started 15 days after R1. The changes for the operational conditions were applied simultaneously for both reactors (see Table 1).
The protein concentration in R1 during Phase I fluctuated between 0.4 and 0.6 g/L, increasing up to 1.8 g/L during the disaggregation of the granular sludge (Figure 7A). During Phase II, the protein concentration slightly increased, with a protein removal efficiency of 72.5 (±4.7) %. During Phase III-a, the protein removal efficiency decreased to between 36.5 and 17.6%, before increasing again after reseeding. On the other hand, the ammonium concentration during this phase decreased and did not increase again for the rest of the trial. In R2, the protein concentration was stable in the effluent from day 2.5 until ~day 41, with average protein concentrations of 0.51 (±0.06) g/L. On day 43 the protein removal efficiency was lower with a higher effluent concentration (Figure 7B), along with the production of lactic acid as a result of a period of instability. The ammonium concentration was only stable until day 30 (Figure 7B). On day 33, the ammonium concentration started to increase to its highest concentration (0.44 g/L) on day 41 (Figure 7B).
Discussion
Conversion of Carbon Compounds
This study demonstrated the production of VFAs using granular and flocculent anaerobic sludge, without pre-treatment, from thermal acid hydrolysate of brewery spent grain. The use of granular sludge (R2) resulted in stable VFA production, with the highest production, 120.4 (±15.0) mmol/L (total VFAs), at a HRT of 24 h. On the other hand, the flocculent sludge reactor (R1) had poorer performance, as operating the system at a HRT of 18 h suppressed VFA production.
Many studies have focused on the production of hydrogen as the main product of dark fermentation, without optimisation for VFA production. In addition, many report the average VFA value and not the continuous VFA production (Pugazhendhi et al., 2017; de Menezes and Silva, 2019; Rodríguez-Valderrama et al., 2019). In all these studies, and the present study, a decrease in HRT resulted in higher butyric acid production and lower total VFA production. Pugazhendhi et al. (2017) obtained the highest VFA production, a mixture of acetic, butyric and propionic acid, at a HRT of 3 h using glucose as feedstock in a fixed bed reactor (Table 2). On the other hand, the highest HY occurred at a 1.5 h HRT with an increase in the butyric acid concentration and a decrease in overall VFA production (Pugazhendhi et al., 2017). Furthermore, in the present study, operating the system at longer HRT (36 h) resulted in a higher yield in terms of VFA production as a function of TC consumed: 1.28 (±0.13) and 1.38 (±0.13) mmol VFA/mmol TC, respectively, R1 and R2.
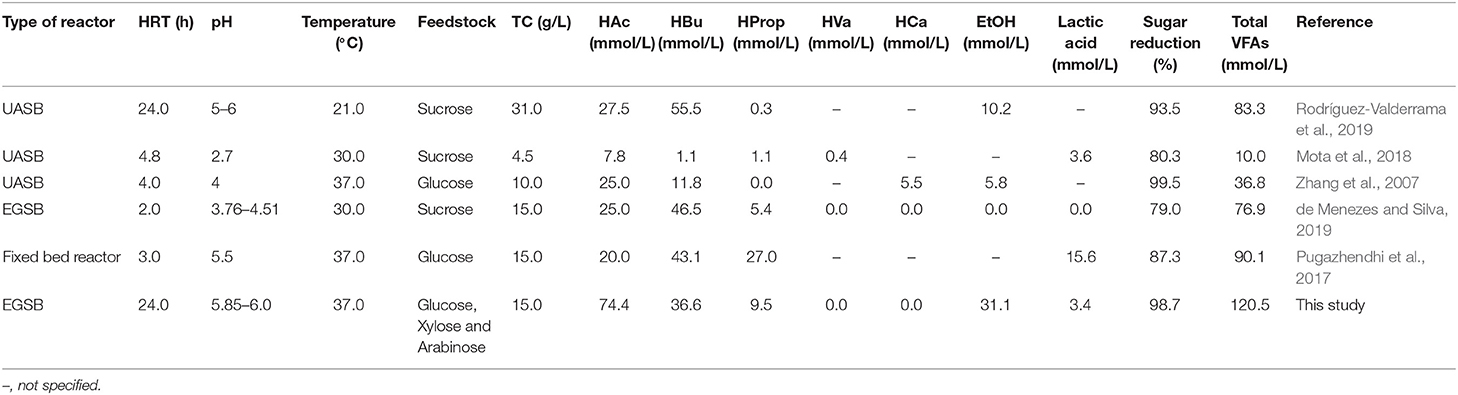
Table 2. Optimal conditions for volatile fatty acids production in different high rate reactors.
Similar results to the present study were obtained by de Menezes and Silva (2019), when working at the same TC concentration (15 g/L) (Table 2). Furthermore, in that study, a lower TC inlet concentration led to a larger range of VFAs (de Menezes and Silva, 2019). Moreover, in the present study, the range of the VFAs increased as the propionic acid concentration increased at a longer HRT (Figure 2). Zhang et al. (2007) obtained a more complex mixture of fermented compounds (e.g., ethanol, acetic, propionic, butyric and caproic acid) when using a 4 h HRT vs. 1 h. At the lower HRT, the total amount of VFAs decreased and the butyric acid concentration increased, meanwhile the other compounds diminished (Zhang et al., 2007).
Rodríguez-Valderrama et al. (2019) operated a reactor at 21°C under different HRTs (4, 12, and 24 h), but kept the OLR constant by varying the COD inlet concentration. The authors pre-treated the biomass by rinsing with sterilized isotonic solution and heating at 90°C for 1 h to inhibit methanogens and improve the hydrogen production. The major fermented compounds produced were acetic acid and butyric acid, representing more than 93% of the total fermented compounds under all conditions investigated. Nevertheless, the total amount of VFAs reached by Rodríguez-Valderrama et al. (2019) was lower than in the present work (Table 2).
Regardless of the biomass type, either flocculent or granular, the total fermented compounds were similar for both reactors, in contrast to previous studies using granular and flocculent sludge (Atasoy et al., 2019). Atasoy et al. (2019) used granular and flocculent sludge from different processing stages of a municipal wastewater treatment plant. The similar total VFA concentrations for both biomass types in the present study could be as a result of using the same inoculum for both reactors.
Kan (2013) used different biomass pretreatment methods to enhance hydrogen production, including heat treatment which suppressed the activity of some homoacetogens and base pre-treatment (pH 10.0), which led to a larger range of VFAs produced. Many studies pre-treated the inoculum to enhance the hydrogen production (Zhang et al., 2007; Larriba et al., 2016; Pugazhendhi et al., 2017; de Menezes and Silva, 2019; Rodríguez-Valderrama et al., 2019), however the highest VFA production they achieved was lower than in the present study (Table 2). In addition, any studies that reported VFA production resulted in similar fluctuations for the individual fermented compounds (Cisneros-Pérez et al., 2017; Mota et al., 2018; Muñoz-Páez et al., 2020). These fluctuations could be the result of metabolic fluxes caused by stress responses of fermentative organisms to the continuous accumulation of fermented compounds (Saady, 2013; Ciranna et al., 2014; Regueira et al., 2018). Therefore, to avoid this fluctuation and allow targeted production of desired products, further research on the metabolic pathways of fermentation is required, e.g., through metabolic flux modeling (Regueira et al., 2018, 2020).
Almost all previous studies (Table 2) created a high OLR by decreasing the HRT, whereas only a few have tried to operate the system at high OLR by increasing the total carbohydrate. This high TC approach was followed by Zhang et al. (2008), who operated a reactor with HRTs ranging from 0.25 to 3 h, and glucose concentrations from 5 to 120 g/L. Combinations of HRTs of 1.5 h with 60 g/L and 2 h with 80 g/L led to a glucose consumption exceeding 80 and 90%, respectively. Meanwhile, the optimal conditions for gas production were at HRTs of 0.25, 0.5, and 0.75 h. The longer HRT could have been beneficial for the accumulation of a high concentration of fermented compounds rather than hydrogen production, however the VFA production was not reported by Zhang et al. (2008).
Aside from the periods of instability, with lactic acid production, the VGPR throughout the trial increased as the HRT was reduced. This is in line with other studies that demonstrated increased hydrogen concentrations and HY at low HRT (Zhang et al., 2007; Cisneros-Pérez et al., 2017; de Menezes and Silva, 2019). In addition, in these and the present study, propionic acid concentrations decreased. The decrease in HRT resulted in metabolites remaining inside of the system for a shorter period, which contributed to an increase in HY but a decrease in the concentration of compounds originating from hydrogen scavengers, such as propionic acid (Cord-Ruwisch et al., 1988; Saady, 2013). Thus, the uptake of hydrogen or intermediate metabolites by the scavengers was slower than the hydrogen production rate, resulting in a higher hydrogen release. Therefore, the use of a longer HRT is beneficial for the VFA production. Likewise, the decrease of the sulfate concentration would be related to a higher activity of the sulfate reducing bacteria, which convert sulfate into hydrogen sulfide (Papirio et al., 2013). The presence of propionic acid at the largest HRT in both systems could have resulted in a low sulfate reduction efficiency (Bertolino et al., 2012). Moreover, as sulfate reducing bacteria are hydrogen scavengers, the increase of the hydrogen availability in the media could have contributed to their development.
Performance and Selection Pressure of the Flocculent (R1) and Whole Granular (R2) Sludge Reactors
The anaerobic granular sludge used as inoculum was from an industrial reactor operated for methane production (Castilla-Archilla et al., 2021). Thus, some methane production was expected. The operational conditions showed, nevertheless, to be adequate to suppress methane production with no need for biomass pre-treatment. Methane was detected in both reactors from the beginning of the trial until day 21 and 29 in R1 and R2, respectively (Figure 6). On the other hand, the highest VFA concentrations were obtained on day 3 and 4, in R1 and R2, respectively. High concentrations of VFAs with an acidic pH in the liquor can trigger methane inhibition, resulting in VFA accumulation (Agler et al., 2013; Lu et al., 2015). This could explain the decrease in volumetric methane production rate after 72 h (Figure 6), when total VFA concentrations reached 115.56 and 108.5 mmol/L, in R1 and R2, respectively. The remaining methane production could be a result of accumulation and subsequent release of gas inside of the granules (Lens et al., 1993; Wang and Liang, 2016).
During Phase III-a, R1 started to produce lactic acid and the total VFA and ethanol concentrations decreased from day 67 to day 80, when the average total VFA concentration was 23.04 (±4.60) mmol/L (Figure 2A). Despite the low VFA concentration no methane was detected during this period, which could have been a result of the wash-out of methanogens from the reactor due to the flocculent nature of the sludge and the low growth rates of the methanogens (Lim et al., 2020). A similar outcome was reported by Palomo-Briones et al. (2017) when using flocculent sludge in a continuous stirred tank reactor operated at a long HRT (24 h). This enriched the biomass for lactic acid production by causing washout of acidogenic microorganisms (Palomo-Briones et al., 2017). Indeed, the wash-out strategy is effective in enriching hydrogen producing bacteria, when using flocculent sludge without additional treatment (Carrillo-Reyes et al., 2016). de Menezes and Silva (2019) used thermally treated blended granular sludge and obtained lactic acid as the major product, which was favored by increasing the inlet carbohydrates concentration coupled to longer HRTs (de Menezes and Silva, 2019). Approximately 1 week after reseeding, methane was detected on day 88 with a simultaneous increase in the VFA concentration (Figures 2A, 3A). This could be explained by a lag phase for the fresh granular sludge to acclimatize to the conditions in the reactor, with a pH close to 6.0 and high concentrations of lactic acid. In addition, as the flocculent sludge prior reseeding was left in the reactor, this sludge was adapted to the medium. Thus, initially the flocculent sludge would have had a higher carbohydrate uptake, favoring lactic acid production, whereas the granular sludge would have produced VFAs and methane. Once the VFA concentration increased, methane production ceased again, probably because the inhibitory threshold concentration for methanogens was reached again (Agler et al., 2013).
During periods of instability in R2, methane was detected at low concentrations in the biogas (<5%). This could be as a result of the reduction of the VFA concentrations in the reactor mixed liquor during the production of lactic acid. Therefore, the decrease of the VFA concentration observed on day 51 would have allowed the methanogens to become active again, accounting for the methane production observed on day 55. The role of the selection pressure in the present study would have been different for each of the reactors based on the sludge type, flocculent (R1) and granular (R2). The development of flocculent sludge in R1 led to wash-out, not only of methanogens but also of other bacteria beneficial for hydrogen and VFA production present at Phase I and II. However, during Phase III the operational conditions promoted lactic acid production over VFAs (Figure 2A). Granulation protects the microbial community within the granules from inhibitors present in the media and improves biomass retention in reactors (Lu et al., 2015). Therefore, the granular sludge in R2 may have protected some of the methanogens, which became active again when the conditions of the reactor mixed liquor were favorable. This could explain the methane production inside of the reactor when the VFA concentrations were low enough to promote methanogenesis. Additionally, it may be possible that some bacteria within the granules were still growing, and were continually replacing other bacteria which were sloughed off the granule surface and washed out. Therefore, the granular sludge could have acted as a carrier material (de Menezes and Silva, 2019) and source of bacteria to replace the washed-out fraction. The use of the anaerobic granular sludge without pretreatment can be more beneficial for the production of VFAs. Especially as the operational conditions demonstrated to prevent the production of methane (Figure 6).
Aggregation and Disaggregation of the Biomass
In both systems the biomass initially had a similar behavior, where new biomass with a gray color developed (Figure 4). Similar changes of color have been related with the development of granular biomass for hydrogen production (Fang et al., 2002). Thus, this may have been the result of the growth and development of acidogenic and hydrogen producing organisms favored by the operational conditions in the reactor, e.g., lower pH, higher temperature and higher organic content. Despite reducing the upflow velocity in R2 to prevent disaggregation, the newly formed gray aggregates in the stratified sludge bed (Figure 4F), and the gray coating on the original black granules broke apart. A similar effect was reported by Muñoz-Páez et al. (2020) when using agave bagasse hydrolysate for hydrogen production. Initially, their reactor was fed using glucose and xylose, once agave hydrolysate was used as feedstock, the granules started to break down (Muñoz-Páez et al., 2020). The authors attributed this to the spatial distribution of microbes in the granules and the change of the substrate.
In the present study, between the formation and disaggregation of the new granules there was no change in any of the operational conditions (i.e., HRT, pH or change of substrate). Additionally, no significant changes in the appearance of the black granular sludge in the bottom layer were observed. Therefore, this could be a result of the development of a new, predominantly acidogenic microbial community on the surface of some of the seed biomass in the middle of the sludge bed and in the new, flocculent biomass on top of the sludge bed. Acidogenic organisms often grow as filamentous outgrowths on the surface of methanogenic granules and as flocculent biomass in the reactor liquor (Guiot et al., 1992; Arcand et al., 1994; McHugh et al., 2003; Batstone et al., 2004; McAteer et al., 2020). It may be the case that the flocculent biomass in the present study consisted of acidogenic organisms, which used the outer layers of the methanogenic granules for attachment until some conditions changed and the flocculent sludge became loose. For example, the loss or change in extracellular polymeric substances production which contribute to the adhesion of the biomass (Lu et al., 2015). However, more studies on the microbial community composition, EPS type and role of the acidifiers in aggregation are required to determine the changes in biomass composition and their role in stability improvement.
Conclusion
This study demonstrated the feasibility for the production of VFAs using a high rate system with BSG leachate as feedstock. No pretreatment to the biomass was required as the operational conditions minimized or suppressed methanogenesis, with the production and accumulation of VFAs. The use of granular sludge resulted in more stable VFA production compared to flocculent sludge, which produced lactic acid when the HRT was 18 h. Operating the system at 24 h HRT allowed a maximum VFA production of 120.4 (±15.0) mmol/L, which contributed approximately 83.4% (±5.9) of the soluble COD. Further research is required to optimize this process and convert it from simply a wastewater treatment processes into a combined wastewater treatment-chemical production bioprocesses.
Data Availability Statement
The original contributions generated for the study are included in the article/supplementary material, further inquiries can be directed to the corresponding author/s.
Author Contributions
JC-A, PL, SM, and GC contributed to conception and design of the study. JC-A and JHe organized the data based and interpretation of the data. JC-A, JHe, and JHi managed the reactors. JC-A and SM wrote the original draft of the manuscript. All authors contributed to manuscript revision, read, and approved the submitted version.
Funding
The internship of JHe and JHi were provided through the Deutscher Akademischer Austauschdienst (DAAD) RISE Worldwide fellowship. This research emanated from the Science Foundation Ireland (SFI) Research Professorship Programme Innovative Energy Technologies for Biofuels, Bioenergy and a Sustainable Irish Bioeconomy (IETSBIO3, Award Number 15/RP/2763) and the Research Infrastructure research grant Platform for Biofuel Analysis (Grant Number 16/RI/3401).
Conflict of Interest
The authors declare that the research was conducted in the absence of any commercial or financial relationships that could be construed as a potential conflict of interest.
Abbreviations
BSG, brewery spent grain; COD, chemical oxygen demand; EGSB, expanded granular sludge bed reactor; HY, hydrogen yield; HRT, hydraulic retention time; OLR, organic loading rate; rG, gas production rate; R1, reactor 1; R2, reactor 2; TC, total carbohydrates; TSS, total suspended solids; UASB, up-flow anaerobic sludge bed; VFA, volatile fatty acid; VGPR, volumetric gas production rate; VT, total gas produced; VSS, volatile suspended solids; VW, working volume; YG, fraction of the corresponding gas.
References
Agler, M. T., Spirito, C. M., Usack, J. G., Werner, J. J., and Angenent, L. T. (2013). Development of a highly specific and productive process for n-caproic acid production: applying lessons from methanogenic microbiomes. Water Sci. Technol. 69, 62–68. doi: 10.2166/wst.2013.549
Arcand, Y., Guiot, S. R., Desrochers, M., and Chavarie, C. (1994). Impact of the reactor hydrodynamics and organic loading on the size and activity of anaerobic granules. Chem. Eng. J. Biochem. Eng. J. 56, B23–B35. doi: 10.1016/0923-0467(94)87028-4
Atasoy, M., Eyice, O., Schnürer, A., and Cetecioglu, Z. (2019). Volatile fatty acids production via mixed culture fermentation: revealing the link between pH, inoculum type and bacterial composition. Bioresource Technol. 292:121889. doi: 10.1016/j.biortech.2019.121889
Batstone, D. J., Keller, J., and Blackall, L. L. (2004). The influence of substrate kinetics on the microbial community structure in granular anaerobic biomass. Water Res. 38, 1390–1404. doi: 10.1016/j.watres.2003.12.003
Bertolino, S. M., Rodrigues, I. C. B., Guerra,-S.á, R., Aquino, S. F., and Leão, V. A. (2012). Implications of volatile fatty acid profile on the metabolic pathway during continuous sulfate reduction. J Environ Manage. 103, 15–23. doi: 10.1016/j.jenvman.2012.02.022
Carrillo-Reyes, J., Cortés-Carmona, M. A., Bárcenas-Ruiz, C. D., and Razo-Flores, E. (2016). Cell wash-out enrichment increases the stability and performance of biohydrogen producing packed-bed reactors and the community transition along the operation time. Renewable Energy 97, 266–273. doi: 10.1016/j.renene.2016.05.082
Castilla-Archilla, J., Papirio, S., and Lens, P. N. L. (2021). Two step process for volatile fatty acid production from brewery spent grain: hydrolysis and direct acidogenic fermentation using anaerobic granular sludge. Process Biochem 100, 272–283. doi: 10.1016/j.procbio.2020.10.011
Ciranna, A., Ferrari, R., Santala, V., and Karp, M. (2014). Inhibitory effects of substrate and soluble end products on biohydrogen production of the alkalithermophile Caloramator celer: kinetic, metabolic and transcription analyses. Int. J. Hydrog. Energy 39, 6391–6401. doi: 10.1016/j.ijhydene.2014.02.047
Cisneros-Pérez, C., Carrillo-Reyes, J., Celis, L. B., Alatriste-Mondragón, F., Etchebehere, C., and Razo-Flores, E. (2015). Inoculum pretreatment promotes differences in hydrogen production performance in EGSB reactors. Int. J. Hydrog. Energy 40, 6329–6339. doi: 10.1016/j.ijhydene.2015.03.048
Cisneros-Pérez, C., Etchebehere, C., Celis, L. B., Carrillo-Reyes, J., Alatriste-Mondragón, F., and Razo-Flores, E. (2017). Effect of inoculum pretreatment on the microbial community structure and its performance during dark fermentation using anaerobic fluidized-bed reactors. Int. J. Hydrog. Energy 42, 9589–9599. doi: 10.1016/j.ijhydene.2017.03.157
Cord-Ruwisch, R., Seitz, H.-J., and Conrad, R. (1988). The capacity of hydrogenotrophic anaerobic bacteria to compete for traces of hydrogen depends on the redox potential of the terminal electron acceptor. Arch. Microbiol. 149, 350–357. doi: 10.1007/BF00411655
de Menezes, C. A., and Silva, E. L. (2019). Hydrogen production from sugarcane juice in expanded granular sludge bed reactors under mesophilic conditions: the role of homoacetogenesis and lactic acid production. Indus Crops Prod. 138:111586. doi: 10.1016/j.indcrop.2019.111586
DuBois, M., Gilles, K. A., Hamilton, J. K., Rebers, P. A., and Smith, F. (1956). Colorimetric method for determination of sugars and related substances. Anal. Chem. 28, 350–356. doi: 10.1021/ac60111a017
Etchebehere, C., Castell,ó, E., Wenzel, J., del Pilar Anzola-Rojas, M., Borzacconi, L., Buitrón, G., et al. (2016). Microbial communities from 20 different hydrogen-producing reactors studied by 454 pyrosequencing. Appl. Microbiol. Biotechnol. 100, 3371–3384. doi: 10.1007/s00253-016-7325-y
Fang, H. H. P., Liu, H., and Zhang, T. (2002). Characterization of a hydrogen-producing granular sludge. Biotechnol. Bioeng. 78, 44–52. doi: 10.1002/bit.10174
Fernández, F. J., Villaseñor, J., and Infantes, D. (2011). Kinetic and stoichiometric modelling of acidogenic fermentation of glucose and fructose. Biomass Bioenergy 35, 3877–3883. doi: 10.1016/j.biombioe.2011.06.052
Guiot, S. R., Arcand, Y., and Chavarie, C. (1992). Advantages of fluidization on granule size and activity development in upflow anaerobic sludge bed reactors. Water Sci. Technol. 26, 897–906. doi: 10.2166/wst.1992.0470
Kan, E. (2013). Effects of pretreatments of anaerobic sludge and culture conditions on hydrogen productivity in dark anaerobic fermentation. Renewable Energy 49, 227–231. doi: 10.1016/j.renene.2012.01.026
Larriba, M., Navarro, P., Delgado-Mellado, N., Stanisci, V., García, J., and Rodríguez, F. (2016). Separation of aromatics from n-alkanes using tricyanomethanide-based ionic liquids: liquid-liquid extraction, vapor-liquid separation, and thermophysical characterization. J. Mol. Liquids 223, 880–889. doi: 10.1016/j.molliq.2016.09.017
Lens, P. N., De Beer, D., Cronenberg, C. C., Houwen, F. P., Ottengraf, S. P., and Verstraete, W. H. (1993). Heterogeneous distribution of microbial activity in methanogenic aggregates: pH and glucose microprofiles. Appl. Environ. Microbiol. 59, 3803–3815. doi: 10.1128/AEM.59.11.3803-3815.1993
Lim, J. X., Zhou, Y., and Vadivelu, V. M. (2020). Enhanced volatile fatty acid production and microbial population analysis in anaerobic treatment of high strength wastewater. J. Water Process Eng. 33:101058. doi: 10.1016/j.jwpe.2019.101058
Lu, X., Zhen, G., Estrada, A. L., Chen, M., Ni, J., Hojo, T., et al. (2015). Operation performance and granule characterization of upflow anaerobic sludge blanket (UASB) reactor treating wastewater with starch as the sole carbon source. Bioresource Technol. 180, 264–273. doi: 10.1016/j.biortech.2015.01.010
McAteer, P. G., Trego, A. C., Thorn, C., Mahony, T., Abram, F., and O'Flaherty, V. (2020). Reactor configuration influences microbial community structure during high-rate, low-temperature anaerobic treatment of dairy wastewater. Bioresource Technol. 307:123221. doi: 10.1016/j.biortech.2020.123221
McHugh, S., Carton, M., Mahony, T., and O'Flaherty, V. (2003). Methanogenic population structure in a variety of anaerobic bioreactors. FEMS Microbiol. Lett. 219, 297–304. doi: 10.1016/S0378-1097(03)00055-7
Mota, V. T., Ferraz Júnior, A. D. N., Trably, E., and Zaiat, M. (2018). Biohydrogen production at pH below 3.0: Is it possible? Water Res. 128, 350–361. doi: 10.1016/j.watres.2017.10.060
Muñoz-Páez, K. M., Alvarado-Michi, E. L., Moreno-Andrade, I., Buitrón, G., and Valdez-Vazquez, I. (2020). Comparison of suspended and granular cell anaerobic bioreactors for hydrogen production from acid agave bagasse hydrolyzates. Int. J. Hydrog. Energy 45, 275–285. doi: 10.1016/j.ijhydene.2019.10.232
Oliva, A., Tan, L. C., Papirio, S., Esposito, G., and Lens, P. N. L. (2020). Effect of methanol-organosolv pretreatment on anaerobic digestion of lignocellulosic materials. Renewable Energy 169, 1000–1012. doi: 10.1016/j.renene.2020.12.095
Palomo-Briones, R., Razo-Flores, E., Bernet, N., and Trably, E. (2017). Dark-fermentative biohydrogen pathways and microbial networks in continuous stirred tank reactors: novel insights on their control. Appl. Energy 198, 77–87. doi: 10.1016/j.apenergy.2017.04.051
Papirio, S., Esposito, G., and Pirozzi, F. (2013). Biological inverse fluidized-bed reactors for the treatment of low pH- and sulphate-containing wastewaters under different conditions. Environ. Technol. 34, 1141–1149. doi: 10.1080/09593330.2012.737864
Patel, H., Chapla, D., and Shah, A. (2017). Bioconversion of pretreated sugarcane bagasse using enzymatic and acid followed by enzymatic hydrolysis approaches for bioethanol production. Renew. Energy 109, 323–331. doi: 10.1016/j.renene.2017.03.057
Pugazhendhi, A., Anburajan, P., Park, J.-H., Kumar, G., Sivagurunathan, P., and Kim, S.-H. (2017). Process performance of biohydrogen production using glucose at various HRTs and assessment of microbial dynamics variation via q-PCR. Int. J. Hydrog. Energy 42, 27550–27557. doi: 10.1016/j.ijhydene.2017.06.184
Regueira, A., Bevilacqua, R., Lema, J. M., Carballa, M., and Mauricio-Iglesias, M. (2020). A metabolic model for targeted volatile fatty acids production by cofermentation of carbohydrates and proteins. Bioresour. Technol. 298:122535. doi: 10.1016/j.biortech.2019.122535
Regueira, A., González-Cabaleiro, R., Ofiteru, I. D., Rodríguez, J., and Lema, J. M. (2018). Electron bifurcation mechanism and homoacetogenesis explain products yields in mixed culture anaerobic fermentations. Water Res. 141, 349–356. doi: 10.1016/j.watres.2018.05.013
Reyhanitash, E., Kersten, S. R. A., and Schuur, B. (2017). Recovery of volatile fatty acids from fermented wastewater by adsorption. ACS Sustain. Chem. Eng. 5, 9176–9184. doi: 10.1021/acssuschemeng.7b02095
Reyhanitash, E., Zaalberg, B., Kersten, S. R. A., and Schuur, B. (2016). Extraction of volatile fatty acids from fermented wastewater. Separat. Purific. Technol. 161, 61–68. doi: 10.1016/j.seppur.2016.01.037
Rocha, M. A. A., Raeissi, S., Hage, P., Weggemans, W. M. A., van Spronsen, J., Peters, C. J., et al. (2017). Recovery of volatile fatty acids from water using medium-chain fatty acids and a cosolvent. Chem. Eng. Sci. 165, 74–80. doi: 10.1016/j.ces.2017.02.014
Rodríguez-Valderrama, S., Escamilla-Alvarado, C., Amezquita-Garcia, H. J., Cano-Gómez, J. J., Magnin, J.-P., and Rivas-García, P. (2019). Evaluation of feeding strategies in upflow anaerobic sludge bed reactor for hydrogenogenesis at psychrophilic temperature. Int. J. Hydrog. Energy 44, 12346–12355. doi: 10.1016/j.ijhydene.2018.09.215
Saady, N. M. C. (2013). Homoacetogenesis during hydrogen production by mixed cultures dark fermentation: unresolved challenge. Int. J. Hydrog. Energy 38, 13172–13191. doi: 10.1016/j.ijhydene.2013.07.122
Saboe, P. O., Manker, L. P., Michener, W. E., Peterson, D. J., Brandner, D. G., Deutch, S. P., et al. (2018). In situ recovery of bio-based carboxylic acids. Green Chem. 20, 1791–1804. doi: 10.1039/C7GC03747C
SEAL (2019). SEAL AutoAnalyzer 3 HR. Available online at: https://www.seal-analytical.com/Products/SegmentedFlowAnalyzers/AA3HRAutoAnalyzer/tabid/59/language/en-US/Default.aspx (accessed January 15, 2021).
Wang, S., and Liang, Z. (2016). RETRACTED: acetate-triggered granular sludge floatation in methanogenic bioreactors. Water Res. 107, 93–101. doi: 10.1016/j.watres.2016.10.064
Zhang, Z.-P., Show, K.-Y., Tay, J.-H., Liang, D. T., and Lee, D.-J. (2008). Biohydrogen production with anaerobic fluidized bed reactors—A comparison of biofilm-based and granule-based systems. Int. J. Hydrog. Energy 33, 1559–1564. doi: 10.1016/j.ijhydene.2007.09.048
Keywords: volatile fatty acids, expanded granular sludge bed, anaerobic digestion, brewery spent grain, total carbohydrates, hydrogen production
Citation: Castilla-Archilla J, Heiberger J, Mills S, Hilbig J, Collins G and Lens PNL (2021) Continuous Volatile Fatty Acid Production From Acid Brewery Spent Grain Leachate in Expanded Granular Sludge Bed Reactors. Front. Sustain. Food Syst. 5:664944. doi: 10.3389/fsufs.2021.664944
Received: 06 February 2021; Accepted: 29 March 2021;
Published: 07 May 2021.
Edited by:
Francisco Jesus Fernandez Morales, University of Castilla-La Mancha, SpainReviewed by:
Helena Nadais, University of Aveiro, PortugalValeria Reginatto, University of São Paulo, Brazil
Copyright © 2021 Castilla-Archilla, Heiberger, Mills, Hilbig, Collins and Lens. This is an open-access article distributed under the terms of the Creative Commons Attribution License (CC BY). The use, distribution or reproduction in other forums is permitted, provided the original author(s) and the copyright owner(s) are credited and that the original publication in this journal is cited, in accordance with accepted academic practice. No use, distribution or reproduction is permitted which does not comply with these terms.
*Correspondence: Juan Castilla-Archilla, juancastillaarchilla@gmail.com