The Certainty of Uncertainty: Potential Sources of Bias and Imprecision in Disease Ecology Studies
 Shelly Lachish
 Kris A. Murray
- 1Department of Zoology, University of Oxford, Oxford, United Kingdom
- 2Department of Infectious Disease Epidemiology and Grantham Institute – Climate Change and the Environment, Imperial College London, London, United Kingdom
Wildlife diseases have important implications for wildlife and human health, the preservation of biodiversity and the resilience of ecosystems. However, understanding disease dynamics and the impacts of pathogens in wild populations is challenging because these complex systems can rarely, if ever, be observed without error. Uncertainty in disease ecology studies is commonly defined in terms of either heterogeneity in detectability (due to variation in the probability of encountering, capturing, or detecting individuals in their natural habitat) or uncertainty in disease state assignment (due to misclassification errors or incomplete information). In reality, however, uncertainty in disease ecology studies extends beyond these components of observation error and can arise from multiple varied processes, each of which can lead to bias and a lack of precision in parameter estimates. Here, we present an inventory of the sources of potential uncertainty in studies that attempt to quantify disease-relevant parameters from wild populations (e.g., prevalence, incidence, transmission rates, force of infection, risk of infection, persistence times, and disease-induced impacts). We show that uncertainty can arise via processes pertaining to aspects of the disease system, the study design, the methods used to study the system, and the state of knowledge of the system, and that uncertainties generated via one process can propagate through to others because of interactions between the numerous biological, methodological and environmental factors at play. We show that many of these sources of uncertainty may not be immediately apparent to researchers (for example, unidentified crypticity among vectors, hosts or pathogens, a mismatch between the temporal scale of sampling and disease dynamics, demographic or social misclassification), and thus have received comparatively little consideration in the literature to date. Finally, we discuss the type of bias or imprecision introduced by these varied sources of uncertainty and briefly present appropriate sampling and analytical methods to account for, or minimise, their influence on estimates of disease-relevant parameters. This review should assist researchers and practitioners to navigate the pitfalls of uncertainty in wildlife disease ecology studies.
Introduction
Wildlife disease ecology is a burgeoning field of research with important implications for wildlife and human health, the preservation of biodiversity, and the resilience of ecosystems. Monitoring pathogens in wild populations is undertaken for a variety of reasons (see Table 1 for examples), all of which require accurate assessments of pathogen occurrence or its derivatives to ensure that models, theory, and management recommendations are robust. Detecting and quantifying pathogen presence and prevalence in wild populations is challenging, however, because it is rarely possible to observe these complex systems without error, leading to biased and imprecise measurements (see Glossary). This uncertainty can arise at multiple levels of the sampling or diagnostic processes employed, from the choice of which sites and individuals to survey, to the processing of tissue samples in the lab (4, 11–13). Previous studies have recognised this multilevel nature of uncertainty, and in many cases methodological and statistical frameworks capable of accounting for hierarchical levels of observation error have been developed [e.g., by repeated sampling at each level to parse out non-detection biases from true absences, see discussion below; (11, 14, 15)]. Nevertheless, a mechanistic overview of how uncertainty arises in disease ecology studies remains lacking.
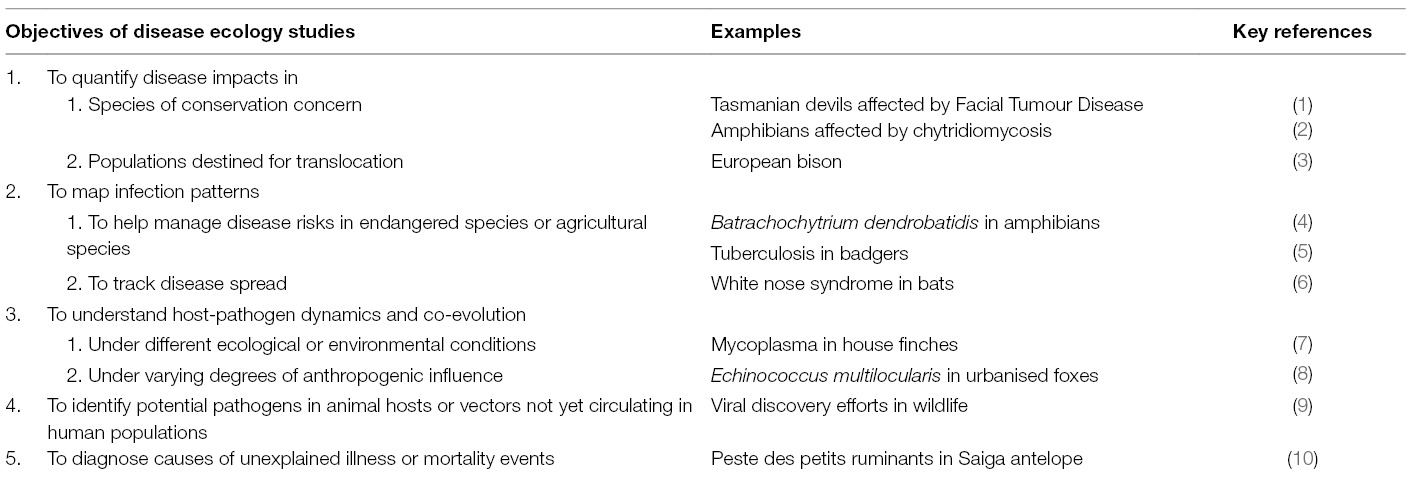
Table 1. Summary table listing examples of the varied objectives of disease ecology studies, along with key examples of each.
Sources of uncertainty have previously been attributed either to heterogeneity in the detectability of hosts, vectors, or their pathogens (imperfect detection) or to errors in disease state assignment [disease-state misclassification; (11, 16)]. In reality, however, uncertainty due to imperfect detection and state misclassification can arise in a variety of ways in studies of disease in natural populations, while other sources of uncertainty (e.g., incomplete taxonomic knowledge, demographic misclassification; see below) do not readily fit into this traditional dichotomy. This highlights the need to consider the sources, processes involved and implications of uncertainty more broadly.
Here we present an inventory of sources of uncertainty that could potentially occur when attempting to quantify disease-relevant parameters in wild populations (prevalence, incidence, transmission rates, force of infection, risk of infection, persistence times, and disease-induced impacts; see Glossary). Many of these (for example, unidentified crypticity among vectors, hosts or pathogens, a mismatch between the temporal scale of sampling and disease dynamics, demographic or social misclassification: see discussion below) may not be immediately apparent, even to seasoned investigators, or even identifiable without preliminary study. As such, the bias and lack of precision introduced by them cannot always be adequately accounted for by post-hoc statistical adjustment (11, 17). In such instances, detailed understanding of the host-pathogen system and the development of more nuanced methodological approaches may be required.
Sources of Uncertainty in Disease Ecology Studies
Based on a structured literature review (Appendix 1, Data Sheet S1), we classified sources of uncertainty into six broad (and potentially overlapping) categories. We found uncertainty could arise due to: (1) intrinsic biological factors associated with the interaction between hosts and pathogens; (2) demographic or state misclassification; (3) incomplete taxonomic knowledge of host-pathogen systems; (4) a mismatch of sampling scales; (5) imprecision of diagnostic methods; and (6) extrinsic environmental factors that may have additional modifying effects within each of the other categories. Details of these sources of uncertainty, the processes involved and an indication of the potential bias and imprecision in disease-relevant parameters are presented in Table 2.
A. Intrinsic Biological Factors
A.i. Variation in Detectability
It is widely recognized that detection of organisms in their natural environment is rarely perfect and that detectability (encounter, capture or sighting rate) can vary as a function of time and numerous biotic and abiotic factors (18). One of these factors can be infection status (Table 2,A.i.). Differential detectability between infected and uninfected individuals (hosts or vectors) can occur either because the pathogen directly manipulates individual behaviour or because the behaviour of individuals changes due to deterioration in their physiological condition, which might further scale with infection intensity (16, 19–22). These processes can modify the movement patterns or conspicuousness of individuals, changing their trappability, visibility, or propensity to migrate out of the study site. For example, Brazilian treefrogs (Hypsiboas prasinus) with more intense helminth infections exhibit reduced mating call frequencies, which could make them less detectable during surveys (23; Figure 1A). Similarly, house finches infected with Mycoplasma gallisepticum infection suffer impaired vision and display reduced activity levels, resulting in lower recapture rates for infected compared to uninfected individuals (Figure 1B; 7, 24). When detectability is “imperfect” and differs as a function of infection status or intensity then unadjusted estimates of disease-relevant parameters may be biased (16, 20).
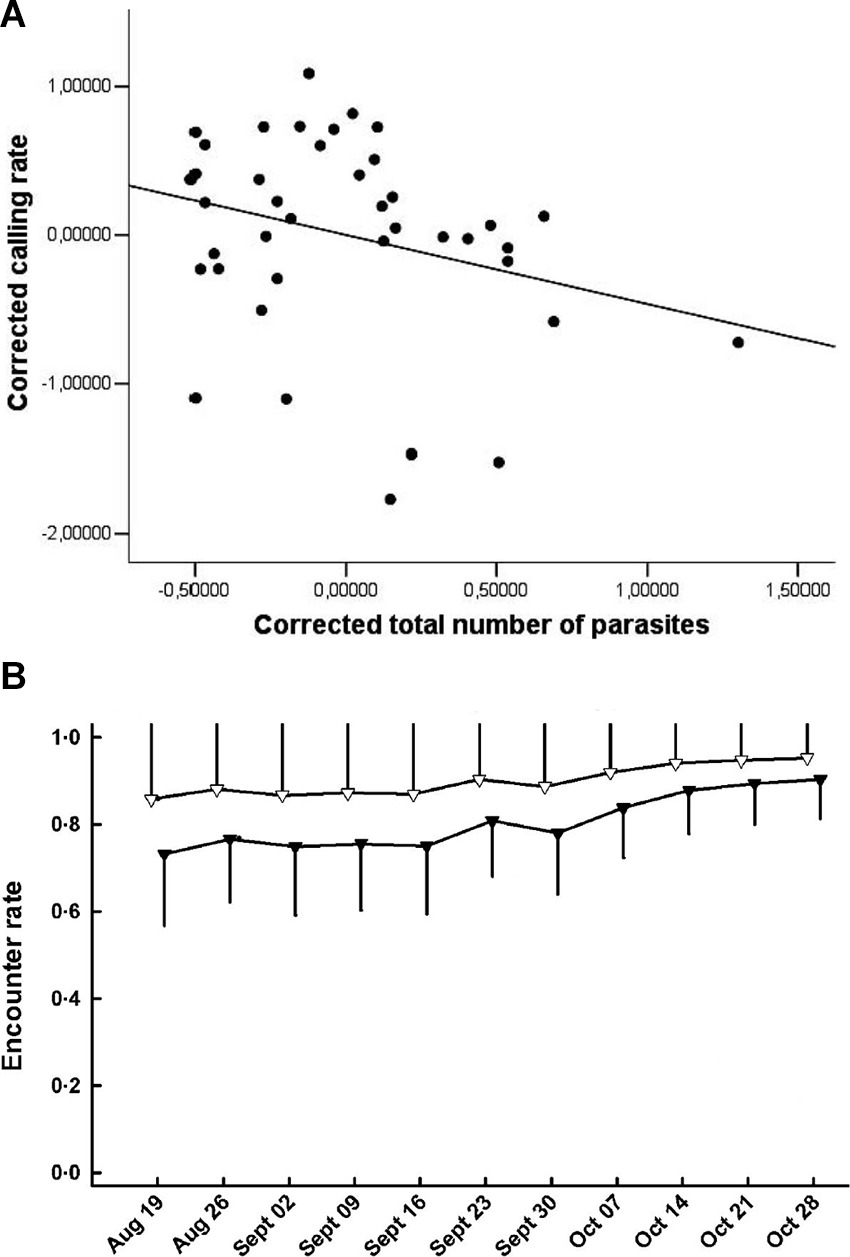
Figure 1. (A) Calling rate of treefrogs (Hypsiboas prasinus) versus total number of helminth parasites. Corrected calling rate and total number of parasites are the residuals of a regression of body mass; the line is illustrative (Adapted from Madelaire et al. (23), with permission from the Journal of Herpetology); (B) Encounter rate of house finches that were infected with Mycoplasma gallisepticum (black triangles) or not infected (white triangles) [Adapted from Faustino et al. (7), with the permission of John Wiley and Sons].
A further implication of differential detectability of infected vs uninfected individuals is that observed temporal patterns in disease dynamics may simply be spurious artefacts of temporal variation in the probability of detecting infected vs uninfected individuals (20, 25, 26). Using simulations, Jenelle et al. (20) demonstrate how temporal variation in detection probabilities of infected individuals could suggest a cyclic pattern of disease prevalence, even when the true prevalence is constant over time. Equally, real seasonality in disease dynamics (see below and Table 2,F) may be masked by contrasting temporal patterns of detection of hosts, vectors, or pathogens (20).
A.ii. Variation in Distribution and Intensity of Pathogens Among Hosts
Pathogen infections in natural populations are often characterised by aggregated or over-dispersed distributions among individuals within populations (27; Table 2,A.ii.). That is, most infected individuals harbour low parasite burdens, while relatively few harbour high parasite burdens. Although typical of macroparasite infections (e.g., helminths), microparasites can also exhibit over-dispersed distributions in terms of variable patterns of infection intensity among hosts (12, 28, 29). For example, Grogan et al (29) showed that the distribution of Batrachochytrium dendrobatidis (Bd) load between amphibian hosts is highly over-dispersed. Despite its long-recognised importance for disease transmission rates and host-pathogen population dynamics (30), the effect of pathogen aggregation and variation in disease intensity on the detection and estimation of disease occurrence and impacts has only recently been established. For example, Shin et al. (31) showed that detection of Bd infection is unreliable in individuals with low Bd loads. Similarly, the probability of detecting Plasmodium infections in avian blood increases with pathogen load (12; Figure 2A). Thus, pathogen aggregation can generate bias in disease-relevant parameters via increasing the likelihood of errors in disease state assignment (i.e., state misclassification) and will be particularly relevant when the sensitivity of diagnostic tests is low (see discussion below and Table 2E). Pathogen aggregation can also generate imprecision and bias in estimates of the magnitude of disease impacts on individuals when the magnitude of disease-induced impacts varies with parasite burden or the intensity of infection (12, 29, 31, 32). For example, Grogan et al. (29) demonstrated that survival of the common mist frog (Litoria rheocola) was related to the burden of infection with Bd, and that accurate knowledge on infection dynamics in their system necessitated accounting for pathogen overdispersion (Figure 2B).
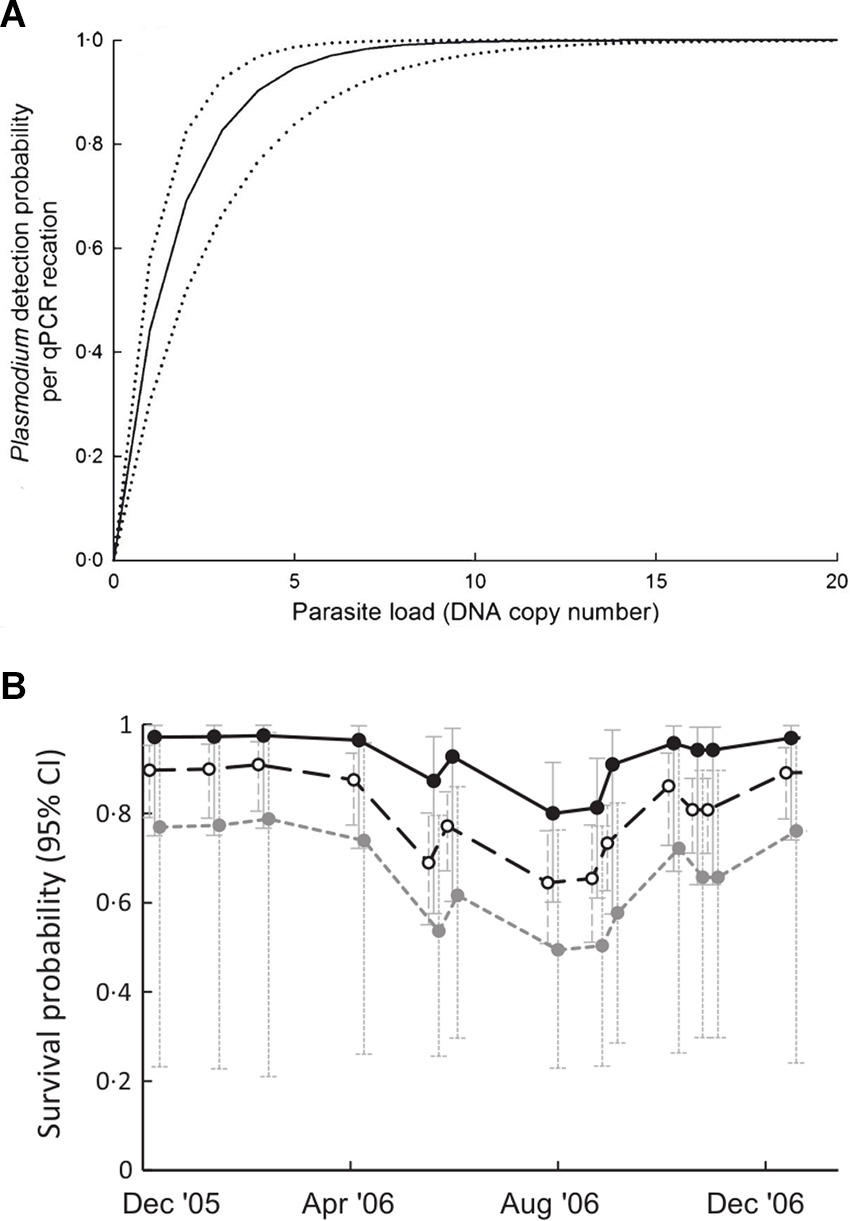
Figure 2. (A) Relationship between parasite load (DNA copy number) and the probability of detecting Plasmodium infection by qPCR in blue tits (Cyanistes caeruleus). Dotted lines are 95% confidence intervals (Adapted from (12), with the permission of John Wiley and Sons); (B) relationship between infection with Bd and survival probability of male Litoria rheocola as a function of pathogen load: uninfected (○), 1–4 zoospores (●) and >4 zoospores (●) [Adapted from (29), with the permission of John Wiley and Sons].
B. Demographic or Social Misclassification
Just as there can be uncertainty in the assignment of disease-state for individuals in natural populations, there can also be uncertainty in assigning individuals to demographic or social classes (i.e., age, sex, social status: Table 2B). For example, imperfect methods of ageing individuals will produce biased and imprecise estimates of age prevalence curves or of demographic impacts (33). An inability to accurately sex individuals (e.g., in juveniles or where sexual dimorphism is absent) or to accurately infer social groups or social hierarchies could introduce further biases, as sex differences and social structure can strongly influence disease transmission and dynamics (34). For example, in badger (Meles meles) populations individuals that are more socially isolated from their group are at greater risk of tuberculosis (Tb) infection (35), while in meerkat (Suricata suricatta) populations highly connected group members (those that groom more) and roving males are more likely to be infected with Tb (36; Figure 3A,B). The effect of social status on infection risk can also differ between demographic classes, as was recently shown for spotted hyenas (Crocuta crocuta) infected with canine distemper: high social rank increased infection risk for adults and subadults (as they had higher contact rates and disease exposure) but decreased infection risk for cubs (as they were in better physiological and immunological condition; (37). Furthermore, if infection is demographically biased (i.e., when infection varies with age, sex, or social status) then encounter rates could also vary between those classes, resulting in additional uncertainty in estimates of age prevalence curves, demographic impacts, or disease dynamics (38).
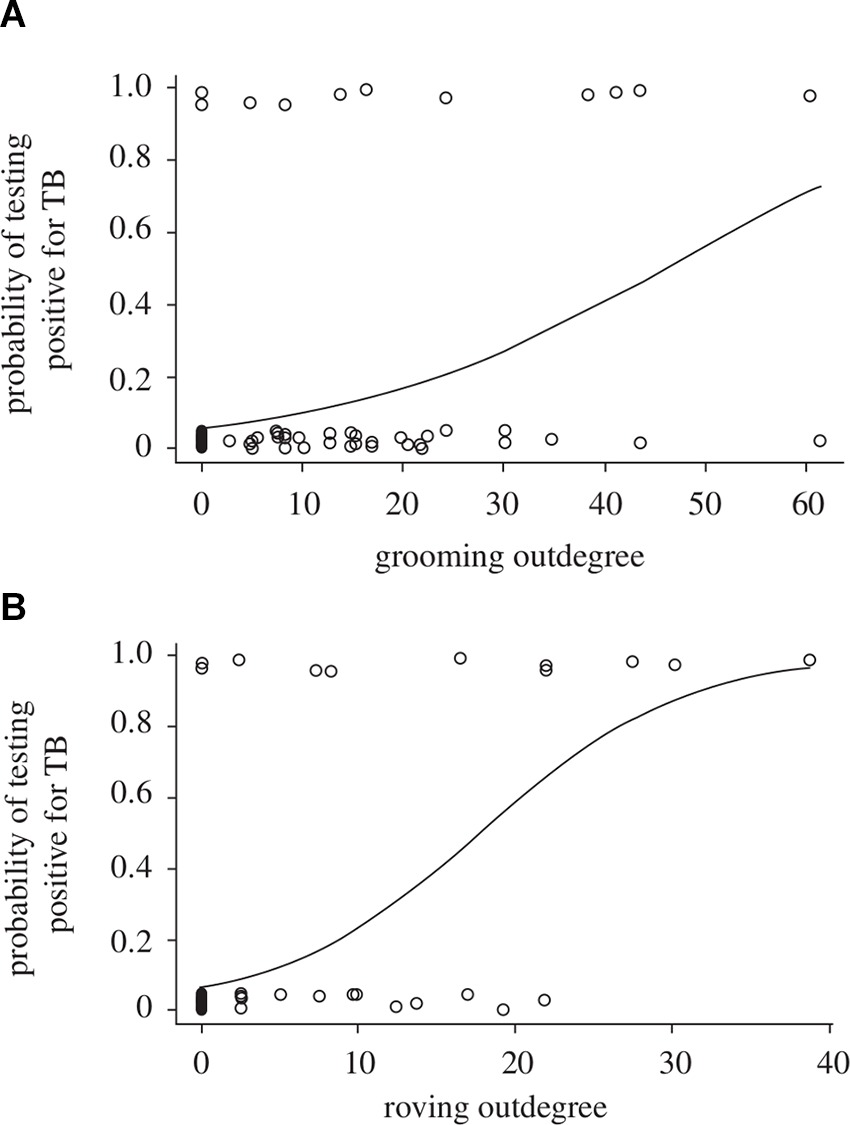
Figure 3. Probability of individual meerkats testing positive for tuberculosis as a function of (A) the extent to which they groom others (grooming outdegree) and (B) the extent of intergroup excursions by males (roving male outdegree). [Adapted from (36), with the permission of The Royal Society].
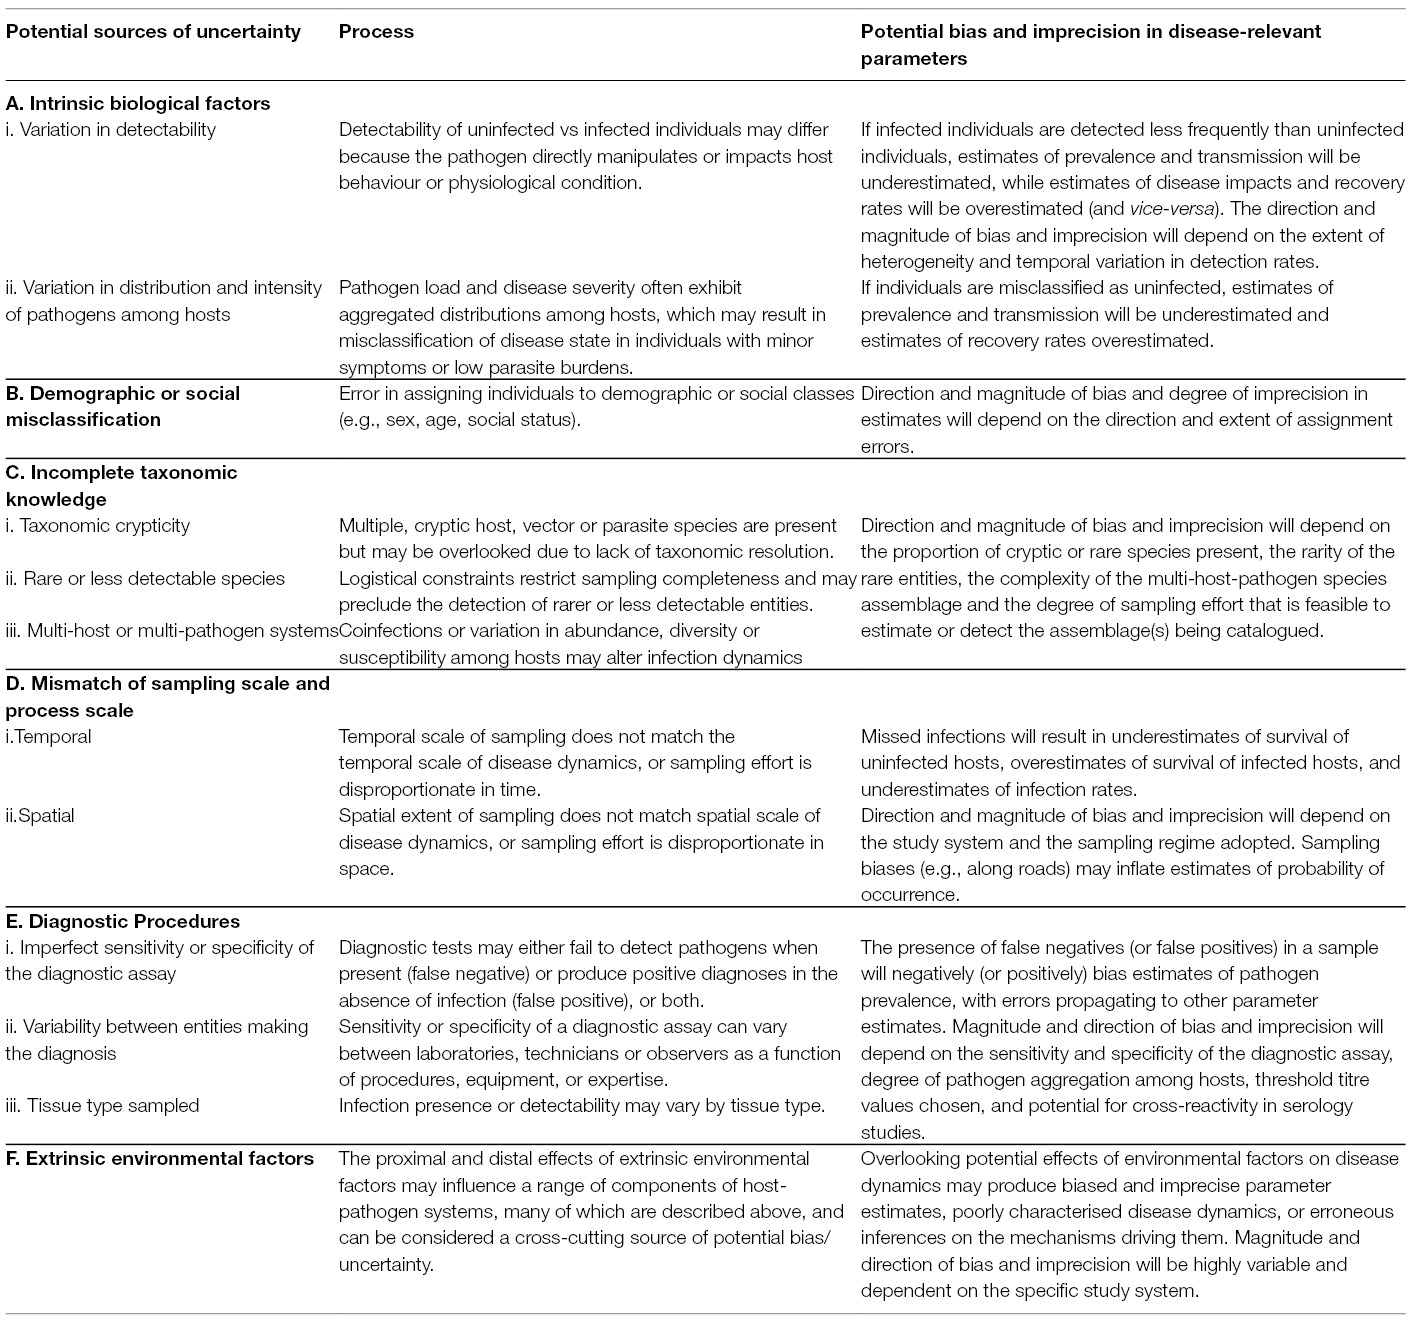
Table 2. Summary of key sources and processes that can generate bias or lack of precision in estimates of disease-relevant parameters obtained in disease ecology studies.
C. Incomplete Taxonomic Knowledge
C.i. Taxonomic Crypticity
Erroneous or biased inferences on disease dynamics may arise when multiple, phenotypically indistinguishable but genetically distinct host, vector or parasite species are present but are cryptic, and therefore, overlooked (21, 39), (Table 2,C.i.). Virulence can vary among parasite species (40). Different parasite species or morphotypes can differ in the nature of their impacts on hosts (21), or in their detectability within hosts (41). For example, compared to uninfected individuals, blue tits (Cyanistes caeruleus) infected with Plasmodium circumflexum experience lower survival, while those infected with Plasmodium relictum experience lower reproductive success (21; Figure 4A). These contrasting impacts on blue tit fitness were obscured when the identity of the two cryptic malaria species was ignored (21). Cryptic vector species can vary in their contribution to local infection dynamics, while the detectability of parasites in vectors can also vary among vector species (39). For example, Gomez et al., (39) showed that infection intensity with Borrelia spp varied strongly among cryptic tick races (Figure 4B), leading to variable detection rates and vector-specific biases of between 4 and 30% when raw counts were used to calculate prevalence.
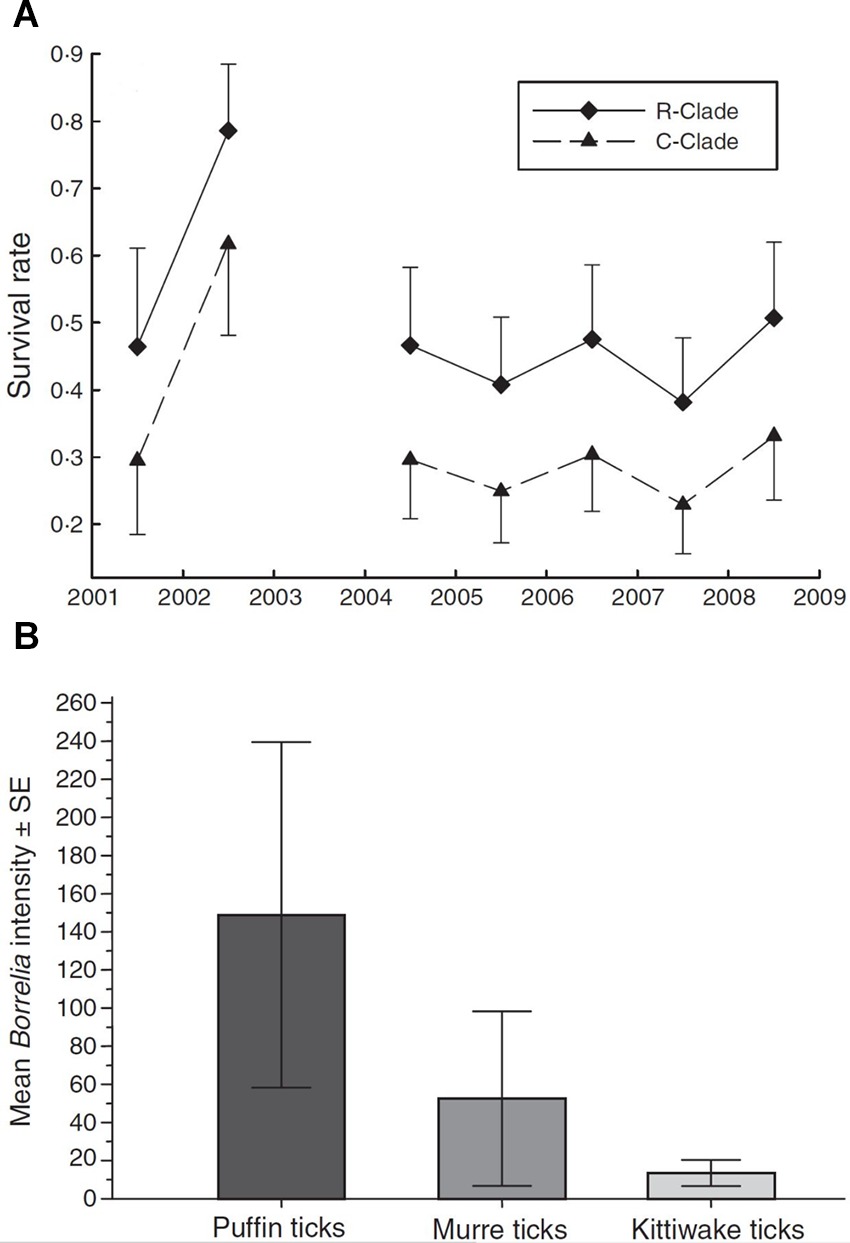
Figure 4. (A) Survival rates (±95% CI) of blue tits infected with two strains of avian malaria (Plasmodium relictum ◆ R-clade; P. circumflexum ▲ C-clade). (Adapted from Lachish et al. (21), with the permission of John Wiley and Sons); (B) Intensity of infection of Lyme borreliosis bacteria (mean spirochetes ± SE) in three morphologically cryptic avian tick races associated with puffins, murres, and kittiwakes. [Adapted from (39), with the permission of John Wiley and Sons].
Crypticity among host species can also influence disease processes and may bias estimates of the distributions of hosts or disease, or provide previously unidentified explanations for observed disease distributions (42). For example, spatial heterogeneity in Lassa fever outbreaks in humans was resolved only when the cryptic phylogeography of its reservoir host species, the rodent Mastomys natalensis, was recognised (42). These examples show that crypticity can generate uncertainty in disease-relevant parameters via “imperfect detection” (e.g., when detection rates vary among cryptic morphotypes (21, 39), via “state misclassification” (e.g., when diagnosis varies with virulence or severity which differ among the cryptic morphotypes (39), via both processes concurrently, or via other means (e.g., when morphotypes impact hosts differently; (21) or when incomplete knowledge limits the phylogeographic range of investigation; (42).
C.ii. Rare or Less Detectable Species
Another form of uncertainty may emerge from the incomplete characterisation of biological assemblages due to the non-detection of rare or low detectability species (Table 2,C.ii.), which constitutes an extreme form of “imperfect detection”. For example, when characterising the diversity of micro-organisms within a host (e.g., the microbiome) or when undertaking pathogen discovery campaigns in wildlife hosts, there will typically be diminishing returns in terms of new species detections with increasing sampling effort. This arises because more common or easily detectable species in an assemblage are catalogued early while rarer or less detectable species require greater effort (9, 43). For both hosts and pathogens, sampling campaigns will rarely census entire communities due to logistical constraints and as such there will be uncertainty when estimating host breadth, pathogen species richness or other diversity metrics. For example, when characterising the viral diversity of the wild megabat Pteropus giganteus, Anthony et al., (9), detected 44 viruses from 1092 samples. However, methods to account for imperfect detection suggested that a further 14 viruses remained undetected in this host, with the amount of testing required to detect them all estimated to be nearly seven-fold the number actually tested (9; Figure 5). This example illustrates how observations of host-pathogen systems can be directly biased by sampling completeness, which will always be constrained by logistical considerations.
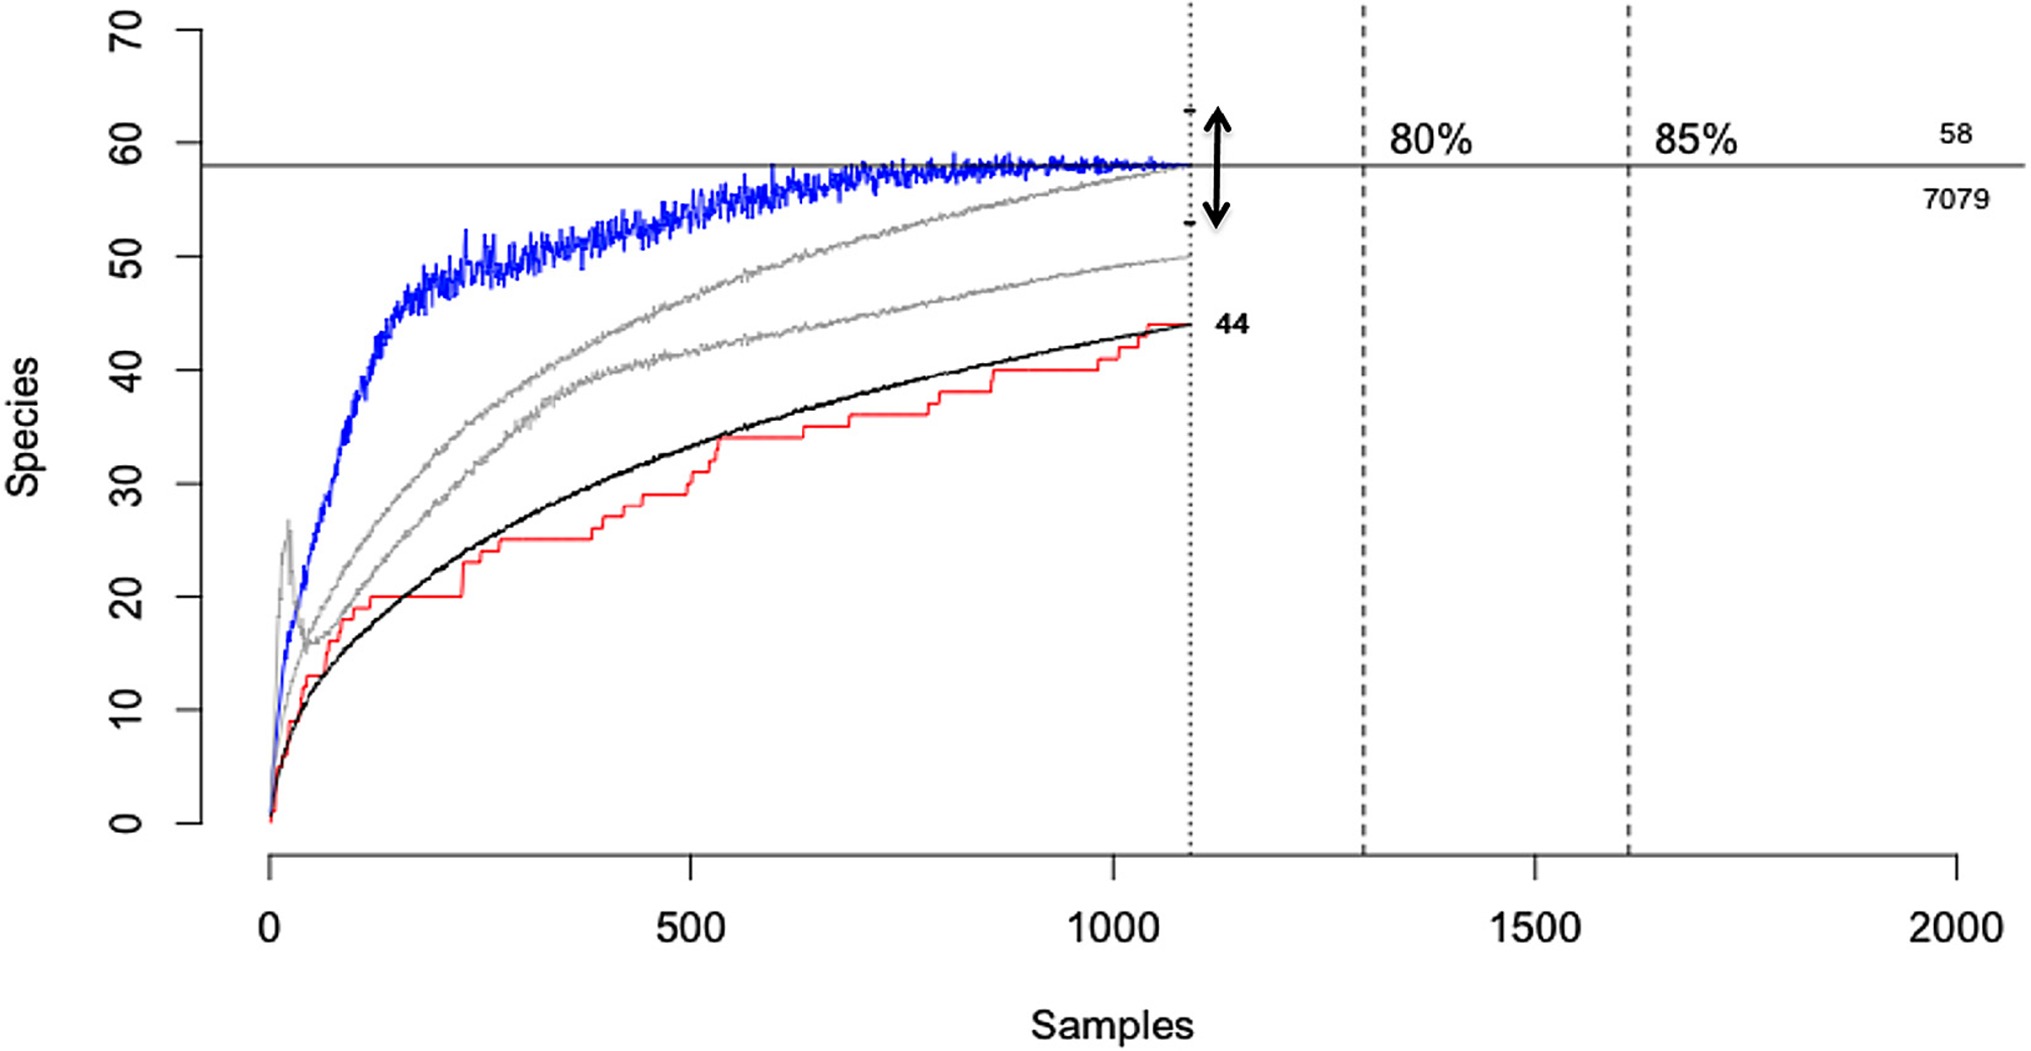
Figure 5. Viral discovery curves for pathogens of the Indian Flying Fox (Pteropus giganteus) using PCR estimated from observed detections using three statistical models. The horizontal line shows the total estimated diversity (58 viruses) corrected for detectability and the effort required to discover 100% of the estimated diversity (7,079 samples). Black line, the rarefaction curve; red line, accumulation of novel viruses over samples tested; blue line, Chao2 estimator with arrow = 95% CI; gray lines, ICE and Jackknife estimators; [Adapted from (9), under creative commons licence].
C.iii. Multi-Host or Multi-Pathogen Systems
Alongside unacknowledged taxonomic crypticity, and the presence of rare species, potential uncertainty in disease-relevant parameters can arise when multi-pathogen or multi-host dynamics are present but ignored (Table 2,C.iii). Coinfections can involve both antagonistic and synergistic interactions between pathogens within hosts, which can alter the outcome of infection (positively or negatively) and thus influence disease dynamics and host fitness (44–46). For example, Budischak et al., (45) showed that body condition was lower in buffalo coinfected with two gastrointestinal macroparasite species (Cooperia and Haemonchus) compared to uninfected or singly-infected individuals (Figure 6). Likewise, for pathogens capable of infecting multiple host species, the diversity and abundance of alternative reservoir hosts and their relative susceptibility or competence, can alter the impact of disease on the focal hosts and disease dynamics within the host’s population (28, 47–49). For example, Kilpatrick et al., (47) showed that variability in host competence and mosquito feeding patterns results in extreme heterogeneity in the transmission of West Nile virus among communities of avian hosts. Such processes broadly related to the epidemiological complexity of a disease can have follow-on effects that may also introduce other forms of bias and uncertainty; for example, mapping efforts for increasingly complex human diseases, as crudely measured by the presence and number of transmission sources (e.g., environmental, reservoir hosts, vectors, human-human) tend to be of lower quality than for simpler diseases (50). Although both multi-pathogen coinfections and multi-host pathogens are common, their effects and dynamics in wild host populations in natural settings remain poorly described.
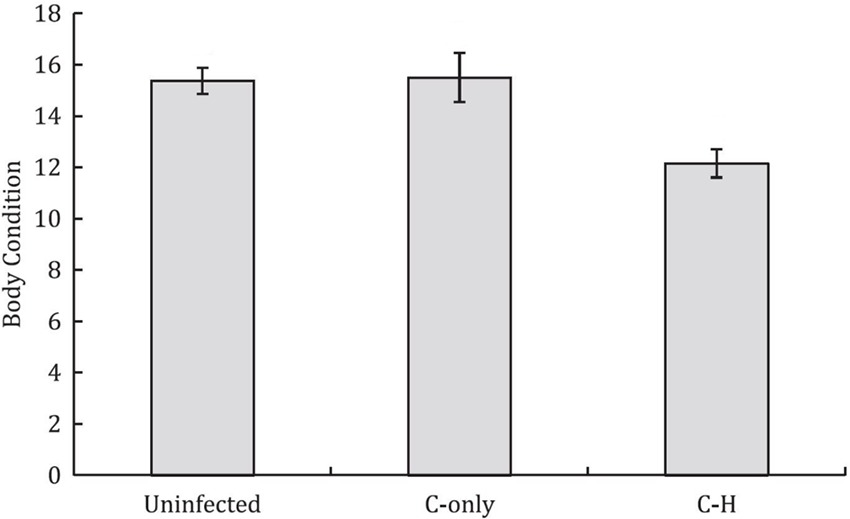
Figure 6. Buffalo coinfected with two gastrointestinal parasites (Cooperia-Haemonchus) exhibit lower body condition compared to uninfected and Cooperia-only singly-infected buffalo (means ± SE are shown). [Adapted from (45), under creative commons licence].
D. Mismatch of Sampling Scale and Process Scale
D.i. Temporal Scales
Uncertainty in estimates of disease-relevant parameters can arise when the temporal or spatial sampling scales do not match those at which the disease dynamics operate (Table 2,D). For example, in many disease ecology studies the frequency of data collection occurs on a longer time scale than the disease dynamics (1, 2, 51). If hosts are only monitored seasonally or annually but the progression from infection to death, or from infection to recovery, occurs over weeks or months, then individuals can acquire infection and die, or acquire and lose infections, without these events appearing in the data (16, 17, 21).
D.ii. Spatial Scales
Inferences regarding disease dynamics may also vary as a function of the spatial extent of sampling relative to the area that determines pathogen dynamics (Table 2,D.ii. ; 52, 53). For example, the relationship between biodiversity and infection risk often depends strongly on the spatial scale of sampling (53). Studies of tick-borne Lyme disease conducted at small (within-forest) spatial scales reveal positive associations between disease risk (to humans) and host biodiversity (the so-called “amplification effect”), whereas those conducted at larger scales reveal the opposite (i.e., a “dilution effect”; (54). Similar conflicting inferences regarding the relationship between host biodiversity and the risk of infection with West Nile Virus have been demonstrated in studies conducted at small (48) and large spatial scales (55). A mismatch of spatial sampling scale is most likely to occur for zoonotic or vector-borne pathogens or those with complex life cycles, because the production of infective-stages may be decoupled spatially from the dynamics of the infection within the target host species (48, 54–56). The uncertainty generated by a mismatch of sampling scales cannot readily be classified as either ‘imperfect detection’ or “state misclassification”.
Disproportionate sampling effort in both space and time can be considered further examples of potential mismatches in scale that can introduce uncertainty in disease ecology studies (Table 2,D). For example, many datasets on disease occurrence are compiled from non-random “convenience” samples of individuals or locations, such as from passive surveillance of sick and dead wildlife. Thus, the sample units are not selected according to defined rules from the pool of all possible sample units that conceptually represent the population of interest (52). This can preclude calculating true probabilities of occurrence from a sample, resulting in biased and imprecise estimates of disease prevalence or other population parameters (52). This issue extends to the use of species distribution models (SDMs; also known as ecological niche models) developed from “presence-only” occurrence datasets. This approach is increasingly being applied in disease studies to map infection risk since robust records of disease absence are usually unavailable (e.g., in analysis of museum specimens) or cannot be accurately verified (due to sampling limitations; (57). In these cases, the distribution of reported occurrences are often tightly correlated with the distribution of reporting or observation effort, potentially resulting in misleading representations of disease distributions in model outputs (58, 59).
E. Diagnostic Procedures
E.i. Imperfect Sensitivity or Specificity of the Diagnostic Assay
It is well recognised that most pathogen detection methods are imperfect, resulting in errors in disease state assignment (Table 2,E). This is true both for diagnoses made via laboratory analyses of field-collected tissue samples and those made via observational assessments of host symptoms in the field (11, 12, 15). Diagnostic tests with <100% sensitivity will produce negative diagnoses when a pathogen is present but not detected (false negatives), while tests with <100% specificity will produce positive diagnoses in the absence of infection (false positives; Table 2E.i). Less well recognised is how these properties interact with other potential sources of uncertainty. For example, the accuracy of diagnostic tests can vary with the intensity of infection in hosts, meaning they can be inconsistent when pathogen distributions are aggregated [see section above and (12, 15, 29)]. Quantitative PCR-based assays can fail to detect infections with low DNA copy number (low parasite load), as has been demonstrated for the detection of Bd (15) and avian malaria (12; Figure 2A). Meanwhile, observational diagnoses may fail to detect asymptomatic individuals or those with minor symptoms (1, 7). Accounting for uncertainty due to diagnostic test accuracy will be especially necessary in studies of pathogens with over-dispersed distributions among hosts (29).
Issues of low sensitivity and specificity are particularly problematic in studies that use serological data to infer infection status because state assignment is based on arbitrary threshold values, which can increase the likelihood of false negatives and consequently bias estimates of disease-relevant parameters (60). In addition, cross-reactivity in serology can occur in the presence of unidentified pathogen diversity, increasing the likelihood of false positives (60, 61). Indeed, the presence of cryptic pathogen species (as discussed above) could lower the specificity of many diagnostic tests (60). There can be additional uncertainty in inferences obtained from studies that use serology-derived measures of disease when knowledge of the serological outcomes following infection is lacking (e.g., the probability that an infected individual will seroconvert; how pathogen dose and route of inoculation affect the induction of a host antibody response; the duration of the antibody response to infection; and relationship between antibody status and resistance to pathogen infection; (61, 62).
E.ii. Variability Between Entities Making the Diagnosis
Another potentially common, but rarely considered, source of uncertainty in the diagnosis of infection is the variability in diagnostic accuracy that can exist between different laboratories, technicians or observers because of differences in expertise, equipment or procedures (63; Table 2,E.ii.). Such variation in diagnostic accuracy may lead to erroneous inference when comparing prevalence and disease dynamics across studies and regions (18, 41).
E.iii. Tissue Type Sampled
Finally, the choice of which tissues to sample within hosts can also induce uncertainty in parameter estimates because infection or the composition of pathogen assemblages may vary among tissue types (64; Table 2,E.iii). For example, avian plasmodium is less detectable in blood than in other tissues [via PCR; (65)]. As most studies of avian malaria infections in wild birds diagnose infection in blood, researchers must acknowledge the likelihood that parameter estimates are biased because of “missed” infections (65).
F. Extrinsic Environmental Sources of Uncertainty
External factors related to the environment often have pervasive effects, both proximal and distal, on the components of host-pathogen systems, and as such, environmental covariates can be considered a crosscutting source of potential uncertainty in disease ecology studies (Table 2,F). For example, seasonal changes in the incidence of infectious diseases is common. Seasonal forcing of disease dynamics occurs for a variety of ecological reasons, including seasonal pulses of births and deaths, seasonal changes in host immunity or parasite vigour, or because of seasonal changes in host behaviours (e.g., hibernation, migration, mating) that result in temporal changes in host contact rates, or variation in encounters with or proliferation of infective stages in the environment (25, 66–69). For instance, seasonal transmission of the fungus Pseudogymnoascus destructans, the cause of bat white nose syndrome, is primarily driven by changes in host physiology related to hibernation, which facilitates fungal growth in North American caves during winter (70; Figure 7). Less regular or longer-term environmental influences can similarly affect disease dynamics: for instance, if outbreaks are related to unusual weather events (flood, drought) or transmission varies by longer term cycles or changes in climate (ENSO, climate change). For example, outbreaks of the coral disease, atramentous necrosis, are associated with increased rainfall, greater particulate runoff, and higher water temperatures, all of which are predicted to increase under future climate change (69). Disease ecology surveys that overlook the effects of seasonality and other environmental factors on disease transmission may thus produce biased and imprecise estimates of disease-relevant parameters, poorly characterised disease dynamics, or fail to identify important mechanisms driving them (20, 26, 52). At worst, such studies may entirely fail to detect pathogens; for example, by only sampling annually or in a temporally ad-hoc manner (see also mismatch in scale section above; (52).
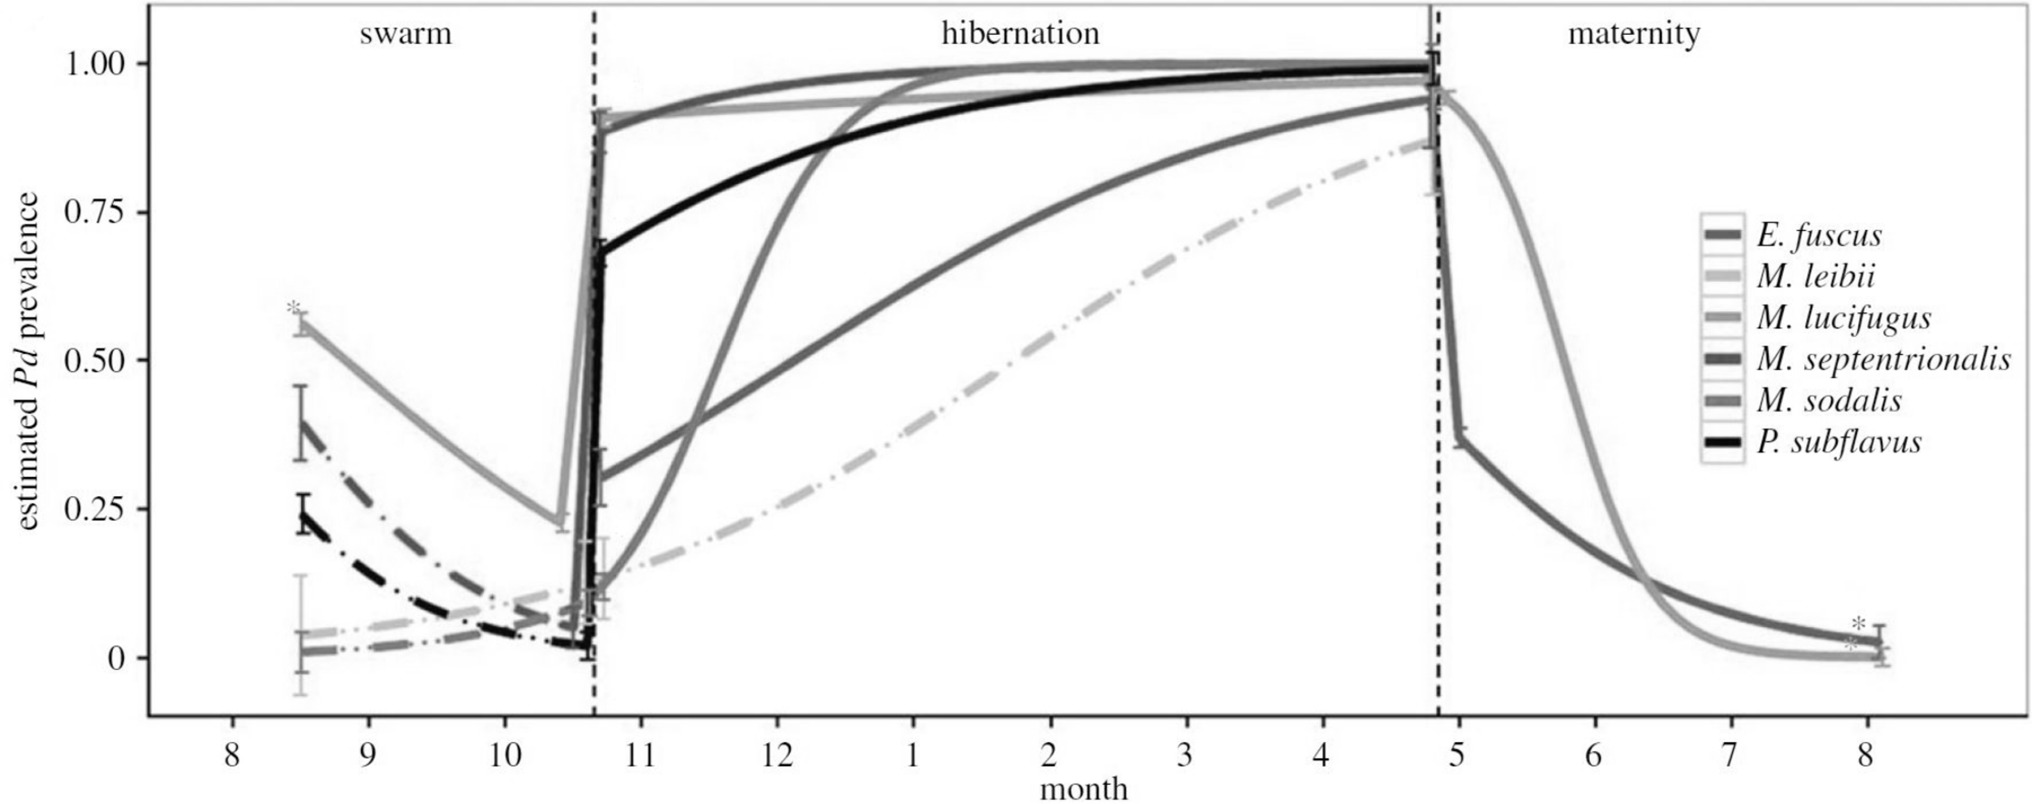
Figure 7. Model results showing that the peak predicted prevalence (mean ± SE) of white nose virus (Pseudogymnoascus destructans) for six species of bats coincides with onset of hibernation. [Adapted from (12), with the permission of The Royal Society].
Spatial variation in environmental covariates can similarly introduce uncertainty in wildlife disease studies. For example, host species may utilise different habitat types. This could lead to differences in host detectability during disease surveys (52) or could directly affect the host-pathogen relationship. For example, the dynamics of chytridiomycosis in amphibians vary according to microclimate, which itself varies by habitat type, resulting in fine scale “environmental refugia” from disease [e.g., open vs closed canopy tropical stream habitats, (71)]. Because the impact of disease is lower in refugia (due to limited fungal growth and/or enhanced frog immunity), ignoring the presence and variability of favourable or unfavourable habitats in a landscape can bias inferences and compromise efforts to map disease risk or plan conservation actions (e.g., translocation of critically endangered species; (71).
Accounting for Uncertainty in Disease Ecology Studies
Our review demonstrates that uncertainty in disease ecology studies arises because of the sampling and diagnostic procedures used and due to factors inherent to the biology and ecology of host-pathogen systems. Accordingly, the first step of any disease ecology study should be to identify potential sources of uncertainty and their likely magnitude (Figure 8). This will involve consulting prior information (previous studies, similar studies, historical literature) and, if resources permit, conducting a pilot study or power analysis to help determine optimal or efficient sampling strategies. Several aspects of a well-designed sampling strategy can a priori reduce the extent to which uncertainty plagues parameter estimates (72, 73). For example, minimising stochastic variation among samples (e.g., by ensuring that sampled individuals are representative of the population), controlling for known covariates of detection probability (26, 52, 74, 75), verifying the taxonomic resolution of the system, and evaluating the potential influence of non-detection of rare, hard to detect or cryptic species.
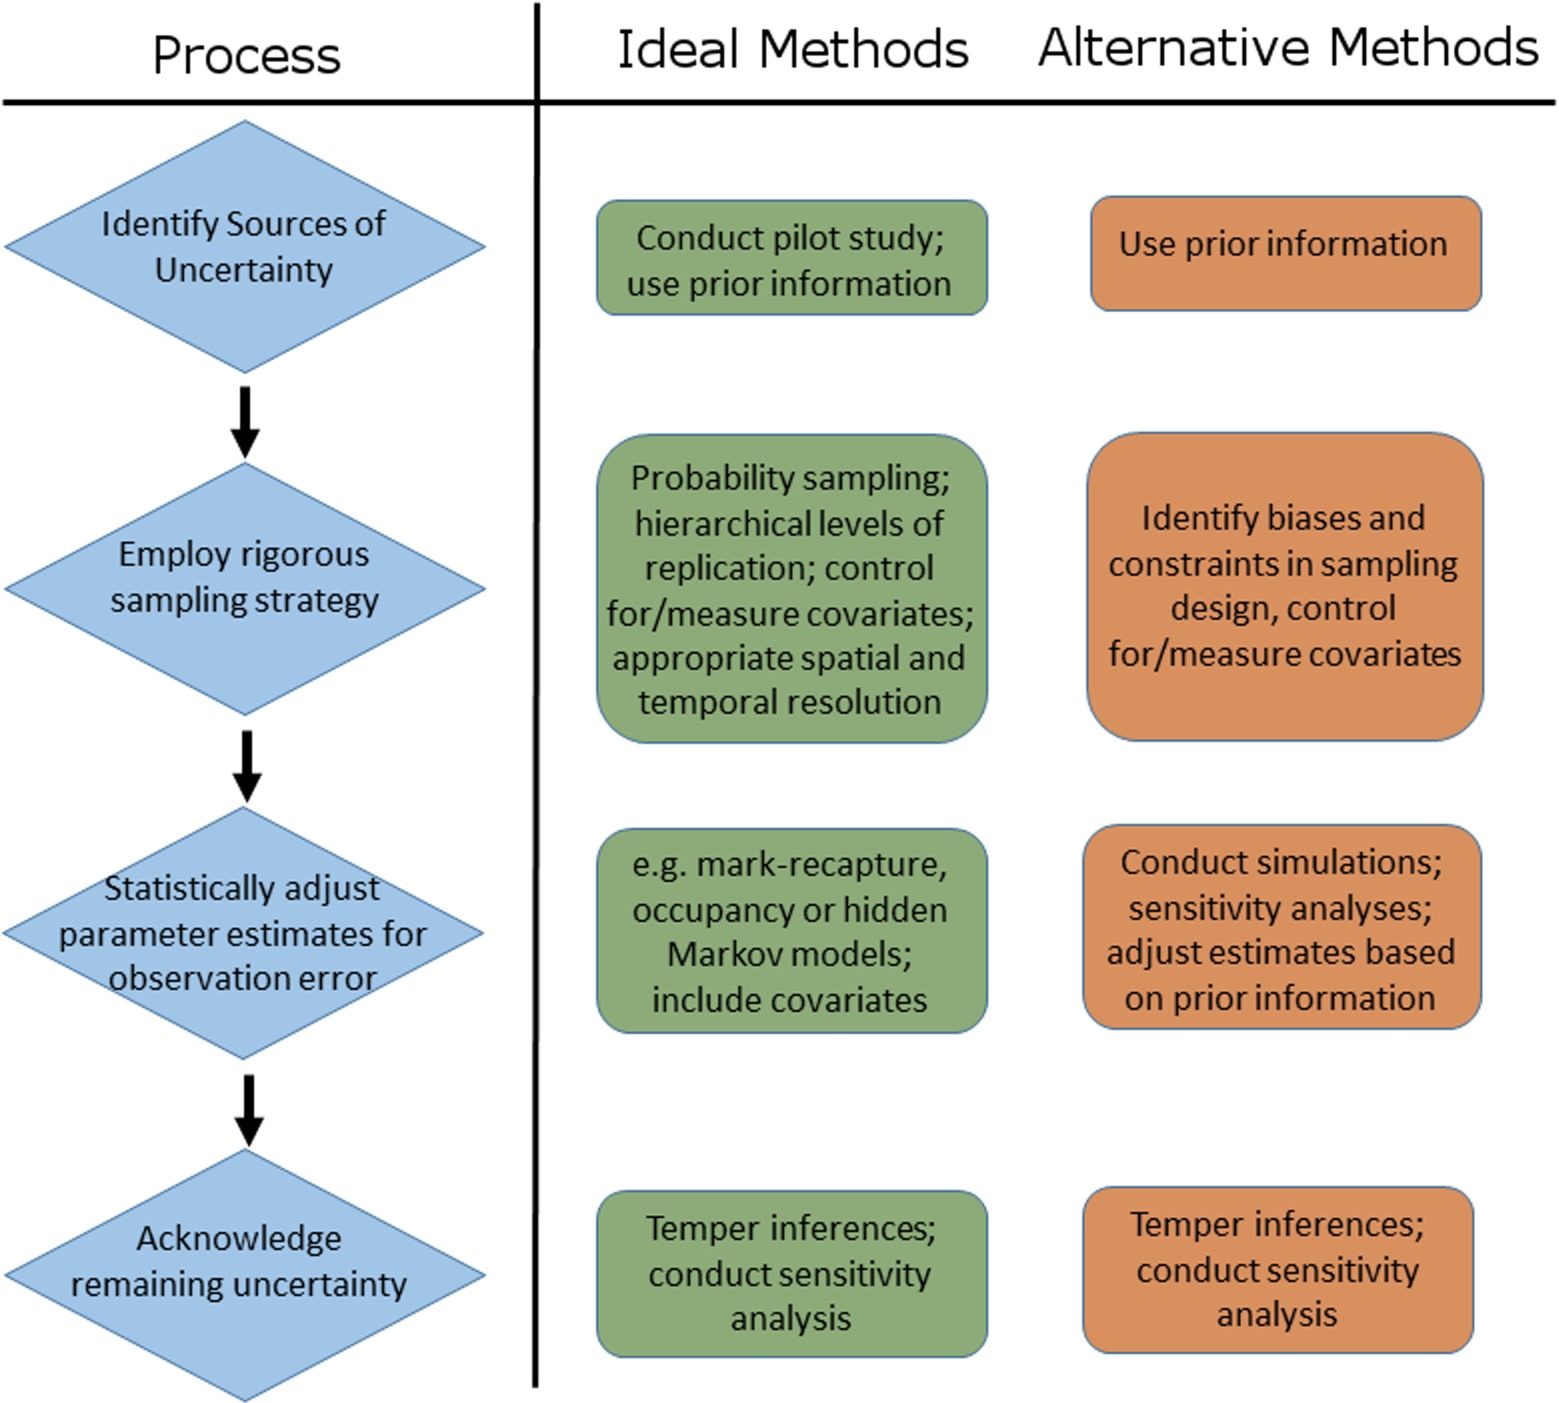
Figure 8. Schematic representation of the process of accounting for sources of uncertainty in disease ecology studies, including examples of ideal and alternative methods that can be used to address each step of the process.
Subsequently, researchers should employ a sampling strategy that enables the application of statistical tools that can help adjust parameter estimates to account for uncertainty arising via imperfect detection (including incomplete sampling) and state misclassification (11, 15, 76; Figure 8). The statistical tools most commonly used fall under two broad frameworks. Occupancy models use repeated spatio-temporal sampling to estimate detection probabilities at multiple hierarchical levels and are a flexible means of obtaining estimates of disease parameters adjusted for multiple levels of uncertainty (11, 12, 15). For example, DiRenzo et al., (77) developed a novel hierarchical occupancy model to obtain estimates of the prevalence and infection intensity of Bd in a community of frogs, adjusting for detection errors arising both from field sampling and subsequent diagnostic testing procedures. Hidden Markov models (also termed multi-event mark-recapture models), meanwhile, model both individual detection probabilities and uncertainty in state assignment (16, 78), and are a powerful means of linking disease dynamics (estimates of transmission and recovery rates) to impacts on hosts and populations [via estimates of vital rates; (21, 79)]. Moreover, multi-event models can also provide a robust framework for improving diagnostic accuracy when diagnosis is imperfect, by enabling a probability-based, rather than a binary, classification of infection status. For example, Buzdugan et al., (51) used multi-event models to integrate multiple diagnostic test data alongside ecological and epidemiological information, while accounting for multiple sources of uncertainty (imperfect detection and false positive and false negative diagnoses) to generate an infection probability value for each individual in their study.
For studies that evaluate hosts or pathogen communities, existing tools stemming from biodiversity studies, such as non-parametric richness estimators, can be readily applied to estimate or account for the non-detection of species within species assemblages (80). Several previous studies provide comprehensive guidance to the design and application of these models in disease ecology and other studies (11, 15, 52, 75, 80–82), and we refer the interested reader to the more detailed discussions therein to develop further applications in disease systems.
Despite being widely advocated and employed in disease ecology studies, the application of analytical tools to obtain unbiased and more precise parameter estimates may not always be possible. Multi-event models require long-term, and often large, datasets on marked individuals (21, 51, 83), while occupancy models demand repeated sampling at every level of inference: from conducting multiple surveys at monitoring sites, to obtaining replicate tissue samples from sampled hosts, to performing multiple diagnostic assays of those replicate samples (11, 84). Numerous financial, logistic and even biological constraints can prevent such rigorous hierarchical sampling from being undertaken. Paradoxically, these methods also require reasonable detection probabilities (of hosts and pathogens) to estimate parameters of interest (11, 78). Logistic or financial constraints that limit the scale or frequency of sampling or the type or quality of data collected, or the presence of rare species, will therefore preclude the use of statistical adjustment to account for uncertainty in many cases. When such constraints preclude the use of such models to adjust parameter estimates for heterogeneous detectability or state misclassification, it may be possible to use prior information on detectability or state uncertainty from other studies or similar systems to adjust parameter estimates via Bayesian methods, or to use simulations and sensitivity analyses to assess the influence of a range of detectabilities or misclassification bias on parameter estimates and inferences (74, 75; Figure 8).
Ultimately, statistical tools can only adjust for uncertainty due to measured and identified sources of observation error (i.e., imperfect detection and state misclassification). A post-hoc statistical adjustment of infection rates will remain biased when infection is caused by multiple unidentified pathogen species, if the time span between sampling periods is greater than the average infection time for hosts, or if important species interactions within a multi-host disease system are overlooked. Thus, to truly account for multiple sources of uncertainty in disease ecology studies researchers must (i) have an intimate knowledge of the host-pathogen dynamics, the aetiology of the disease and the ecology of the system, (ii) employ a rigorous, biologically sound, replicated survey design, (iii) statistically adjust parameter estimates for known sources of uncertainty (or assess its influence on parameters otherwise), and (iv) acknowledge remaining sources of uncertainty (Figure 8). Where possible, the influence of remaining potential sources of uncertainty should be evaluated via simulation or sensitivity analyses (e.g., as discussed above), and if necessary, inferences on disease dynamics, impacts, distributions, and trends should be tempered accordingly (Figure 8). Somewhat ironically, the four steps listed above might be exactly what a study is trying to ascertain in the first place, paving the way for studies and methods that scale with, or incrementally improve, knowledge of a system utilising an adaptive or iterative approach. As such, depending on the state of knowledge of a particular system, each of the steps in this hierarchy of actions (Figure 8) represent potential future directions or avenues of enquiry for the system at hand.
Conclusion
Reliable, unbiased and precise estimates of disease-relevant parameters are critical for disease monitoring and risk analysis; for predicting disease spread and dynamics; for understanding the ecological and evolutionary implications of pathogens in host populations; and for ensuring the success of conservation interventions and management actions (11, 15, 20, 85; Table 1). Over the last decade, disease ecologists have begun to acknowledge the importance of accounting for uncertainty when making inferences on natural disease systems (9, 11, 12, 14, 15, 20, 26, 52, 53, 76). To date, however, uncertainty in disease ecology studies has been considered primarily in terms of imperfect detection (of hosts or pathogens) or disease-state misclassification. In this review, we show that uncertainty in disease ecology studies extends beyond these components of observation error and can arise from multiple varied processes that pertain to aspects of the disease system, the study design, the methods used to study the system, and the state of knowledge of the system. Some of these processes, such as unidentified crypticity among vectors, hosts or pathogens, or a mismatch of sampling scales, may not be immediately apparent, and may not be adequately accounted for via statistical adjustments (11, 14). In this review, we have discussed the processes by which these varied sources of uncertainty can reduce the precision of, and introduce bias in, estimates of disease-relevant parameters. Importantly, we show that uncertainties in parameter estimates generated via one process may propagate through to others because of interactions between the numerous biological, methodological and environmental factors at play. Understanding how these interactions among sources of uncertainty affect the degree and direction of bias in disease-relevant parameters is a key challenge for this field, and we present a hierarchy of needs that could be tailored to individual study contexts in order to reveal next steps and future directions towards improving estimates of disease-relevant parameters.
Given the diverse set of factors that can contribute to uncertainty in disease ecology studies (Table 2), the extent of ecological variation in host-pathogen systems (e.g., Table 1), and the possibility of interactions among elements, assessments of the degree of potential bias and lack of precision in disease-relevant parameter estimates must be undertaken on a system-specific level. Nevertheless, some general guidelines are possible. The degree of uncertainty in disease ecology studies will be higher when the biology, ecology and dynamics of the system are complex or unresolved, when sampling effort is low, when sampling strategies are poorly designed (e.g., spatially or temporally biased) or undertaken at inappropriate spatial or temporal scales relative to disease dynamics, when diagnostic tools suffer from low or varying sensitivity or specificity, and when environmental covariates are complex or poorly resolved. Moreover, studies of endemic, invasive, or novel diseases may be at higher risk of uncertainty because the detectability of pathogens is often lower where disease prevalence and infection intensity are low or patchily distributed such as at invasion fronts.
Uncertainty in disease ecology studies is a certainty. In this review, we have identified a myriad of ways in which uncertainty can manifest when attempting to monitor pathogens and characterise disease dynamics in natural populations and have discussed appropriate sampling and analytical methods to account for or minimise their influence on estimates of disease-relevant parameters and identify future research priorities. We acknowledge that our list is not exhaustive, and that studies, particularly in novel systems, or that apply novel methodologies and technologies, will continue to encounter additional considerations. Nevertheless, this review should assist researchers and practitioners to navigate the pitfalls of uncertainty and strive towards more robust parameter estimates from which to make sound inferences and predictions in disease ecology.
Author Contributions
SL and KM conceived of the design and ideas in this manuscript. SL performed the literature review. SL and KM wrote the manuscript.
Funding
SL is funded by a Daphne Jackson Fellowship. KM is funded by the Medical Research Council UK (grant no. MR/P024513/1).
Conflict of Interest Statement
The authors declare that the research was conducted in the absence of any commercial or financial relationships that could be construed as a potential conflict of interest.
Acknowledgement
This work was funded by a Daphne Jackson Fellowship to SL and a Medical Research Council UK (grant no. MR/P024513/1) to KAM. We are grateful to Andrew Tyre and sarah Benhaiem for their comments on an earlier version of this manuscript.
Supplementary Material
The Supplementary Material for this article can be found online at: https://www.frontiersin.org/articles/10.3389/fvets.2018.00090/full#supplementary-material
References
1. Lachish S, Jones M, Mccallum H. The impact of disease on the survival and population growth rate of the Tasmanian devil. J Anim Ecol (2007) 76(5):926–36. doi: 10.1111/j.1365-2656.2007.01272.x
2. Murray KA, Skerratt LF, Speare R, Mccallum H. Impact and dynamics of disease in species threatened by the amphibian chytrid fungus, Batrachochytrium dendrobatidis. Conserv Biol (2009) 23(5):1242–52. doi: 10.1111/j.1523-1739.2009.01211.x
3. Vadlejch J, Kyriánová IA, Rylková K, Zikmund M, Langrová I. Health risks associated with wild animal translocation: a case of the European bison and an alien parasite. Biol. Invasions (2017) 19(4):1121–5.
4. Adams MJ, Chelgren ND, Reinitz D, Cole RA, Rachowicz LJ, Galvan S, et al. Using occupancy models to understand the distribution of an amphibian pathogen, Batrachochytrium dendrobatidis. Ecol Appl (2010) 20(1):289–302. doi: 10.1890/08-2319.1
5. Donnelly CA, Woodroffe R, Cox DR, Bourne FJ, Cheeseman CL, Clifton-Hadley RS, et al. Positive and negative effects of widespread badger culling on tuberculosis in cattle. Nature (2006) 439(7078):843–6.
6. Maher SP, Kramer AM, Pulliam JT, Zokan MA, Bowden SE, Barton HD, et al. Spread of white-nose syndrome on a network regulated by geography and climate. Nat Commun (2012) 3(1):1306.
7. Faustino CR, Jennelle CS, Connolly V, Davis AK, Swarthout EC, Dhondt AA, et al. Mycoplasma gallisepticum infection dynamics in a house finch population: seasonal variation in survival, encounter and transmission rate. J Anim Ecology (2004) 73(4):651–69. doi: 10.1111/j.0021-8790.2004.00840.x
8. Deplazes P, Hegglin D, Gloor S, Romig T. Wilderness in the city: the urbanization of Echinococcus multilocularis. Trends Parasitol. (2004) 20(2):77–84.
9. Anthony SJ, Epstein JH, Murray KA, Navarrete-Macias I, Zambrana-Torrelio CM, Solovyov A, et al. A strategy to estimate unknown viral diversity in mammals. MBio (2013) 4(5):e00598-13. doi: 10.1128/mBio.00598-13
10. Orynbayev MB, Beauvais W, Sansyzbay AR, Rystaeva RA, Sultankulova KT, Kerimbaev AA, et al. Seroprevalence of infectious diseases in saiga antelope (Saiga tatarica tatarica) in Kazakhstan 2012-2014. Prev Vet Med (2016) 127:100–4. doi: 10.1016/j.prevetmed.2016.03.016
11. Mcclintock BT, Nichols JD, Bailey LL, Mackenzie DI, Kendall WL, Franklin AB. Seeking a second opinion: uncertainty in disease ecology. Ecol. Lett. (2010) 13(6):659–74. doi: 10.1111/j.1461-0248.2010.01472.x
12. Lachish S, Gopalaswamy AM, Knowles SCL, Sheldon BC. Site-occupancy modelling as a novel framework for assessing test sensitivity and estimating wildlife disease prevalence from imperfect diagnostic tests. Methods in Ecology and Evolution (2012) 3(2):339–48. doi: 10.1111/j.2041-210X.2011.00156.x
13. Abad-Franch F, Valença-Barbosa C, Sarquis O, Lima MM. All That glisters is not gold: sampling-process uncertainty in disease-vector surveys with false negative and false positive detections. PLoS Negl Trop Dis (2014) 8(9):11. doi: 10.1371/journal.pntd.0003187
14. Zipkin EF, Jennelle CS, Cooch EG. A primer on the application of Markov chains to the study of wildlife disease dynamics. Methods in Ecology and Evolution (2010) 1(2):192–8. doi: 10.1111/j.2041-210X.2010.00018.x
15. Miller DAW, Talley BL, Lips KR, Campbell Grant EH, Grant EH. Estimating patterns and drivers of infection prevalence and intensity when detection is imperfect and sampling error occurs. Methods in Ecology and Evolution (2012) 3(5):850–9. doi: 10.1111/j.2041-210X.2012.00216.x
16. Conn PB, Cooch EG. Multistate capture-recapture analysis under imperfect state observation: an application to disease models. Journal of Applied Ecology (2009) 46(2):486–92. doi: 10.1111/j.1365-2664.2008.01597.x
17. Cooch EG, Conn PB, Ellner SP, Dobson AP, Pollock KH. Disease dynamics in wild populations: modeling and estimation: a review. J Ornithol (2012) 152(S2):485–509. doi: 10.1007/s10336-010-0636-3
18. Archaux F, Henry P-Y, Gimenez O. When can we ignore the problem of imperfect detection in comparative studies? Methods in Ecology and Evolution (2012) 3(1):188–94. doi: 10.1111/j.2041-210X.2011.00142.x
19. Senar JC. Multi-state analysis of the impacts of avian pox on a population of Serins (Serinus serinus): the importance of estimating recapture rates. Anim Biodivers Conserv (2004) 27.1:133–46.
20. Jennelle CS, Cooch EG, Conroy MJ, Senar JC. State-specific detection probabilities and disease prevalence. Ecol Appl (2007) 17(1):154–67. doi: 10.1890/1051-0761(2007)017[0154:SDPADP]2.0.CO;2
21. Lachish S, Knowles SC, Alves R, Wood MJ, Sheldon BC. Fitness effects of endemic malaria infections in a wild bird population: the importance of ecological structure. J Anim Ecol (2011) 80(6):1196–206. doi: 10.1111/j.1365-2656.2011.01836.x
22. Voordouw MJ, Lachish S, Dolan MC. The lyme disease pathogen has no effect on the survival of its rodent reservoir host. PLoS ONE (2015) 10(2):e0118265. doi: 10.1371/journal.pone.0118265
23. Madelaire CB, José da Silva R, Ribeiro Gomes F. Calling behavior and parasite intensity in treefrogs, Hypsiboas prasinus. J Herpetol (2013) 47(3):450–5. doi: 10.1670/11-315
24. Kollias GV, Sydenstricker KV, Kollias HW, Ley DH, Hosseini PR, Connolly V, et al. Experimental infection of house finches with Mycoplasma . J Wildl Dis (2004) 40(1):79–86. doi: 10.7589/0090-3558-40.1.79
25. George DB, Webb CT, Farnsworth ML, O'Shea TJ, Bowen RA, Smith DL, et al. Host and viral ecology determine bat rabies seasonality and maintenance. Proc Natl Acad Sci USA (2011) 108(25):10208–13. doi: 10.1073/pnas.1010875108
26. Canessa S, Martel A, Pasmans F. Designing screening protocols for amphibian disease that account for imperfect and variable capture rates of individuals. Ecol Appl (2014) 24(5):1204–12. doi: 10.1890/13-0103.1
27. Wilson K, Grenfell BT, Shaw DJ. Analysis of aggregated parasite distributions: A comparison of methods. Funct Ecol (1996) 10(5):592–601. doi: 10.2307/2390169
28. Beldomenico PM, Begon M. Disease spread, susceptibility and infection intensity: vicious circles? Trends Ecol Evol (2010) 25(1):21–7. doi: 10.1016/j.tree.2009.06.015
29. Grogan LF, Phillott AD, Scheele BC, Berger L, Cashins SD, Bell SC, et al. Endemicity of chytridiomycosis features pathogen overdispersion. J Anim Ecol (2016) 85(3):806–16. doi: 10.1111/1365-2656.12500
30. Anderson RM, May RM. Regulation and stability of host-parasite population interactions: I. regulatory processes. J Anim Ecol (1978) 47(1):219–47. doi: 10.2307/3933
31. Shin J, Bataille A, Kosch TA, Waldman B. Swabbing often fails to detect amphibian Chytridiomycosis under conditions of low infection load. PLoS ONE (2014) 9(10):e111091. doi: 10.1371/journal.pone.0111091
32. Miller DA, Nichols JD, Mcclintock BT, Grant EH, Bailey LL, Weir LA. Improving occupancy estimation when two types of observational error occur: non-detection and species misidentification. Ecology (2011) 92(7):1422–8. doi: 10.1890/10-1396.1
33. Samuel MD, Storm DJ. Chronic wasting disease in white-tailed deer: infection, mortality, and implications for heterogeneous transmission. Ecology (2016) 97(11):3195–205. doi: 10.1002/ecy.1538
34. Altizer S, Nunn CL, Thrall PH, Gittleman JL, Antonovics J, Cunningham AA, et al. Social organization and parasite risk in mammals: integrating theory and empirical studies. Annu Rev Ecol Evol Syst (2003) 34(1):517–47. doi: 10.1146/annurev.ecolsys.34.030102.151725
35. Weber N, Carter SP, dall SR, Delahay RJ, Mcdonald JL, Bearhop S, et al. Badger social networks correlate with tuberculosis infection. Curr Biol (2013) 23(20):R915–6. doi: 10.1016/j.cub.2013.09.011
36. Drewe JA. Who infects whom? Social networks and tuberculosis transmission in wild meerkats. Proc Biol Sci (2010) 277(1681):633–42. doi: 10.1098/rspb.2009.1775
37. Marescot L, Benhaiem S, Gimenez O, Hofer H, Lebreton J-D, Olarte-Castillo XA. Social status mediates the fitness costs of infection with canine distemper virus in a social carnivore. Funct Ecol (2018) 00:1–14.
38. Plowright RK, Manlove KR, Besser TE, Páez DJ, Andrews KR, Matthews PE, et al. Age-specific infectious period shapes dynamics of pneumonia in bighorn sheep. Ecol Lett (2017) 20(10):1325–36. doi: 10.1111/ele.12829
39. Gómez-Díaz E, Doherty PF, Duneau D, Mccoy KD. Cryptic vector divergence masks vector-specific patterns of infection: an example from the marine cycle of Lyme borreliosis. Evol Appl (2010) 3(4):391–401. doi: 10.1111/j.1752-4571.2010.00127.x
40. Palinauskas V, Žiegytė R, Ilgūnas M, Iezhova TA, Bernotienė R, Bolshakov C, et al. Description of the first cryptic avian malaria parasite, Plasmodium homocircumflexum n. sp., with experimental data on its virulence and development in avian hosts and mosquitoes. Int J Parasitol (2015) 45(1):51–62. doi: 10.1016/j.ijpara.2014.08.012
41. Ishtiaq F, Rao M, Huang X, Bensch S. Estimating prevalence of avian haemosporidians in natural populations: a comparative study on screening protocols. Parasit Vectors (2017) 10(1):127. doi: 10.1186/s13071-017-2066-z
42. Gibb R, Moses LM, Redding DW, Jones KE. Understanding the cryptic nature of Lassa fever in West Africa. Pathog Glob Health (2017) 111(6):276–88. doi: 10.1080/20477724.2017.1369643
43. Bass D, Stentiford GD, Littlewood DTJ, Hartikainen H. Diverse applications of environmental DNA methods in parasitology. Trends Parasitol (2015) 31(10):499–513. doi: 10.1016/j.pt.2015.06.013
44. Jolles AE, Ezenwa VO, Etienne RS, Turner WC, Olff H. Interactions between macroparasites and microparasites drive infection patterns in free-ranging African buffalo. Ecology (2008) 89(8):2239–50. doi: 10.1890/07-0995.1
45. Budischak SA, Jolles AE, Ezenwa VO. Direct and indirect costs of co-infection in the wild: Linking gastrointestinal parasite communities, host hematology, and immune function. Int J Parasitol Parasites Wildl (2012) 1(Supplement C):2–12. doi: 10.1016/j.ijppaw.2012.10.001
46. Susi H, Barrès B, Vale PF, Laine AL. Co-infection alters population dynamics of infectious disease. Nat Commun (2015) 6(1):5975. doi: 10.1038/ncomms6975
47. Kilpatrick AM, Daszak P, Jones MJ, Marra PP, Kramer LD. Host heterogeneity dominates West Nile virus transmission. Proc Biol Sci (2006) 273(1599):2327–33. doi: 10.1098/rspb.2006.3575
48. Loss SR, Hamer GL, Walker ED, Ruiz MO, Goldberg TL, Kitron UD, et al. Avian host community structure and prevalence of West Nile virus in Chicago, Illinois. Oecologia (2009) 159(2):415–24. doi: 10.1007/s00442-008-1224-6
49. Gürtler RE, Cardinal MV. Reservoir host competence and the role of domestic and commensal hosts in the transmission of Trypanosoma cruzi. Acta Trop (2015) 151:32–50. doi: 10.1016/j.actatropica.2015.05.029
50. Murray KA, Olivero J, Roche B, Tiedt S, Guégan J-F. Pathogeography: leveraging the biogeography of human infectious diseases for global health management. Ecography (2018). doi: 10.1111/ecog.03625
51. Buzdugan SN, Vergne T, Grosbois V, Delahay RJ, Drewe JA. Inference of the infection status of individuals using longitudinal testing data from cryptic populations: Towards a probabilistic approach to diagnosis. Sci Rep (2017) 7(1):1111. doi: 10.1038/s41598-017-00806-4
52. Nusser SM, Clark WR, Otis DL, Huang L. Sampling considerations for disease surveillance in wildlife populations. Journal of Wildlife Management (2008) 72(1):52–60. doi: 10.2193/2007-317
53. Johnson PT, Ostfeld RS, Keesing F. Frontiers in research on biodiversity and disease. Ecol Lett (2015) 18(10):1119–33. doi: 10.1111/ele.12479
54. Wood CL, Lafferty KD. Biodiversity and disease: a synthesis of ecological perspectives on Lyme disease transmission. Trends Ecol Evol (2013) 28(4):239–47. doi: 10.1016/j.tree.2012.10.011
55. Johnson BJ, Munafo K, Shappell L, Tsipoura N, Robson M, Ehrenfeld J, et al. The roles of mosquito and bird communities on the prevalence of West Nile virus in urban wetland and residential habitats. Urban Ecosyst (2012) 15(3):513–31. doi: 10.1007/s11252-012-0248-1
56. Levi T, Keesing F, Holt RD, Barfield M, Ostfeld RS. Quantifying dilution and amplification in a community of hosts for tick-borne pathogens. Ecol Appl (2016) 26(2):484–98. doi: 10.1890/15-0122
57. Murray KA, Retallick RWR, Puschendorf R, Skerratt LF, Rosauer D, Mccallum HI, et al. Assessing spatial patterns of disease risk to biodiversity: implications for the management of the amphibian pathogen, Batrachochytrium dendrobatidis. Journal of Applied Ecology (2011) 48(1):163–73. doi: 10.1111/j.1365-2664.2010.01890.x
58. Guillera-Arroita G. Modelling of species distributions, range dynamics and communities under imperfect detection: advances, challenges and opportunities. Ecography (2017) 40(2):281–95. doi: 10.1111/ecog.02445
59. Phillips SJ, Dudík M, Elith J, Graham CH, Lehmann A, Leathwick J, et al. Sample selection bias and presence-only distribution models: implications for background and pseudo-absence data. Ecol Appl (2009) 19(1):181–97. doi: 10.1890/07-2153.1
60. Bollaerts K, Aerts M, Shkedy Z, Faes C, van der Stede Y, Beutels P, et al. Estimating the population prevalence and force of infection directly from antibody titres. Stat Modelling (2012) 12(5):441–62. doi: 10.1177/1471082X12457495
61. Gilbert AT, Fooks AR, Hayman DT, Horton DL, Müller T, Plowright R, et al. Deciphering serology to understand the ecology of infectious diseases in wildlife. Ecohealth (2013) 10(3):298–313. doi: 10.1007/s10393-013-0856-0
62. Benavides JA, Caillaud D, Scurlock BM, Maichak EJ, Edwards WH, Cross PC. Estimating loss of Brucella abortus antibodies from age-specific serological data in Elk. Ecohealth (2017) 14(2):234–43. doi: 10.1007/s10393-017-1235-z
63. Butler CJ, Edwards WH, Jennings-Gaines JE, Killion HJ, Wood ME, Mcwhirter DE, et al. Assessing respiratory pathogen communities in bighorn sheep populations: Sampling realities, challenges, and improvements. PLoS ONE (2017) 12(7):21. doi: 10.1371/journal.pone.0180689
64. Elmore SA, Huyvaert KP, Bailey LL, Iqbal A, Su C, Dixon BR, et al. Multi-scale occupancy approach to estimate Toxoplasma gondii prevalence and detection probability in tissues: an application and guide for field sampling. Int J Parasitol (2016) 46(9):563–70. doi: 10.1016/j.ijpara.2016.04.003
65. Svensson-Coelho M, Silva GT, Santos SS, Miranda LS, Araújo-Silva LE, Ricklefs RE, et al. Lower detection probability of avian Plasmodium in blood compared to other tissues. J Parasitol (2016) 102(5):559–61. doi: 10.1645/16-8
66. Hosseini PR, Dhondt AA, Dobson A. Seasonality and wildlife disease: how seasonal birth, aggregation and variation in immunity affect the dynamics of Mycoplasma gallisepticum in house finches. ProcBiol Sci (2004) 271(1557):2569–77. doi: 10.1098/rspb.2004.2938
67. Altizer S, Dobson A, Hosseini P, Hudson P, Pascual M, Rohani P. Seasonality and the dynamics of infectious diseases. Ecol Lett (2006) 9(4):467–84. doi: 10.1111/j.1461-0248.2005.00879.x
68. Reye AL, Hübschen JM, Sausy A, Muller CP. Prevalence and seasonality of tick-borne pathogens in questing Ixodes ricinus ticks from Luxembourg. Appl Environ Microbiol (2010) 76(9):2923–31. doi: 10.1128/AEM.03061-09
69. Haapkyl㤠J, Unsworth RKF, Flavell M, Bourne DG, Schaffelke B, Willis BL. Correction: Seasonal Rainfall and Runoff Promote Coral Disease on an Inshore Reef. PLoS ONE (2011) 6(3):10. doi: 10.1371/annotation/365162ee-3718-44ce-b2e9-88302d5e0801
70. Langwig KE, Frick WF, Reynolds R, Parise KL, Drees KP, Hoyt JR, et al. Host and pathogen ecology drive the seasonal dynamics of a fungal disease, white-nose syndrome. Proc Biol Sci (2015) 282(1799):20142335. doi: 10.1098/rspb.2014.2335
71. Puschendorf R, Hoskin J, Cashins C, McDonald S, Skerratt K, Vanderwal JL, et al. Environmental refuge from disease-driven amphibian extinction. (2011).
72. Banks-Leite C, Pardini R, Boscolo D, Cassano CR, Püttker T, Barros CS, et al. Assessing the utility of statistical adjustments for imperfect detection in tropical conservation science. J Appl Ecol (2014) 51(4):849–59. doi: 10.1111/1365-2664.12272
73. Valença-Barbosa C, Lima MM, Sarquis O, Bezerra CM, Abad-Franch F. Modeling disease vector occurrence when detection is imperfect II: Drivers of site-occupancy by synanthropic Triatoma brasiliensis in the Brazilian northeast. PLoS Negl Trop Dis (2014) 8(5):12. doi: 10.1371/journal.pntd.0002861
74. Heisey DM, Jennelle CS, Russell RE, Walsh DP. Using auxiliary information to improve wildlife disease surveillance when infected animals are not detected: a Bayesian approach. PLoS ONE (2014) 9(3):e89843. doi: 10.1371/journal.pone.0089843
75. Ruiz-Gutierrez V, Hooten MB, Campbell Grant EH, Grant EHC. Uncertainty in biological monitoring: a framework for data collection and analysis to account for multiple sources of sampling bias. Methods Ecol Evol (2016) 7(8):900–9. doi: 10.1111/2041-210X.12542
76. Colvin ME, Peterson JT, Kent ML, Schreck CB. Occupancy modeling for improved accuracy and understanding of pathogen prevalence and dynamics. PLoS ONE (2015) 10(3):e0116605. doi: 10.1371/journal.pone.0116605
77. Direnzo GVCG, Evan H, Longo A V, Che-Castaldo C, Zamudio KR, Lips KR. Imperfect pathogen detection from non-invasive skin swabs biases disease inference. Methods. Ecol Evol (2018) 2:380–9.
78. Choquet R, Rouan L, Pradel R. Program E-SURGE: a software application for fitting multievent models. Modeling Demographic Processes in Marked Populations (2009) 3:845–65.
79. Lachish S, Knowles SC, Alves R, Wood MJ, Sheldon BC. Infection dynamics of endemic malaria in a wild bird population: parasite species-dependent drivers of spatial and temporal variation in transmission rates. J Anim Ecol (2011) 80(6):1207–16. doi: 10.1111/j.1365-2656.2011.01893.x
80. Chao A, Jost L. Estimating diversity and entropy profiles via discovery rates of new species. Methods Ecol Evol (2015) 6(8):873–82. doi: 10.1111/2041-210X.12349
81. Miller DAW, Bailey LL, Grant EHC, Mcclintock BT, Weir LA, Simons TR. Performance of species occurrence estimators when basic assumptions are not met: a test using field data where true occupancy status is known. Methods Ecol Evol (2015) 6(5):557–65. doi: 10.1111/2041-210X.12342
82. Clement MJ. Designing occupancy studies when false-positive detections occur. Methods Ecol Evol (2016) 7(12):1538–47. doi: 10.1111/2041-210X.12617
83. Chambert T, Staszewski V, Lobato E, Choquet R, Carrie C, Mccoy KD, et al. Exposure of black-legged kittiwakes to Lyme disease spirochetes: dynamics of the immune status of adult hosts and effects on their survival. J Anim Ecol (2012) 81(5):986–95. doi: 10.1111/j.1365-2656.2012.01979.x
84. Eads DA, Biggins DE, Antolin MF, Long DH, Huyvaert KP, Gage KL. Prevalence of the generalist flea Pulex simulans on black-tailed prairie dogs (Cynomys ludovicianus) in New Mexico, USA: the importance of considering imperfect detection. J Wildl Dis (2015) 51(2):498–502. doi: 10.7589/2014-07-178
85. Nichols JD, Hollmen TE, Grand JB. Monitoring for the Management of Disease Risk in Animal Translocation Programmes. Ecohealth (2017) 14(Suppl 1):156–66. doi: 10.1007/s10393-015-1094-4
Glossary of terms
Accuracy: the degree of closeness of a measurement of a quantity to its true value. It is a description of both systematic and random errors, such that high accuracy requires both high precision and low bias.
Bias: the tendency of measurements of a quantity to shift systematically in one direction from the true value. It is a description of systematic errors.
Detectability: probability that an organism will be encountered (captured or seen) in its natural habitat during a survey.
Disease-induced impacts: changes in host fitness, behaviour, or physiological performance caused by pathogen infection.
Disease state uncertainty: occurs when disease state assignment is subject to error (disease state misclassification) or not known for a portion of the sampled individuals.
Force of infection: the instantaneous rate at which susceptible individuals acquire infection.
Heterogeneity in detectability: occurs when there is variation in the probability of detecting organisms in their natural habitat.
Imperfect detection: occurs when the probability of detecting an organism in its natural habitat is less than one.
Incidence: the rate at which new infections occur in a population during a specified period.
Macroparasite: a pathogen that does not multiply within its host (e.g., helminths).
Microparasite: a pathogen that does multiply within its host (e.g., viruses).
Pathogen load: is a measure of the number of parasites that a host organism harbours. Also referred to as the intensity of infection.
Persistence time: length of time an infectious agent persists in the environment.
Precision: the degree of agreement in a series of measurements of a quantity. It is a description of random errors; a measure of statistical variability.
Prevalence: the proportion of a population that are infected at a point in time.
Risk of infection: the probability of becoming infected given that exposure to an infectious pathogen has occurred.
Sensitivity: the ability of a test to identify correctly those with the disease (true positive rate).
Specificity: the ability of the test to identify correctly those without the disease (true negative rate).
Taxonomic crypticity: occurs when individuals are phenotypically indistinguishable but genetically distinct.
Transmission rate: the rate at which pathogens pass from infected hosts to other individuals in a population, or the rate at which hosts contact infectious agents in the environment, during a specified period.
Uncertainty: occurs when incomplete knowledge of a system, or irreducible naturally occurring noise, prevents ascertainment of the truth. Uncertainty leads to a lack of precision and bias in measurements obtained.
Keywords: imperfect detection, state misclassification, sensitivity, specificity, wildlife disease, host-pathogen, prevalence, disease impacts
Citation: Lachish S and Murray KA (2018). The Certainty of Uncertainty: Potential Sources of Bias and Imprecision in Disease Ecology Studies. Front. Vet. Sci. 5:90. doi: 10.3389/fvets.2018.00090
Received: 31 January 2018; Accepted: 12 April 2018;
Published: 22 May 2018
Reviewed by:
Andrew Tyre, University of Nebraska-Lincoln, United StatesSarah Benhaiem, Leibniz Institute for Zoo and Wildlife Research (LG), Germany
Copyright © 2018 Lachish and Murray. This is an open-access article distributed under the terms of the Creative Commons Attribution License (CC BY). The use, distribution or reproduction in other forums is permitted, provided the original author(s) and the copyright owner are credited and that the original publication in this journal is cited, in accordance with accepted academic practice. No use, distribution or reproduction is permitted which does not comply with these terms.
*Correspondence: Shelly Lachish, shelly.lachish@zoo.ox.ac.uk