Modeling the Transmission of Vibrio aestuarianus in Pacific Oysters Using Experimental Infection Data
 Coralie Lupo1*
  Marie-Agnès Travers1
  Delphine Tourbiez1
  Clément Félix Barthélémy1
  Gaël Beaunée2 Pauline Ezanno2
- 1Laboratoire de Génétique et Pathologie des Mollusques Marins, SG2M-LGPMM, Ifremer, La Tremblade, France
- 2BIOEPAR, INRA, Oniris, Nantes, France
Vibrio aestuarianus is a bacterium related to mortality outbreaks in Pacific oysters, Crassostrea gigas, in France, Ireland, and Scotland since 2011. Knowledge about its transmission dynamics is still lacking, impairing guidance to prevent and control the related disease spread. Mathematical modeling is a relevant approach to better understand the determinants of a disease and predict its dynamics in imperfectly observed pathosystems. We developed here the first marine epidemiological model to estimate the key parameters of V. aestuarianus infection at a local scale in a small and closed oyster population under controlled laboratory conditions. Using a compartmental model accounting for free-living bacteria in seawater, we predicted the infection dynamics using dedicated and model-driven collected laboratory experimental transmission data. We estimated parameters and showed that waterborne transmission of V. aestuarianus is possible under experimental conditions, with a basic reproduction number R0 of 2.88 (95% CI: 1.86; 3.35), and a generation time of 5.5 days. Our results highlighted a bacterial dose–dependent transmission of vibriosis at local scale. Global sensitivity analyses indicated that the bacteria shedding rate, the concentration of bacteria in seawater that yields a 50% chance of catching the infection, and the initial bacterial exposure dose W0 were three critical parameters explaining most of the variation in the selected model outputs related to disease spread, i.e., R0, the maximum prevalence, oyster survival curve, and bacteria concentration in seawater. Prevention and control should target the exposure of oysters to bacterial concentration in seawater. This combined laboratory–modeling approach enabled us to maximize the use of information obtained through experiments. The identified key epidemiological parameters should be better refined by further dedicated laboratory experiments. These results revealed the importance of multidisciplinary approaches to gain consistent insights into the marine epidemiology of oyster diseases.
Introduction
Mass mortality of adult Pacific oysters, Crassostrea gigas, has been reported since 2001 in France, in association with the detection of the bacterium Vibrio aestuarianus. Since 2011, an increase in the incidence of these mortality events has been observed (1). This bacterium has been isolated recently during oyster mortality events also in Ireland and Scotland (2, 3). Such an increase in mortality has a strong direct economic impact, causing considerable concerns among farmers because adult oysters that have reached their marketable size are mainly affected (4). Mortality mainly occurs in summer and seems to last for a long period, reaching a cumulative mortality rate of ~30% at the end of the farming cycle (1). To date, knowledge about this infection mainly concerns the properties of the etiological agent V. aestuarianus, its diversity (5, 6) and virulence factors (5, 7), the diagnostic methods available (8), and the potential genetic basis for oyster resistance to the induced disease (4, 9). The burden of V. aestuarianus infection in oysters has been less studied. Hemolymph is colonized early by the bacterium, and the disease rapidly progresses through septicemia (10). Experimental reproduction of the disease in cohabitation trials has shown that oyster sensitivity increases with age and size, mortality rates reaching up to 75% during the 15 days post-exposure (dpe) (4, 11). Oyster mortality rates increase with the bacterial concentration in seawater, indicating a dose-dependent process in disease progression (12). Because DNA of V. aestuarianus has not been detected in surviving challenged oysters (12), it seems that these oysters never got infected. This observation also suggests that the oyster once infected never returns to a truly uninfected state, death being the sole outcome. The infection kinetics seems to be modulated by seawater temperature: the warmer the water, the faster is the infection (13), infection occurring within a range from 9–13°C to 19–20°C (3). Attention has naturally focused on the biology of the individual organism. To date, knowledge about pathogen transmission has been ignored. As a result, facing outbreaks has typically given rise to mainly observation of cases and their possible drivers rather than the implementation of efficient control measures. The quantification of the transmission of these bacteria is a worthwhile step for further elucidating the disease spread and establishment in oyster populations, and to substantially inform disease management.
Mathematical modeling can be used to provide new insights on the relative importance of factors influencing disease spread (14). Such an approach synthesizes knowledge about a disease into a quantitative framework (15). The choice of an appropriate mode of a transmission model is also crucial for designing a proper intervention strategy (16). To date, despite the acknowledged application of susceptible-infectious-recovered (SIR) compartmental modeling framework to marine diseases (16, 17) and to their invertebrate hosts (18), epidemiological models of pathogen transmission remain on the fringe of marine disease modeling, partly because of limited amounts of data (19, 20). Examples of disease dynamics among marine invertebrates have previously been formulated, e.g., describing direct waterborne transmission of white plague type in corals (21, 22) or withering syndrome in abalone (23). Bivalve diseases have received less attention. The possible transmission mechanisms of bonamiosis in flat oyster Ostrea edulis populations have been explored theoretically by comparing five compartmental models, without relating them to any particular case study (24). More recently, a theoretical compartmental model was formulated to represent the transmission of diseases among marine suspension-feeders (25), e.g., oysters. The mode of transmission was assumed to involve contacts between the host and the free-living stages of the pathogen in seawater, described there by filtration of infective particles released by infected and/or dead individuals, including dose dependence and dilution via volume of the water column (25). This transmission model explicitly accounts for pathogen population multiplication or reduction inside and outside its host and includes several explicit compartments for waterborne pathogens, a filtered pool of pathogens in hosts, and a remote pool of pathogens (25, 26). This conceptual model was further adapted to simulate the dynamics of Perkinsus marinus, a well-known parasite of the Eastern oyster Crassostrea virginica (27), via the incorporation of seasonal factors. However, there is currently no knowledge about the V. aestuarianus environmental populations, thus preventing the formulation of such a detailed model. Besides, as this bacterium belongs to the genus Vibrio, a direct waterborne transmission among oysters similar to Vibrio cholerae can be assumed. Mathematical modeling of cholera transmission among humans, where the causative agent is the bacterium V. cholerae, has become exemplary within the framework of environmentally transmitted infectious diseases (28). Cholera models are mainly formulated via SIR compartmental modeling framework and imply that individuals become infected via the consumption of contaminated seawater, therefore including an explicit compartment for the aquatic reservoir of pathogens (29). This model formulation could thus be adapted to V. aestuarianus, considering an explicit compartment for free-living bacteria in seawater but without detailing all of the pathogen multiplication processes.
Except for one (27), the parameterization of existing marine invertebrate disease models has been based on theoretical parameter values. These have been chosen arbitrarily, albeit biologically plausible (21–26). In any host–pathogen system, epidemiological parameters are difficult to measure directly (30). Indeed, because diseased mollusks show only very seldom symptoms, mortality event is often the only suspicious sign of disease observed in the field, and laboratory test analyses are necessary to identify the causative pathogen (31). In France, the current surveillance system is mainly based on the notifications of mollusk mortality by farmers, and laboratory investigation of these notifications is not systematic (32). In addition, as V. aestuarianus is not a notifiable disease, no active surveillance of this pathogen is conducted. Consequently, field data are insufficient to quantify the transmission of marine molluscan diseases.
To overcome this lack of observation data, the quantification of epidemiological parameters can be performed experimentally (30). Several studies have attempted to quantify these parameters under experimental conditions to further inform mathematical models of marine infectious diseases (33, 34). Some small-scale laboratory experiments have been carried out to explore bacterial shedding, the minimum infective dose, and half-lethal dose (LD50) of V. aestuarianus infection among oysters (12). Nevertheless, parameters have been estimated independently in separate experiments, thereby probably leading to misestimating their value because the assumption of independence among parameters may be violated. In addition, due to logistical constraints, only small populations can be studied under experimental conditions. As these parameters most probably are highly heterogeneous among individuals, it is difficult to accurately estimate them, requiring population scale experiments.
Thus, given that the quantification of epidemiological parameters is not straightforward, it becomes crucial to first identify the key parameters whose variations strongly influence model outputs, in order to subsequently focus research investment for reducing model prediction uncertainty. Key parameters can be identified by analyzing the model sensitivity, i.e., by studying the effects on model outputs of varying input epidemiological parameters.
Our objective was to better understand and predict V. aestuarianus transmission in Pacific oysters using experimental data. We developed a mathematical model based on the model for V. cholera (29) and fitted to data on V. aestuarianus from dedicated laboratory experiments. Using the model, we (1) reproduced the transmission of V. aestuarianus among oysters (2), evaluated the ability of the pathogen to invade an oyster population under experimental small-scale conditions reproducing natural course of the infection (3). identified epidemiological parameters influencing pathogen spread the most within a small oyster population, and (4) provided probable range estimates of these parameters.
Materials and Methods
Description of the Natural System
V. aestuarianus infection is transmitted through a direct waterborne process (10). Infected oysters shed bacteria in water until their death. When exposed to contaminated water, new oysters can get infected. After an incubation period during which the bacteria invade the oyster, infected oysters start shedding bacteria in the seawater.
Experimental Design
Animals
Batches of Pacific oyster C. gigas were produced in March 2013 in Ifremer Argenton (Bretagne, France), transferred in May to the Ifremer nursery at Bouin facilities (Vendée, France) and in November 2014 to the Ifremer experimental facilities in La Tremblade (Charente-Maritime, France). The oysters were housed in 240 L raceways with a continuous ultraviolet (UV) light–treated seawater flow and an ad libitum phytoplankton diet (Isochrysis galbana, Tetraselmis suecica, and Skeletonema costatum). Oysters used in the experiments in September 2015 weighted by mean 12.1 g ± 1.6 (body weight). Twelve oysters were screened before experiments for V. aestuarianus and OsHV-1 herpes virus DNA by standardized quantitative PCR (qPCR) protocols (8, 35) to ensure that the batches were not infected before the transmission trials. This sample size calculation was based on the assumption that both infections would exist in the population above a prevalence of 20–30% in permissive conditions, i.e., allowing their progression (10).
Bacterial Strains and Inoculum Preparation
The GFP-tagged V. aestuarianus strain used in this study was derived from wild-type strain 02/041 (36, 37). Vibrio isolates were grown in the Luria-Bertani (LB) medium or LB agar supplemented with 0.5 M NaCl in the presence of kanamycin (40 μg/mL), at 20°C. The cells were washed twice with filtered sterile seawater before adjustment to optical density at 600 nm (OD600) of 1.0. Bacterial concentration and purity were checked by conventional dilution plating.
Contaminated-Seawater Preparation
Oysters were myorelaxed for 2–3 h at 20°C in a magnesium chloride solution (MgCl2, Sigma-Aldrich) at a concentration of 50 g/L (1/4 [v/v] seawater/freshwater) with aeration. Next, 100 μL of a bacterial suspension was injected into the adductor muscle. A group of 10 oysters was injected with filtered sterile seawater as negative controls. The inoculated oysters were then transferred to tanks (60 oysters per tank) filled with 12 L of UV light–treated and filtered seawater and maintained at 20°C under static conditions with aeration. After 48 h, the contaminated seawater surrounding moribund oysters was titrated by flow cytometry and qPCR before adjustment to two doses (low and high doses; between 5 × 10⁴ and 1 × 10⁶ bacteria/mL) by dilution in UV light–treated and filtered seawater.
Transmission Trials
Oysters (2 dose conditions × 10 oysters) were transiently exposed to the contaminated seawater by immersion in individual aerated containers (300 mL) for 24 h at 20°C before transfer into clean beakers. All the containers were monitored daily by collection of seawater samples. As soon as V. aestuarianus was detected in seawater by flow cytometry, oysters in contact with contaminated seawater (hereafter: contact oysters) were assumed to be infectious, were removed from the container, and daily transferred into new 300 mL containers with UV light–treated and filtered seawater. Containers with shed bacteria were followed for up to 7 days after oyster removal, by flow cytometry and qPCR. Contact oyster mortality was also recorded daily for 12 dpe, and dead oysters were daily removed. The animals were considered dead when the valves did not close after transfer on tank covers. Infection by V. aestuarianus was confirmed by qPCR in oyster tissue samples. Figure 1 summarizes the experimental design.
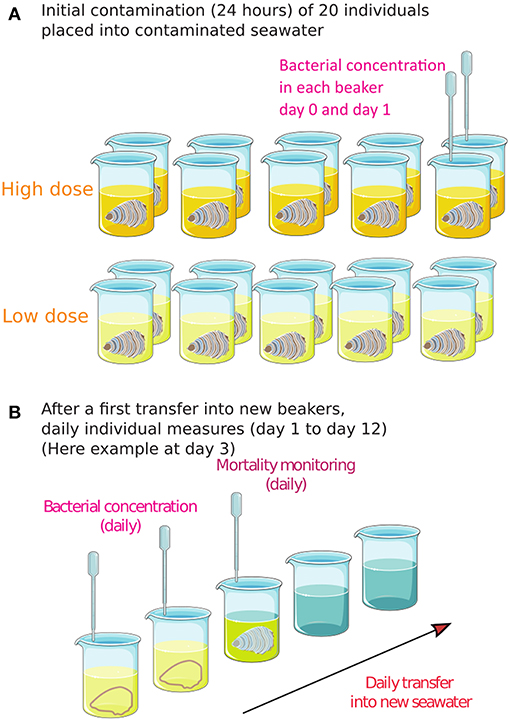
Figure 1. The experimental design for assessing Vibrio aestuarianus transmission from contaminated seawater to contact oysters. (A) Initial exposure of 10 oysters × 2 doses for 24 h. (B) After transfer of each individual oyster into a new beaker with clean seawater, daily individual measures were conducted for 12 days. As soon as bacteria were detected in the seawater, the oyster was transferred into a new beaker, and the survival of bacteria was measured daily in the previous beaker (now empty).
Three temporal individual trials were conducted (2 dose conditions × 3 trials × 10 oysters) in this study. Moreover, in two of these trials, complementary experiments and measures were conducted on small populations of 10 oysters in triplicate in 3 L tanks (2 dose conditions × 2 trials × 3 populations of 10 oysters), allowing 12 replicates of the transmission trials at a small population level.
V. Aestuarianus Counts and Detection
The presence of GFP-tagged bacteria and bacterial counts were measured in 100 μl of sampled seawater by flow cytometry (Coulter Epics XL cytometer, Beckman®, and CyFlow Cube 6 Robby Partec®) on 10,000 events or after 5 min with a fixed threshold of FL1 fluorescence. This method enabled measurement of a concentration of V. aestuarianus ≥103 bacteria/mL. V. aestuarianus DNA amounts were measured by qPCR detection methods (8) in oyster tissues (50 mg) or seawater (100 μL) after DNA extraction via QiaAmp® tissue kit procedures (Qiagen®) and total-DNA adjustment to 5 ng/μL when needed. A standard curve was built by means of serially diluted titrated genomic extracts (12). Assays were performed on MX3000 and MX3005 machines (Agilent®) with the Brilliant III Ultrafast kit (Stratagene®).
Modeling
Based on a study on a Vibrio bacterium (29) and on new experimental data (this study), a stochastic compartmental model of the SWEI (susceptible-water-exposed-infectious) type was chosen to represent V. aestuarianus transmission among oysters in a small-scale population (§2.3.1). In this system, infection transmission occurred through contacts between susceptible oysters and the contaminated seawater, i.e., through direct waterborne transmission. Parameters were calibrated using an Approximated Bayesian Computation (ABC) approach (§2.3.2) using the new experimental data described above.
Model Formulation
By being exposed to contaminated water (W) containing bacteria, a susceptible oyster (S) became infected (E) at rate a.λ(W), where a is the rate of effective exposure to the bacteria in the contaminated water (per day) and λ(W) is the probability (unitless) of a susceptible oyster to catch the infection. An infected oyster became infectious (I), i.e., started shedding an amount of bacteria per mL and per day (e), after a latent period (1/ρ), and shed during an infectious period (1/r). After initiation of the infection, we assumed that the only outcome for an oyster was death (9, 12). To reproduce the lab experiment in which dead oysters were removed every day, no state was considered in the model for dead animals. Therefore, each oyster was in one of the three mutually exclusive health states at a given time point: S (susceptible oyster), E (non-shedder infected oyster), or I (shedder infectious oyster). Let N denote the total alive population size, i.e., N = S + E + I. Shedders (I) filled the water compartment (W) with bacteria. The decay rate of V. aestuarianus in the seawater ξ included the natural mortality, sedimentation, and other stages of the bacterium that prevent its transmission to susceptible oysters. In absence of evidence of V. aestuarianus persistence in the seawater (10, 38, 39), the growth rate of the bacterium in this compartment was neglected.
A flow diagram of the model is shown in Figure 2, and parameters are defined in Table 1. The temporal dynamics of V. aestuarianus in the oyster population and in seawater was described by the following system of ordinary differential equations [equations (1) to (4)] in a deterministic framework:
Probability of catching V. aestuarianus infection λ(W) was extrapolated from studies on V. cholera (29) and depended on the concentration of the pathogen in water. This dependence was represented by a logistic dose–response function as:
where K is the concentration of bacteria in water that yields a 50% chance of catching infection, i.e., the half-infective dose.
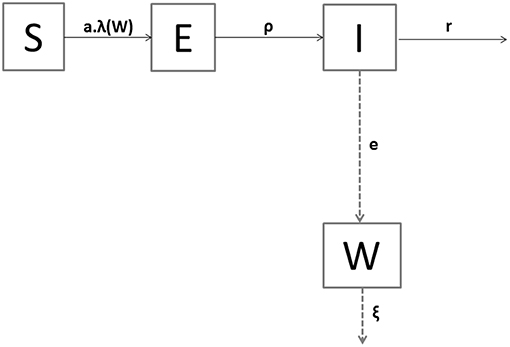
Figure 2. Compartmental model of Vibrio aestuarianus spread among oysters and in their environment. The health states of oysters are S for susceptible, E for exposed, and I for infectious. W denotes the seawater concentration of free-living bacteria. Solid arrows indicate oyster transitions between heath states. Dashed arrows represent the dynamics of the pathogen population. The description of parameters is the same is in Table 1.
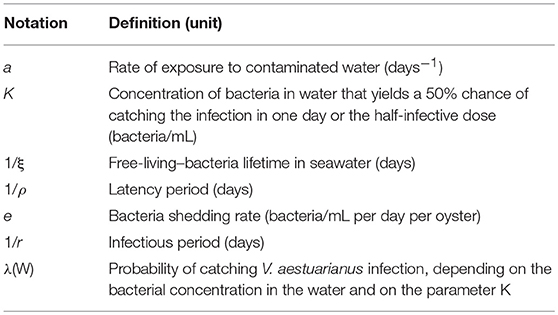
Table 1. Definition of model parameters.
Because the population was small, a stochastic counterpart of the ordinary differential equation system was run in discrete time. Health transitions and the bacteria decay rate (τij) were transformed into probabilities (pij) as follows: for each transition from compartment i to compartment j, pij = 1–exp(–Δtτij). The flow of individuals between compartments i and j (ΔNij) was then ΔNij = Binomial (Nij, pij), with Nij being the number of individuals in compartment i. The bacteria shedding rate followed a Poisson distribution. The model was solved using a daily time step, with a closed population. The behavior of the model was analyzed by running 10,000 numerical simulations.
Model Parameterization and Initial Conditions
The model parameters were calibrated by integrating knowledge from experimental individual trials.
Because we assumed that after initiation of V. aestuarianus infection, the only outcome for an oyster is death, half-infective dose K was approximated by the half-lethal dose (LD50) of V. aestuarianus via contaminated-seawater exposure. LD50 was estimated using a dose–response model described by a four-parameter log-logistic function. This model was fitted to data from the individual triplicate trials, which were conducted at different doses (Table 2). A 95% confidence interval (CI) of LD50 was computed from the approximate standard errors calculated by the delta method (40). Because we assumed that a lower bacterial concentration would infect an oyster but would need more time to provoke oyster death than the usual duration to estimate the LD50, (7 days), a range of probable values was assigned to K by fitting a uniform distribution ranging between the bounds of the LD50 95% CI, with the lower bound being lowered by one Log value.
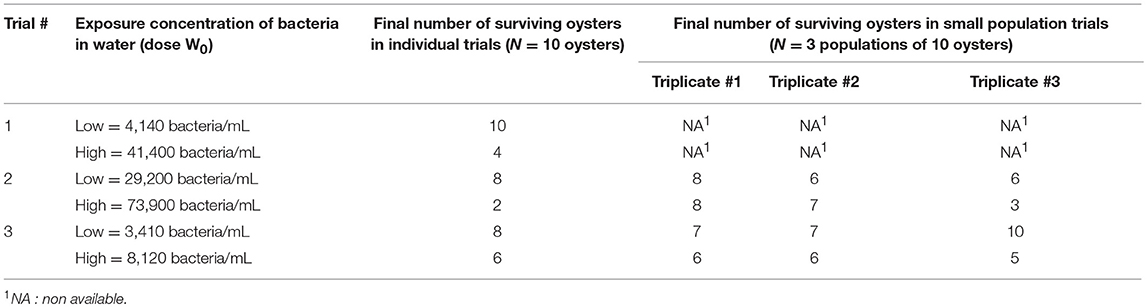
Table 2. Observed final (12 dpe) number of surviving oysters in the laboratory transmission trials.
Exposure rate (a, per day) was estimated as a relative difference between the counts of bacteria before and after the 24 h of exposure to contaminated seawater. This daily exposure rate was assumed to be constant throughout the duration of the experiments. The latent period (1/ρ, days) was defined as the time from exposure to contaminated seawater to the start of bacteria shedding. The infectious period (1/r, days) was defined as the period from the start of oyster shedding to death. The bacteria shedding rate (e, bacteria/mL per oyster per day) was determined daily by measuring bacterial concentration in seawater. Free-living–bacteria lifetime in seawater (1/ξ, days) was defined as the number of days V. aestuarianus could be detected in the seawater.
Observed distributions of these parameters were described by the mean, mode, median, quartiles, minimum, and maximum. Independence of the parameters was assessed by calculating the Spearman correlation coefficient.
For each of the model parameters, the observed mode from experimental data was chosen as the most probable value. When the parameters were not independent, they were represented by the estimated mode, from distributions that were produced using an Approximated Bayesian Computation (ABC) approach (see below).
As initial conditions, the population size was modeled with 10 susceptible oysters to mimic the experiments in the 3 L tanks for 12 days. Seawater was supplemented with bacteria at different initial concentrations (W0), to reproduce the exposure to contaminated seawater in the 12 population experiments (Table 2).
Model Outputs
Five outputs were chosen to characterize the infection course. Two were dynamic over time: the number of live oysters (S+E+I) and the concentration of bacteria in water (W). Three were point outputs: the maximum prevalence (i.e., the maximum number of infected E and infectious I oysters during an infection simulation), the generation time, and the basic reproduction number R0.
The generation time was defined as the period between the onset of the infectious period in a primary case and the onset of the infectious period in a secondary case. It was defined from the sum of the average latent and infectious periods (41).
The basic reproduction number, R0, is defined as the average number of secondary infections caused by one infected entity (animal or free-living bacteria) introduced into a fully susceptible population (41), and it determines whether a disease will spread on average within a population. R0 carries information on the magnitude of the transmission during generation time. R0 was calculated using the next generation matrix approach (42, 43). In our system, the variables representing infectious states were E, I, and W. Progression from E to I was considered not a new infection but rather the progression of an infected oyster through disease stages. Contaminated water W was filled by shedding while new E animals occurred because of W>0. See Supplementary Material for more details on the calculations. Associated matrices are [equations (6) and (7)]:
where the transmission matrix T contains the terms related to new infections and the transition matrix Σ contains all the remaining terms, i.e., all exits from the infected classes and all entries into the infected classes for other reasons than generation of a new infected entity, such as different stages of infectiousness.
Basic reproduction number R0 is the dominant eigenvalue of matrix -T Σ −1 [equation (9)]:
The distribution, median, and 95% CI of the 10,000 simulations were examined for each of the model outputs.
Sensitivity Analysis
To identify the most influential parameters toward model outputs and to investigate interactions between parameters, a global variance-based sensitivity analysis was performed via the extended Fourier Amplitude Sensitivity Test (eFAST) method (44). The main order sensitivity index (direct effect) and the total order sensitivity index (including also interaction effects) were computed to describe the total influence of each parameter on model outputs. A parameter was considered to be a key parameter if it contributed to at least 20% of the variance of one of the model outputs.
Two aggregated outputs of the model were considered: the maximum prevalence and the basic reproduction number R0. Two additional dynamic outputs were considered: the number of surviving oysters and the bacterial concentration in seawater as functions of time.
The seven parameters (i.e., the epidemiological parameters and the initial exposure dose W0) varied simultaneously within their entire allowable range, with 10,000 scenarios for each parameter. Parameter ranges were defined by the 0.25 and 0.75 quantiles of observed experimental distributions for the six observable parameters, and by the bounds of LD50 95% CI for the half-infective dose (K), lowering the lower bound by one Log value to account for the uncertainty of the use of the LD50 proxy.
This approach resulted in 70,000 scenarios. Because the model was stochastic, 500 repetitions were run, and outputs were averaged per scenario.
Parameter Estimation Using Approximate Bayesian Computation
Non-observable or non-independent epidemiological parameters were estimated using the number of surviving oysters during 12 dpe observed in the 12 replicate trials conducted on small populations of 10 oysters in tanks. Given that the likelihood evaluation of the model was not straightforward when only these data were employed, an Approximate Bayesian Computation (ABC) method was used. The ABC method consists of studying the similarity between observed and simulated data from intensive simulations, without the need for explicitly evaluating the likelihood function (45). The general principle consists of generating multiple parameter sets from prior distributions. For a sampled parameter set, a model simulation is performed. Then, summary statistics of this simulation are compared with the observed data using a metric and a tolerance. The parameter set is retained if the difference between the simulation and the observation does not exceed the tolerance. All the parameter sets thus retained are used to approximate the posterior distribution. To minimize the number of model simulations, and therefore computation time, the adaptive Monte Carlo ABC iterative algorithm (ABC-APMC) proposed by Lenormand et al. (46) was used. It consists of a sequential sampling with a sequence of decreasing tolerance levels leading to the approximation of the posterior distribution with an increasing quality. The proportion of best-fit simulations retained to update the tolerance threshold at each step was 0.2, and the stopping criterion (i.e., the proportion below which the algorithm stops the iterations and accepts the newly generated distributions) was 0.01.
The number of surviving oysters during 12 dpe observed in the 12 population replicate trials for the different experimental conditions at each time step were used as summary statistics. The Euclidian distance was used to compare simulations and observations. The values of the three observable parameters were fixed to the mode of observed values in the experiments. For non-independent parameters, bounds of the initial prior distribution were defined using the minimum and maximum observed values. For non-observable parameter K, the bounds of LD50 95% CI were used, the lower bound being lowered by one Log value to account for the uncertainty of the use of the LD50 proxy. The parameter sets (or scenarios, n = 5,000) constituting the initial prior distributions were defined by a Latin hypercube sampling scheme across previously described parameter value ranges.
The posterior distributions of estimated parameters were summarized by the mode as the most probable value, and the 0.025 and 0.975 quantiles as the 95% credible interval.
Model Validation
The model was validated by comparing predicted values with the daily number of surviving oysters during 12 dpe and the bacterial concentration in seawater during 8 dpe which were observed in the 12 replicate trials conducted on small populations of 10 oysters in tanks. The average observed and simulated survival curves were compared by the logrank test (statistical significance threshold p < 0.05). The observed and simulated bacterial concentrations in seawater were compared by sight because of the small amount of observed data preventing statistical testing.
The compartmental model was solved in R software version 3.4.0 (47). The dose–response curve was fitted and LD50 was estimated using package drc version 3.0–1 (48), sensitivity analysis was performed using packages mtk version 1.0 (49) and multisensi version 2.1–1 (50), and ABC was performed using package EasyABC version 1.5 (51).
Results
Experimental Transmission Results
The values of epidemiological parameters were heterogeneous among individuals (Table 3, Supplementary Figure 1). In the experiments (Table 3), the average exposure rate to V. aestuarianus in seawater was 0.75, but this parameter highly varied among individual oysters. Once infected, an oyster became infectious 4 dpe on average, for only 1 day before dying of vibriosis, and daily shed ~1.9 × 10⁵ bacteria/mL. The bacterium V. aestuarianus remained in seawater for 2 days on average. At the end of the individual trials, six oysters out of 10 were still alive on average (Table 2). At the end of the experiment on small oyster populations, seven oysters out of 10 were still alive on average (95% CI: 4; 10; Table 2).
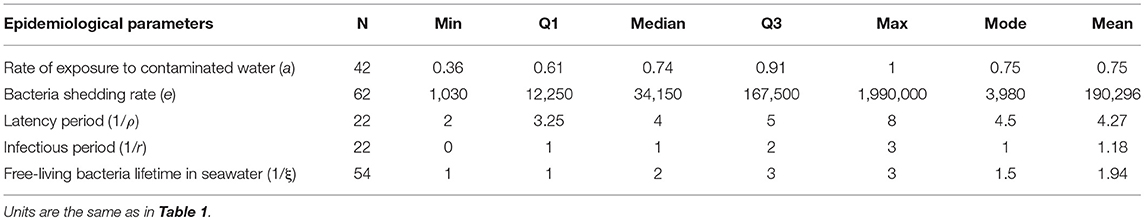
Table 3. Observed distribution characteristics of the epidemiological parameters in the individual laboratory experiments.
Preliminary Parameter Calibration
LD50 was estimated at 3.3 × 10⁴ bacteria/mL with the corresponding 95% CI (8.2 × 10³; 1.3 × 10⁵), i.e., 4.51 Log (bacteria/mL), 95% CI (3.91; 5.11; Figure 3). Thus, the concentration of bacteria in water that yields a 50% chance of catching the infection in 1 day (K) was first estimated as ranging from 8.2 × 10² to 1.3 × 10⁵ bacteria/mL, i.e., from 2.91 to 5.11 Log(bacteria/mL). For each parameter, the observed mode was chosen as the most probable value of the parameter (Table 3). Except for a moderate positive association observed at a high bacterial dose between the bacteria shedding rate (e) and free-living bacteria lifetime in seawater (1/ξ), Spearman correlation coefficients were not significant for each pair of parameters (Table 4).
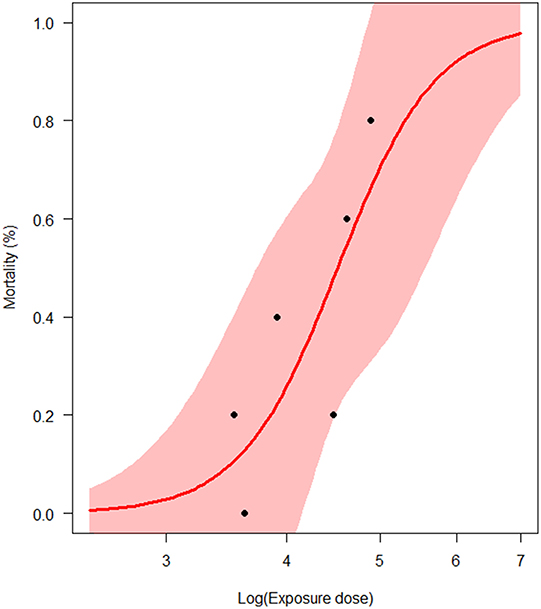
Figure 3. Estimation of the half-lethal dose (LD50) of Vibrio aestuarianus infection (N = 6 experimental trials). The pink area represents the 95% confidence interval of the estimates.
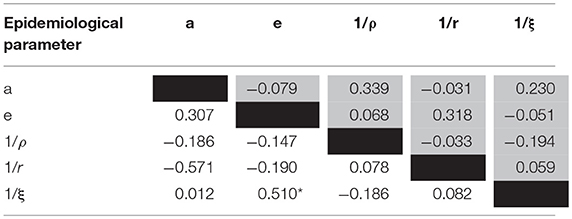
Table 4. The matrix of correlations between the epidemiological parameters (observed values; white cells: high bacterial dose, gray cells: low bacterial dose; Spearman coefficients: *p < 0.001).
Identifying Key Parameters
Figure 4 presents the main and total order sensitivity indices for the six parameters and the initial exposure dose on four of the selected model outputs. Three key parameters were identified: the half-infective dose (K), the bacteria shedding rate (e), and the initial exposure dose (W0). The basic reproduction number R0 was highly sensitive to the bacterial shedding rate (e, 41% of the R0 variation explained) and the initial exposure dose (W0, 48%; Figure 4A). The other parameters had a negligible effect (< 20%).
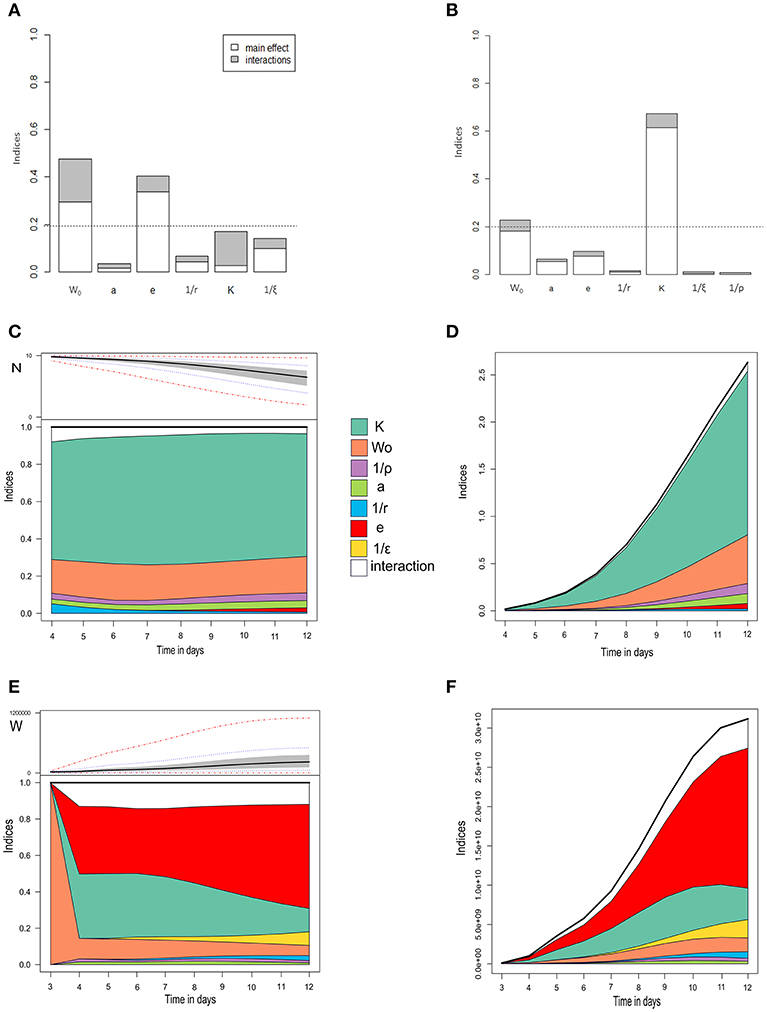
Figure 4. Global sensitivity analysis of three model outputs. (A) The basic reproduction number R0. (B) Maximum prevalence. (A,B) Main effects are in white, interactions in gray. The horizontal dotted line is the significance threshold (20% of variance). (C,D) Number of surviving oysters over time, with normalized (C) and non-normalized sensitivity indices (D). (E,F) Bacterial concentration in seawater over time, with normalized (E) and non-normalized sensitivity indices (F). In (C) and (E), the upper subplots show the extreme (red dash-and-dot curves), percentiles (dotted blue curves), interquartile areas (gray), and median (bold curves) output values at every time point, while the lower subplots show sensitivity indices at every time point for main effects and interactions. W0, initial bacterial concentration; a,rate of exposure to seawater; e, bacteria shedding rate; 1/r, infectious period; K, half-infective dose; 1/ξ, free-living bacteria lifetime in seawater.
The maximum prevalence was highly sensitive to the half-infective dose (K), which explained 67% of its variation (Figure 4B), and, to a lesser extent, to the initial exposure dose (W0, 22%). The other parameters had a negligible effect (< 20%). The number of surviving oysters over time (Figures 4C,D) was highly sensitive to the half-infective dose (K, 70% of the variance explained) and, to a lesser extent, to the initial exposure dose (W0, 22%). The variability between simulations was low for the first 4 dpe, preventing any robust interpretation. The parameter influence was almost constant throughout the 12 days of the experiment (Figure 4C). Other parameters had a negligible effect (< 20%), and there were minor interaction effects. The concentration of bacteria in seawater was first highly sensitive to the initial exposure dose (W0), which influence rapidly decreased. After 4 dpe, bacteria concentration in seawater was highly sensitive to the bacteria shedding rate (e, 40–60%) and the half-infective dose (K, 13–26%; Figures 4E,F). The variability between simulations was low for the first 3 dpe, preventing any robust interpretation. After 8 dpe, bacteria concentration in seawater was mostly sensitive to the bacteria shedding rate. Other parameters had a negligible effect (< 20%).
Improvement of Parameter Estimation by ABC
The posterior distributions (probability density) of the estimated parameter values are illustrated in Figure 5. The final estimated parameter values are given in Table 5. Estimations led to posterior distributions different from the prior distributions for the bacteria shedding rate (e) and the half-infective dose (K). The sharp posterior distribution obtained for the bacteria shedding rate highlighted that it is very likely that oysters shed relatively small quantities of bacteria. The concentration of bacteria in water that yields a 50% chance to get infected was estimated to be high with a large credibility interval. The posterior distribution for the free-living bacteria lifetime in seawater (1/ξ) was flat and rather similar to the initial prior distribution, preventing from any inference of its most probable value using available data.
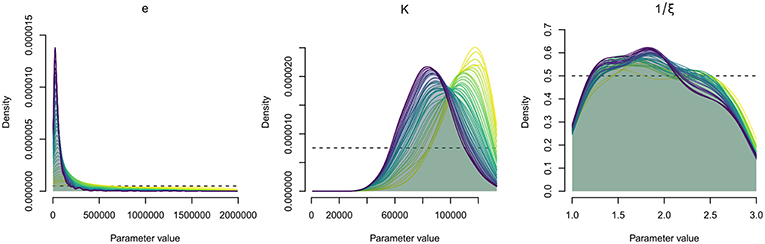
Figure 5. Parameter estimation by Approximate Bayesian Computation (ABC). Distributions of probability density of the epidemiological parameters, for sequential simulation steps (39 steps, 157,000 simulations); e, bacteria shedding rate; K, concentration of bacteria in water that yields a 50% chance of catching the infection; 1/ξ, free-living bacteria lifetime in seawater. The dotted lines show the prior distribution.
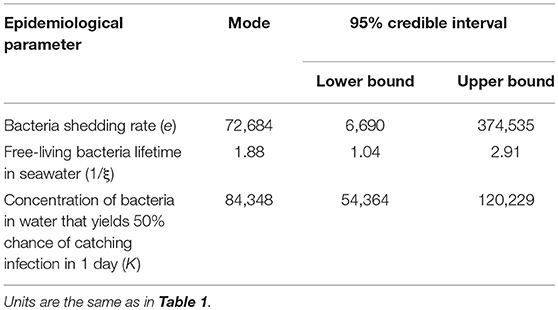
Table 5. Estimated values and ranges of the model parameters of Vibrio aestuarianus transmission among oysters using Approximate Bayesian Computation (ABC; N = 1,000).
Simulating the Infection Dynamics
Figure 6 shows the simulated V. aestuarianus infection dynamics with the parameter values as estimated by ABC (Table 5). After 1 dpe of oysters to the contaminated seawater, vibriosis spread was observed in 61% of the simulations, with a median epidemic peak (maximum prevalence) of 60% (95% CI: 10; 80) reached at 9 dpe. The seawater concentration of V. aestuarianus slowly increased throughout the 12 days, reaching a median plateau at 2.5 × 10⁵ bacteria/mL (95% CI: 7.3 × 10⁴; 4.8 × 10⁵) at 10 dpe. At the end of the simulations, five oysters out of 10 were still alive on average (95% CI: 1; 9).
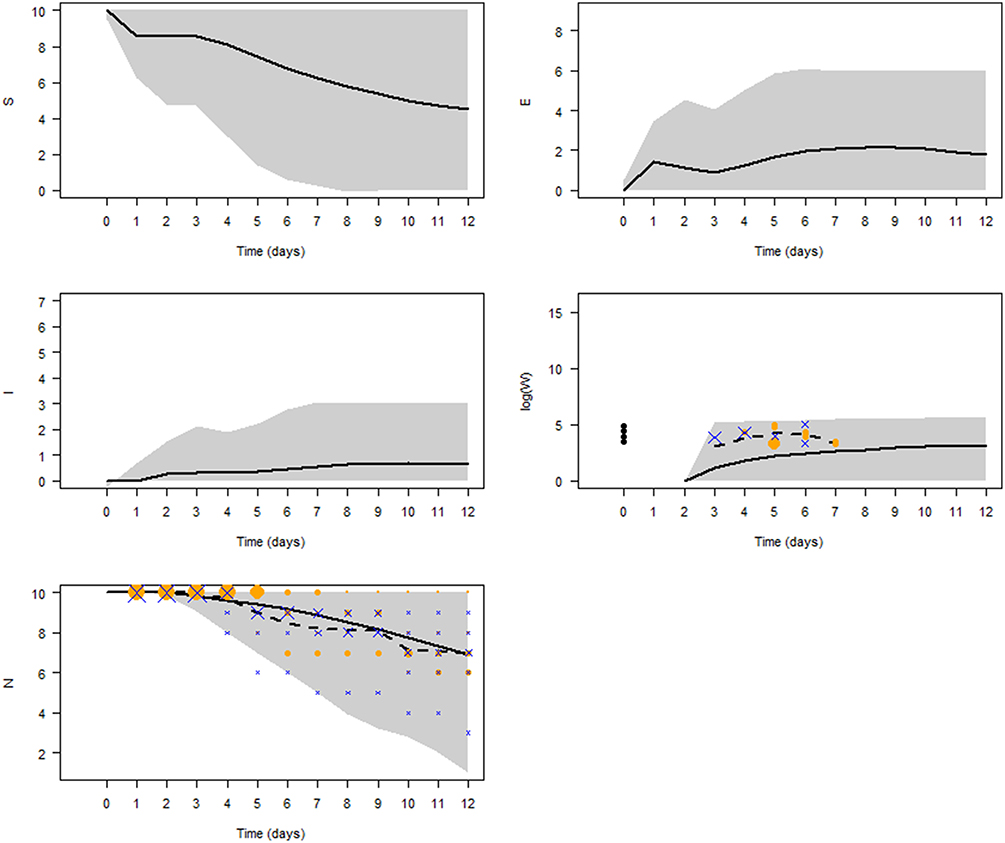
Figure 6. Model predictions. The five panels show the temporal dynamics of susceptible (S), exposed (E), infected (I) oysters, seawater bacterial concentration (W) in log scale, and total population size (N), using the epidemiological parameter values estimated by ABC. The black solid curves show mean values of 10,000 simulations. Gray shading represents the 95% credibility interval. Symbols denote the observed data in 3 L tanks during the laboratory experiments (orange dots: low doses; blue crosses: high doses), their size being proportional to the number of observations. The black dashed curve shows mean observed values in the experiments.
Figure 6 indicates that our model provided a good fit to the daily average number of surviving oysters observed in the 3 L tanks during the laboratory experiments (logrank test, p = 0.94), with the average number slightly overestimating the infection kinetics. Although the average model simulation results underestimated the bacterial concentration in seawater, the values observed in the experiments were always within the 95% CI of the model results.
Using the newly estimated parameter values, the basic reproduction number R0 was predicted to have a most probable value of 2.88 (95% CI: 1.86; 3.35). The generation time had a most probable value of 5.5 days. These data suggest a good transmission capacity of the bacteria, with an index case generating 2.88 secondary cases within 5.5 days on average once introduced in a population of susceptible oysters.
Discussion
Modeling Strategy
The current lack of knowledge on V. aestuarianus infection, notably on V. aestuarianus population dynamics, shaped our compartmental modeling strategy. Intensity models, where the pathogen population is explicitly modeled and the principal outcome is a measure of the number of pathogens, could have been employed if much information was available on the pathogen population, as is the case for Perkinsus marinus (27). We instead considered the epidemiological states of the host (S, E, and I) leading to simpler compartmental modeling. Notably, we adapted a model developed for V. cholera (29) because this aquatic bacterium also belongs to the genus Vibrio. This modeling strategy takes into account the rapid multiplication of the pathogen within the host and the short duration of the infection (14, 52). This approach is consistent with V. aestuarianus infection under experimental laboratory conditions (11, 12).
The assumptions underlying our model are a homogeneous contact process and a constant host population size (53). Mixing of oysters was assumed to be homogeneous within the 3 L tanks. Under the laboratory conditions, each oyster had an equal chance to come into contact with contaminated seawater, and the bacterial concentration in seawater was assumed to be homogeneous in the tank. Given the short period of the experiment, the closed-population assumption was fully acknowledged.
To better describe the transmission process in a small population, we used a stochastic model to incorporate the effect of chance, which may lead to small numbers of infectious oysters or transmission ceasing, and to produce a probability distribution of possible outcomes (54).
Our model is a simplified representation of a complex phenomenon according to the parsimony principle, especially as regards exposure to free-living bacteria. We assumed direct waterborne transmission of V. aestuarianus and added an explicit compartment representing the aquatic reservoir of bacteria in our model, as described for V. cholera (29). Only a small amount of field data on V. aestuarianus isolation from seawater, plankton, and sediment is available (10, 38, 39, 55), and detection protocols (8) did not allow discriminating virulent from non-virulent strains. Accordingly, the importance of plankton and sediment compartments in V. aestuarianus population dynamics for its transmission to oysters (i.e., reservoir, vector, intermediate hosts, and so forth) is still unknown. This situation prompted us to designate the free-living stages of the bacteria outside the oysters—whether in seawater, sediment, or plankton—as a single compartment. Moreover, we did not make any assumption about the detailed process of transmission of V. aestuarianus between oysters. We approximated the exposure rate (a) by the relative difference between the counts of bacteria before and after the 24-h exposure to contaminated seawater. This approach may be consistent with the filtration of infective particles released by infected individuals including a dose dependence and dilution via the volume of the water column hypothesized for suspension feeders (25, 56) such as oysters.
Epidemiological Parameter Estimation
Combining the mathematical model with experimental data, we have been able to produce new knowledge about crucial epidemiological parameters. This coupled experiment–modeling approach enabled us to maximize the utilization of information (obtained through the experiments) in the model. We conducted a small number of experiments on small oyster populations owing to the logistical constraints of the numerous daily and individual measures. The initial exposure doses were difficult to accurately reproduce between the three experiments. This state of affairs may partly explain the observed heterogeneity in the parameters. Some parameters were directly observable and were measured in the experiments; others could not be observed directly or were not independent from each other. For the latter, we represented their uncertainty using uniform distributions between their minimum and maximum observed values in the experiments. We fed the model with parameter values determined, directly using the observed mode for the observable parameters or the distribution and estimated values for the others. The ABC method enabled reducing the uncertainty for two parameters out of the three, with variable accuracy.
We determined the most probable exposure rate at 75% per day, which is consistent with the small volume of contaminated seawater (300 mL) in our experimental settings thereby maximizing the exposure.
Our results uncovered the most probable latency period of 4.5 days and the most probable infectious period of 1 day. These findings are in agreement with previous experiments (12).
The bacteria shedding rate manifested high individual variability and was estimated to be between 6.7 × 10³ and 3.7 × 10⁵ bacteria/mL per oyster per day (95% credibility interval), with a most probable value estimated at 7.2 × 10⁴ bacteria/mL per oyster per day. Most of the oysters shed ~3.7 × 10⁴ bacteria/mL per oyster per day, but some individuals showed much greater values: up to 2.0 × 10⁶ bacteria/mL per oyster per day were observed in the experiments. Because several measures were found to have this order of magnitude in the experiments (Supplementary Figure 1), this heterogeneity did not come from measurement error but reflected realistic variations. Thus, some oysters may be referred to as supershedders of V. aestuarianus. Our estimate was slightly lower than the order of magnitude of shedding of 105 bacteria/mL per oyster after 20 h reported in another work (12), where the studied parameters were assumed to be independent. Given that our results revealed a correlation between the bacteria shedding rate and free-living bacteria lifetime in seawater, our estimate was expected to be lower.
Our results showed only short free-living bacteria lifetime in seawater at 20°C, ranging from 1 to 3 days, but the available data prevented us from any inference of the most probable value for this parameter. This lack of estimation may be due to its relative lowest influence compared to the two other estimated parameters (bacteria shedding rate and half-infective dose) on the selected model outputs related to disease spread (i.e., R0, maximum prevalence, oyster survival curve, and bacteria concentration in seawater), as shown by the global sensitivity analysis. Nonetheless, this range is consistent with another study, which showed viability of V. aestuarianus in seawater after < 5 days at 25°C under differential experimental salinity conditions (39).
We estimated the half-lethal dose (LD50) at 3.3 × 10⁴ bacteria/mL (95% CI: 8.2 × 10³; 1.3 × 10⁵), which is lower by 1 Log than previous estimate (12), and the concentration of bacteria in water that yields a 50% chance of catching the infection (half-infective dose) ranged from 5.4 × 10⁴ to 1.2 × 10⁵ bacteria/mL, with a most probable value of 8.4 × 10⁴ bacteria/mL, i.e., 4.92 Log (bacteria/mL). This estimate is close to the minimal infective dose previously estimated to be ~4.0 × 10⁴ bacteria/mL (12). These close estimates of LD50, half-infective dose, and minimal infective dose strengthen the assumption that the oyster once infected never returns to a truly uninfected state, with death as the sole outcome.
V. aestuarianus Transmission Insights
Our model provides important insights on transmission of V. aestuarianus at local scale, where the exposure to contaminated seawater is constant and homogeneous for every individual oyster in the population, and when a short period (12 days) is considered.
The two key factors that determine the spread of any infectious disease are the basic reproduction number, R0, and the generation time. First, R0 represents the number of new infections that arise on average from one infected oyster when the entire population is susceptible, i.e., at the onset of an epidemic. This is an approximate measure of infection transmissibility among animals within a population, and thus a key element for understanding infectious diseases. Our results show that an index case, i.e., an infected oyster or contaminated seawater with V. aestuarianus, can generate secondarily on average 2.88 (95% CI: 1.86; 3.35) new infected oysters. For oyster diseases, R0 has rarely been estimated so far, except for Dermo disease caused by the parasite Perkinsus marinus, for which estimation has yielded a large value, up to 90 (27). Second, generation time refers to the interval between the infection of an individual and the subsequent transmission to other individuals. We estimated the most probable value for generation time to be 5.5 days under our laboratory conditions. As a first conclusion, V. aestuarianus shows a good transmission efficiency in oyster populations under experimental conditions: it combines moderate R0 and quite short generation time, with each index case producing ~2.88 secondary cases within roughly 1 week. The expected lifespan of infected oysters is short (less than a week), and they are infectious for only one day, shedding daily an amount of bacteria into the seawater, 4.86 Log(bacteria/mL), that is almost equivalent to the half-infective dose [4.92 Log(bacteria/mL)] on average, but which can be also highly variable (2 Log range) within a homogeneous oyster population. The bacterium has short free-living lifetime outside the oyster in seawater, < 3 days. Thus, V. aestuarianus should be able to persist mainly in populations of oysters of high local density with close interactions.
The parameters mostly influencing variations in the basic reproduction number, R0, and identified by a global sensitivity analysis suggest a dose-dependent virus transmission: the higher the bacteria shedding rate, the higher the initial exposure dose or the lower the half-infective dose, the larger is the number of new infections arising from one infected oyster in a fully susceptible population. The dose-dependent mortality induced by V. aestuarianus has been previously examined experimentally (9, 12). The half-infective dose was identified as a key parameter, i.e., the factor explaining most of the variation in most of the selected model outputs (maximum prevalence, oyster survival curve, bacterial concentration in seawater over time). These results are consistent with a local waterborne transmission mode (16) and the filtration-based models (25), in which the more infected and shedding oysters there are, the higher the local concentration of bacteria is likely to be, for given decay and dispersal rates. Hence, a threshold concentration of bacteria may be required to induce infection, meaning that a sufficient number of susceptible oysters is needed to support infection spread, but also that a sufficient number of infectious oysters (16) or the presence of supershedder oysters are needed to obtain a high initial exposure dose and to start an epidemic. The prevalence of infection in the population thus does not dependent on oyster density at a local scale. The shedding rate was distributed over a large range of values, showing a high heterogeneity (Supplementary Figure 1), meaning that even if the oyster density is low, a few supershedders may strongly contribute to the infection spread and magnitude. This transmission mode is consistent with the ecology of oyster beds or oyster farms, which are aggregated populations with close interactions and large local numbers of individuals.
Prediction robustness can be further improved by better estimating two key parameters influencing V. aestuarianus spread: the half-infective dose and the bacteria shedding rate, as identified by the global sensitivity analyses. Hence, further experimental effort should be best directed to reduce these parameter uncertainties (57), which will in turn improve our understanding of the infection spread.
Study Limitations
In our study, small-scale transmission experiments were designed to ensure the best practices (58). Transmission experiments under controlled conditions have an advantage over a field study: an infection chain can be deliberately started (58). When studying natural infections, the use of contact animals, rather than artificially inoculated ones with presumed higher infectiousness, has been recommended to start the studied infection chain (58). Nonetheless, we started the experimental infection and initiated the modeled infection by means of contaminated seawater (balneation infection protocol). We preferred such a balneation infection protocol to a cohabitation one because we could standardize the bacterial concentration in the seawater more easily, given the high variability of the shedding rate of infectious oysters. Thus, our experimentally initiated infections in small populations of 10 oysters in the tanks possibly did not strictly represent a transmission process. All the 10 oysters were exposed together for 24 h in a tank with titrated contaminated seawater, then were transferred to clean water for the 12-day monitoring. Hence, we cannot be sure that what we observed in tanks was transmission, a point-source outbreak without any transmission, or a mixture of both, as revealed in the experimentally initiated epidemics of infectious pancreatic necrosis in rainbow trout fry (59). This may explain the overestimation of the kinetics of infection by the model involving the baseline range of parameters sampled from the distributions fitted to experimental individual data. Accordingly, our results may underestimate the transmissibility of vibriosis. To untangle this issue, further experiments should include a single contact oyster exposed to contaminated seawater for 24 h in a tank, then transferred into clean water with 10 naïve oysters for 12 days of monitoring. The shedding rate of the contact oyster should be carefully estimated beforehand.
Transmission experiments under controlled conditions have a disadvantage that result extrapolation may be difficult (58), particularly for the key process of transmission (30). The mode of transmission determines the probable response for a disease to control actions (19) and may change with the study scale, i.e., inter- or intrapopulation (16, 19). Thus, it is crucial to know how transmission scales with population size and/or density (19).
Concluding Summary and Perspectives
Here, our model showed that the bacteria shedding rate, the half-infective dose and the initial bacterial exposure dose have a major influence on the outputs related to the extent of infection by V. aestuarianus at a small population scale. To control the transmission of bacteria to a susceptible oyster population at such a local scale, it is therefore necessary to identify the processes that increase or decrease oyster exposure to contaminated seawater. These processes may be the factors related to the oyster itself, such as filtration rate (26), sensitivity to the infection (11) or bacteria shedding, or to environmental stressors that increase bacteria shedding by infectious oysters or sensitivity of susceptible oysters to infection (60), the duration of exposure to contaminated seawater (i.e., water renewal or confinement), or hydrodynamics that may drive particle loss or diffusion-like processes in the water column (26). Free-living bacteria can be transported across long distances by water currents, leading to transmission of the infection between oyster populations. At a small scale, all free-living bacteria rain down equally regardless of their source on all susceptible oysters. At a larger scale, however, the patchy distribution of oysters and neighborhood characteristics lead to a heterogeneous exposure: free-living bacteria are dispersed only locally but the rain of particles is nonetheless homogeneous (61) because of concentration gradients of free-living bacteria owing to the dilution effect.
Our model mimics the V. aestuarianus infection in an oyster population within a controlled environment under laboratory conditions. This is a first step toward understanding the epidemiology of this infection in the field. Indeed, physical variation of the environment is crucial for marine diseases, especially in marine ectothermic invertebrates such as mollusks (62). In the field, mollusk mortality cases associated with V. aestuarianus detection mainly occur in summer (1, 3). In a mesocosm study conducted in winter, infected oysters could survive when the sea temperature was low (~5°C) and the infection could be revealed in the laboratory by a thermal stress assay (10). Therefore, transmissibility of the infection over time may be modulated (increased or decreased) by environmental factors. Further studies are needed to assess the effect of seawater temperature and seasonality on the disease kinetics, as estimated for Perkinsus marinus (27), and especially on epidemiological parameters.
Because the mode of transmission may vary according to the spatial scale, the choice of an appropriate mathematical model may also depend on the spatial scale of interest (16, 19). For disease management purposes, the management unit needs to be well defined to describe transmission adequately because this element determines the probable response of the disease to control actions (19). Future research should consider embedding this local scale disease model within an oyster metapopulation landscape (21, 23) and hydrodynamics (63) to develop a marine epidemiological simulation model for evaluating the effectiveness of various control strategies against V. aestuarianus infection.
Ethics Statement
All the methods were carried out in accordance with guidelines. Pacific oyster is not an endangered or protected species, and not vertebrate. The oysters used in this study were farmed.
Author Contributions
M-AT and DT conceived and conducted the experiments. CL and PE developed the model structure and coding. CL, GB, and PE performed the modeling and data analyses. CL designed the numerical and statistical analyses. M-AT, CB, CL and GB contributed to figures. CL, M-AT, DT, GB, and PE discussed the results and contributed to the writing of the manuscript. All the coauthors reviewed the manuscript and approved the final version for publication.
Funding
This work was supported by the National Research Agency (ANR), ANR-AGROBIOSPHERE, within the framework of the GIGASSAT project (ANR-12- AGRO-0001). Funds for open access publication fees were received from Ifremer.
Conflict of Interest Statement
The authors declare that the research was conducted in the absence of any commercial or financial relationships that could be construed as a potential conflict of interest.
Acknowledgments
The oysters used in this work were produced at the IFREMER hatchery in Argenton and maintained under controlled conditions at the IFREMER hatchery in La Tremblade and at the IFREMER nursery in Bouin. We are very grateful to the hatchery and nursery teams for their assistance with oyster production. We wish to acknowledge Bruno Petton (IFREMER, Lemar) for oyster production and Yoann Coray and Bhagat Lal Dutta (IFREMER, LGPMM) for their help with coding.
Supplementary Material
The Supplementary Material for this article can be found online at: https://www.frontiersin.org/articles/10.3389/fvets.2019.00142/full#supplementary-material
References
1. Garcia C, Lupo C, Travers MA, Arzul I, Tourbiez D, Haffner P, et al. editors. Vibrio aestuarianus and Pacific oyster in France: a review of 10 years of surveillance. In: National Shellfisheries Association 106th Annual Meeting. Vol. 33. Jacksonville, FL: Journal of Shellfish Research (2014). 609 p.
2. Arzul I, Chollet B, Serpin D, Dubreuil C, Lupo C, Garcia C, et al. EURL for mollusc diseases: activities 2016 and perspectives for 2017. La Tremblade: IFREMER (2016).
3. EFSA AHAW Panel (EFSA Panel on Animal Health and Welfare). Scientific opinion on oyster mortality. EFSA J. (2015) 13:59. doi: 10.2903/j.efsa.2015.4122
4. Azéma P, Lamy J-B, Boudry P, Renault T, Travers MA, Degrémont L. Genetic parameters of resistance to Vibrio aestuarianus, and OsHV-1 infections in the Pacific oyster, Crassostrea gigas, at three different life stages. Genetic Select Evolut. (2017) 49:23. doi: 10.1186/s12711-017-0297-2
5. Goudenege D, Travers MA, Lemire A, Petton B, Haffner P, Labreuche Y, et al. A single regulatory gene is sufficient to alter Vibrio aestuarianus pathogenicity in oysters. Environ Microbiol. (2015) 17:4189–99. doi: 10.1111/1462-2920.12699
6. Garnier M, Labreuche Y, Nicolas JL. Molecular and phenotypic characterization of Vibrio aestuarianus subsp francensis subsp nov., a pathogen of the oyster Crassostrea gigas. Syst Appl Microbiol. (2008) 31:358–65. doi: 10.1016/j.syapm.2008.06.003
7. De Decker S, Reynaud Y, Saulnier D. First molecular evidence of crossspecies induction of metalloprotease gene expression in Vibrio strains pathogenic for Pacific oyster Crassostrea gigas involving a quorum sensing system. Aquaculture. (2013) 392:1–7. doi: 10.1016/j.aquaculture.2013.01.033
8. Saulnier D, De Decker S, Haffner P. Real-time PCR assay for rapid detection and quantification of Vibrio aestuarianus in oyster and seawater: a useful tool for epidemiologic studies. J Microbiol Meth. (2009) 77:191–7. doi: 10.1016/j.mimet.2009.01.021
9. Azéma P, Travers MA, De Lorgeril J, Tourbiez D, Degremont L. Can selection for resistance to OsHV-1 infection modify susceptibility to Vibrio aestuarianus infection in Crassostrea gigas? first insights from experimental challenges using primary and successive exposures. Vet Res. (2015) 46:139. doi: 10.1186/s13567-015-0282-0
10. Parizadeh L, Tourbiez D, Garcia C, Haffner P, Degremont L, Le Roux F, et al. Ecologically realistic model of infection for exploring the host damage caused by Vibrio aestuarianus. Environ Microbiol. (2018) 20:4343–55. doi: 10.1111/1462-2920.14350
11. Azéma P, Travers M-A, Benabdelmouna A, Dégremont L. Single or dual experimental infections with Vibrio aestuarianus and OsHV-1 in diploid and triploid Crassostrea gigas at the spat, juvenile and adult stages. J Invertebr Pathol. (2016) 139:92–101. doi: 10.1016/j.jip.2016.08.002
12. Travers MA, Tourbiez D, Parizadeh L, Haffner P, Kozic-Djelouli A, Aboubaker M, et al. Several strains, one disease: experimental investigation of Vibrio aestuarianus infection parameters in the Pacific oyster, Crassostrea gigas. Vet Res. (2017) 48:32. doi: 10.1186/s13567-017-0438-1
13. O'Toole C, Cheslett DL, Culloty SC editors. Advances in our understanding of Vibrio aestuarianus infections in cultured Crassostrea gigas in the Republic of Ireland. In: EAFP - 18th International Conference on Diseases of Fish and Shellfish. Belfast, UK: EAFP (2017).
14. Anderson RM, May RM. Population biology of infectious diseases. part I. Nature. (1979) 280:361–7.
15. Ezanno P, Vergu E, Langlais M, Gilot-Fromont E. Modelling the dynamics of host-parasite interactions: basic principles. In: Morand S, Beaudeau F, Cabaret J, editors. New Frontiers of Molecular Epidemiology of Infectious Diseases. Dordrecht: Springer (2012). p. 79–101. doi: 10.1007/978-94-007-2114-2_5
16. Murray AG. Using simple models to review the application and implications of different approaches used to simulate transmission of pathogens among aquatic animals. Prevent Vet Med. (2009) 88:167–77. doi: 10.1016/j.prevetmed.2008.09.006
17. McCallum HI, Kuris A, Harvell CD, Lafferty KD, Smith GW, Porter J. Does terrestrial epidemiology apply to marine systems? Trends Ecol Evol. (2004) 19:585–91. doi: 10.1016/j.tree.2004.08.009
18. Anderson RM, May RM. The population dynamics of microparasities and their invertebrate hosts. Philos Trans R Soc Biol. (1981) 291:451–524.
19. McCallum H, Barlow N, Hone J. How should pathogen transmission be modelled? Trends Ecol Evol. (2001) 16:295–300. doi: 10.1016/S0169-5347(01)02144-9
20. Powell EN, Hofmann EE. Models of marine molluscan diseases: trends and challenges. J Invertebr Pathol. (2015) 131:212–25. doi: 10.1016/j.jip.2015.07.017
21. Sokolow SH, Foley P, Foley JE, Hastings A, Richardson LL. Editor's choice: disease dynamics in marine metapopulations: modelling infectious diseases on coral reefs. J Appl Ecol. (2009) 46:621–31. doi: 10.1111/j.1365-2664.2009.01649.x
22. Yakob L, Mumby PJ. Climate change induces demographic resistance to disease in novel coral assemblages. Proc Natl Acad Sci USA. (2011) 108:1967–9. doi: 10.1073/pnas.1015443108
23. McCallum H, Gerber L, Jani A. Does infectious disease influence the efficacy of marine protected areas? a theoretical framework. J Appl Ecol. (2005) 42:688–98. doi: 10.1111/j.1365-2664.2005.01043.x
24. des Clercs S. Models for a Bonamia ostreae epidemic in a cohort of cultured European flat oysters. Aquaculture. (1991) 93:253–62. doi: 10.1016/0044-8486(91)90237-2
25. Bidegain G, Powell EN, Klinck JM, Ben-Horin T, Hofmann EE. Marine infectious disease dynamics and outbreak thresholds: contact transmission, pandemic infection, and the potential role of filter feeders. Ecosphere. (2016) 7:e01286. doi: 10.1002/ecs2.1286
26. Bidegain G, Powell EN, Klinck JM, Ben-Horin T, Hofmann EE. Microparasitic disease dynamics in benthic suspension feeders: infective dose, non-focal hosts, and particle diffusion. Ecol Model. (2016) 328:44–61. doi: 10.1016/j.ecolmodel.2016.02.008
27. Bidegain G, Powell EN, Klinck JM, Hofmann EE, Ben-Horin T, Bushek D, et al. Modeling the transmission of Perkinsus marinus in the Eastern oyster Crassostrea virginica. Fish Res. (2017) 186:82–93. doi: 10.1016/j.fishres.2016.08.006
28. Chao DL, Longini IM, Morris JG. Modeling cholera outbreaks. Curr Top Microbiol. (2014) 379:195–209. doi: 10.1007/82_2013_307
29. Codeço CT. Endemic and epidemic dynamics of cholera: the role of the aquatic reservoir. BMC Infect Dis. (2001) 1:1. doi: 10.1186/1471-2334-1-1
30. McCallum H. Population Parameters: Estimation for Ecological Models. Malden, MA; Paris; Victoria, VIC: Blackwell Science. (2000). 348 p.
31. Lupo C, François C, Arzul I, Garcia C, Joly JP, Renault T. Défis de la surveillance des maladies chez les coquillages marins en France. Epidemiol Sant Anim. (2012) 62:27–42.
32. Dufour B, Hendrickx P. The REPAMO in France. In: Cirad Fao Oie and Aeema, editors. Epidemiological Surveillance in Animal Health. 2nd Edition. Maisons-Alfort: AEEMA (2009). p. 261–70.
33. McCallum HI. Infection dynamics of ichthyophthyrius multifiliis. Parasitology. (1982) 85:475–88. doi: 10.1017/S0031182000056250
34. Ogut H, Reno PW, Sampson D. A deterministic model for the dynamics of furunculosis in chinook salmon Oncorhynchus tshawytscha. Dis Aquat Organ. (2004) 62:57–63. doi: 10.3354/dao062057
35. Pepin JF, Riou A, Renault T. Rapid and sensitive detection of ostreid herpesvirus 1 in oyster samples by real-time PCR. J Virol Methods. (2008) 149:269–76. doi: 10.1016/j.jviromet.2008.01.022
36. Aboubaker MH, Sabrie J, Huet M, Koken M. Establishment of stable GFP-tagged Vibrio aestuarianus strains for the analysis of bacterial infection-dynamics in the Pacific oyster, Crassostrea gigas. Vet Microbiol. (2013) 164:392–8. doi: 10.1016/j.vetmic.2013.02.024
37. Saulnier D, De Decker S, Haffner P, Cobret L, Robert M, Garcia C. A large-scale epidemiological study to identify bacteria pathogenic to Pacific oyster Crassostrea gigas and correlation between virulence and metalloprotease-like activity. Microb Ecol. (2010) 59:787–98. doi: 10.1007/s00248-009-9620-y
38. Azandegbe A, Gamier M, Andrieux-Loyer F, Kerouel R, Philippon X, Nicolas JL. Occurrence and seasonality of Vibrio aestuarianus in sediment and Crassostrea gigas haemolymph at two oyster farms in France. Dis Aquat Organ. (2010) 91:213–21. doi: 10.3354/dao02253
39. Vezzulli L, Pezzati E, Stauder M, Stagnaro L, Venier P, Pruzzo C. Aquatic ecology of the oyster pathogens Vibrio splendidus and Vibrio aestuarianus. Environ Microbiol. (2015) 17:1065–80. doi: 10.1111/1462-2920.12484
41. Anderson RM, May RM. Infectious Diseases of Humans: Dynamics and Control. Oxford: Oxford University Press (1991).
42. van den Driessche P, Watmough J. Reproduction numbers and sub-threshold endemic equilibria for compartmental models of disease transmission. Math Biosci. (2002) 180:29–48. doi: 10.1016/S0025-5564(02)00108-6
43. Diekmann O, Heesterbeek JA, Roberts MG. The construction of next-generation matrices for compartmental epidemic models. J R Soc. (2010) 7:873–85. doi: 10.1098/rsif.2009.0386
44. Saltelli A, Tarantola S, Chan KPS. A quantitative model-independent method for global sensitivity analysis of model output. Technometrics. (1999) 41:39–56. doi: 10.2307/1270993
45. Csillery K, Blum MGB, Gaggiotti OE, Francois O. Approximate bayesian computation (ABC) in practice. Trends Ecol Evol. (2010) 25:410–8. doi: 10.1016/j.tree.2010.04.001
46. Lenormand M, Jabot F, Deffuant G. Adaptive approximate Bayesian computation for complex models. Computation Stat. (2013) 28:2777–96. doi: 10.1007/s00180-013-0428-3
47. Core Team R. R: A Language and Environment for Statistical Computing. Vienna, Austria: R Foundation for Statistical Computing (2017).
48. Ritz C, Baty F, Streibig JC, Gerhard D. Dose-response analysis using R. PloS ONE. (2015) 10:e0146021. doi: 10.1371/journal.pone.0146021
49. Wang J, Monod H. mtk: Mexico ToolKit Library (MTK). (2014) R package version 1.0. Available online at: https://CRAN.R-project.org/package=mtk (accessed December 21, 2018).
50. Lamboni M, Monod H, Makowski D. Multivariate sensitivity analysis to measure global contribution of input factors in dynamic models. Reliabil Eng Syst Safety. (2011) 96:450–9. doi: 10.1016/j.ress.2010.12.002
51. Jabot F, Faure T, Dumoulin N. EasyABC: performing efficient approximate Bayesian computation sampling schemes using R. Methods Ecol Evol. (2013) 4:684–7. doi: 10.1111/2041-210X.12050
52. May RM, Anderson RM. Population biology of infectious diseases: part II. Nature. (1979) 280:455–61.
53. Kermack WO, McKendrick AG. A contribution to the mathematical theory of epidemics. Proc R Soc London Series A. (1927) 115:700–21. doi: 10.1098/rspa.1927.0118
54. MacKenzie K, Bishop SC. Developing stochastic epidemiological models to quantify the dynamics of infectious diseases in domestic livestock. J Anim Sci. (2001) 79:2047–56. doi: 10.2527/2001.7982047x
55. Romero A, Costa MD, Forn-Cuni G, Balseiro P, Chamorro R, Dios S, et al. Occurrence, seasonality and infectivity of Vibrio strains in natural populations of mussels Mytilus galloprovincialis. Dis Aquat Organ. (2014) 108:149–63. doi: 10.3354/dao02701
56. Ben-Horin T, Bidegain G, Huey L, Narvaez DA, Bushek D. Parasite transmission through suspension feeding. J Invertebr Pathol. (2015) 131:155–76. doi: 10.1016/j.jip.2015.07.006
57. Lessler J, Edmunds WJ, Halloran ME, Hollingsworth TD, Lloyd AL. Seven challenges for model-driven data collection in experimental and observational studies. Epidemics. (2015) 10:78–82. doi: 10.1016/j.epidem.2014.12.002
58. Velthuis AG, Bouma A, Katsma WE, Nodelijk G, De Jong MC. Design and analysis of small-scale transmission experiments with animals. Epidemiol Infect. (2007) 135:202–17. doi: 10.1017/S095026880600673X
59. Smith G, Bebak J, McAllister PE. Experimental infectious pancreatic necrosis infections: propagative or point-source epidemic? Prevent Vet Med. (2000) 47:221–41. doi: 10.1016/S0167-5877(00)00176-8
60. Lafferty KD, Holt RD. How should environmental stress affect the population dynamics of disease? Ecol Lett. (2003) 6:654–64. doi: 10.1046/j.1461-0248.2003.00480.x
61. Begon M, Bennett M, Bowers RG, French NP, Hazel SM, Turner J. A clarification of transmission terms in host-microparasite models: numbers, densities and areas. Epidemiol Infect. (2002) 129:147–53. doi: 10.1017/S0950268802007148
62. Thrush MA, Peeler EJ. A model to approximate lake temperature from gridded daily air temperature records and its application in risk assessment for the establishment of fish diseases in the UK. Transbound Emerg Dis. (2013) 60:460–71. doi: 10.1111/j.1865-1682.2012.01368.x
Keywords: marine epidemiology, parameter estimation, compartmental model, ABC method, global sensitivity analysis, basic reproduction number R0, Crassostrea gigas, oyster mortality
Citation: Lupo C, Travers M-A, Tourbiez D, Barthélémy CF, Beaunée G and Ezanno P (2019) Modeling the Transmission of Vibrio aestuarianus in Pacific Oysters Using Experimental Infection Data. Front. Vet. Sci. 6:142. doi: 10.3389/fvets.2019.00142
Received: 28 September 2018; Accepted: 23 April 2019;
Published: 14 May 2019.
Edited by:
Saraya Tavornpanich, Norwegian Veterinary Institute, NorwayReviewed by:
Gorka Bidegain, University of the Basque Country, SpainWendy Beauvais, Cornell University, United States
Annette S. Boerlage, Scotland's Rural College, United Kingdom
Copyright © 2019 Lupo, Travers, Tourbiez, Barthélémy, Beaunée and Ezanno. This is an open-access article distributed under the terms of the Creative Commons Attribution License (CC BY). The use, distribution or reproduction in other forums is permitted, provided the original author(s) and the copyright owner(s) are credited and that the original publication in this journal is cited, in accordance with accepted academic practice. No use, distribution or reproduction is permitted which does not comply with these terms.
*Correspondence: Coralie Lupo, clupo@ifremer.fr