Article

Involvement of Secondary Metabolites in Response to Drought Stress of Rice (Oryza sativa L.)

1
Graduate School for International Development and Cooperation (IDEC), Hiroshima University, Higashi-Hiroshima, Hiroshima 739-8529, Japan
2
Department of Botany, Faculty of Agriculture, Tanta University, Tanta 31527, Egypt
3
Agricultural Genetics Institute, Hanoi 100000, Vietnam
*
Author to whom correspondence should be addressed.
Submission received: 2 February 2016 / Revised: 22 April 2016 / Accepted: 23 May 2016 / Published: 26 May 2016

Abstract

:
In this study, responses of rice under drought stress correlating with changes in chemical compositions were examined. Among 20 studied rice cultivars, Q8 was the most tolerant, whereas Q2 was the most susceptible to drought. Total phenols, total flavonoids, and antioxidant activities, and their accumulation in water deficit conditions were proportional to drought resistance levels of rice. In detail, total phenols and total flavonoids in Q8 (65.3 mg gallic acid equivalent (GAE) and 37.8 mg rutin equivalent (RE) were significantly higher than Q2 (33.9 mg GAE/g and 27.4 mg RE/g, respectively) in both control and drought stress groups. Similarly, the antioxidant activities including DPPH radical scavenging, β-carotene bleaching, and lipid peroxidation inhibition in Q8 were also higher than in Q2, and markedly increased in drought stress. In general, contents of individual phenolic acids in Q8 were higher than Q2, and they were significantly increased in drought stress to much greater extents than in Q2. However, p-hydroxybenzoic acid was found uniquely in Q8 cultivars. In addition, only vanillic acid was found in water deficit stress in both drought resistant and susceptible rice, suggesting that this phenolic acid, together with p-hydroxybenzoic acid, may play a key role in drought-tolerance mechanisms of rice. The use of vanillic acid and p-hyroxybenzoic acid, and their derivatives, may be useful to protect rice production against water shortage stress.

Graphical Abstract

1. Introduction

Drought is among one of the most serious problems confronting rice production [1]. A significant decline of rice productivity can be caused by water shortage [2]. Hence, enhancing survival ability of rice under long-day drought conditions is a crucial issue for rice scientists. Recent studies in plant physiological mechanism responses to abiotic stresses have offered new insights in improving drought tolerance of crops by searching quantitative trait loci (QTL) or candidate genes relevant to drought; however, sucessful results have been limited and unstabilized [3]. Thus, it has led to failure among crop breeders in using molecular breeding tools for breeding new crop cultivars adapted to water deficient conditions [4].
Studies on the influence of stress signals on secondary metabolites in plants have been increasing since the middle of the 20th century [5]. Phenolic compounds such as phenolic acids and flavonoids have been found to be the most widespread substantial groups of plant secondary metabolites produced from the shikimate-phenylpropanoid biosynthetic pathway [6,7]. These molecules have been described as markers of biotic and abiotic stress tolerance in plants [8,9]. Various studies have searched out differences among plant species in the morpho-physiological response to adapt to adverse environmental changes. Plants exposed to salinity stress led to the decrease of shoot dry weight, root ratio and leaf area. Meanwhile, water deficit stress has been found to cause a reduction of leaf photosynthesis and evapotranspiration processes from stomatal closure, and at mild drought levels, increase root depth in the soil [10,11]. Moreover, abiotic stress induces oxidative damage in plant cells due to increased generation of noxious reactive oxygen species (ROS) in chloroplasts [12]. Plants possess a number of phenolic compounds, and they have been proclaimed to be involved in oxidative stress caused by ROS [13,14]. On the other hand, plants under certain stress conditions often produce a higher degree of phenolic compounds compared to non-stressed plants [15]. Markham et al. [16] reported that, in different UV-B light levels, C-glycosylflavone contents increasingly appeared in a UV-tolerant rice cultivar but were non-existent in a susceptible cultivar. Torras-Claveria et al. [6] identified 20 phenolic compounds in both watered and water deficit stressed tobacco plants, and most of these compounds were detected to increase more in water-stressed plants. Similarly, the observed enhancement of total contents of phenolics, flavonoids, and anthocyanins, and schaftosides, in response to drought in wheat leaves, were demonstrated by Ma et al. [7]. In addition, the use of exogenous phenolic compounds to strengthen drought tolerance in plants were also proved in some previous reports. Typically, rice seeds soaked in 50, 100 and 150 mg·L−1 of salicylic acid (SA) solution for 48 h expressed better drought resistance than SA untreated seeds at the five-leaf stage [17]. Spraying of 50 µM SA or 10 mM KNO3 on barley plants displayed an ability of good cultivation in salt (150 mM NaCl) and water deficit soil (50% SWC) conditions [10].
In general, secondary metabolic products are ubiquitous in the plant kingdom; particularly, their intensity often presents in stress situations. The drought tolerance mechanism controlled by endogenous phenolic compounds is observed in many plants, but it differs among species [18]. In rice, some compounds, mainly phenolic acids and anthocyanins, have been detected and examined for their bioactivities in germinated stages and under normal growth status [14,19,20].
In this study, changes in chemical compositions including total phenols, total flavonoids, antioxidants and individual phenolic acids in response to drought stress in rice were investigated. It also aims at searching for chemicals that play a crucial role in water deficit stress of rice, which, in turn, may help to develop bioactive reagents to help ensure rice production against drought.

2. Materials and Methods

2.1. Chemicals

Fifteen standard phenolic compounds (ferulic acid, p-coumaric acid, p-hydroxybenzoic acid, syringic acid, benzoic acid, protocatechuic acid, vanillin, vanillic acid, catechol, gallic acid, cinnamic acid, caffeic acid, ellagic acid, sinapic acid and chlorogenic acid) and other chemicals were at analytical grades and were purchased from Kanto Chemical Co. Inc., Tokyo, Japan.

2.2. Plant Materials and Treatment

Twenty rice (Oryza sativa L.) varieties (Table 1) were grown in a greenhouse. Firstly, the sterilized rice seeds were immersed in 54 °C water for 15 min, and soaked in 30 °C water for 48 h with 6-time washing (8 h each) with distilled water. These seeds were then germinated and cultivated in Petri dishes at room temperature (25–27 °C). After 10 days, they were transplanted to Wagner pots (height: 30 cm; diameter: 20 cm) and filled with sterilized soil (JA-ZENCHU Co., Hiroshima, Japan) in the greenhouse for four weeks under optimal conditions (28/20 °C day/night cycle, 14 h photoperiod and 80% soil moisture). During the whole period, the plantlets were irrigated daily to maintain a level of 85% soil moisture. A moisture meter SM150-HH2 (Delta-T Devices Ltd., Cambridge, UK) was used to monitor soil moisture. The seedlings were divided into two groups: control and test. In the test plants, drought stress was treated in three stages: 5 days, 10 days, and 15 days without watering. At the end of each stage, the leaf drying, rolling, withering, and recovering were examined. In the first 5 days, the moisture level was decreased from 85% to 65% and was then maintained at 85%. In the next 10 days, the soil moisture was reduced from 85% to 45% and was moistened again to 85%. In the last 15 days, the moisture capacity was reduced from 85% to 25%, and then the plants were recovered by watering for 2 days before sampling. The leaf samples were kept at −80 °C for further analysis.

2.3. Drought Screening Procedure

The evaluation of drought resistance was following a Standard Evaluation Scale (SES) developed by the International Rice Research Institute (IRRI) [21] with several modifications (Table 2).

2.4. Extraction of Phenolic Acids

Phenolic acids were extracted using a method reported previously [22], with some modifications. Briefly, the residue from the free phenolic extraction was hydrolyzed with 100 mL of 4 M NaOH at 60 °C with continuous stirring for 4 h. The mixture was centrifuged at 5000 rpm for 10 min and was filtrated by filter papers. Afterwards, the solution was adjusted to pH 2.0 using a 37% HCl solution, and the supernatant was then extracted 3 times with ethyl acetate 99.5% in a separating funnel. After filtration, it was evaporated by a rotary evaporator at 35 °C to dryness. The dried extract was reconstituted with 99.8% methanol to a final volume of 10 mL at 1000 ppm and then stored at 4 °C prior to HPLC analysis.

2.5. Determination of Total Phenolic Contents

The amount of total phenolics was analyzed using the Folin–Ciocalteu (FC) colorimetric method described previously by Elzaawely and Tawata [23], with some modifications. An aliquot of 0.4 mL 7.5% (w/v) Na2CO3 and 0.5 mL Folin–Ciocalteu’s reagent (10%) were added to 1 mL (1000 ppm) of methanol solution of different extracts. After shaking, the mixture was incubated at room temperature for 30 min. Absorption was measured at 765 nm using a spectrophotometer (DR/4000U-HACH, Colorado, USA). Total phenolic contents were expressed as gallic acid equivalents (GAE) in milligrams per gram dry weight (DW).

2.6. Determination of Total Flavonoid Contents

The total flavonoid contents were determined by a method described in Elzaawely and Tawata [24], with some modifications. Briefly, 1 mL aluminum chloride (2% in methanol) was mixed with 1 mL of methanolic solution of different extracts (1000 ppm). After shaking, the mixture was incubated at room temperature for 15 min and then the absorption was measured at 430 nm using a spectrophotometer (DR/4000U-HACH, Colorado, USA). Total flavonoid contents were expressed as rutin equivalents (RE) in milligrams per gram dry weight (DW).

2.7. Antioxidant Assay Using the DPPH Radical Scavenging System

The DPPH radical scavenging activity was evaluated following a method described in Elzaawely et al. [25]. One mL of each methanol solution of extract sample (25, 50, 100, and 1000 ppm) was mixed with 0.5 mL of 0.5 mM DPPH methanol solution and 1 mL of 0.1 M sodium acetate buffer (pH 5.5). After shaking, the mixture was incubated at room temperature in the dark for 30 min, and then the absorption was measured at 517 nm using a spectrophotometer (DR/4000U-HACH, Colorado, USA). In this method, methanol was used as the negative control. Radical scavenging activity was expressed as the inhibition percentage and was calculated using the formula of Son and Lewis [26]:
% Radical scavenging activity = [(Acontrol − Atest)/Acontrol] × 100.
Acontrol is the absorbance of the control (test sample was replaced by methanol mixed with DPPH solution and sodium acetate buffer), and Atest is the absorbance of the test sample (DPPH solution plus antioxidant). The IC50 value is identified as the concentration of each sample required giving 50% DPPH radical scavenging activity. Therefore, lower IC50 value indicates stronger antioxidant activity.

2.8. Antioxidant Test Using β-Carotene Bleaching Method

The β-carotene bleaching for evaluating antioxidant activity followed a method described in Elzaawely and Tawata [25]. Two mg of β-carotene were dissolved in 10 mL chloroform and then 1 mL of this solution was mixed with 20 µL linoleic acid and 200 mg Tween-40. This mixture was evaporated under vacuum conditions for 15 min, at 40 °C. Afterward, the dry extract was added with 50 mL oxygenated water and strongly shaken until obtaining an emulsion solution. One mL of the β-carotene-linoleic acid emulsion was mixed with 0.12 mL of each ethyl acetate fraction sample. Similar to the samples, an equal amount of methanol (0.12 mL) was also used for the negative controls. The tests were incubated at 50 °C, and the absorbance was measured using a spectrophotometer (DR/4000U-HACH, Colorado, USA) at 492 nm. The samples were measured at zero time at every 15 min up to 180 min. Percentage of lipid peroxidation inhibition (LPI) was calculated relying on the equation of Soares et al. [27]:
% LPI = A1/A0 × 100,
where A0 is the absorbance value measured at zero time for the test sample, while A1 is the absorbance value measured at 180 min after incubation. A higher LPI% value results in better antioxidant capacity.

2.9. Identification of Phenolic Compounds

The free and bound phenolic fractions were subjected to HPLC analysis with the conditions according to Xuan et al. [28]. The HPLC (UV-2075-plus-JASCO, Tokyo, Japan) equipped with a 2998 photodiode PDA (JASCO, Tokyo, Japan), quaternary pump detectors, and a J-pak Symphonia C18 column (JASCO, Tokyo, Japan) with dimensions of 4.6 × 250 mm, and 5 μm (silica). These purified extracts were pre-filtered using a 0.22 μm membrane filter, and an aliquot of 5 μL of sample was injected into the HPLC system. The mobile phase consisting of two solvents was 0.1% of acetic acid (solution B) and 100% methanol (solution A). The process was established as follows: Gradient B v/v solvent A: 0 to 5 min, 0 to 5%; 5 to 10 min, 5 to 20%; 10 to 20 min, 20 to 50%; 20 to 30 min, 50 to 80%; 30 to 40 min, 80 to 100%; 40 to 50 min, 100%; 50 to 60 min, 100 to 5%. The flow rate was 1 mL per min. The wavelength of ultraviolet absorption of the defector (absorbance) was at 254 nm. The phenolic constituents of each sample were identified by comparing their retention times, and the quantification was calculated by comparing samples’ peak areas with those of the standards.

2.10. Statistical Analysis

The experiments were conducted in a completely randomized design with 5 replicates in each laboratory and greenhouse trial and 3 replicates in chemical analysis. The samples were analyzed with Minitab® 16.2.3 (copyright © 2012 Minitab Inc., Philadelphia, USA) software using ANOVA (analysis of variance) with a significant difference identified at a confidence level of p = 0.05.

3. Results

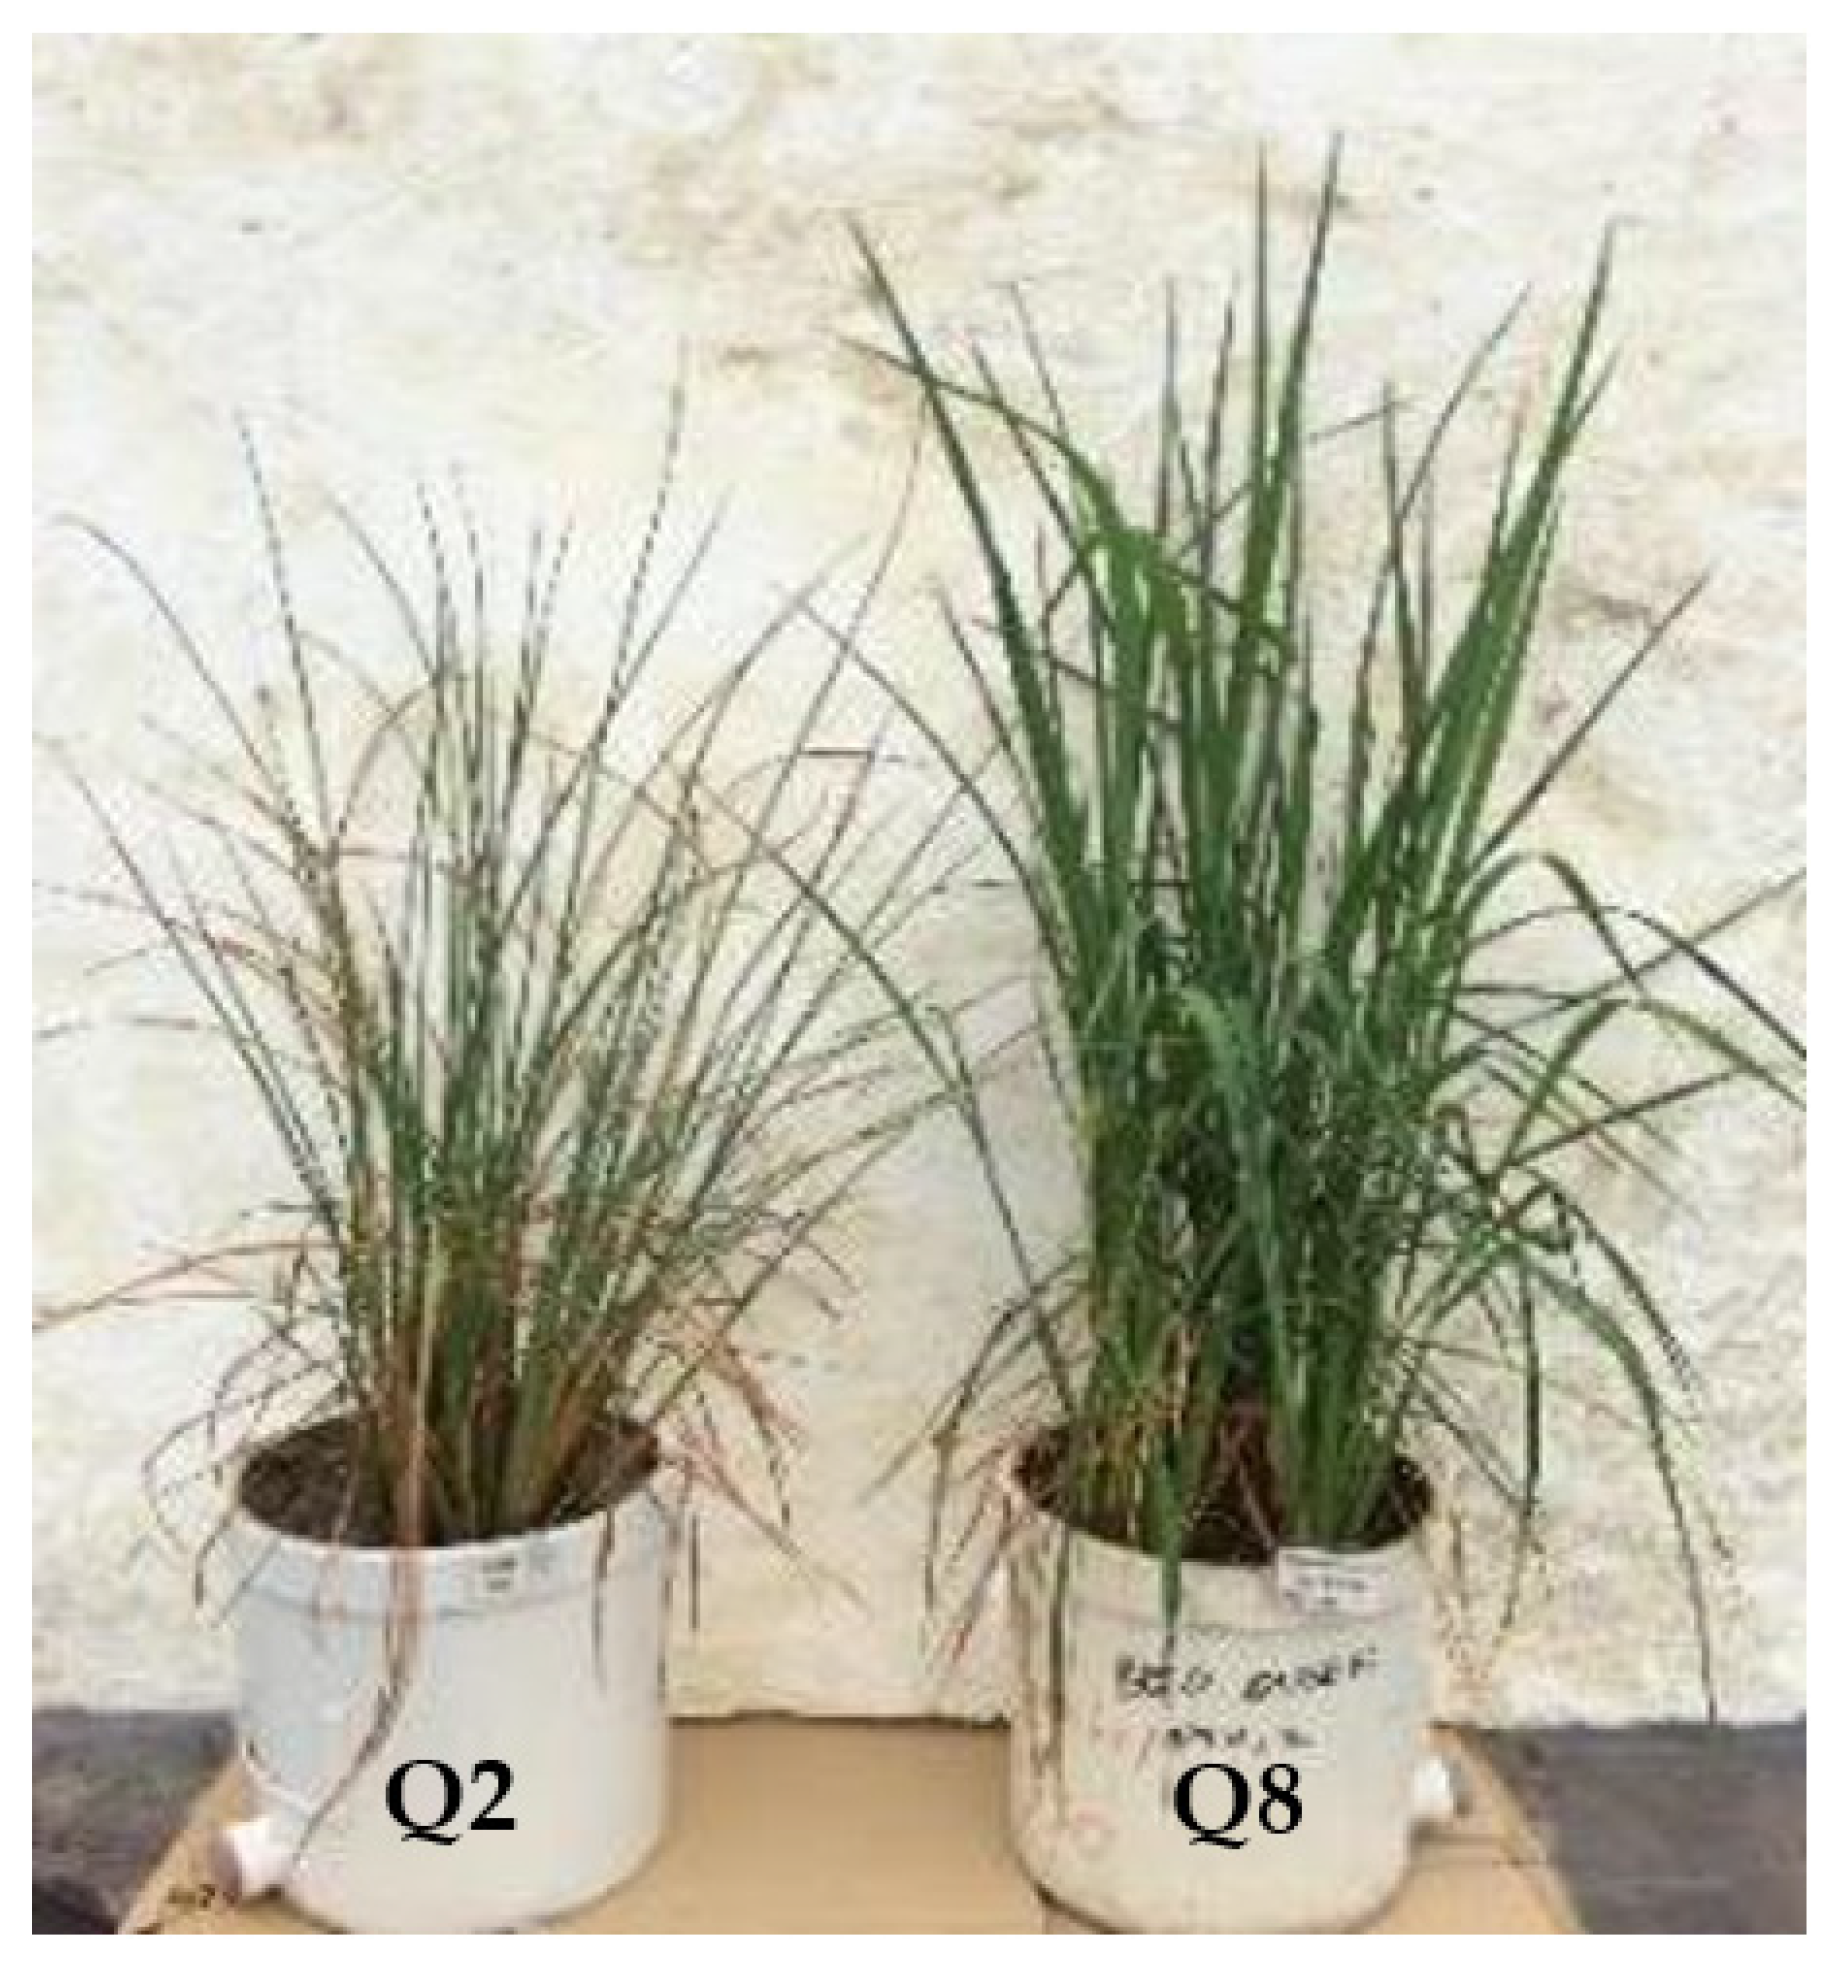
3.1. Influence of Drought Stress on Rice Leaves

The resistance levels of the twenty studied rice cultivars were evaluated through four categories, including leaf rolling, leaf dying, and leaf withering in water deficient stress and the recovery of rice after water was provided, which consisted of different levels of 1 to 9 (Table 2 and Table 3). From the grades of drought tolerance indicated in Table 2, the resistant levels were divided as follows: 1–3: strongly tolerant, 3–5: medium tolerant, 5–7: weakly tolerant, and 7–9: drought susceptible. For leaf rolling, drying, and withering, there were six rice cultivars at the medium tolerant level, including C22, Q1, Q4, Q8, T1, and H1, whereas only Q2 was the susceptible variety. The other fourteen rice cultivars were observed at the weakly tolerant level. However, most cultivars of the studied rice exhibited a stronger recovery of 3.0 to 5.7 grades, of which Q8 was the highest, and T7 was the lowest (Table 3). In combination between the response of the rice cultivars under water deficient stress (leaf rolling, drying, and withering) and their recovery, Q8 was selected as the most tolerant variety, whereas Q2 was the most susceptible to drought (Figure 1).

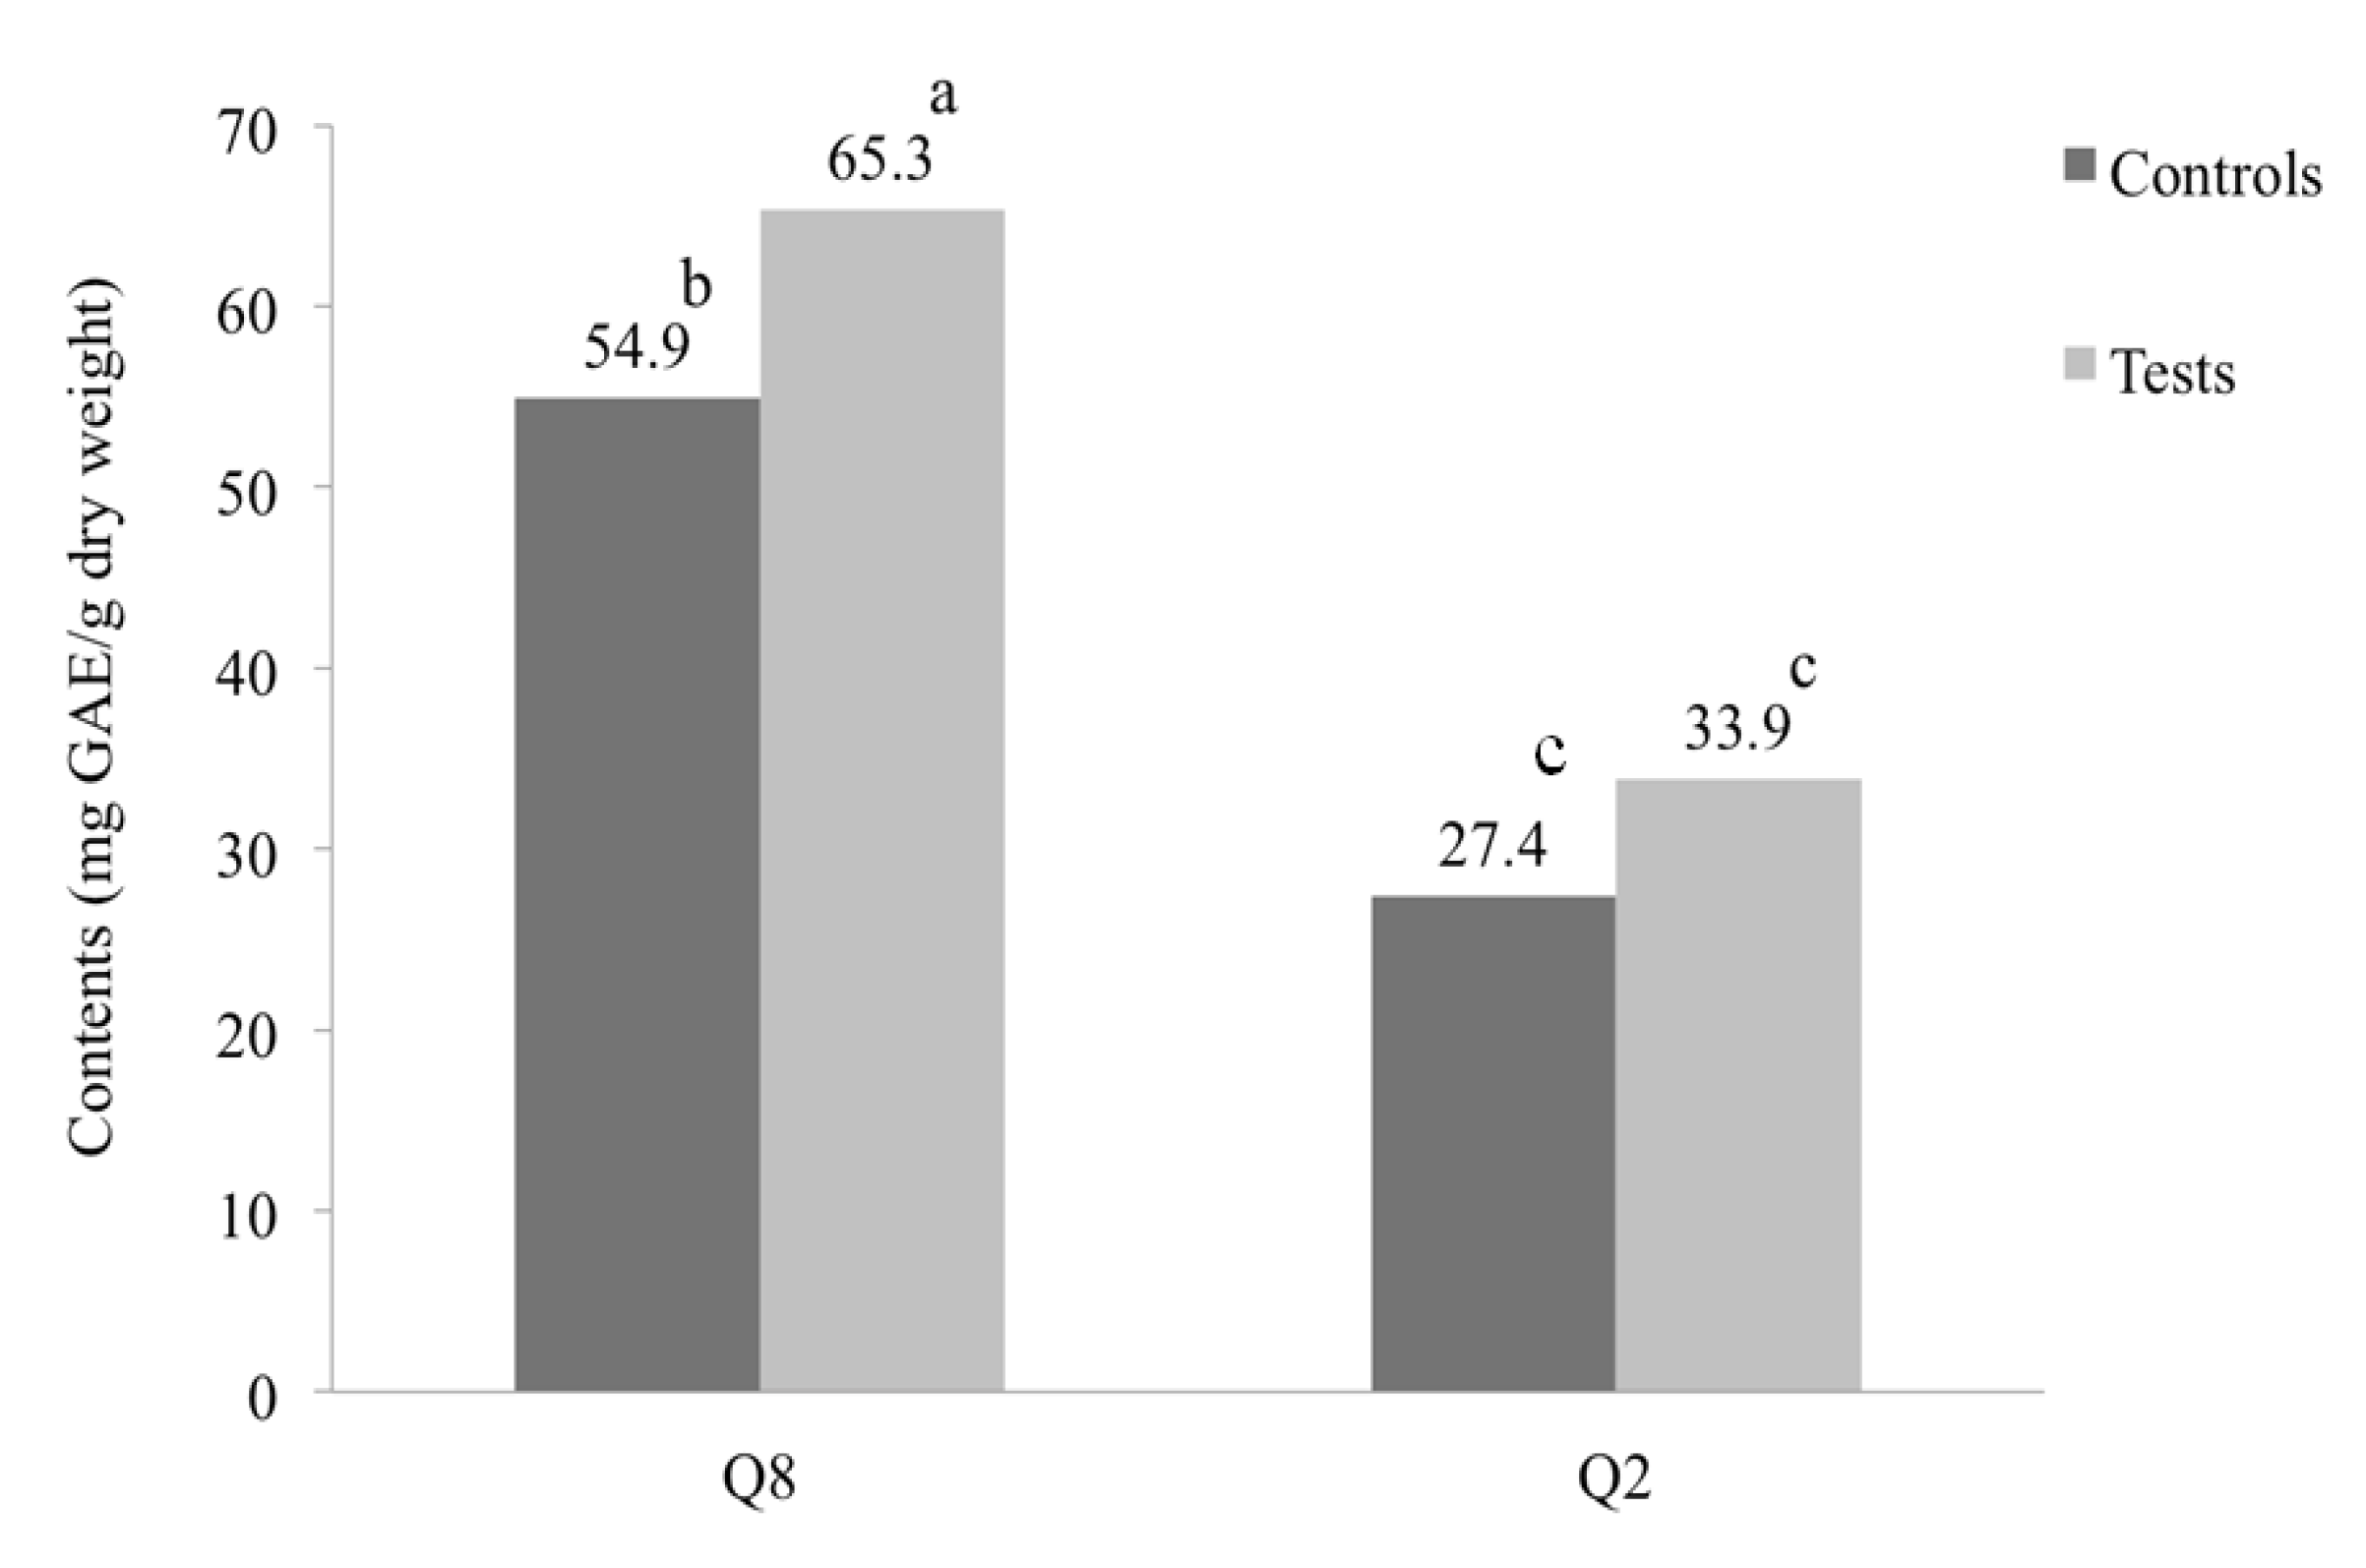
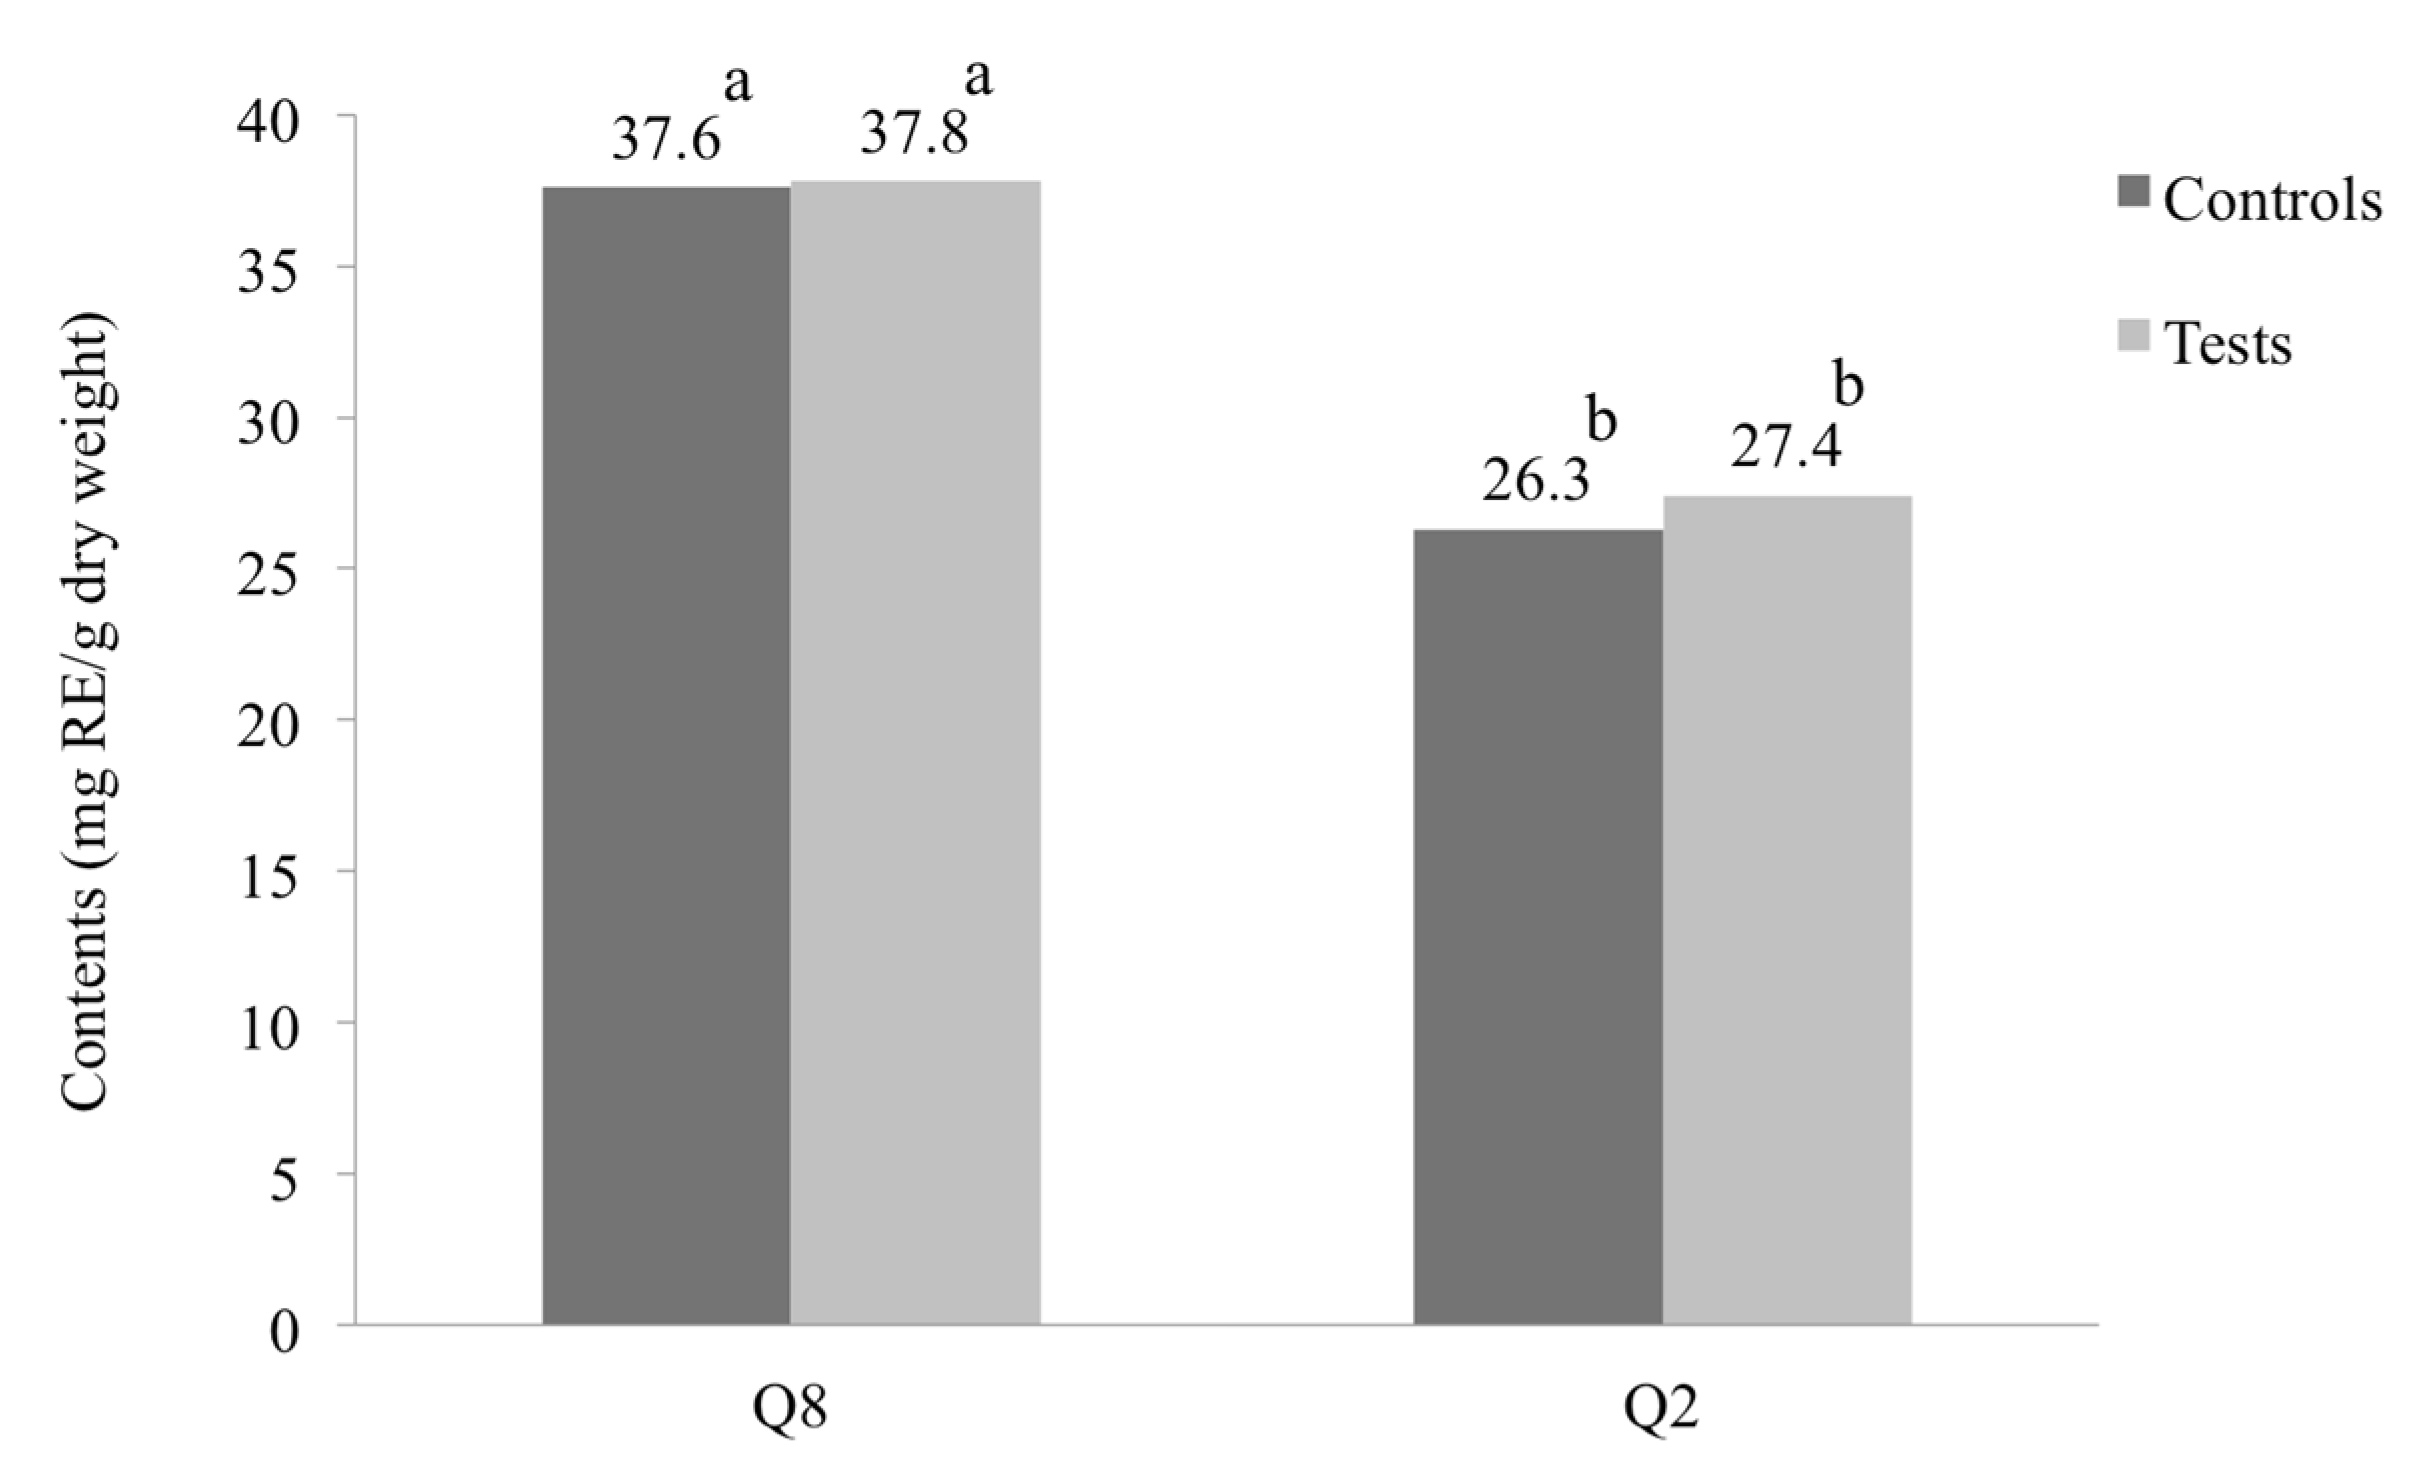
3.2. Effect of Water Deficit Stress on Total Phenolic and Flavonoid Contents

Changes of total phenolic contents (TPC) and total flavonoid contents (TFC) under drought stress and controls (watering condition) are shown in Figure 2 and Figure 3. It was found that even in the watering condition, the capacities of TPC and TFC were proportional to the drought tolerance strength of each rice cultivar. Of them, Q8 obtained significantly higher amounts of TPC and TPC than Q2 (Figure 2 and Figure 3). In the water deficit stress, the quantities of TPC and TFC increased as compared to the watered condition. However, only the change of TPC in Q2 was markedly different. Findings of this experiment suggested that TPC and TFC were closely associated with the strength of rice against drought stress.

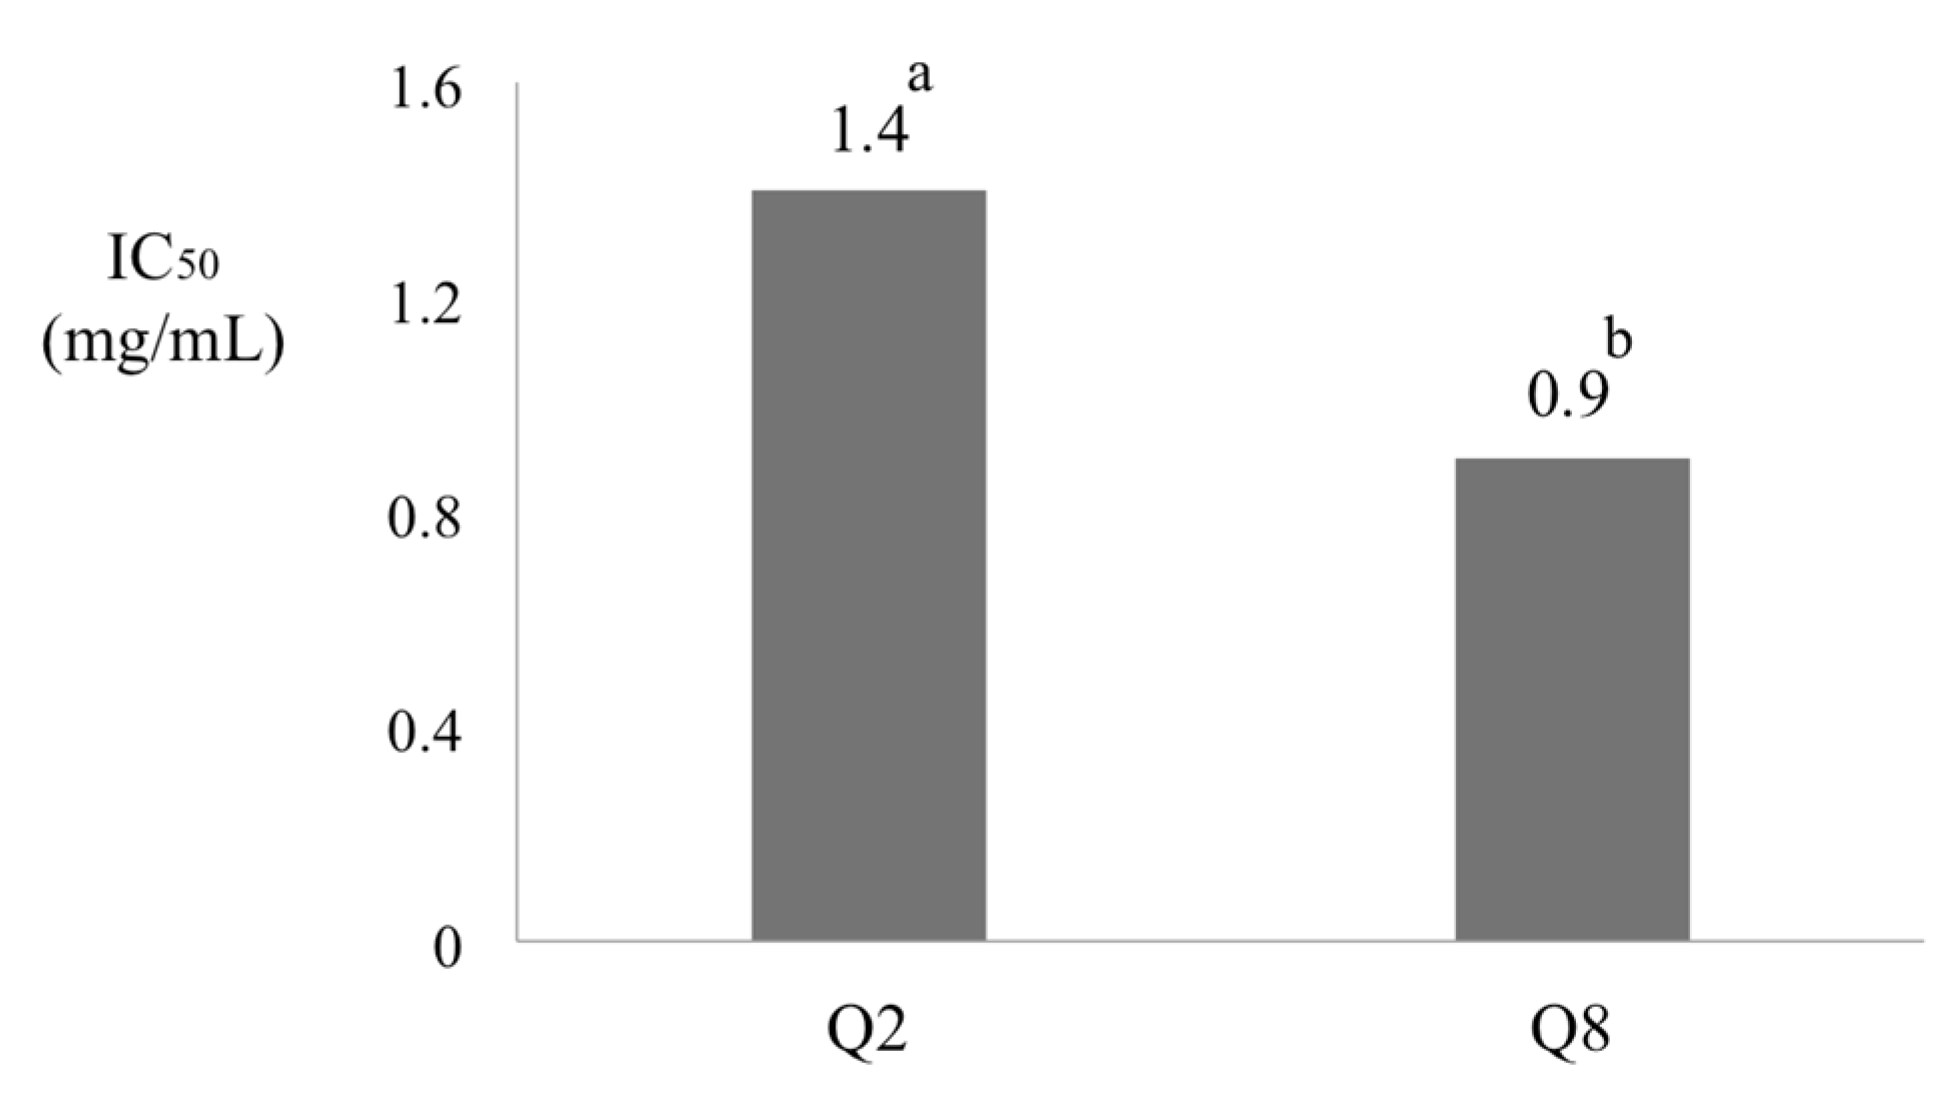
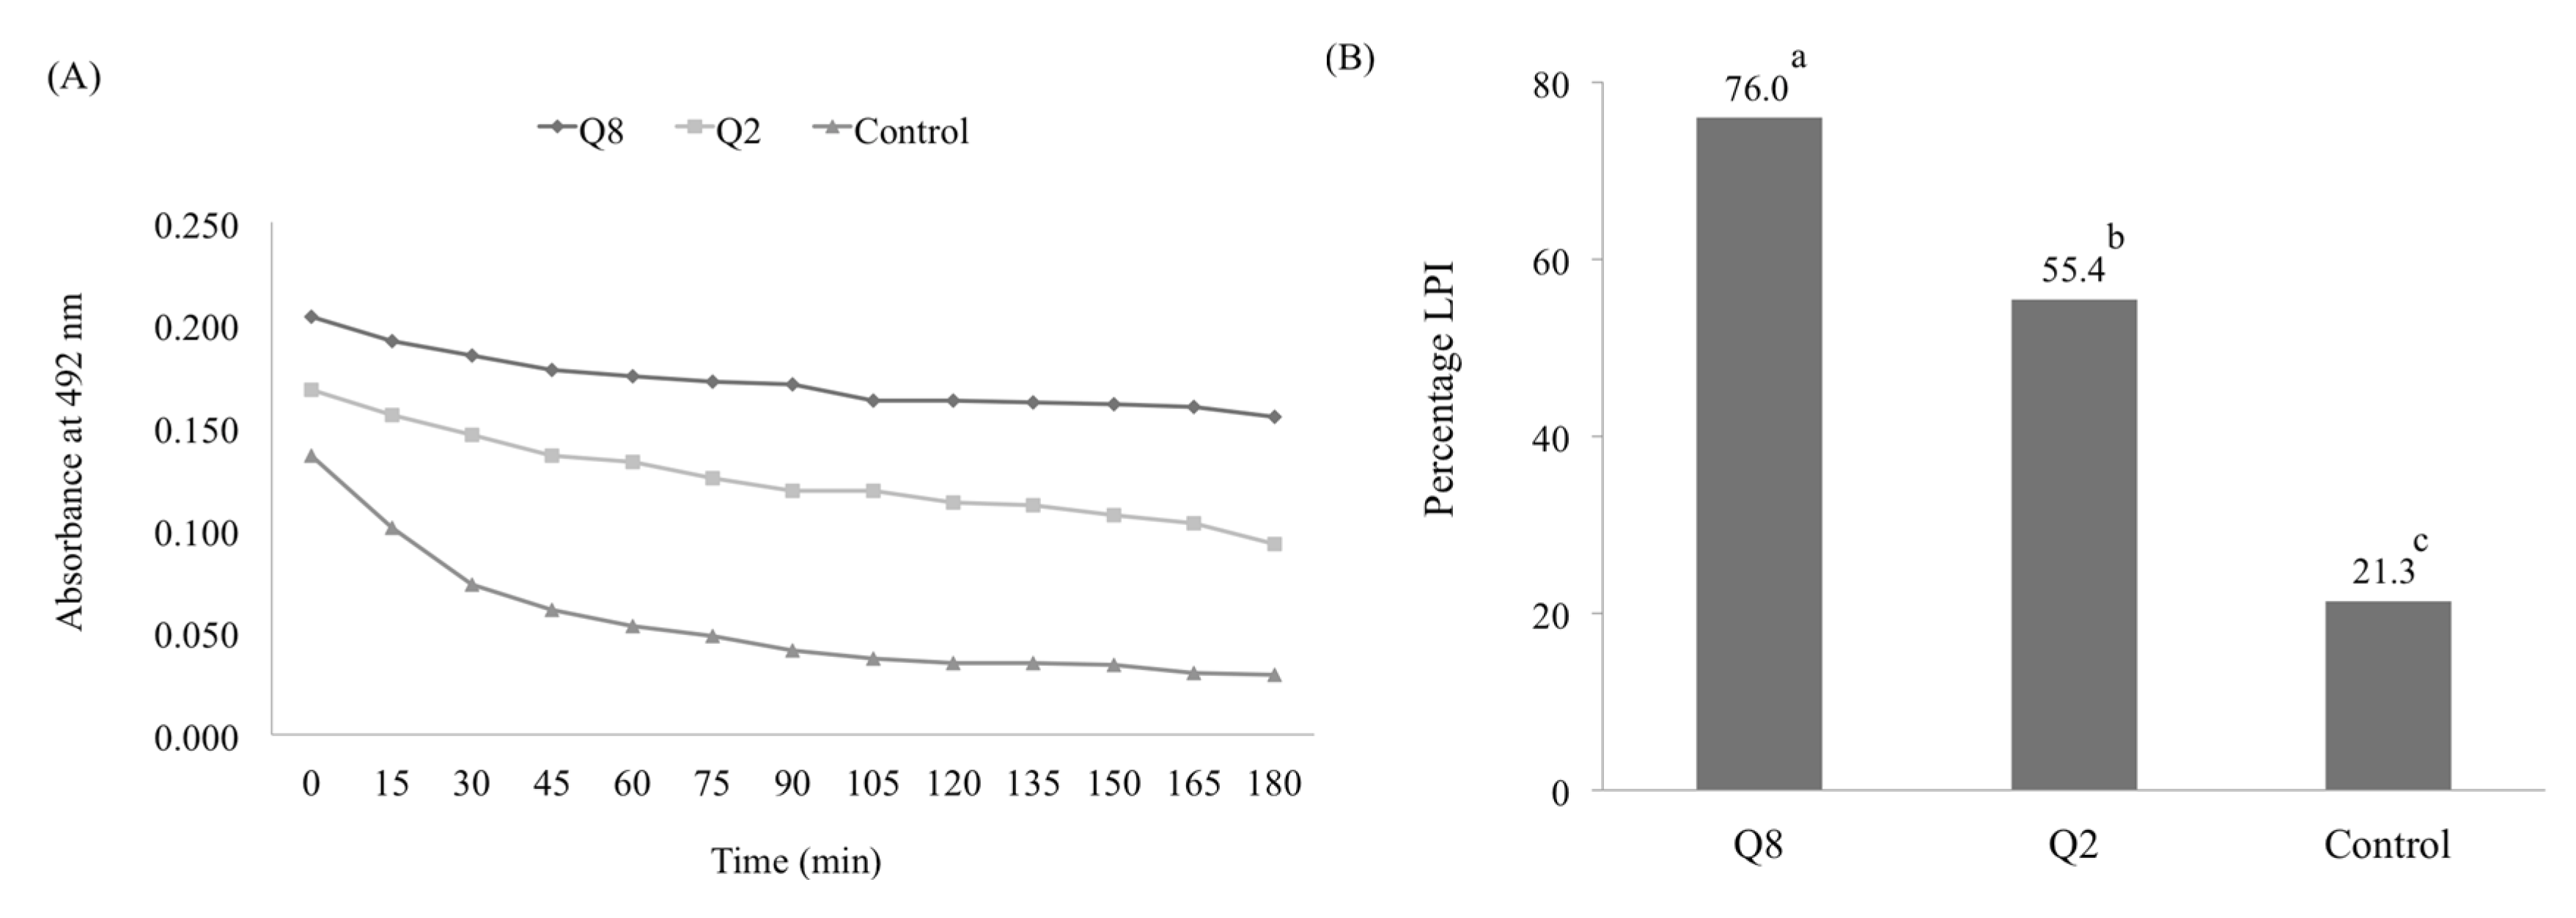
3.3. Effects of Water Deficient Stress on Antioxidant Capacity

The DPPH radical scavenging activity of the Q8 and Q2 cultivars are shown in Figure 4 and Figure 5 and are exhibited in IC50, the lower values indicating the stronger activity. As a result, Q8 showed stronger DPPH radical scavenging activity than Q2. Similarly, the antioxidant activities of the β-carotene bleaching method and lipid peroxidation inhibition of Q8 were also stronger than Q2 and were significantly different from those of the controls (Figure 5). Observations of this experiment indicate that the antioxidant activities of rice were promoted in water deficient stress, and the antioxidative strength was proportional to the drought resistance levels of rice cultivars.

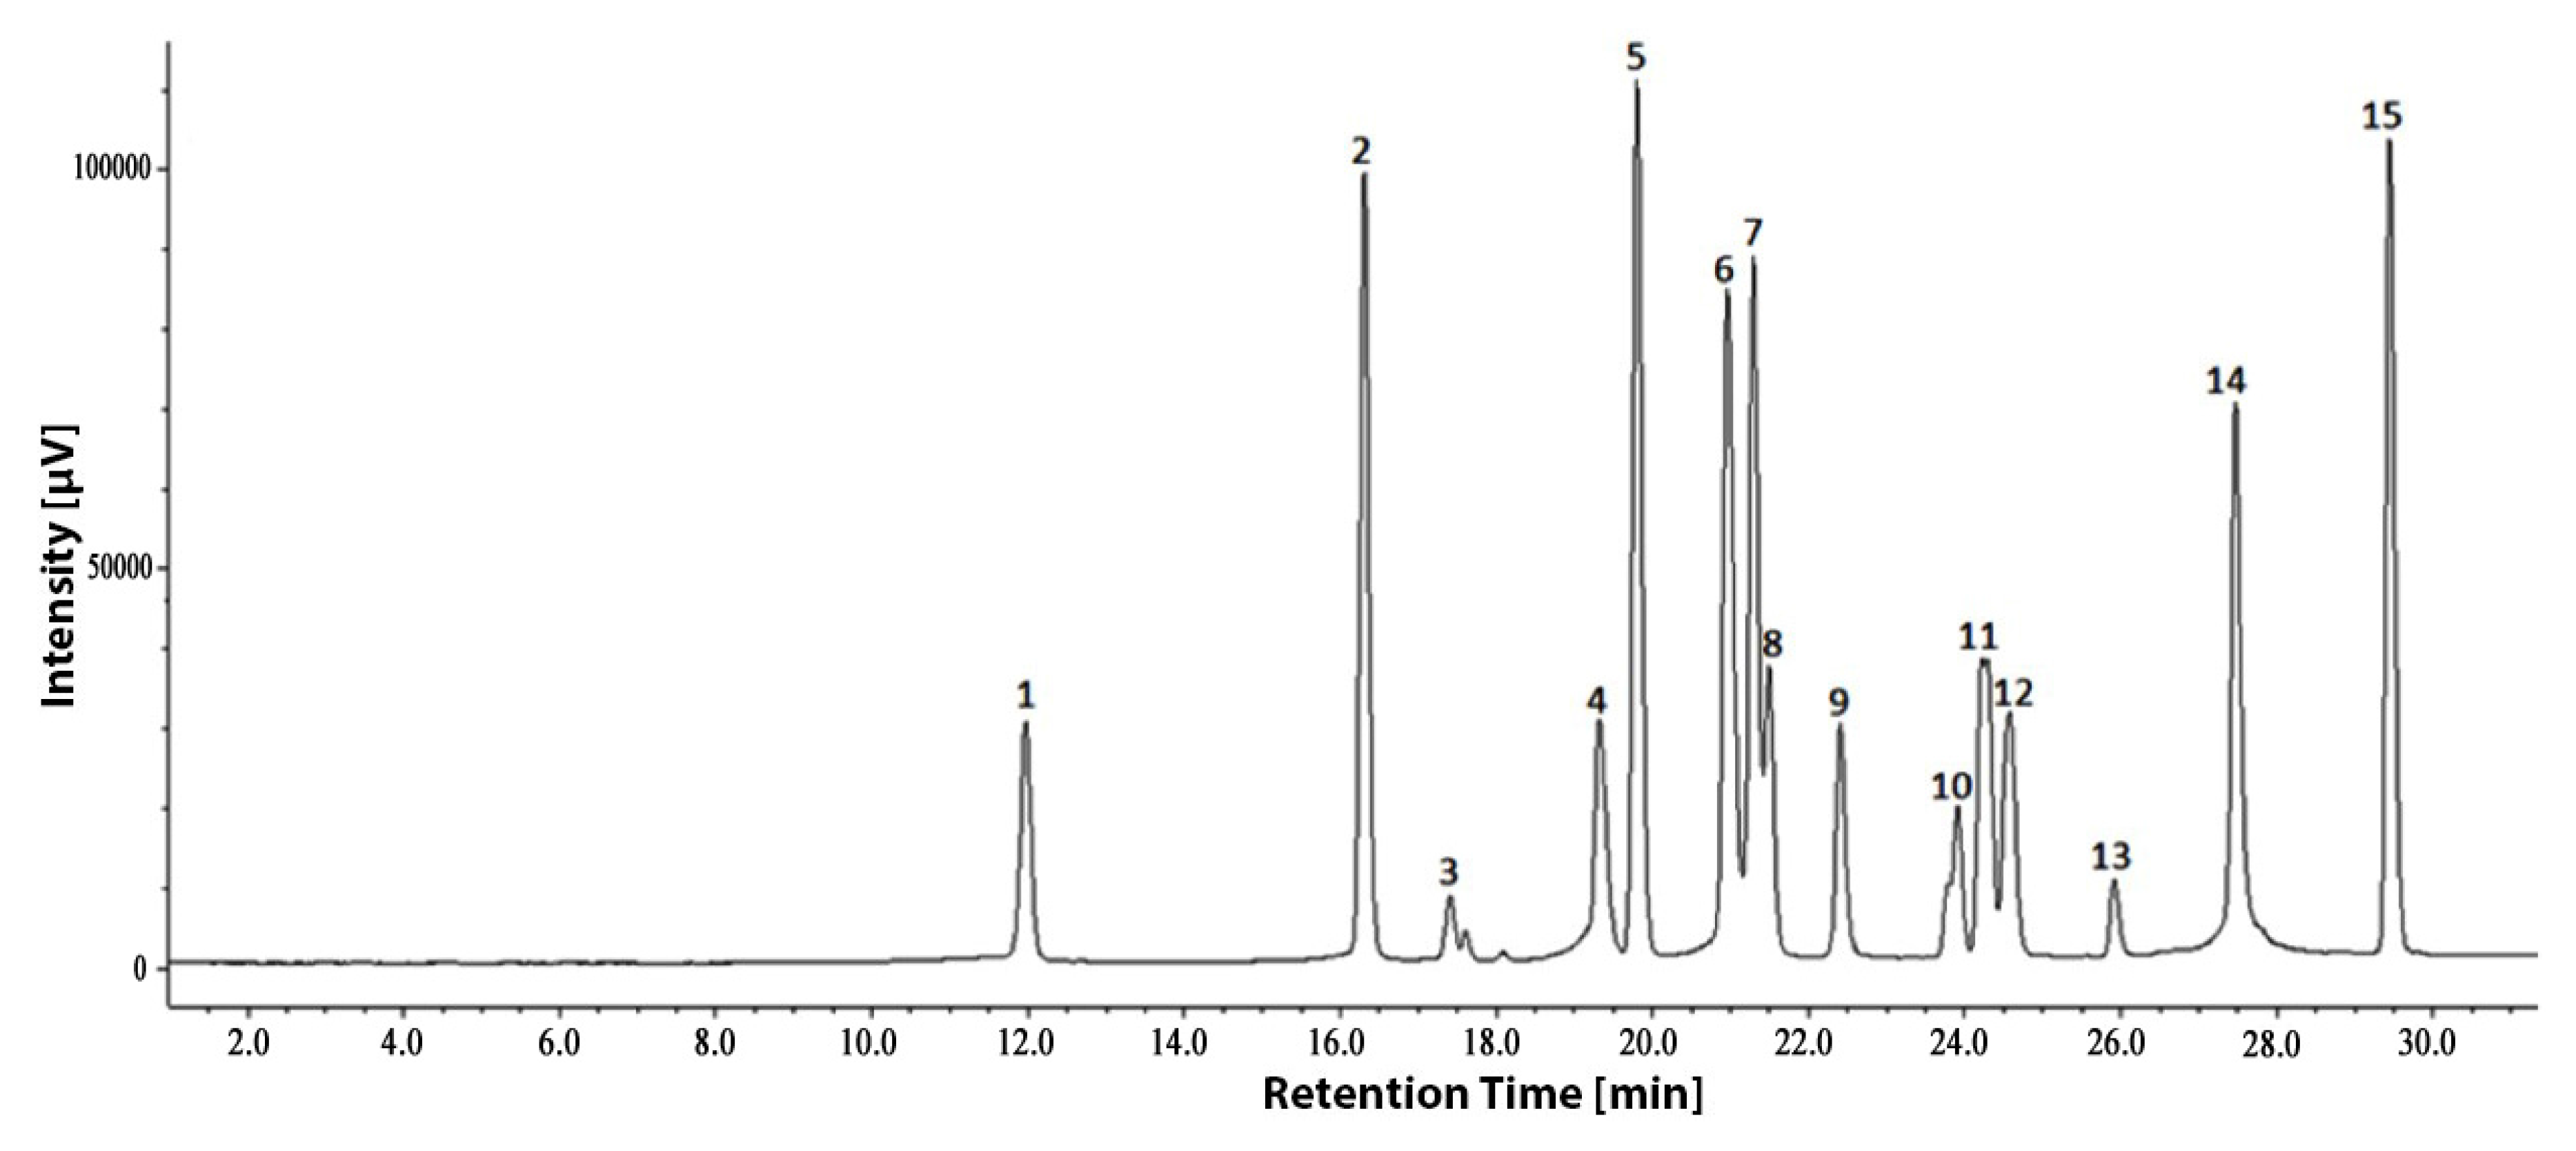
3.4. Changes of Phenolic Components under Drought Stress

Fifteen standard phenolic acids were used to examine their presence in Q2 and Q8 cultivars in controls (watering condition) and water deficit stress. The identification and quantification of these compounds were determined by an HPLC (Figure 6). However, only eight constituents were detected (Table 4). In the controls, six phenolic acids were found, whereas in Q2 cultivar, only three phenolics were presented. In general, ferulic acid (FA), p-coumaric acid (PCA), and benzoic acid (BA), which were found in both Q8 and Q2, presented in Q8 in much greater quantities than Q2. Under water deficit stress, the amounts of these compounds extensively increased; however, the extent of them in Q8 was also much greater than Q2 (Table 4). Vanillin and cinnamic acid were available in Q8, but they were only found in the drought susceptible Q2 cultivar in drought stress. Interestingly, vanillic acid was not detected in the controls of Q8 and Q2, but it was both found in the drought stress treatments. In addition, p-hydroxybenzoic acid was found only in Q8 in water deficit stress, suggesting that this compound may play a critical role in the defense mechanism of rice against drought (Table 4).

4. Discussion

The processes of delayed leaf rolling and reduced leaf drying are often expressed in drought stress tolerance of rice plants under non-watered condition [29]. In addition, leaf rolling and leaf withering have also been known as response mechanisms of plants to avoid water loss caused by stomatal transpiration on the leaf surface [30]. The bioactivity of leaf phenolic molecules is considered as a signal trigger that leads to protective mechanisms against drought stress [18]. Previous studies highlighted the accumulation of phenolic acids and flavonoids as antioxidants and sunshields involved in responses of plants to drought stress and ultraviolet radiation [31]. Water stress was reported to generate cell-damaging oxidants, but it also resulted in synthesizing a large amount of flavonoids and phenolic acids in wheat leaves [7]. Sánchez-Rodríguez et al. [32] found a high increase of kaempferol and quercetin in drought-resistant tomato cultivars, while these flavonoids were reduced in drought sensitive cultivars. Some phenylpropanoid compounds were identified in maize under drought, in which p-coumaric acid and caffeic acid contents showed a build up, whereas ferulic acid quantity trended towards a lower decrease in water-stressed plants [33].
In this research, Q8 and Q2 were used to examine the difference in chemical composition and their changes in drought stress. Total phenols, total flavonoids, and antioxidant capacity of Q8 were found to be markedly higher than Q2 in watering condition (Figure 2, Figure 3, Figure 4 and Figure 5). Their amounts and antioxidative levels were increased in drought stress. The findings indicate that total phenols, flavonoids, and antioxidant activities were closely associated with the drought resistance strength of rice. Their increases in drought stress were found proportional to drought resistance levels. However, the identification of what constituents in the flavonoid group are relevant to drought stress should be identified, as a number of individual phenolic acids of the phenol group have already been found in this study. Some investigations have also presented that there is a positive correlation between antioxidant activity and the contents of total phenolics in plants. For example, Oki et al. [34] observed that radical-scavenging ability in red-hulled and black-hulled rice depended on the concentrations of proanthocyanidins and anthocyanins, respectively. During the process of finger millet malting, the contents of phenolic acids were changed, reflecting their antioxidant capacity [35]. The high levels of flavonols, quercetin and kaempferol contents were associated with enhanced stress tolerance capacity of white clover under UV-B radiation and drought conditions [31]. In rice, kaempferol and quercetin components were also identified in rice seeds [36]. In addition, Karimi et al. [37] detected a large amount of kaempferol in rice straw that was able to scavenge free radicals. In this study, we did not find any involvement of the two compounds in response to water deficit stress, Molecular weights of kaempferol and quercetin are 286 and 302, respectively, and they are both greater than those of the detected phenolics (p-hydroxybenzoic acid: 138; cinnamic acid: 148; ferulic acid: 194; p-coumaric acid: 164, benzoic acid: 122, syringic acid: 198). In the HPLC profile, basically, kaempferol and quercetin should have retentions greater than these phenolic acids (19.82 to 29.65 min; Table 4). However, we could not find any trace of other compounds appearing in the HPLC profile at retention times >30 min, suggesting that kaempferol and quercetin were not involved in the drought stress of rice. It is proposed that the two compounds may be involved in other defense mechanisms of rice against abiotic stresses that need further critical elaboration.
Among fifteen phenolic acids, eight compounds were found to correlate with the drought resistance levels of Q8 and Q2 rice cultivars. However, their presence should also be examined in other rice varieties with different origins and cultivated conditions to elaborate on the actual roles of these compounds in rice. The significant increase in quantities of the phenolic acids detected in Q8 and Q2 proposed that these compounds were involved in the response of rice against water deficit stress.
Plants often synthesize a series of chemicals with various bioactivities in response to specific stresses [38]. In the shikimate pathway, a biosynthetic pathway for aromatic L-amino acid (AAs), one of the common secondary metabolic precursors is activated early in stress-induced plants [39,40,41,42]. Many phenolic compound synthesis-related genes in the shikimate pathway are also induced immediately by stresses [42]. The expression of PAL genes (OsPALs) was proved prior to the accumulation of sakuranetin and phenylamide phytoalexins in UV-irradiated rice leaves [39,42]. The in vivo biosynthesis of kaempferol and quercetin glucosides was decided by three functional genes, UGT706C1, UGT706D1 and UGT707A3 [43]. Furthermore, in higher plants, the formation of C6—C1 acids by removal of a two-carbon fragment from C6—C3 acids was verified to be a common route for biosynthesis of p-hydroxybenzoic acid and vanillic acid [44,45].
The ability to tolerate the drought stress of phenolic acids was reported to differ greatly among plant genotypes [2]. If further extracting protocols are applied, the existence of further phenolics and other secondary metabolites in Q8 and Q2 can be detected and understood. According to the response of their presence and quantities, cinnamic acid, vanillin, and vanillic acid showed a potent involvement in the drought tolerance of rice. In addition, p-hydroxybenzoic acid was found only in drought stress of the drought tolerant Q8 cultivar, suggesting that this phenolic may also play a critical role. Further assays to examine how much p-hydroxybenzoic acid, cinnamic acid, vanillin, and vanillic acid are involved in the drought resistance of rice should be conducted. In addition, the examination of derivatives including enzymes and proteins synthesizing these phenolic acids, especially p-hydroxybenzoic acid and vanillic acid, needs to be explored and their functions clarified. The data of phenolic acids’ biosynthesis and metabolism may provide useful evidence for developing bioactive reagents to protect rice production against drought.

Acknowledgments

The authors thank the Taoyaka program, Hiroshima University, Japan for providing a scholarship to Nguyen Thanh Quan. Thanks are also due to La Tuan Nghia, and Nobukazu Nakagoshi for their constructive advice on this research. Thanks are also due to Grant-in-Aid for Scientific Research (No. 23688029).

Author Contributions

Nguyen Thanh Quan conducted the experiments and wrote the paper. La Hoang Anh, Do Tan Khang and Phung Thi Tuyen contributed in the material and data collection. Nguyen Phu Toan, Truong Ngoc Minh and Luong The Minh were in-charge of the preparation of experimental equipments. Do Tuan Bach and Pham Thi Thu Ha contributed in the design of the study. Abdelnaser Abdelghany Elzaawely, Tran Dang Khanh and Khuat Huu Trung participated in the analysis and interpretation of the results. Tran Dang Xuan supervised the research work and edited the manuscript.

Conflicts of Interest

The authors declare no conflict of interests.

References

  1. Saikumar, S.; Gouda, P.K.; Saiharini, A.; Varma, C.M.K.; Vineesha, O.; Padmavathi, G.; Shenoy, V.V. Major QTL for enhancing rice grain yield under lowland reproductive drought stress identified using an O. sativa/O. glaberrima introgression line. Field Crops Res. 2014, 163, 119–131. [Google Scholar] [CrossRef]
  2. Sabar, M.; Arif, M. Phenotypic response of rice (Oryza sativa) genotypes to variable moisture stress regimes. Int. J. Agric. Biol. 2014, 16, 32–40. [Google Scholar]
  3. Shukla, N.; Awasthi, R.P.; Rawat, L.; Kumar, J. Biochemical and physiological responses of rice (Oryza sativa L.) as influenced by Trichoderma harzianum under drought stress. Plant Physiol. Biochem. 2012, 54, 78–88. [Google Scholar] [CrossRef] [PubMed]
  4. Mir, R.R.; Zaman-Allah, M.; Sreenivasulu, N.; Trethowan, R.; Varshney, R.K. Integrated genomics, physiology and breeding approaches for improving drought tolerance in crops. Theor. Appl. Genet. 2012, 125, 625–645. [Google Scholar] [CrossRef] [PubMed] [Green Version]
  5. Bourgaud, F.; Gravot, A.; Milesi, S.; Gontier, E. Production of plant secondary metabolites: A historical perspective. Plant Sci. 2001, 161, 839–851. [Google Scholar] [CrossRef]
  6. Torras-Claveria, L.; Jáuregui, O.; Codina, C.; Tiburcio, A.F.; Bastida, J.; Viladomat, F. Analysis of phenolic compounds by high-performance liquid chromatography coupled to electrospray ionization tandem mass spectrometry in senescent and water-stressed tobacco. Plant Sci. 2012, 182, 71–78. [Google Scholar] [CrossRef] [PubMed]
  7. Ma, D.; Sun, D.; Wang, C.; Li, Y.; Guo, T. Expression of flavonoid biosynthesis genes and accumulation of flavonoid in wheat leaves in response to drought stress. Plant Physiol. Biochem. 2014, 80, 60–66. [Google Scholar] [CrossRef] [PubMed]
  8. Balasundram, N.; Sundram, K.; Samman, S. Phenolic compounds in plants and agri-industrial by-products: Antioxidant activity, occurrence, and potential uses. Food Chem. 2006, 99, 191–203. [Google Scholar] [CrossRef]
  9. Lattanzio, V.; Lattanzio, V.M.; Cardinali, A. Role of phenolics in the resistance mechanisms of plants against fungal pathogens and insects. Phytochem. Adv. Res. 2006, 661, 23–67. [Google Scholar]
  10. Fayez, K.A.; Bazaid, S.A. Improving drought and salinity tolerance in barley by application of salicylic acid and potassium nitrate. J. Saudi Soc. Agric. Sci. 2014, 13, 45–55. [Google Scholar] [CrossRef]
  11. Fernández-García, N.; Olmos, E.; Bardisi, E.; García-De la Garma, J.; López-Berenguer, C.; Rubio-Asensio, J.S. Intrinsic water use efficiency controls the adaptation to high salinity in a semi-arid adapted plant, henna (Lawsonia inermis L.). J. Plant Physiol. 2014, 171, 64–75. [Google Scholar] [CrossRef] [PubMed]
  12. Yildiz-Aktas, L.; Dagnon, S.; Gurel, A.; Gesheva, E.; Edreva, A. Drought tolerance in cotton: Involvement of non-enzymatic ROS-scavenging compounds. J. Agron. Crop Sci. 2009, 195, 247–253. [Google Scholar] [CrossRef]
  13. Wahid, A.; Ghazanfar, A. Possible involvement of some secondary metabolites in salt tolerance of sugarcane. J. Plant Physiol. 2006, 163, 723–730. [Google Scholar] [CrossRef] [PubMed]
  14. Tian, S.; Nakamura, K.; Kayahara, H. Analysis of phenolic compounds in white rice, brown rice, and germinated brown rice. J. Agric. Food Chem. 2004, 52, 4808–4813. [Google Scholar] [CrossRef] [PubMed]
  15. Selmar, D. Potential of salt and drought stress to increase pharmaceutical significant secondary compounds in plants. Landbauforsch. Volkenrode 2008, 58, 139–144. [Google Scholar]
  16. Markham, K.R.; Tanner, G.J.; Caasi-Lit, M.; Whitecross, M.I.; Nayudu, M.; Mitchell, K.A. Possible protective role for 3′, 4′-dihydroxyflavones induced by enhanced UV-B in a UV-tolerant rice cultivar. Phytochemistry 1998, 49, 1913–1919. [Google Scholar] [CrossRef]
  17. Farooq, M.; Basra, S.M.A.; Wahid, A.; Ahmad, N.; Saleem, B.A. Improving the drought tolerance in rice (Oryza sativa L.) by exogenous application of salicylic acid. J. Agron. Crop Sci. 2009, 195, 237–246. [Google Scholar] [CrossRef]
  18. Akula, R.; Ravishankar, G.A. Influence of abiotic stress signals on secondary metabolites in plants. Plant Signal. Behav. 2011, 6, 1720–1731. [Google Scholar] [CrossRef] [PubMed]
  19. Walter, M.; Marchesan, E. Phenolic compounds and antioxidant activity of rice. Braz. Arch. Biol. Technol. 2011, 54, 371–377. [Google Scholar] [CrossRef]
  20. Walter, M.; Marchesan, E.; Massoni, P.F.S.; da Silva, L.P.; Sartori, G.M.S.; Ferreira, R.B. Antioxidant properties of rice grains with light brown, red and black pericarp colors and the effect of processing. Food Res. Int. 2013, 50, 698–703. [Google Scholar] [CrossRef]
  21. IRRI (International Rice Research Institute). Standard Evaluation System for Rice, 2nd ed.; IRRI Los Banos: Laguna, Philippines, 1980; p. 44. [Google Scholar]
  22. Ti, H.; Zhang, R.; Zhang, M.; Li, Q.; Wei, Z.; Zhang, Y.; Ma, Y. Dynamic changes in the free and bound phenolic compounds and antioxidant activity of brown rice at different germination stages. Food Chem. 2014, 161, 337–344. [Google Scholar] [CrossRef] [PubMed]
  23. Elzaawely, A.A.; Tawata, S. Antioxidant capacity and phenolic content of Rumex dentatus L. grown in Egypt. J. Crop Sci. Biotechnol. 2012, 15, 59–64. [Google Scholar] [CrossRef]
  24. Elzaawely, A.A.; Tawata, S. Antioxidant activity of phenolic rich fraction obtained from Convolvulus arvensis L. leaves grown in Egypt. Asian J. Crop Sci. 2012, 4, 32–40. [Google Scholar] [CrossRef]
  25. Elzaawely, A.A.; Xuan, T.D.; Tawata, S. Antioxidant and antibacterial activities of Rumex japonicus HOUTT. aerial parts. Biol. Pharm. Bull. 2005, 28, 2225–2230. [Google Scholar] [CrossRef] [PubMed]
  26. Son, S.; Lewis, B.A. Free radical scavenging and antioxidative activity of caffeic acid amide and ester analogues: structure-activity relationship. J. Agric. Food Chem. 2002, 50, 468–472. [Google Scholar] [CrossRef] [PubMed]
  27. Soares, A.A.; de Souza, C.G.M.; Daniel, F.M.; Ferrari, G.P.; da Costa, S.M.G.; Peralta, R.M. Antioxidant activity and total phenolic content of Agaricus brasiliensis (Agaricus blazei Murril) in two stages of maturity. Food Chem. 2009, 112, 775–781. [Google Scholar] [CrossRef]
  28. Xuan, T.D.; Tsuzuki, E.; Terao, H.; Matsuo, M.; Khanh, T.D. Correlation between growth inhibitory exhibition and suspected allelochemicals (phenolic compounds) in the extract of alfalfa (Medicago sativa L.). Plant Prod. Sci. 2003, 6, 165–171. [Google Scholar] [CrossRef]
  29. Hu, H.; Dai, M.; Yao, J.; Xiao, B.; Li, X.; Zhang, Q.; Xiong, L. Overexpressing a NAM, ATAF, and CUC (NAC) transcription factor enhances drought resistance and salt tolerance in rice. Proc. Natl. Acad. Sci. USA 2006, 103, 12987–12992. [Google Scholar] [CrossRef] [PubMed]
  30. Hura, T.; Hura, K.; Dziurka, K.; Ostrowska, A.; Bączek-Kwinta, R.; Grzesiak, M. An increase in the content of cell wall-bound phenolics correlates with the productivity of triticale under soil drought. J. Plant Physiol. 2012, 169, 1728–1736. [Google Scholar] [CrossRef] [PubMed]
  31. Nichols, S.N.; Hofmann, R.W.; Williams, W.M. Physiological drought resistance and accumulation of leaf phenolics in white clover interspecific hybrids. Environ. Exp. Bot. 2015, 119, 40–47. [Google Scholar] [CrossRef]
  32. Sánchez-Rodríguez, E.; Moreno, D.A.; Ferreres, F.; del Mar Rubio-Wilhelmi, M.; Ruiz, J.M. Differential responses of five cherry tomato varieties to water stress: changes on phenolic metabolites and related enzymes. Phytochemistry 2011, 72, 723–729. [Google Scholar] [CrossRef] [PubMed]
  33. Alvarez, S.; Marsh, E.L.; Schroeder, S.G.; Schachtman, D.P. Metabolomic and proteomic changes in the xylem sap of maize under drought. Plant Cell Environ. 2008, 31, 325–340. [Google Scholar] [CrossRef] [PubMed]
  34. Oki, T.; Masuda, M.; Kobayashi, M.; Nishiba, Y.; Furuta, S.; Suda, L.; Sato, T. Polymeric procyanidins as radical-scavenging components in red-hulled rice. J. Agric. Food Chem. 2002, 50, 7524–7529. [Google Scholar] [CrossRef] [PubMed]
  35. Subba Rao, M.V.; Muralikrishna, G. Evaluation of the antioxidant properties of free and bound phenolic acids from native and malted finger millet (Ragi, Eleusine coracana Indaf-15). J. Agric. Food Chem. 2002, 50, 889–892. [Google Scholar] [CrossRef] [PubMed]
  36. Chatterjee, A.; Saha, P.K.; Gupta, P.D.; Ganguly, S.N.; Sircar, S.M. Chemical examination of viable and non-viable rice seeds. Physiol. Plant. 1976, 38, 307–308. [Google Scholar] [CrossRef]
  37. Karimi, E.; Mehrabanjoubani, P.; Keshavarzian, M.; Oskoueian, E.; Jaafar, H.Z.; Abdolzadeh, A. Identification and quantification of phenolic and flavonoid components in straw and seed husk of some rice varieties (Oryza sativa L.) and their antioxidant properties. J. Sci. Food Agric. 2014, 94, 2324–2330. [Google Scholar] [CrossRef] [PubMed]
  38. Inderjit; Callaway, R.M.; Vivanco, J.M. Can plant biochemistry contribute to understanding of invasion ecology? Trends Plant Sci. 2006, 11, 574–580. [Google Scholar] [CrossRef] [PubMed]
  39. Park, H.L.; Lee, S.W.; Jung, K.H.; Hahn, T.R.; Cho, M.H. Transcriptomic analysis of UV-treated rice leaves reveals UV-induced phytoalexin biosynthetic pathways and their regulatory networks in rice. Phytochemistry 2013, 96, 57–71. [Google Scholar] [CrossRef] [PubMed]
  40. Tzin, V.; Galili, G. New insights into the shikimate and aromatic amino acids biosynthetic pathways in plants. Mol. Plant 2010, 3, 956–972. [Google Scholar] [CrossRef] [PubMed]
  41. Parker, D.; Beckmann, M.; Zubair, H.; Enot, D.P.; Caracuel-Rois, Z.; Overy, D.P.; Snowdon, S.; Talbot, N.J.; Draper, J. Metabolomic analysis reveals a common pattern of metabolic re-programming during invasion of three host plant species by Magnaporthe grisea. Plant J. 2009, 59, 723–737. [Google Scholar] [CrossRef] [PubMed]
  42. Cho, M.H.; Lee, S.W. Phenolic phytoalexins in rice: Biological functions and biosynthesis. Int. J. Mol. Sci. 2015, 16, 29120–29133. [Google Scholar] [CrossRef] [PubMed]
  43. Ko, J.H.; Kim, B.G.; Kim, J.H.; Kim, H.; Lim, C.E.; Lim, J.; Lee, C.; Lim, Y.; Ahn, J.H. Four glucosyltransferases from rice: cDNA cloning, expression, and characterization. J. Plant Physiol. 2008, 165, 435–444. [Google Scholar] [CrossRef] [PubMed]
  44. Terashima, N.; Mori, I.; Kanda, T. Biosynthesis of p-hydroxybenzoic acid in poplar lignin. Phytochemistry 1975, 14, 1991–1992. [Google Scholar] [CrossRef]
  45. El-Basyouni, S.Z.; Chen, D.; Ibrahim, R.K.; Neish, A.C.; Towers, G.H.N. The biosynthesis of hydroxybenzoic acids in higher plants. Phytochemistry 1964, 3, 485–492. [Google Scholar] [CrossRef]
Figure 1. Q2 and Q8 cultivars after 10 days without watering.
Agriculture 06 00023 g001
Figure 2. Total phenolic contents of Q8 and Q2 in comparison with the controls. Values are means ± standard errors (SE) (n = 3). Means with the same letters are not significantly different (p = 0.05). GAE: gallic acid equivalent.
Agriculture 06 00023 g002
Figure 3. Total flavonoid contents of Q8 and Q2 in comparison with the controls. Values are means ± standard errors (SE) (n = 3). Means with the same letters are not significantly different (p = 0.05). RE: rutin equivalent.
Agriculture 06 00023 g003
Figure 4. Comparison of DPPH (1,1-diphenyl-2-picrylhydrazyl) radical scavenging activity between Q2 and Q8 (IC50). Values are means ± standard error (SE) (n = 3). Means that do not share a letter are significantly different (p = 0.05).
Agriculture 06 00023 g004
Figure 5. Antioxidant activities of phenolic extracts of Q8 and Q2 measured by β-carotene bleaching method (A) and lipid peroxidation inhibition (% LPI); (B) Means that do not share a letter are significantly different (p = 0.05).
Agriculture 06 00023 g005
Figure 6. HPLC chromatogram (at 254 nm) shows the separation of standard phenolic acids, 1: gallic acid (GA); 2: protocatechuic acid (PA); 3: catechol (C); 4: chlorogenic acid (CHA); 5: p-hydroxybenzoic acid (PHBA); 6: vanillic acid (VA); 7: caffeic acid (CFA); 8: syringic acid (SYA); 9: vanillin (V); 10: ferulic acid (FA); 11: sinapic acid (SIA); 12: p-coumaric acid (PCA); 13: benzoic acid (BA); 14: ellagic acid (EA); 15: cinnamic acid (CA).
Agriculture 06 00023 g006
Table 1. Rice cultivars and their origins.
No.Rice CultivarsCodesOrigins
1IRRI-C22C22PRC, Vietnam
2Nep vang ong Hoa BinhQ1PRC, Vietnam
3Re nuocQ2PRC, Vietnam
4Bau quaiQ3PRC, Vietnam
5Nep chuoi Hoa BinhQ4PRC, Vietnam
6Nep reQ5PRC, Vietnam
7Lua racQ6PRC, Vietnam
8Nep lai hoa vangQ7PRC, Vietnam
9Nep nanh ngua Hai PhongQ8PRC, Vietnam
10QTN-1T1AGI, Vietnam
11QTN-2T2AGI, Vietnam
12QTN-3T3AGI, Vietnam
13QTN-4T4AGI, Vietnam
14QTN-5T5AGI, Vietnam
15QTN-6T6AGI, Vietnam
16QTN-7T7AGI, Vietnam
17QTN-BV5B5AGI, Vietnam
18QTN-HTS1H1AGI, Vietnam
19Khang dan 18K18AGI, Vietnam
20KoshihikariKOHiroshima, Japan
PRC: Plant Resource Center, Hanoi, Vietnam; AGI: Agricultural Genetics Institute Hanoi, Vietnam.
Table 2. Standard evaluation scale of drought tolerant rice.
ScalesDescription
Leaf rolling
0No symptoms (normal leaves)
1Leaves starts folding (light V-shaped)
3Leaves folding (deep V-shaped)
5Leaves cupped fully (U-shaped)
7Two leaf margins touching (O-shaped)
9Leaves rolled tightly
Leaf drying
0No symptoms (normal leaves)
1Slight leaf tip drying (extended to less than 1/4 length of leaves)
3Tip drying extended to 1/4 length in 25% of all leaves
5Tip drying extended from 1/4 to 1/2 length in at most 50% of all leaves
7Tip drying extended to 2/3 length or more in at most 70% of all leaves
9All plants dryly died
Leaf withering
1Leaves had a naturally green color (account for 95% all of the leaves)
5The backside of all leaves transferred to yellow accounted for 70%
9Leaves totally transferred to yellow color
Recovery
190%–100% of plants were recovered
370%–89% of plants were recovered
540%–69% of plants were recovered
720%–39% of plants were recovered
90%–19% of plants were recovered
Source: International Rice Research Institute (IRRI, 1980) [21].
Table 3. Resistant categories and levels of rice under water deficiency stress.
No.Rice VarietyLeaf RollingLeaf DryingLeaf WitheringRecovering
1C225.3 ± 2.34.0 ± 2.15.0 ± 2.33.5 ± 2.0
2Q14.7 ± 2.63.9 ± 2.75.0 ± 2.34.3 ± 2.4
3Q27.9 ± 1.17.1 ± 1.07.1 ± 1.95.5 ± 1.6
4Q35.9 ± 2.55.4 ± 2.35.3 ± 2.33.4 ± 2.0
5Q44.9 ± 2.64.0 ± 2.65.0 ± 2.34.3 ± 2.4
6Q55.3 ± 2.64.4 ± 2.65.0 ± 2.34.5 ± 2.2
7Q66.6 ± 2.26.1 ± 1.95.5 ± 2.45.0 ± 2.3
8Q76.7 ± 1.95.7 ± 2.05.5 ± 2.14.5 ± 2.0
9Q83.7 ± 2.73.1 ± 2.04.2 ± 2.43.0 ± 2.0
10T14.7 ± 2.44.2 ± 2.14.5 ± 2.43.3 ± 1.9
11T26.4 ± 1.35.9 ± 1.65.0 ± 2.34.9 ± 2.3
12T35.4 ± 2.24.9 ± 2.15.0 ± 2.34.3 ± 2.1
13T45.8 ± 2.25.0 ± 1.85.5 ± 2.14.3 ± 1.9
14T56.1 ± 2.25.7 ± 2.25.3 ± 2.34.9 ± 2.2
15T65.9 ± 2.55.4 ± 2.55.3 ± 2.35.0 ± 2.3
16T76.8 ± 1.66.2 ± 2.15.5 ± 2.45.7 ± 1.8
17B55.7 ± 2.65.5 ± 2.45.0 ± 2.33.7 ± 2.1
18H14.7 ± 2.34.1 ± 1.94.7 ± 2.33.7 ±1.9
19K186.1 ± 2.45.3 ± 2.35.0 ± 2.34.3 ± 2.1
20KO5.5 ± 2.05.1 ± 2.05.3 ± 2.14.1 ± 2.3
Values are means ± standard errors (SE) (n = 5). Grades of drought tolerance: (1) leaf rolling: 0—normal leaves, 1—light V-shaped leaves, 3—deep V-shaped leaves, 5—U-shaped leaves, 7—O-shaped leaves, 9—tight rolled leaves; (2) leaf drying: 0—normal leaves, 1—top of leaves are dried lightly, 3—leaves are dried up to 1/4 of leaf length, 5—1/4—1/2 of leaves are dried, 7—more 2/3 of leaves are dried, 9—leaves are dryly died; (3) leaf withering: 1—leaves are natural green, 5—backside of leaves transfer to yellow color, 9—leaves totally transfer to yellow color; (4) recovering: 1—plants are covered from 90% to 100%, 3—plants are covered from 70% to 89%, 5—plants are covered from 40% to 69%, 7—plants are covered from 20% to 39%, 9—plants are covered from 0% to 19%.
Table 4. Contents of phenolic acids in Q8 and Q2 determined by HPLC.
No.Phenolic AcidsRetention Times (min)Q8Q2
Controls (mg/g DW)Drought Stress (mg/g DW)Controls (mg/g DW)Drought Stress (mg/g DW)
1PHBA19.82-0.161 ± 0.08--
2VA20.99-0.029 ± 0.02 ns-0.009 ± 0.01 ns
3SYA21.560.746 ± 0.37 a0.157 ± 0.08 b--
4V22.400.298 ± 0.03 ns0.447 ± 0.22 ns-0.152 ± 0.08 ns
5FA23.970.304 ± 0.15 ns0.638 ± 0.02 ns0.219 ± 0.11 ns0.299 ± 0.10 ns
6PCA24.380.998 ± 0.12 ab1.295 ± 0.65 a0.598 ± 0.01b c0.576 ± 0.29 bc
7BA26.020.332 ± 0.17 b1.016 ± 0.40 a0.274 ± 0.01 b0.407 ± 0.20 b
8CA29.650.025 ± 0.01 ns0.053 ± 0.01 ns-0.056 ± 0.004 ns
DW: Dry weight. (-): Not detected, ns: not significantly different. Values are means ± standard errors (SE) (n = 3). Means in each row with the same letters are not significantly different (p = 0.05). PHBA: p-hydroxybenzoic acid; VA: vanillic acid; SYA: syringic acid; V: vanillin; FA: ferulic acid; PCA: p-coumaric acid; BA: benzoic acid; CA: cinnamic acid.

