Article

Effect of Wheat Cover Crop and Split Nitrogen Application on Corn Yield and Nitrogen Use Efficiency

1
Department of Plant, Soil, and Agricultural Systems, Southern Illinois University, Carbondale, IL 62901, USA
2
Western Colorado Research Center-Fruita, Colorado State University, 1910 L Road, Fruita, CO 81521, USA
3
California Department of Agriculture, Sacramento, CA 95833, USA
4
Department of Animal Science, Cornell University, Ithaca, NY 14853, USA
*
Author to whom correspondence should be addressed.
Submission received: 30 May 2020 / Revised: 20 July 2020 / Accepted: 23 July 2020 / Published: 27 July 2020
(This article belongs to the Special Issue Soil Healthy in Agro-ecosystems)

Abstract

:
Corn (Zea mays L.) grain is a major commodity crop in Illinois and its production largely relies on timely application of nitrogen (N) fertilizers. Currently, growers in Illinois and other neighboring states in the U.S. Midwest use the maximum return to N (MRTN) decision support system to predict corn N requirements. However, the current tool does not factor in implications of integrating cover crops into the rotation, which has recently gained attention among growers due to several ecosystem services associated with cover cropping. A two-year field trail was conducted at the Agronomy Research Center in Carbondale, IL in 2018 and 2019 to evaluate whether split N application affects nitrogen use efficiency (NUE) of corn with and without a wheat (Triticum aestivum L.) cover crop. A randomized complete block design with split plot arrangements and four replicates was used. Main plots were cover crop treatments (no cover crop (control) compared to a wheat cover crop) and subplots were N timing applications to the corn: (1) 168 kg N ha−1 at planting; (2) 56 kg N ha−1 at planting + 112 kg N ha−1 at sidedress; (3) 112 kg N ha−1 at planting + 56 kg N ha−1 at sidedress; and (4) 168 kg N ha−1 at sidedress along with a zero-N control as check plot. Corn yield was higher in 2018 than 2019 reflecting more timely precipitation in that year. In 2018, grain yield declined by 12.6% following the wheat cover crop compared to no cover crop control, indicating a yield penalty when corn was preceded with a wheat cover crop. In 2018, a year with timely and sufficient rainfall, there were no yield differences among N treatments and N balances were near zero. In 2019, delaying the N application improved NUE and corn grain yield due to excessive rainfall early in the season reflecting on N losses which was confirmed by lower N balances in sidedressed treatments. Overall, our findings suggest including N credit for cereals in MRTN prediction model could help with improved N management in the Midwestern United States.

1. Introduction

Corn is a major agricultural crop in Illinois, with a total planted area around 4.2 million hectares in 2018, and an estimated economic value of $7.4 billion in 2017 that represented a 43.5% of the total market value of agricultural products in that year [1]. Nitrogen is the most limiting nutrient in most crops [2,3,4,5,6,7], including corn and N management decisions are often difficult due to uncertain weather conditions [8].
Illinois uses maximum return to N (MRTN) decision support system to determine the corn N requirement [9]. The MRTN for Illinois is developed based on data from 69 site-years for corn–corn rotation and 65 site-years for soybean–corn rotation mainly when no cover crop was present. Therefore, the MRTN N predictions for corn are often accurate when no cover crop is planted prior to corn. Studies to look at N recommendation following cover crops are not as abundant as no cover crop N trials, and, thus, it is important to evaluate the effect of cover crops, especially non-leguminous species, on corn yield and it’s N requirement.
Illinois among other North Central states including Indiana, Iowa, Ohio, and Wisconsin, is evaluating management practices to reduce N losses to the Upper Mississippi River Basin (UMRB) [10], and, based on Nutrient Loss Reduction Strategy (Illinois NLRS, 2017), winter cereal cover crops are the best on-farm practices to reduce N loss in corn–corn or corn–soybean (Glycine max L.) cropping systems [11]. Therefore, planting winter cereal cover crops has been encouraged to effectively reduce nitrate-N in the tile drainage. Planting a winter cereal cover crop before corn could decrease corn yield as a result of reduced N availability in spring due to N immobilization caused by high C:N ratio of cover crop residue [12,13] or soil moisture depletion by the winter cereal early in the spring [14]. There have been studies on cover crop N release potentially happening simultaneously with cash crop N demand, but results have shown a decrease in cash crop N uptake [15,16,17]. Finney et al. [18] observed a linear reduction in soil mineralized N availability and cash crop yields which originated from an increase cover crop biomass N uptake and cover crop C:N ratio.
The literature suggests corn N need increases or corn yield potential decreases when rye (Secale cereal L.) is planted prior to corn. For example, Pantoja et al. [19] found corn grain yield following winter cereal rye was significantly lower relative to no cereal rye-corn and a significantly greater N fertilizer rate was required to achieve agronomic maximum yield [19]. Similarly, Crandall et al. [20] and Sawyer et al. [21] found lower corn yield when corn was planted following winter cereal rye. In Iowa, Sawyer et al. applied starter N as urea in a 5 cm × 5 cm band at a rate of 34 kg N ha−1 [21]. They observed an average grain yield improvement of 0.2 Mg ha−1 due to starter N for cereal rye plots, which was still significantly lower relative to the no cereal rye control.
Unlike cereal rye, studies on wheat as a cover crop prior to corn are scant in Illinois. Wheat is a low-cost and versatile cover crop and growers are often familiar with wheat management. In a preliminary study, Weidhuner et al. [22] reported wheat can uptake as much as 25 kg N ha−1 when terminated early in April in Southern Illinois. However, the C:N ratio of wheat aboveground biomass was >27 indicating potential for N immobilization during the decomposition process, which concurs with corn fast-growing stage. This could result in corn yield penalty similar to what usually happens after cereal rye cover crop. A general anecdote is that, if N fertilizer is applied early at planting, it could eliminate N immobilization and thus ensure corn N needs are met and minimize the likelihood of yield penalty. Therefore, our objective was to evaluate whether split N application to corn changes corn NUE in no-cover crop compared to following an early terminated wheat cover crop.

2. Materials and Methods

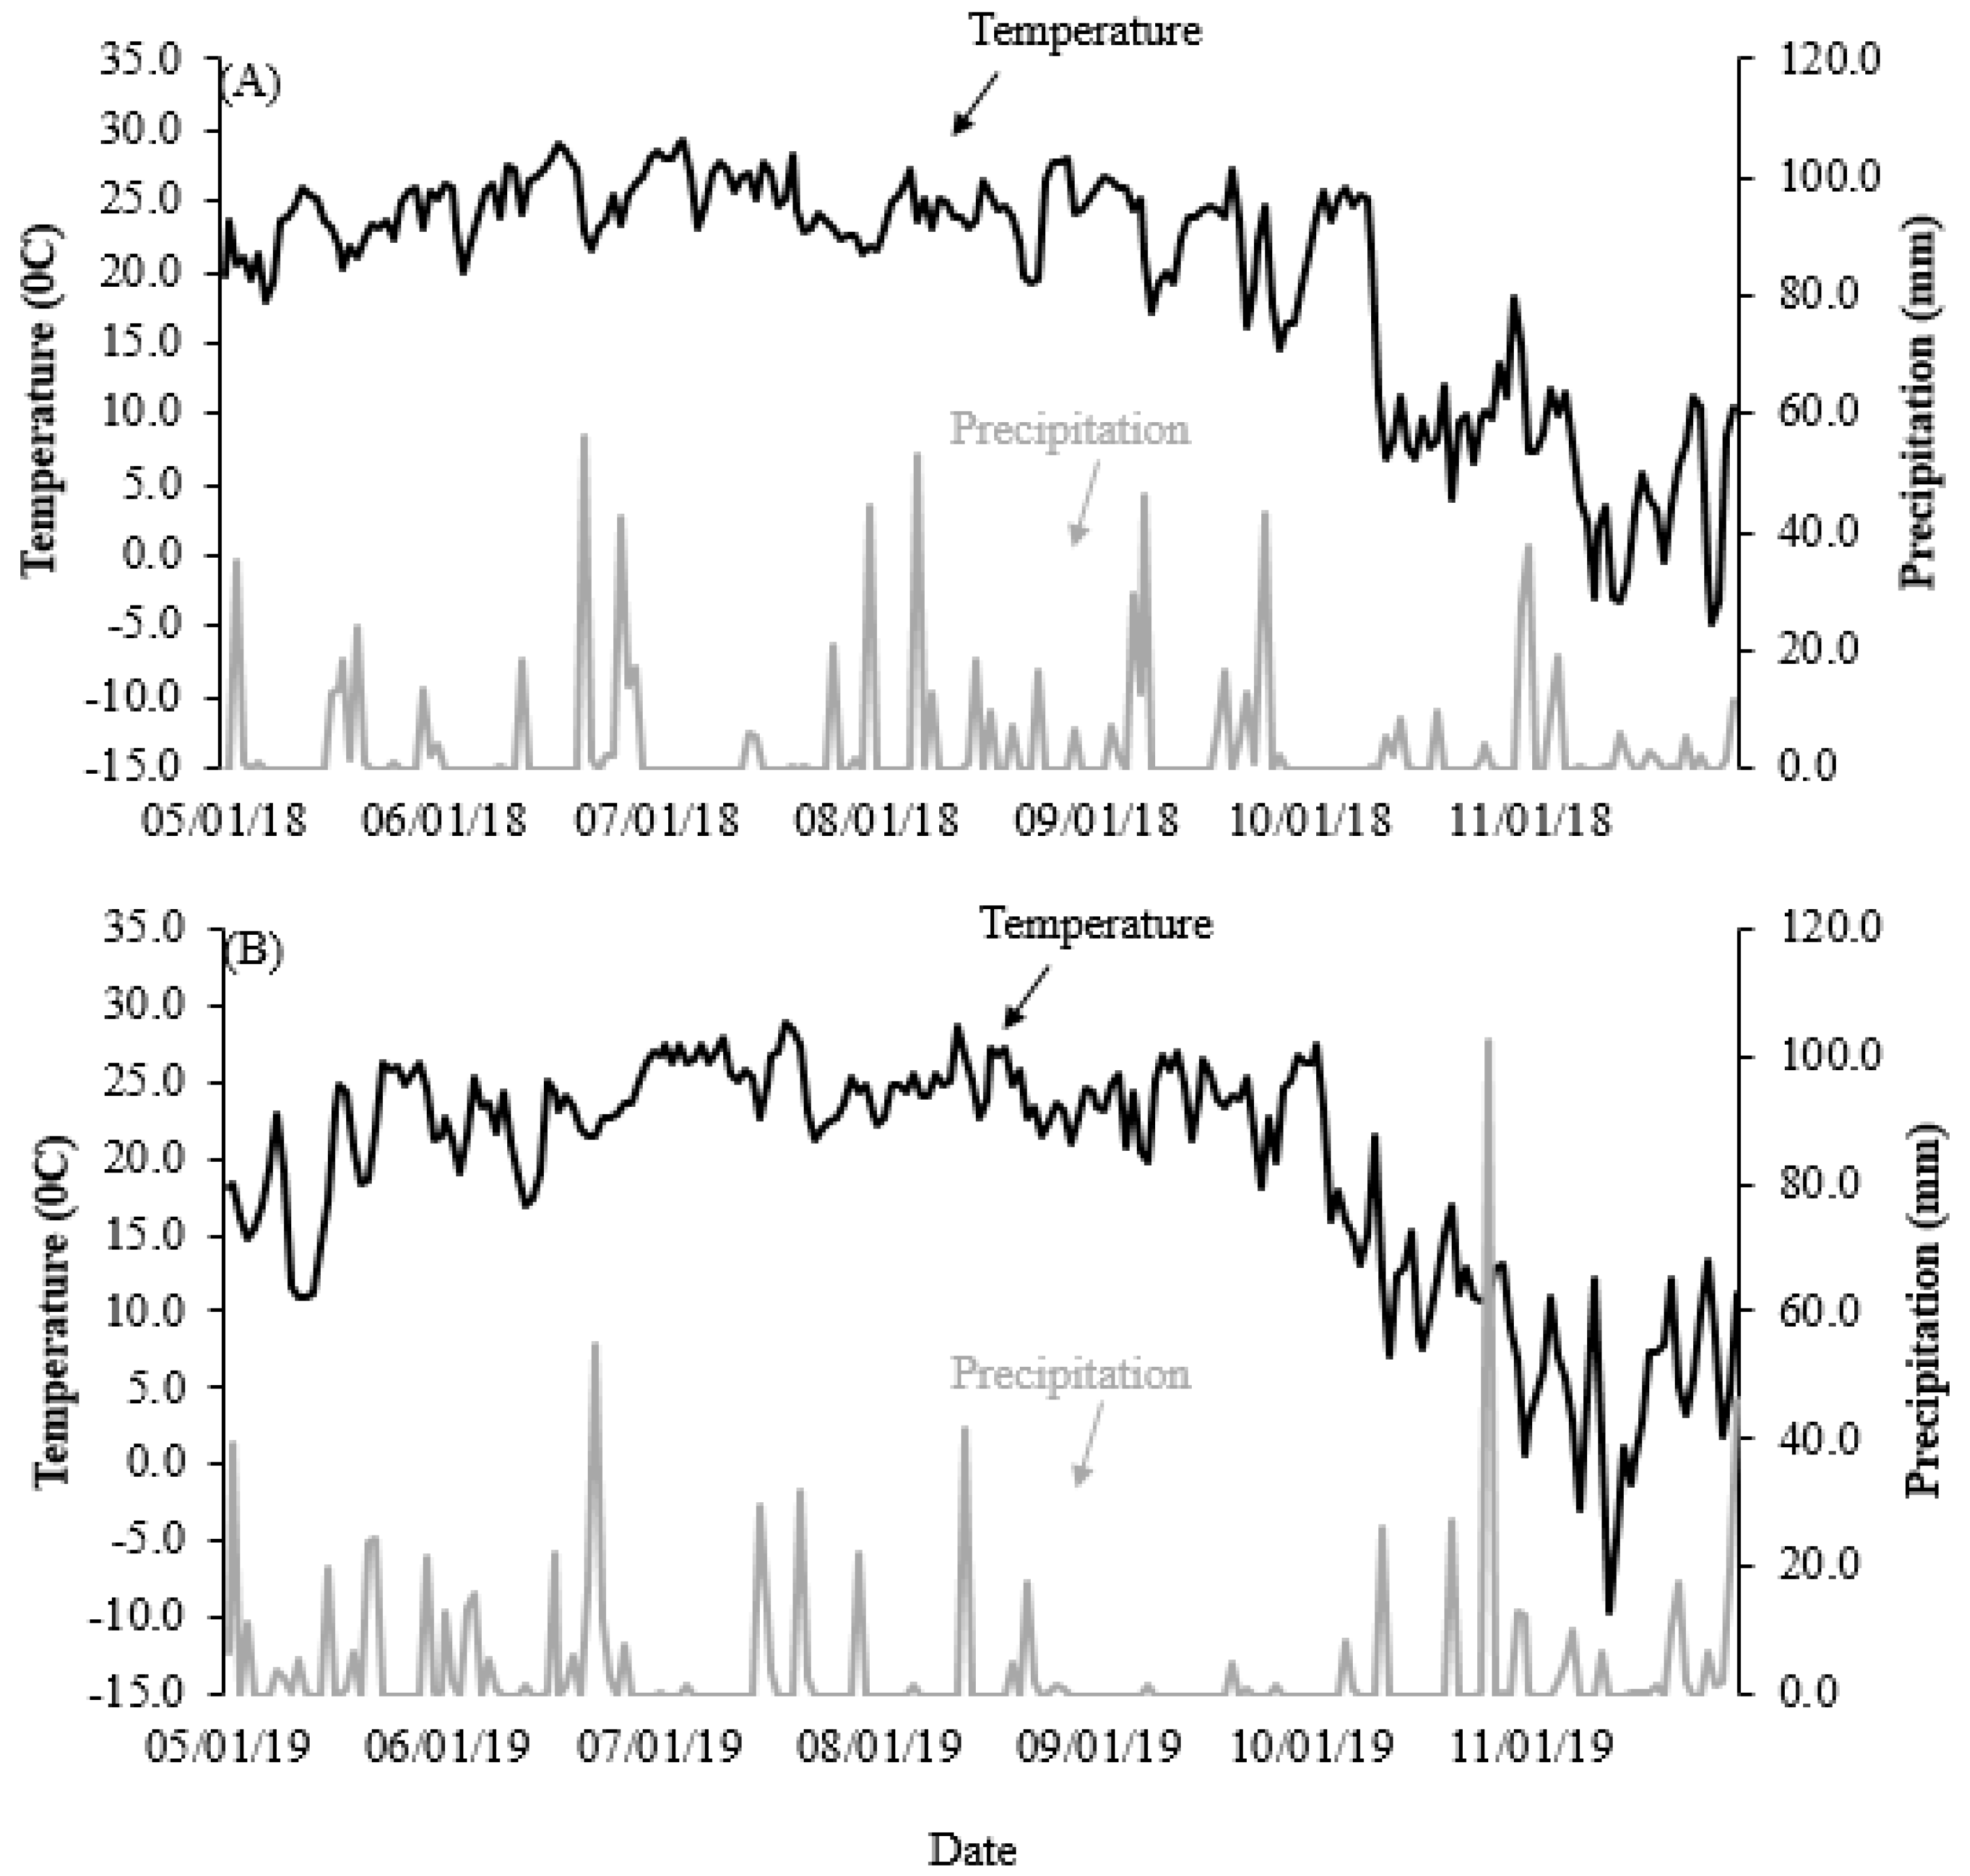
2.1. Experimental Site and Weather Conditions

A field trial was conducted at the Agronomy Research Center in Carbondale, IL (37.75° N, 89.06° W) during 2017–2018 and 2018–2019 growing seasons. From this point forward, to simplify presenting our results, 2017–2018 is referred to 2018 and 2018–2019 is referred to 2019. In 2018, soil was classified as Weir silt loam (fine, smectitic, mesic Typic Endoaqualfs) with 0–2% slopes. Initial pH (1:1 w/v) was 6.3, organic matter content was 15 g kg−1, and Bray-1 extractable P and Mehlich-3 extractable K content were 44 and 96 mg kg−1, respectively (0–20 cm depth) [23,24]. In 2019, the soil was classified as Stoy silt loam (fine-silty, mixed, superactive, mesic Fragiaquic Hapludalfs) with 0–5% slopes. Initial pH (1:1 w/v) was 7.0, organic matter content was 22 g kg−1, and Bray-1 extractable P and Mehlich-3 extractable K content were 22 and 122 mg kg−1, respectively (0–20 cm depth).
Mean air temperature during the growing season (May–November) was 19.9 °C in 2018 and 19.2 °C in 2019, close to the 30-year average (19.4 °C) in Carbondale, IL (Figure 1A,B). The cumulative growing season precipitation (May–November) was 844.80 mm in 2018 and 852.42 mm in 2019, while the 30-year average precipitation during May–November amounted to 718.82 mm. These data indicate that both 2018 and 2019 were wetter than the 30-year average and that differences from year-to-year were mainly due to temporal distribution rather than total precipitation. There were extreme monthly precipitation differences between the two years. May and June 2019 had a combined 63.25 mm more precipitation than the same period in 2018. Precipitation in May 2018 was close to 30-year average but lower than 2019, indicating more suitable growing conditions for timely corn planting and corn establishment in 2018 than 2019. A higher amount of precipitation during May and June also indicates possible N losses after planting and before sidedressing N in 2019.

2.2. Experimental Design and Treatments

The experiment was conducted as a randomized complete block design with split plot arrangement and four replicates. The main plots were two cover crop treatments: no cover crop (control) and a cover crop (wheat) terminated four weeks (at stem elongation stage) prior to corn planting and the subplots were five N timing applied to the subsequent corn. All N treatments received a total amount of 168 kg N ha−1 at a various combination of preplant and post-plant sidedress as: (1) 168 kg N ha−1 applied at planting; (2) 56 kg N ha−1 applied at planting plus 112 kg N ha−1 applied at sidedress; (3) 112 kg N ha−1 applied at planting plus 56 kg N ha−1 applied at sidedress timing; and (4) 168 kg N ha−1 applied at sidedress timing. A zero-N control treatment was also included in the study forming 10 treatments in total. All plots (with and without cover crop) received a flat rate of 34 kg N ha−1 in the fall at the time of cover crop planting (total N applied to wheat and corn was 202 kg N ha−1) as starter fertilizer. Starter N fertilizer is not included in the nutrient removal, balances, and other calculations.

2.3. Cultural Management Practices

2.3.1. Wheat Establishment

Wheat (cv. “Agrimaxx 446”) was planted with a John Deere 450 series grain drill (John Deere, Moline, IL, USA) on 26 October 2017 and 15 November 2018 at a rate of 3,953,000 seeds ha−1. Wheat cover crop was herbicide terminated on 27 April 2018 and 23 April 2019 using glyphosate (1.05 a.i. ha−1). Cover crop residue was rolled using a Frontier CP1172L cultipacker (John Deere, Moline, IL, USA) to facilitate planting. The previous crop was corn each year.

2.3.2. Corn Planting and Management

Plots were 10 m long and 3.3 m wide. A no-till drill was used to plant corn (Dekalb “DKC64-35RIB”) at 74,100 seeds ha−1 on 25 May 2018 and 24 May 2019. Preplant N was applied at planting in the form of liquid urea ammonium nitrate (28-0-0 N-P2O5-K2O). The sidedress N was applied at corn V5 stage (18 June 2018 and 1 July 2019) using liquid urea ammonium nitrate (28-0-0 N-P2O5-K2O). Later sidedress timing in 2019 reflects the challenging year with excessive rainfall in 2019. A custom-built four-row liquid applicator with Yetter No-till Coulters and knives was used to either apply N at planting or to sidedress N. Weed management was performed following the recommendations by Illinois Agronomy Handbook (http://extension.cropsciences.illinois.edu/handbook/pdfs/chapter02.pdf).

2.4. Data Collection

2.4.1. Wheat Sampling

Tissue samples were collected four weeks before corn planting date on 20 April 2018 and 23 April 2019 when wheat plants were at the stem elongation stage (Feekes 7) [25]. At the time of sampling, 0.6 m2 (3 frames of 0.2 m2) per plot were harvested with grass shears (GS model 700; Black and Decker Inc., Towson, MD, USA) at the ground surface [22]. Samples were then dried at 60 °C until constant dry weight. The oven-dried samples were then ground to 0.6 mm particle size and analyzed for N and C content using dry combustion (Flash 2000 Elemental Analyzer, Thermo Scientific, Cambridge, UK).

2.4.2. Corn Sampling

The corn was machine-harvested [8-XP Plot Combine (Kincaid, Haven, KS, USA)] on 13 November 2018 and 10 October 2019 when corn was physiologically matured. Prior to harvest, the number of plants in each plot was counted to determine plant population. A grain subsample was taken from each plot for quality analysis. Grain samples were dried in a 60 °C forced-air oven for 48 h, ground to pass a 1-mm screen, and analyzed for total N using wet chemistry method [26]. Crude protein concentration was calculated by multiplying N concentration by 6.25. Nitrogen removal by stalks and leaves was estimated at 45% of the grain N removal [27]. Sum of N content in grain and N content in stalks was used for N use metrics calculations.

2.5. Nitrogen Balance and N Use Metrics

Nitrogen balance for each treatment was calculated by subtracting N removed by grain harvesting (kg grain yield ha−1 × % N in the grain) from N applied for each fertilizer treatment in each year [28]. Since corn stover remained in the field, N content of corn stover was not included in N removal calculation.
The partial factor productivity (PFP) was determined by dividing total DM yield (kg ha−1) by the total kg of N applied per ha [29].
Apparent N recovery (ANR; %) was determined for each N treatment as 100 times the difference in N uptake for the N treatment minus N uptake when no N was applied, divided by the N application [30,31].
The NUE (kg DM kg−1 N) was determined as (kg DM at Nx - kg DM at N0)/kg of applied N where Nx = N rate > 0, and N0 = no N application [31].

2.6. Statistical Analysis

Data for corn grain yield, grain N concentration, N removal, N balance, and N use metrics were analyzed using Proc Mixed of SAS [32]. When the residuals were not normal, data were log10-transformed to fit the assumptions of the model. The fixed effect in the model was year, cover crops, and N treatments and block was a random effect. When the interaction of year × N treatment was significant, data are presented by year. When treatment effects were significant, mean separation was performed using least significant difference (LSD). The PDIFF option of LSMEANS in SAS was used for LSD (p ≤ 0.05) calculation.

3. Results and Discussion

3.1. Wheat Biomass and N Uptake

Wheat produced 1.6 Mg ha−1 biomass (dry matter basis) by the time of termination in 2018 which was four-fold higher than in 2019 reflecting: (i) earlier planting in 2018; and (ii) less favorable growing conditions in 2019. Nitrogen uptake by wheat cover crop in 2018 was 24 kg N ha−1, which was more than three-fold higher than 2019. This indicates the importance of timely planting of wheat to establish and perform well in spring.

3.2. Corn Grain Yield and N Concentration

Grain yield was influenced by year, cover crop, N application, and year × N application (Table 1). Mean grain yield was notably greater in 2018 (11.0 Mg ha−1) than in 2019 (5.9 Mg ha−1), reflecting the effect of precipitation on year-to-year yield variation (Table 2). While 2018 received even and timely precipitation, 2019 was the wettest year in past few decades in Carbondale, IL contributing to substantial N loss and thus lower grain yields. According to data reported in USDA National Agricultural Statistical Services [1], corn grain yields in 2018 were above Jackson county average (10.9 Mg ha−1) and lower than state-wide yields in Illinois (14.1 Mg ha−1) but in 2019 were lower than average corn grain yields in both Jackson county (10 Mg ha−1) and state of Illinois averages (12.1 Mg ha−1) [1]. Averaged over the two years and N treatments, corn grain yield was higher after a no-cover crop control (8.7 Mg ha−1) than after wheat cover crop (7.6 Mg ha−1), indicating a 12.6% yield decline following wheat cover crop due to possible N immobilization caused by high C:N ratio of wheat residue [22]. In addition, maximum corn grain yield in cover crop treatment was 14% lower compared to the maximum yield in no cover crop control confirming that N immobilization could most likely have caused yield reduction. Other possible explanations could be lower soil temperatures under wheat cover crop residue that can slow corn emergence [33] or allelopathic effects inhibiting germination [34]. Similar to our results, Ruffati et al. [17] reported inclusion of rye cover crop reduced corn grain yield by 7% within the spring dominated N application system compared to a no-cover crop control [17]. In 2018, a year with timely precipitation, there were no corn yield differences among N application treatments and corn yields were 43% higher in N applied (12.1 Mg ha−1) vs. no-N plots (6.9 Mg ha−1) (Table 2). In 2019, an extremely wet year, corn grain yield increased by delaying N application from planting to sidedress timing indicating that later application of N possibly decreased N losses (leaching or nitrous oxide emissions) in heavy soils of southern Illinois (Table 2). This highlights the importance of timely application of N fertilizer to meet corn N demands after the V4 stage. These results are in line with findings of Scharf et al. [35], indicating N addition at sidedressing or later in the season did not reduce corn yield potential when no cover crop was present but also suggests that N management decisions should be tailored when a winter cereal crop is planted prior to corn.
Corn grain N concentration was affected by year, N application, and year × N application (Table 1). In 2018, corn N concentration was similar among all N treatments except for no-N control (Table 2). In 2019, sidedressing N at 168 kg N ha−1 increased N concentration compared to zero-N control, application of 168 kg N ha−1 at planting, and split application of 112 kg N ha−1 at planting plus 56 kg N ha−1 at sidedress timing indicating a delayed N application increased corn N concentration in an extremely wet growing season (Table 2). Generally, splitting N application could increase N concentration over full N application at planting [36] but this seems to be more effective in wet growing seasons [35,37].

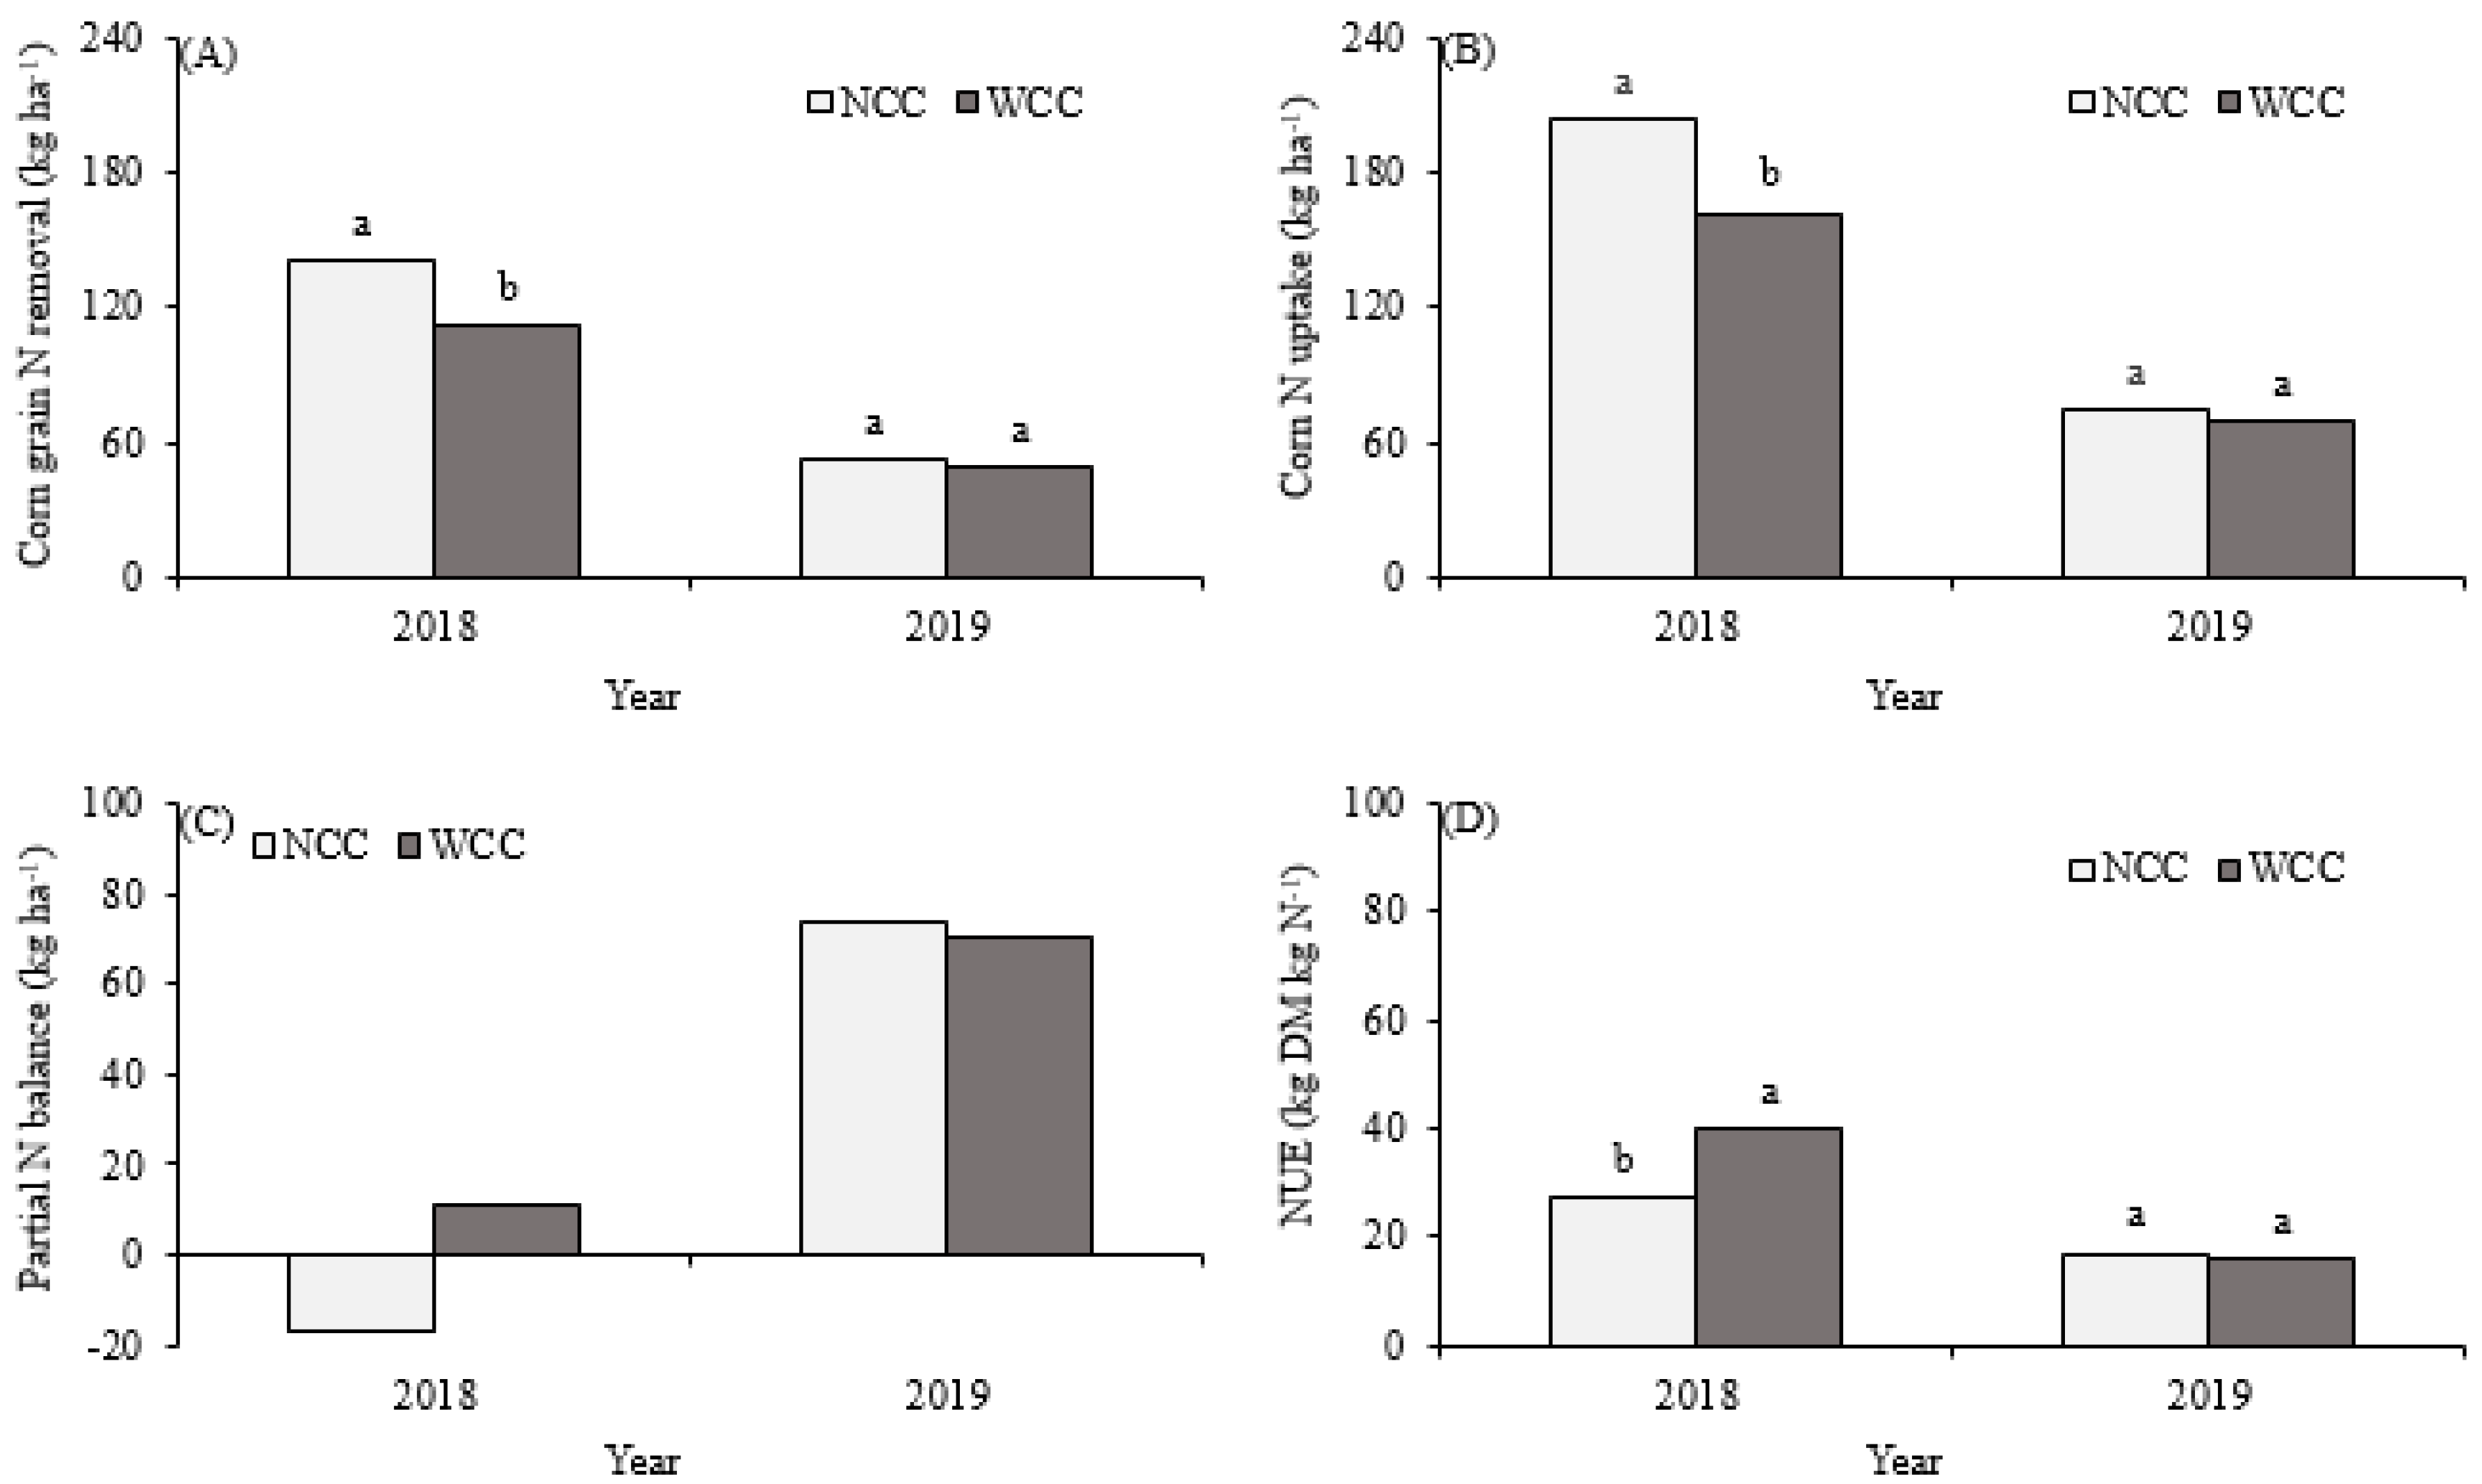
3.3. Corn N Removal, Uptake, and Balance

Corn N removal and uptake were influenced by year, cover crop, year × cover crop, N application, and year × N application (Table 1). Mean N removal (126 kg N ha−1) and uptake (183 kg N ha−1) was greater in 2018 than N removal (52 kg N ha−1) and N uptake (75 kg N ha−1) in 2019 due to much lower biomass and grain produced in that year. Excluding the zero-N control, N removal was 140 kg N ha−1 and N uptake was 203 kg N ha−1 in 2018 vs. 57 and 83 kg N ha−1 N removal and uptake in 2019, respectively. In 2018, N removal by corn after wheat cover crop was 20% lower compared to the control treatment without cover crop (Figure 2A,B). In 2019, N removal and uptake were similar between the two cover crop treatments (Figure 2A,B). This indicates that, in the year with a favorable condition (2018), corn had decent growth and required N. Thus, wheat presence, using some of the available N, in addition to N immobilization resulted in a significant difference between no cover crop and cover crop treatments. In 2019, a wet growing season impacted corn growth resulting in lower N removal. While, in 2018, N removal and uptake were similar among all N treatments (excluding the zero-N control), in 2019, sidedressing N at 168 kg N ha−1 increased N removal compared to zero-N control, application of 168 kg N ha−1 at planting, and split application of 112 kg N ha−1 at planting plus 56 kg N ha−1 at sidedress timing indicating a delayed N application increased corn concentration removal in an extremely wet growing season (Table 2). There were significant relationships between corn grain yield and N removal (R2 = 0.98) and corn grain N concentration and N removal (R2 = 0.9) (data not shown).
Nitrogen balance was affected by year, cover crop, year × cover crop, N application, and year × N application (Table 1). Nitrogen balance was −17 kg ha−1 in no cover crop and zero-N treatments, indicating substantial N removal from soil by corn plants (Figure 2C). Excluding the zero-N control, N balance was 3.0 kg ha−1 in no cover crop control and 29.8 kg ha−1 in wheat cover crop, suggesting more N was needed when wheat was the preceding cover crop to corn compared to no cover crop control.
In 2018, N balance was negative for zero-N control (−72 kg N ha−1), indicating apparent N limitation. All N application treatments had slightly positive N balance (15 kg N ha−1; average of N treatments) with no difference among the N treatments. In 2019, N balance was lower in all sidedress treatments followed by split application of 56 kg N ha−1 at planting plus 112 kg N ha−1 at sidedress timing, indicating lower yield, and possibly greater N loss with early N application timing in a year with a historically wet spring season. Earlier studies have also indicated increased risk of N deficiency in corn in years with high leaching potential [8,38,39]. Our results emphasize N timing is more crucial in wet years and less critical in years with favorable and timely rainfall pattern.

3.4. Nitrogen Use Metrics

Partial factor productivity was influenced by year, cover crop, N application, and year × N application (Table 1). The PFP was higher in 2018 than 2019 reflecting greater yield per kg N applied in that year. Wheat cover crop resulted in 8% reduction in PFP compared to control (55 vs. 60, respectively) reflecting some yield drag in corn following wheat cover crop. In 2018, PFP was similar among all N treatments (Table 2). In 2019, by delaying the N application, PFP increased from 25 (168 kg N ha−1 at planting) to 47 (168 kg N ha−1 at sidedressing) indicating a reduced risk of N loss through leaching or denitrification highlighting benefits of sidedressing in synchronizing availability of soil N with corn demand. Walsh et al. [36] reported improved NUE and corn grain yield with sidedressing N than N application at planting reflecting increased risk of N losses in a wet growing season [40]. A research in northern New York also showed that timing and rate of N fertilizer application strongly influenced N-leaching losses in wet years [41]. Apparent N fertilizer recovery was only influenced by year. The ANFR was greater in 2018 (62%) than in 2019 (18%), reflecting greater N uptake and utilization in a year with suitable rainfall pattern.
Nitrogen use efficiency was affected by year, cover crop, year × cover crop, and year × N application (Table 1). The NUE was higher in 2018 than 2019 in line with PFP, slight positive N balances, and overall greater yield in that year. In 2018, NUE was higher for the wheat cover crop treatment than a no cover crop control indicating much higher corn yield in zero-N control when no cover crop was planted (Figure 2D) and confirms our hypothesis that wheat cover crop lowered corn yield potential when N was limited and the effect of N immobilization by cover crop residue was magnified [22]. In 2019, there were no differences between the two cover crops indicating in a historically wet season, cover crop could save NO3-N with less impact on corn yield potential due to already reduced corn yields by weather extreme conditions. Interaction of year × N application was marginally significant (p < 0.058) mainly due to NUE differences in 2019. The NUE was 30 (kg grain yield kg N−1) when at least 112 kg N ha−1 was sidedressed compared to full rate N application at planting (4 kg grain yield kg N−1).

4. Conclusions

Our results indicate weather conditions, especially temporal distribution and amount of rainfall, impact the effectiveness of split N application. In 2018, a year with timely and sufficient rainfall, there were no differences among N treatments except for zero-N control. In a historically wet growing season, delaying N addition improved NUE and corn grain yield indicating N losses were substantial early in the season and that later N fertilization allows for better utilization of applied N. Wheat cover crop effect on corn N requirement was also weather dependent. In 2018, wheat decreased corn yield potential possibly due to N immobilization, which indicates a need for revisiting corn N rate recommendations and fine-tuning N application timing following wheat cover crop. Cover crop management practices such as earlier termination or skipping the corn row and thus minimizing the intersection of wheat root with corn could possibly reduce corn yield penalty. In 2019, due to excessive rainfall, corn yields were lower than average and cover crop effects on corn yield were not detectable. Overall, these findings suggest N management decisions must be re-visited for current N management guidelines in the Midwest and MRTN requires a separate set of data to incorporate cover crops into its prediction model. Regional cover crop N decomposition studies and estimating N mobilization or immobilization by cover crops and including these options could improve MRTN decision support tool.

Author Contributions

Conceptualization, A.S.; methodology, O.A. R.K.-A, and A.S.; formal analysis, Y.L. and A.S.; resources, A.S.; data curation, O.A., Y.L., and A.S.; and writing, R.K.-A., E.J., M.L.B., O.A., Y.L., and A.S. All authors have read and agreed to the published version of the manuscript.

Funding

This study was supported by Illinois Nutrient Research and Education Council and Southern Illinois University Vice Chancellor of Research. We would like to thank Southern Illinois University Environmental Resource Policy (ERP) PhD Program for supporting Oladapo Adeyemi’s education.

Acknowledgments

The authors have great appreciation for Randy Lange, Pawan Kumar, Amanda Weidhuner, and Chris Vick for assisting with conducting the trial.

Conflicts of Interest

The authors declare no conflict of interest.

References

  1. USDA-NASS. United States Department of Agriculture, National Agricultural Statistics Service. Available online: https://www.nass.usda.gov/Statistics_by_State/Illinois/index.php (accessed on 29 May 2020).
  2. Guo, J.; Jia, Y.; Chen, H.; Zhang, L.; Yang, J.; Zhang, J.; Hu, X.; Ye, X.; Li, Y.; Zhou, Y. Growth, photosynthesis, and nutrient uptake in wheat are affected by differences in nitrogen levels and forms and potassium supply. Sci. Rep. 2019, 9, 1248. [Google Scholar] [CrossRef] [PubMed] [Green Version]
  3. Guignard, M.S.; Leitch, A.R.; Acquisti, C.; Eizaguirre, C.; Elser, J.J.; Hessen, D.O.; Jeyasingh, P.D.; Neiman, M.; Richardson, A.E.; Soltis, P.S.; et al. Impacts of Nitrogen and Phosphorus: From Genomes to Natural Ecosystems and Agriculture. Front. Ecol. Evol. 2017, 5, 70. [Google Scholar] [CrossRef] [Green Version]
  4. Cassman, K.G.; Dobermann, A.; Walters, D.T. Agroecosystems, Nitrogen-use Efficiency, and Nitrogen Management. AMBIO 2002, 31, 132–140. [Google Scholar] [CrossRef] [PubMed]
  5. Smil, V. Nitrogen and Food Production: Proteins for Human Diets. AMBIO 2002, 31, 126–131. [Google Scholar] [CrossRef] [PubMed]
  6. Kumar, S.; Lai, L.; Kumar, P.; Feliciano, Y.M.V.; Battaglia, M.L.; Hong, C.O.; Owens, V.N.; Fike, J.; Farris, R.; Galbraith, J. Impacts of nitrogen rate and landscape position on soils and switchgrass root growth parameters. Agron. J. 2019, 111, 1046–1059. [Google Scholar] [CrossRef]
  7. Kumar, P.; Lai, L.; Battaglia, M.L.; Kumar, S.; Owens, V.; Fike, J.; Galbraith, J.; Hong, C.O.; Faris, R.; Crawford, R.; et al. Impacts of nitrogen fertilization rate and landscape position on select soil properties in switchgrass field at four sites in the USA. Catena 2019, 180, 183–193. [Google Scholar] [CrossRef]
  8. Sadeghpour, A.; Ketterings, Q.M.; Godwin, G.S.; Czymmek, K.J.; Vermeylen, F. Agro-Environmental Consequences of Shifting from Nitrogen- to Phosphorus-Based Manure Management of Corn. Soil Sci. Soc. Am. J. 2017, 81, 1127–1138. [Google Scholar] [CrossRef] [Green Version]
  9. Sawyer, J.; Nafziger, E.; Randall, G.; Bundy, L.; Rehm, G.; Joern, B. Concepts and Rationale for Regional Nitrogen Rate Guidelines for Corn; Iowa State University-University Extension: Ames, IA, USA, 2015. Available online: http://publications.iowa.gov/3847/1/PM2015.pdf (accessed on 29 May 2020).
  10. Lacey, C.; Nevins, C.; Camberato, J.; Kladviko, E.; Sadeghpour, A.; Armstrong, S. Carbon and nitrogen release from cover crop residues and implications for cropping systems management. J. Soil Water Conserv. 2020. [Google Scholar] [CrossRef]
  11. Illinois Nutrient Loss Reduction Strategy. Available online: https://www2.illinois.gov/epa/Documents/iepa/water-quality/watershed-management/excess-nutrients/NLRS-Biennial-Report/NLRS%20Biennial%20Report.pdf (accessed on 29 May 2020).
  12. Jahanzad, E.; Barker, A.; Hashemi, M.; Eaton, T.; Sadeghpour, A.; Weis, S. Nitrogen release dynamics and decomposition of buried and surface cover crop residues. Agron. J. 2016, 108, 1735–1741. [Google Scholar] [CrossRef]
  13. Singh, G.; Dhakal, M.; Yang, L.; Kaur, G.; Williard, K.; Schoonover, J.E.; Sadeghopur, A. Decomposition and Nitrogen Release of Cereal Rye and Hairy Vetch in Conventional and No-tillage Systems. Agron. J. 2020. [Google Scholar] [CrossRef]
  14. Reed, H.K.; Karsten, H.D.; Curran, W.S.; Tooker, J.F.; Duiker, S.W. Planting Green Effects on Corn and Soybean Production. Agron. J. 2019, 111, 2314. [Google Scholar] [CrossRef] [Green Version]
  15. Bakker, M.G.; Acharya, J.; Moorman, T.B.; Robertson, A.E.; Kaspar, T.C. The potential for cereal rye cover crops to host corn seedling pathogens. Phytopathology 2016, 106, 591–601. [Google Scholar] [CrossRef] [PubMed] [Green Version]
  16. Roth, R.T.; Ruffatti, M.D.; O’Rourke, P.D.; Armstrong, S.D. A cost analysis approach to valuing cover crop environmental and nitrogen cycling benefits: A central Illinois on farm case study. Agric. Syst. 2018, 159, 69–77. [Google Scholar] [CrossRef]
  17. Ruffatti, M.D.; Roth, R.T.; Lacey, C.G.; Armstrong, S.D. Impacts of nitrogen application timing and cover crop inclusion on subsurface drainage water quality. Agric. Water Manag. 2019, 211, 81–88. [Google Scholar] [CrossRef]
  18. Finney, D.; White, C.; Kaye, J. Biomass production and carbon/nitrogen ratio influence ecosystem services from cover crop mixtures. Agron. J. 2016, 108, 39–52. [Google Scholar] [CrossRef] [Green Version]
  19. Pantoja, J.L.; Woli, K.P.; Sawyer, J.E.; Barker, D.W. Corn nitrogen fertilization requirement and corn–soybean productivity with a rye cover crop. Soil Sci. Soc. Am. J. 2015, 79, 1482–1495. [Google Scholar] [CrossRef] [Green Version]
  20. Crandall, S.; Ruffo, M.; Borello, G. Cropping system and nitrogen dynamics under a cereal winter cover crop preceding corn. Plant Soil 2005, 268, 209–219. [Google Scholar] [CrossRef]
  21. Sawyer, J.E.; Swetabh, P.; Lundvall, J.P. Enhancing corn yield in a rye cover cropping system. Agron. Rep. 2016, 3. Available online: https://lib.dr.iastate.edu/agron_reports/3 (accessed on 29 May 2020).
  22. Weidhuner, A.; Afshar, R.K.; Luo, Y.; Battaglia, M.; Sadeghpour, A. Particle size affects carbon and nitrogen estimate of a wheat cover crop. Agron. J. 2019, 111, 3398–3402. [Google Scholar] [CrossRef]
  23. Bray, R.H.; Kurtz, L.T. Determination of total, organic and available forms of phosphorus in soils. Soil Sci. 1945, 59, 39–46. [Google Scholar] [CrossRef]
  24. Mehlich, A. Mehlich III soil test extractant: A modification of soils. Soil Sci. 1984, 15, 1409–1416. [Google Scholar]
  25. Large, E.C. Growth stages in cereals. Illustration of the Feekes Scale. Plant Pathol. 1954, 3, 128–129. [Google Scholar] [CrossRef]
  26. Association of Official Analytical Chemists (AOAC). AOAC 941.04: Urea and ammoniacal nitrogen in animal feed. In AOAC, Official Methods of Analysis of the Association of Official Analytical Chemists, 17th ed.; AOAC: Rockville, MD, USA, 2000. [Google Scholar]
  27. Otte, B.; Mirsky, S.; Schomberg, H.; Davis, B.; Tully, K. Effect of Cover Crop Termination Timing on Pools and Fluxes of Inorganic Nitrogen in No-Till Corn. Agron. J. 2019, 111, 2832–2842. [Google Scholar] [CrossRef]
  28. Sadeghpour, A.; Ketterings, Q.M.; Godwin, G.S.; Czymmek, K.J. Under- or Over-Application of Nitrogen Impact Corn Yield, Quality, Soil, and Environment. Agron. J. 2017, 109, 343–353. [Google Scholar] [CrossRef]
  29. Cassman, K.; Gines, G.; Dizon, M.; Samson, M.; Alcantara, J. Nitrogen-use efficiency in tropical lowland rice systems: Contributions from indigenous and applied nitrogen. Field Crops Res. 1996, 47, 1–12. [Google Scholar] [CrossRef]
  30. Zemenchik, R.; Albrecht, K. Nitrogen use efficiency and apparent nitrogen recovery of Kentucky bluegrass, smooth bromegrass, and orchardgrass. Agron. J. 2002, 94, 421–428. [Google Scholar] [CrossRef]
  31. Ketterings, Q.M.; Cherney, J.H.; Godwin, G.; Kilcer, T.E.; Barney, P.; Beer, S. Nitrogen management of brown midrib sorghum x sudangrass in the northeastern USA. Agron. J. 2007, 99, 1345–1351. [Google Scholar] [CrossRef] [Green Version]
  32. Littell, R.C.; Milliken, G.A.; Stroup, W.W.; Wolfinger, R.D. SAS System for Mixed Models; SAS Institute, Inc.: Cary, NC, USA, 1996. [Google Scholar]
  33. Kaspar, T.; Erbach, D.; Cruse, R. Corn Response to Seed-Row Residue Removal. Soil Sci. Soc. Am. J. 1990, 54, 1112–1117. [Google Scholar] [CrossRef]
  34. Kravchenko, A.G.; Thelen, K.D. Effect of winter wheat crop residue on no-till corn growth and development. Agron. J. 2007, 99, 549–555. [Google Scholar] [CrossRef]
  35. Scharf, P.C.; Wiebold, W.J.; Lory, J.A. Corn yield response to nitrogen fertilizer timing and deficiency level. Agron. J. 2002, 94, 435–441. [Google Scholar] [CrossRef]
  36. Abbasi, M.K.; Mahmood Tahir, M.; Sadiq, A.; Iqbal, M.; Zafar, M. Yield and Nitrogen Use Efficiency of Rainfed Maize Response to Splitting and Nitrogen Rates in Kashmir, Pakistan. Agron. J. 2012, 104, 448–457. [Google Scholar] [CrossRef]
  37. Sadeghpour, A.; Ketterings, Q.M.; Vermeylen, F.; Godwin, G.S.; Czymmek, K.J. Soil Properties under Nitrogen-vs. Phosphorus-Based Manure and Compost Management of Corn. Soil Sci. Soc. Am. J. 2016, 80, 1272–1282. [Google Scholar] [CrossRef] [Green Version]
  38. Andraski, T.W.; Bundy, L.G.; Brye, K.R. Crop management and corn nitrogen rate effects on nitrate leaching. J. Environ. Qual. 2000, 29, 1095–1103. [Google Scholar] [CrossRef]
  39. Andraski, T.W.; Bundy, L.G. Cover crop effects on corn yield response to nitrogen on an irrigated sandy soil. Agron. J. 2005, 97, 1239–1244. [Google Scholar] [CrossRef]
  40. Walsh, O.; Raun, W.; Klatt, A.; Solie, J. Effect of delayed nitrogen fertilization on maize (Zea mays L.) grain yields and nitrogen use efficiency. J. Plant. Nutr. 2012, 35, 538–555. [Google Scholar] [CrossRef] [Green Version]
  41. Van Es, H.M.; Czymmek, K.J.; Ketterings, Q.M. Management effects on nitrogen leaching and guidelines for a nitrogen leaching index in New York. J. Soil Water Conserv. 2002, 57, 499–504. [Google Scholar]
Figure 1. Average air temperature and cumulative monthly precipitation during corn growing season in 2018 (A) and 2019 (B) in Carbondale, Illinois.
Agronomy 10 01081 g001
Figure 2. Corn grain nitrogen (N) removal (A); uptake (B); partial N balance (C); and N use efficiency (D) as affected by wheat cover crop (WCC) and no cover crop (NCC) treatments in 2018 and 2019 growing seasons. Different letters indicate significant difference at p ≤ 0.05.
Agronomy 10 01081 g002
Table 1. Effect (p-values) of year, cover crop, and nitrogen rate on corn grain yield, N concentration, N balance, N uptake, N removal, partial factor productivity (PFP), apparent N fertilizer recovery (ANFR), and N use efficiency (NUE).
Grain YieldN Conc. N BalanceN UptakeN RemovalPFPAFNRNUE
Year (Yr)<0.0001<0.0001<0.0001<0.0001<0.0001<0.0001<0.0001<0.0001
Cover crop (CC)0.00060.14180.00010.00010.00010.00410.25900.0596
Yr × CC0.05940.26100.00160.00130.00160.30130.66640.0320
Nitrogen (N)<0.00010.0192<0.0001<0.0001<0.00010.00080.14810.0892
Yr × N<0.00010.0389<0.0001<0.0001<0.00010.00030.21230.0580
CC × N0.22910.17470.83340.82860.83340.15680.63970.6009
Yr × CC × N0.52370.67210.61860.60310.61860.96290.92000.9452
N conc., N concentration.
Table 2. Corn grain yield and nitrogen (N) concentration, N balance and removal, partial factor productivity (PFP), and N use efficiency (NUE) as affected by different N rates in 2018 and 2019 growing seasons.
Grain YieldGrain N ConcentrationN BalanceN UptakeN RemovalPFPNUE
N Treatments (Mg ha−1)(g kg−1)(kg ha−1)kg Grain Increase kg N−1kg Grain kg N−1
2018N06.9 b10.52 b−72.7 b105.4 b72.0 b
N100U50S12.6 a11.47 a10.9 a210.4 a145.1 a80.6 a30.0 a
N150S12.2 a11.64 a14.6 a205.1 a141.4 a77.9 a29.0 a
N150U12.1 a11.36 a18.4 a199.6 a137.6 a77.5 a28.5 a
N50U100S11.6 a11.73 a19.5 a197.9 a136.5 a74.4 a25.0 a
2019N03.2 c10.10 a−32.5 c47.0 b32.5 b
N100U50S5.7 b9.49 a109.4 a67.5 b46.6 b36.4 b15.8 b
N150S7.2 a10.26 a81.9 b107.4 a74.1 a46.5 a25.5 a
N150U3.8 c9.50 a121.0 a50.8 b35.0 b24.1 c3.6 c
N50U100S6.8 a,b10.60 a83.7 b104.8 a72.3 a43.5 a,b24.2 a
Numbers within columns followed by different letters indicate significant difference at p ≤ 0.05. N0, zero-N control; N168U, 168 kg N ha−1 applied at planting; N112U56S, 112 kg N ha−1 applied at planting plus 56 kg N ha−1 applied at sidedress timing; N56U112S, 56 kg N ha−1 applied at planting plus 112 kg N ha−1 applied at sidedress; N168S, 168 kg N ha−1 applied at sidedress timing.

