Article

Identification of QTL for Tolerance to Flooding Stress at Seedling Stage of Soybean (Glycine max L. Merr.)

1
Upland Crop Breeding Research Division, Department of Southern Area Crop Science, National Institute of Crop Science, Rural Development Administration, Miryang 50424, Korea
2
Gene Engineering Division, Department of Agricultural Biotechnology, National Institute of Agricultural Sciences, Rural Development Administration, Jeonju 54874, Korea
*
Author to whom correspondence should be addressed.
Submission received: 11 March 2021 / Revised: 18 April 2021 / Accepted: 30 April 2021 / Published: 5 May 2021
(This article belongs to the Section Crop Breeding and Genetics)

Abstract

:
Flooding stress is a serious problem in soybean production, causing a remarkable yield reduction. The onset of rainy season during the early growth of soybean in Korea and some other parts of the world potentially subjects soybean plants to flooding stress. The objective of this study was to map quantitative trait loci (QTL) for flooding tolerance using a recombinant inbred line (RIL) population derived from a cross between ‘Danbaekkong’ (flood-tolerant) and ‘NTS1116′ (flood-susceptible) cultivars grown in a plastic house for two years. The plants were flood-stressed at the V1-V2 stage by ponding about 10 cm water from the soil surface. Leaf chlorophyll content and shoot dry weight were measured under control and flooded conditions to map the QTL. The genetic map was constructed using 1689 polymorphic markers obtained from the 180K Axiom® SoyaSNP markers used for genotyping the population. Ten QTL with 3.39–5.14 logarithm of odds scores and 8.1–30.7% phenotypic variations (PVE) were identified on seven chromosomes. One QTL on chromosomes 6 and 15 and two QTL on chromosome 7 were detected at least in two different environments causing up to 30.7% PVE, suggesting their potential applications in the breeding of flood-tolerant soybeans. The results could be useful in further exploring the genetic basis of flooding tolerance and developing tolerant cultivars of soybean.

1. Introduction

Increments in the production of major crops like wheat, corn, rice, and soybean are important for global food security. However, the yields of many crops are negatively affected by various factors including climate change, which is supposed to aggravate several biotic and abiotic stresses, like flooding [1,2]. Various efforts, including the development of tolerant cultivars, have been made to increase the yield of soybean by minimizing the negative effects of those stresses [3,4,5]. Flooding stress accounts for a significant yield reduction in soybean [6,7] because soybean plants are sensitive to flooding stress at different stages, such as germination [8,9] and early vegetative as well as reproductive stages [10,11]. The coincidence of heavy rainfalls during the early growth stages makes the soybean plants liable to flooding stress in lowland, upland, as well as paddy fields under poor drainage conditions. In particular, the cultivation of upland crops in paddy fields is more challenging in some countries such as Korea and Japan [12,13]. The poorly drainable nature of paddy soils renders the soybean plants additionally prone to flooding stress. Hence, the development of flood-tolerant soybeans could be of great importance to increase soybean yields under flooding stress conditions.
Flooding makes the soil environment hypoxic and the existence of prolonged flooding results in anoxic condition, retarding plant growth and development due to insufficient oxygen supply [14]. The retarded growth and development under the little or no oxygen environments is principally associated with the reduced ability of plants to metabolize nitrogen [15,16]. Although legume crops, like soybean, are capable of fixing atmospheric nitrogen into the soil, they require a sufficient amount of oxygen to accomplish such fixation, which is retarded under hypoxia and anoxia conditions [17]. The little or no oxygen conditions not only lower the nitrogen fixation but also reduce nitrogen uptake [18,19]. Additionally, a shortage of oxygen limits adenosine triphosphate synthesis, which upon conversion to adenosine diphosphate generates the energy required for plant growth and development [20]. The reduction in oxygen concentration under flooded conditions may result in elevated carbon dioxide concentration, creating a toxic soil environment [21,22]. The prevalence of a low-oxygen environment is far less detrimental than the carbon dioxide toxicity, which causes chlorosis, retards root growth, and may lead to the death of soybean plants [21].
The tolerance to flooding stress is a complex quantitative trait that is regulated by multiple genes, and is also greatly influenced by environmental conditions [23,24]. Identification of the genetic regions accounting for quantitative trait variations is useful to understand the genetic make-up of a trait and subsequently to improve the desired trait through marker-assisted selection (MAS). A few genetic mapping studies for flooding tolerance in soybean have been carried out [25,26,27,28]. Most of the studies are based on indirect measurements of phenotypic traits like yield variation or visual differences in the plant injury levels resulted from flooding stress [11,12,25,26,27,28]. However, selection and accurate measurements of appropriate traits are crucial to precisely identifying quantitative trait loci (QTL) for stress tolerance [29,30]. Leaf chlorophyll content (CC) and shoot dry weight (DW) are among the traits that are highly influenced by flooding stress [25,31,32]. The CC, DW, and/or their index values have been considered for identifying the flood-tolerant QTL in soybean [33,34] as well as in other crops like common bean [35], wheat [36,37,38], and barley [39]. A similar study for identifying flooding tolerance-related QTL was conducted by Dhungana et al. [34] using a common parent “NTS1116” that was also used in the present study. It is worthwhile to contrast and compare the results of these studies because the results of QTL may be influenced by genetic background and/or environment [40,41]. Therefore, additional QTL information from comparable genetic backgrounds could be more useful in the flooding tolerance-related soybean breeding programs. The objective of this study was to identify QTL for flooding stress tolerance at the seedling stage of soybean using a recombinant inbred line (RIL) population.

2. Materials and Methods

2.1. Plant Materials

A RIL population was developed through the single seed descent method using ‘Danbaekkong’ (female parent) and ‘NTS1116’ (male parent) cultivars. The population consisting of 152 lines (F6:7 and F7:8) was used to map the QTL for flooding tolerance. The parents for developing the RIL population were selected based on a previous report [42], in which 192 soybean germplasms were screened for flooding tolerance and found that ‘Danbaekkong’ was a tolerant and ‘NTS1116’ was a susceptible cultivar. Furthermore, ‘Danbaekkong’ and the other flood-tolerant parent ‘Paldalkong’ that was used in a previous study [34] are among the elite soybean cultivar and parental line, respectively, in Korea [43]. Additionally, ‘Danbaekkong’ is resistant to bacterial leaf pustule [44] and ‘Paldalkong’ is resistant against soybean mosaic virus [45].

2.2. Phenotyping

The parents and RILs were grown in a plastic house under ambient temperature and light conditions in 2017 and 2018. In June of 2017, seeds were sown in stainless steel containers of 2 × 1 × 0.6 m dimensions at the 5-cm spacing between rows and plants. Since the soil temperature in stainless steel and plastic containers (1.58 × 1.13 × 0.6 m) was not significantly different, both types of containers were used to grow plants in 2018. The possible undetectable variation in soil environments between the metal and plastic containers was further reduced by growing the same genotypes in the same type of containers under both flood-stressed and control conditions. The plant spacing was increased in 2018 to keep 10 cm from row to row and 7.5 cm from plant to plant, and seeds were sown in May. In both years, the containers were filled with the soil mixture composed of equal proportions of soil, sand, and compost. Plants were grown under normal conditions until the V1–V2, and then the stress-designated plants were exposed to flooding for 14 d by holding about 10 cm water from the soil surface. On the other hand, the control-designated plants were allowed to grow under normal conditions throughout the experiment period. In 2017, a single plant was considered as one replication; however, in 2018, an average value of the adjacently grown three plants of the same genotype was taken as one replication. In both years, plants were grown in a complete randomized design with three replications under both control and flood-stressed conditions.
The CC and DW data collected from the plants grown under the control and flooded conditions were considered to map the QTL. A chlorophyll meter (SPAD-502Plus, Minolta Camera Co., Osaka, Japan), which is widely considered for the determination of greenness of plant leaves, was used to measure the CC of soybean plants. The CC was measured on the middle leaflet of second and third trifoliate leaves at 12 and 13 days after flooding (DAF), respectively. In order to minimize the possible variation in CC due to soil plant analysis development (SPAD) reading, the two values obtained from two different leaves of each plant were averaged. For the DW measurement, plants were harvested at 14 DAF. Above-ground portions of the plants were kept into paper bags and oven-dried (60 °C) to constant weight. In addition to the CC and DW, their index values (CCI and DWI, respectively) were also calculated and included in the QTL analysis. The CCI and DWI were separately calculated as the ratio of their values (average of three replications) under flood-stressed to control conditions. Flooding tolerance index (FTI) was calculated as the mean value of CCI and DWI and was also considered for the QTL analysis.

2.3. DNA Extraction and Genotyping

For genomic DNA extraction, parents and RILs were grown in trays until the V2 stage and trifoliate leaves from 3–4 plants of each genotype were bulk harvested and stored at −80 °C. About ~100 mg of the bulked leaves were ground in 2-mL tubes using a bead beater (TissueLyser II, Qiagen, Hilden, Germany). The powdered leaves were utilized to extract DNA using a kit (ExgeneTM Plant SV Miniprep Kit, GeneAll, Seoul, Korea) following the manufacturer’s instructions. The DNA was eluted with 50 μL Buffer AE supplied in the kit. The parents and 152 RILs were genotyped using 180K Axiom® SoyaSNP array [46].

2.4. Data Analysis

Analysis of variation (ANOVA), construction of frequency distribution of the RIL population, and correlation analysis were done using SAS9.4 (SAS Institute Inc., Cary, NC, USA). Broad-sense heritability (H2) was calculated using an equation described earlier [47] with some modifications.
H2 = σ2G/(σ2G + σ2GY/Y + σ2GE/E + σ2YGE/YE + σ2e/YEr),
where E, G, Y, and r denote the number of environments, genotypes, year, and replications, respectively. Similarly, σ2G, σ2GY, σ2GE, σ2YGE and σ2e are the components of variance for genotype, genotype × environment, year × genotype × environment, and error, respectively.

2.5. Linkage Mapping and QTL Analysis

Only the markers that were polymorphic between two parents were selected from the 180K SNP. The polymorphic markers were further analyzed to find redundant markers. The redundant markers have identical segregation patterns and cluster at the same genetic position while constructing a linkage map and thus cannot provide an additional contribution to a genetic study [48]. Therefore, the redundant markers were separated using the Bin function in IciMapping [49] before a map construction. The criteria for removing the redundant markers using the Bin function were set as the significant segregation distortion of p < 0.001 and missing data with >10%. After removing the redundant markers, a linkage map was constructed using the Map function of IciMapping following the manufacturer’s instructions. The parameters for the Map function were adjusted as grouping by 3.0 logarithm of odds (LOD) threshold, ordering by nnTwoOpt and rippling by the sum of adjacent recombination fractions.
The QTL for flooding tolerance were identified using composite interval mapping (CIM) in QTL Cartographer V2.5 (available at http://statgen.ncsu.edu/qtlcart/, accessed on 6 February 2020) following the manufacturer’s instructions with adjusted parameters: Model 6, forward and backward regression, walk speed of 1.0 cM, and putative QTL with a window size of 10 cM. The number of control markers was 5, which was a default parameter. The LOD threshold for each trait was determined using a 1000 permutation test at p < 0.05. After the completion of the analysis, the QTL information was extracted by adjusting a minimum of 20 cM between QTL and 2-LOD support interval. The QTL were named following the method applied in an earlier report [34].

2.6. Screening of Candidate Genes

Candidate genes residing within the QTL regions were searched using SoyBase (www.soybase.org, accessed on 2 May 2021) and Phytozome (www.phytozome.net, accessed on 2 May 2021). Since chromosomes 3 and 7 harbored more than one QTL with at least one of >10% phenotypic variation (PVE), the candidate genes were searched in the QTL regions of these two chromosomes. The genes were searched based on their functions related to stress response, chlorophyll content, photosynthesis, and/or plant growth. The Glyma 1.1 gene version was used to collect the gene information.

3. Results

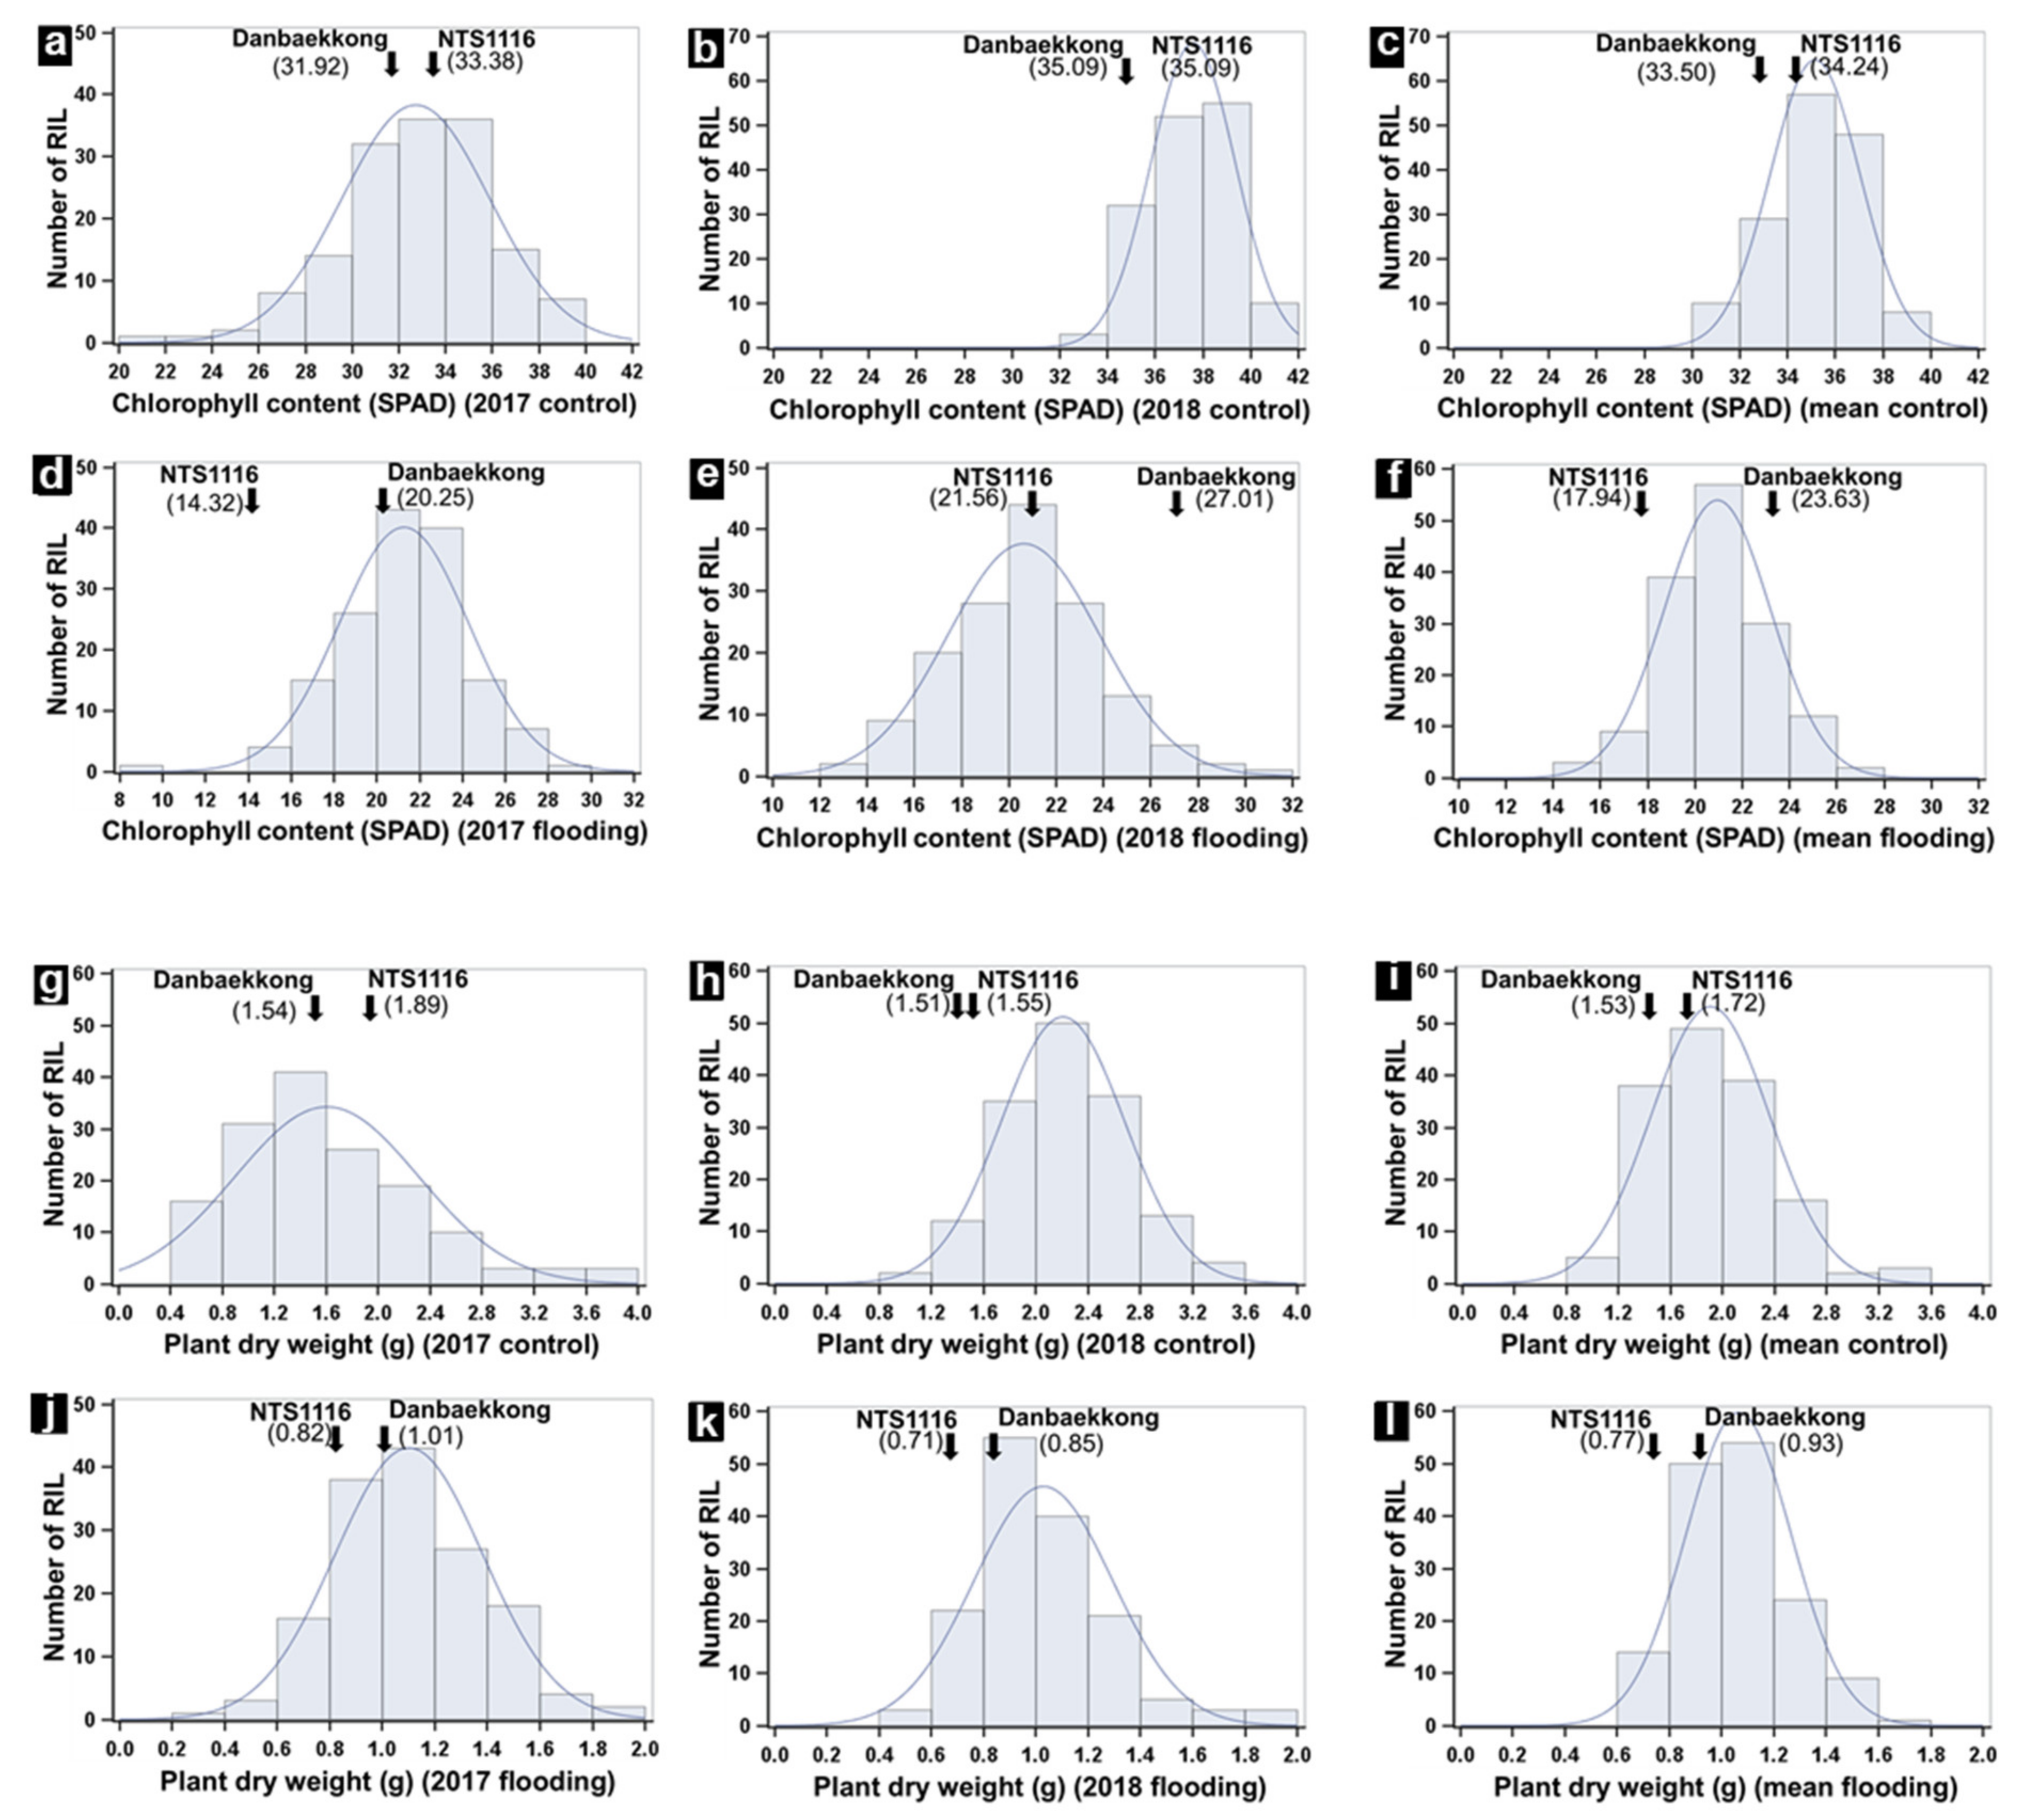
3.1. Phenotypic Variation and Correlation between Traits

The CC of parents and RILs were higher in 2018 than that in 2017 under the control as well as flooded conditions; however, the DW were higher in 2017 (Table 1). Under the control condition, the CC of ‘NTS1116’ (33.38) was higher than that of ‘Danbaekkong’ (31.92) in 2017 but both parents have the same value in 2018. Under the flooded treatment, ‘NTS1116’ (14.32 and 21.56) had lower CC than that of ‘Danbaekkong’ (20.25 and 27.01) in 2017 and 2018, respectively. The DW of the susceptible parent (‘NTS1116’) was higher in the control but lower in flooded conditions than that of the tolerant parent (‘Danbaekkong’) in both years.
The values of CCI, DWI, and FTI for ‘Danbaekkong’ were higher than those for ‘NTS1116’ in both years (Table 2). The CCI, DWI, and FTI values of RILs were higher in 2017 (0.66, 0.79, and 0.72) than in 2018 (0.55, 0.47, and 0.51), respectively.
The broad-sense heritability (H2) was calculated on a line-mean basis and found to be almost equal for both traits, CC (68.35%) and DW (68.42%) (Table 1). The variations in CC and DW among RILs over two years showed continuous distribution with transgressive segregation (Figure 1). The ANOVA for CC and DW under flooding treatment indicated that both traits were significantly (p < 0.05) different among RILs, over two years (except for year-wise effect on CC), and their interactions (Supplementary Table S1).
Significant positive correlations were found between CC and DW under the control (0.42) and flooded (0.16) conditions in 2017. The correlation between the two traits in 2018 was significant, regardless of whether it was positive (0.17) under the control or negative (−0.26) under the flooded condition.

3.2. Linkage Mapping

A total of 22,587 (12.52%) SNP markers were found polymorphic between the parents, among the 180,375 markers genotyped. The polymorphic markers were subjected to Bin function to remove the redundant markers (Supplementary Table S2), and thus 1689 SNPs remained for constructing linkage maps of 20 chromosomes (Supplementary Figure S1). The cumulative length of linkage maps was 4293.98 cM with an average of 2.54 cM between the markers. The longest (392.82 cM) and shortest (88.16 cM) linkage groups were formed by chromosomes 4 and 16, respectively.

3.3. QTL Analysis under Flooding and Index (CCI, DWI, and FTI)

Ten QTL for flooding tolerance were identified which were distributed on seven chromosomes (Supplementary Figure S2; Table 3). The QTL identified in different environments at the same, overlapping or adjacent markers were reported as the same QTL. They showed ranges of 3.39 to 5.14 LOD scores and 8.1 to 30.7% PVE.
Five QTL were found for CC on four chromosomes under flooding and CCI with the ranges of 3.51 to 4.70 LOD and 8.2 to 10.6% PVE. The QTL qSFT_4-17 and qSFT_15-67 identified under flooding condition in 2017 and 2018 showed the lowest (3.51) and highest (4.70) LOD scores, respectively.
A total of four QTL for DW, distributed on three chromosomes, were detected under flooding and DWI. The QTL qSFT_7-3 and qSFT_3-64 identified under DWI in 2017 and 2018 showed the highest (25.6%) and lowest (8.3%) PVE, respectively. The QTL qSFT_6-86 flanked by the markers AX-90332834 and AX-90380396 was detected under DWI and FTI in 2017. Similarly, QTL qSFT_7-3 was identified under DWI and FTI in 2017 as well as mean DWI.

3.4. Screening of Candidate Genes in the QTL Hotspots

The genomic site harboring a relatively large number of QTL within a region of a chromosome was considered as a QTL hot spot. Chromosomes 3 and 7 contained at least two major QTL (>10% PVE), and thus were chose to search the candidate genes. The functional annotation of the genes, resided in the QTL hot spots, is related to stress response, chlorophyll biosynthesis, and growth-regulating factor (Supplementary Table S3).

4. Discussion

Flooding stress negatively affects chlorophyll content and reduces biomass accumulation and seed yield in soybean [32,50]. Development of flooding tolerant soybean cultivars could be of great significance to minimize yield loss, for which the collection of information on genetic basis of flooding tolerance through QTL analysis would be highly useful.
The H2 for CC and DW might have been influenced by the significant interaction of RIL × year, indicating substantial effects of the environment on CC and DW. The difference in air temperatures between two years might have played a role for the significant RIL × year interaction. Heritability can change over time because of the change in genetic variance due to environmental factors that may affect the interaction between genes and the environment [51]. The mean monthly temperature in 2017 (32.2 °C) was higher than that in 2018 (28.7 °C) during the plant growing period. The higher CC in 2018 was possibly owing to the lower temperatures [52]. The inconsistent correlations observed between CC and DW under control and flooded conditions over two years was also reflected in higher DW value of RILs under the control but lower value under flooding stress in 2018 than in 2017. Similar results were observed in our previous study where RILs of mapping population with different genetic background were phenotyped for flooding tolerance in an early growth stage [34].
Distribution of the RIL population for CC and DW values showed a continuous variation in the traits with transgressive segregation, which could be utilized to select RILs having extreme phenotypes. Based on the mean FTI value of two years, 41 and 10 RILs showed positive and negative transgressive segregation, respectively (Supplementary Table S4). Furthermore, the transgressive segregation obtained in the present study may provide novel soybean lines that could be exploited in flooding tolerance breeding programs [34,53]. Differences in CCI, DWI, and FTI between two parents and wide ranges of the values in the RIL population in both years depicted an appropriateness of the population in mapping QTL for flooding tolerance. An adoption of quantitative phenotyping method instead of visual observations to measure the flooding tolerance could increase the reliability of the QTL results.
Five QTL identified in this study overlapped the chromosomal locations or mapped in the vicinity of candidate genes and/or QTL associated with tolerance to abiotic stresses, including flooding. A major QTL qSFT_7-3 (up to 30.7% PVE) co-localized with a previously reported QTL for flooding tolerance in soybean [54]. These major QTL cover several candidate genes (DEAD-box ATP-dependent RNA helicase 31, WRKY transcription factor 55, Dof domain, zinc finger protein, and B-box zinc finger protein) associated with abiotic stress in different plants, including soybean [55,56,57,58,59,60]. Reports show that some genes respond to multiple abiotic stresses, for example VlWRKY3 gene promotes salt and drought stress tolerance during the germination, seedling, and the mature plant stages of transgenic Arabidopsis thaliana [61] core abiotic stress-responsive genes enhance drought, waterlogging, and osmotic stresses tolerance in sesame [62], and the DGK gene family responds under polyethylene glycol, salt, alkali, and salt/alkali treatments in soybean [63]. Candidate genes Glyma03g34900, Glyma03g35010, and Glyma03g35180 related to stress and/or growth-regulating factor are found in the QTL qSFT_3-64. The QTL on chromosome 7 harbor several candidate genes associated with root and shoot growth factor, chlorophyll fluorescence, stress response, light-harvesting, and chlorophyll a/b binding protein (Supplementary Table S3), indicating their roles in CC and DW of soybean plants. The QTL qSFT_7-3 was also found to cover the chromosomal location of SNP markers (causing up to 5.7% PVE) associated with flooding tolerance at an early reproductive stage in soybean [54]. A QTL causing up to 10.9% PVE for flooding yield index in soybean [11] was found within the QTL qSFT_13-53. Few stress tolerance-related candidate genes like Glyma13g27120, Glyma13g27410, and Glyma13g29760 also reside in the QTL regions of chromosome 13. A candidate gene Glyma15g10750 encoding for methionine sulfoxide reductase was found within QTL qSFT_15-67, implying its role in flooding tolerance. The methionine sulfoxide reductase is responsive to abiotic stresses in soybean [64,65,66].
QTL qSFT_7-3 identified in the QTL hot spots, overlapped the physical positions of the QTL detected in previous studies. In addition, two SNPs (AX-90363591 and AX-90445362) on chromosome 13 that were linked with flooding tolerance QTL [34] were also found to be linked with the QTL in this study (Supplementary Figure S3). Furthermore, an RNA-sequencing report [67] revealed that a few abiotic stress-related genes xyloglucan endotransglucosylase/hydrolase (LOC100799976), polygalacturonase (GLYMA_07G066900), calmodulin-binding protein (GLYMA_07G008400), soybean NAC gene (GLYMA_07G050600), DEAD-box RNA helicase gene (GLYMA_07G056600), and dehydration-responsive element-binding (GLYMA_07G017300), which were upregulated in the tolerant parent ‘Danbaekkong’ and downregulated in the susceptible parent ‘NTS1116’, reside in the QTL hot spots on chromosome 7. This RNA-sequencing report also supports the reliability of the QTL identified in the present study. The co-localization of flooding tolerance-related QTL identified in the present and previous studies, conducted at the same and/or different stages of soybean growth using diverse genetic background, indicated that the QTL could be of practical application and be utilized in improving the flooding tolerance of soybean cultivars. Although some of the QTL identified in this study physically located in or near the QTL or candidate genes for flooding tolerance, many of them were not consistently identified over different environments possibly because of the involvement of several biochemical mechanisms in abiotic stress tolerance [68] and influence of growing environment [69]. Moreover, several genes of different metabolic pathways like SnRK1A [70], N-end-rule [71,72], and glycolytic [73] are reported to interact for flooding tolerance.

5. Conclusions

A total of 10 QTL for flooding tolerance were identified on seven chromosomes. Some QTL were found to overlap while others to reside in the vicinity of some stress-related QTL and/or candidate genes reported earlier. At least one QTL on chromosomes 6 and 7 were identified in more than one environment. Since the abiotic stress tolerance in plants is a complicated and multi-dimensional phenomenon, analysis of the QTL for flooding tolerance by using the derived phenotypic data (such as CCI, DWI, and FTI) might be as equally useful as the data obtained from direct measurements (for example, CC and DW). This study is applicable in understanding the genetic basis of flooding tolerance and in utilizing the QTL in breeding programs. Research is under way to analyze the expression of candidate genes residing in the QTL hot spots, using flooding stress tolerant and susceptible RILs grown under control and flooded conditions. The QTL could be transferred into soybean genotypes of interest to enhance their flooding tolerance by adopting MAS technology. The application of this study may even increase in the context of climate change and potential consequences of increased flood events.

Supplementary Materials

The following are available online at https://0-www-mdpi-com.brum.beds.ac.uk/article/10.3390/agronomy11050908/s1, Figure S1: Genetic linkage maps of 20 chromosomes showing the total 1689 SNPs used to identify the QTL for flooding tolerance in soybean. Distances of the loci (cM) are shown on the left and the name of SNPs are shown on the right side of each chromosome; Figure S2: WinQTL Cartographer plots showing the QTL identified on seven chromosomes (3, 4, 6, 7, 13, 15 and 16) by composite interval mapping with a minimum of 20 cM between QTL and 2-LOD-drop interval. The genetic position (cM) is shown on X-axis and LOD value is shown on Y-axis. The name of a chromosome is mentioned below the genetic position of chromosomes. The dotted areas pointed with green arrow indicate the QTL positions on chromosomes. The name, genetic position, and physical position of QTL are also shown next to the green arrow; Figure S3: WinQTL Cartographer plots showing LOD scores (Y-axis) and SNP markers (X-axis) linked to the QTL for flooding tolerance identified on chromosome 13. Two SNPs AX-90363591 and AX-90445362 were also identified to be linked with the QTL (Dhungana et al., 2020) detected in a recombinant inbred line population derived from ‘NTS1116’, one of the parents used in the present study as well; Table S1: Analysis of variance for chlorophyll content and shoot dry weight of recombinant inbred lines (RILs) under flooded condition in 2017 and 2018; Table S2: Redundant SNP markers removed by the Bin function of ICI mapping; Table S3: Candidate genes residing in the QTL hot spots on chromosomes 3 and 7;Table S4: List of RILs that showed positive and negative transgressive segregation based on the mean flooding tolerance index (FTI) of 2017 and 2018.

Author Contributions

Conceptualization, H.-S.K. and I.-Y.B.; Methodology, B.-K.K., J.-H.S., H.-T.K. and S.-O.S.; Validation, H.-S.K., I.-Y.B. and J.-H.O.; Formal analysis, S.K.D.; Investigation, H.-S.K. and S.K.D.; Resources, H.-S.K., B.-K.K., J.-H.S., H.-T.K. and S.-O.S.; Writing—original draft preparation, S.K.D.; Writing—review and editing, H.-S.K., I.-Y.B. and J.-H.O.; Supervision, H.-S.K. and I.-Y.B.; Project administration, H.-S.K.; Funding acquisition, H.-S.K. All authors have read and agreed to the published version of the manuscript.

Funding

This research was funded by the RURAL DEVELOPMENT ADMINISTRATION AGENDA PROJECT (grant number PJ01186801), Republic of Korea.

Institutional Review Board Statement

Not applicable.

Informed Consent Statement

Not applicable.

Data Availability Statement

The data generated in this study are included in this published article and its Supplementary Materials.

Conflicts of Interest

The authors declare no conflict of interest.

Abbreviations

QTL; quantitative trait loci, RIL; recombinant inbred line, PVE; phenotypic variations, MAS; marker-assisted selection, CC: leaf chlorophyll content, DW; shoot dry weight, SPAD; soil plant analysis development, CCI; leaf chlorophyll content index, DWI; shoot dry weight index, FTI; flooding tolerance index, ANOVA; analysis of variation, LOD; logarithm of odds, CIM; composite interval mapping.

References

  1. Najafi, E.; Devineni, N.; Khanbilvardi, R.M.; Kogan, F. Understanding the Changes in Global Crop Yields Through Changes in Climate and Technology. Earth’s Futur. 2018, 6, 410–427. [Google Scholar] [CrossRef]
  2. Bailey-Serres, J.; Fukao, T.; Gibbs, D.J.; Holdsworth, M.J.; Lee, S.C.; Licausi, F.; Perata, P.; Voesenek, L.A.C.J.; van Dongen, J.T. Making sense of low oxygen sensing. Trends Plant Sci. 2012, 17, 129–138. [Google Scholar] [CrossRef]
  3. Shanmugam, S.; Zhao, S.; Nandy, S.; Srivastava, V.; Khodakovskaya, M. Modification of soybean growth and abiotic stress tolerance by expression of truncated ERECTA protein from Arabidopsis thaliana. PLoS ONE 2020, 15, e0233383. [Google Scholar] [CrossRef]
  4. Qin, D.; Liu, X.-Y.; Miceli, C.; Zhang, Q.; Wang, P. Soybean plants expressing the Bacillus thuringiensis cry8-like gene show resistance to Holotrichia parallela. BMC Biotechnol. 2019, 19, 66. [Google Scholar] [CrossRef] [Green Version]
  5. Ramalingam, J.; Alagarasan, G.; Savitha, P.; Lydia, K.; Pothiraj, G.; Vijayakumar, E.; Sudhagar, R.; Singh, A.; Vedna, K.; Vanniarajan, C. Improved host-plant resistance to Phytophthora rot and powdery mildew in soybean (Glycine max (L.) Merr.). Sci. Rep. 2020, 10, 13928. [Google Scholar] [CrossRef] [PubMed]
  6. Valliyodan, B.; Van Toai, T.T.; Alves, J.D.; de Fátima, P.; Goulart, P.; Lee, J.D.; Fritschi, F.B.; Rahman, M.A.; Islam, R.; Shannon, J.G.; et al. Expression of Root-Related Transcription Factors Associated with Flooding Tolerance of Soybean (Glycine max). Int. J. Mol. Sci. 2014, 15, 17622–17643. [Google Scholar] [CrossRef] [PubMed] [Green Version]
  7. Ye, H.; Song, L.; Chen, H.; Valliyodan, B.; Cheng, P.; Ali, L.; Vuong, T.; Wu, C.; Orlowski, J.; Buckley, B.; et al. A major natural genetic variation associated with root system architecture and plasticity improves waterlogging tolerance and yield in soybean. Plant Cell Environ. 2018, 41, 2169–2182. [Google Scholar] [CrossRef]
  8. Hou, F.F.; Thseng, F.S. Studies on the flooding tolerance of soybean seed: Varietal differences. Euphytica 1991, 57, 169–173. [Google Scholar] [CrossRef]
  9. Wu, C.; Chen, P.; Hummer, W.; Zeng, A.; Klepadlo, M. Effect of Flood Stress on Soybean Seed Germination in the Field. Am. J. Plant Sci. 2017, 8, 53–68. [Google Scholar] [CrossRef] [Green Version]
  10. Linkemer, G.; Board, J.E.; Musgrave, M.E. Waterlogging Effects on Growth and Yield Components in Late-Planted Soybean. Crop. Sci. 1998, 38, 1576–1584. [Google Scholar] [CrossRef]
  11. Nguyen, V.T.; Vuong, T.D.; VanToai, T.; Lee, J.D.; Wu, X.; Mian, M.A.R.; Dorrance, A.E.; Shannon, J.G.; Nguyen, H.T. Mapping of Quantitative Trait Loci Associated with Resistance toPhytophthora sojaeand Flooding Tolerance in Soybean. Crop. Sci. 2012, 52, 2481–2493. [Google Scholar] [CrossRef]
  12. Githiri, S.M.; Watanabe, S.; Harada, K.; Takahashi, R. QTL analysis of flooding tolerance in soybean at an early vegetative growth stage. Plant Breed. 2006, 125, 613–618. [Google Scholar] [CrossRef]
  13. Kokubun, M. Genetic and cultural improvement of soybean for waterlogged conditions in Asia. Field Crop. Res. 2013, 152, 3–7. [Google Scholar] [CrossRef]
  14. Patil, P.K.; Singh, A.K.; Tripathi, N.; Yadav, D.; Hemantaranjan, A. Flooding: Abiotic Constraint Limiting Vegetable Productivity. Adv. Plants Agric. Res. 2014, 1, 96–103. [Google Scholar] [CrossRef] [Green Version]
  15. Henshaw, T.L.; Gilbert, R.A.; Scholberg, J.M.S.; Sinclair, T.R. Soya Bean (Glycine max L. Merr.) Genotype Response to Early-season Flooding: I. Root and Nodule Development. J. Agron. Crop. Sci. 2007, 193, 177–188. [Google Scholar] [CrossRef]
  16. Maekawa, T.; Shimamura, S.; Shimada, S. Effects of Short-Term Waterlogging on Soybean Nodule Nitrogen Fixation at Different Soil Reductions and Temperatures. Plant Prod. Sci. 2011, 14, 349–358. [Google Scholar] [CrossRef]
  17. Arrese-Igor, C.; Royuela, M.; Aparicio-Tejo, P.M. Responses of Nodulated Legumes to Oxygen Deficiency. In Interacting Stresses on Plants in a Changing Climate; Jackson, M.B., Black, C.R., Eds.; Springer: Berlin/Heidelberg, Germany, 1993; pp. 423–432. ISBN 978-3-642-78535-1. [Google Scholar]
  18. Oliveira, H.C.; Sodek, L. Effect of oxygen deficiency on nitrogen assimilation and amino acid metabolism of soybean root segments. Amino Acids 2013, 44, 743–755. [Google Scholar] [CrossRef]
  19. Oliveira, H.C.; Freschi, L.; Sodek, L. Nitrogen metabolism and translocation in soybean plants subjected to root oxygen deficiency. Plant Physiol. Biochem. 2013, 66, 141–149. [Google Scholar] [CrossRef]
  20. Limami, A.M.; Diab, H.; Lothier, J. Nitrogen metabolism in plants under low oxygen stress. Planta 2014, 239, 531–541. [Google Scholar] [CrossRef]
  21. Boru, G.; VanToai, T.; Alves, J.; Hua, D.; Knee, M. Responses of Soybean to Oxygen Deficiency and Elevated Root-zone Carbon Dioxide Concentration. Ann. Bot. 2003, 91, 447–453. [Google Scholar] [CrossRef] [PubMed]
  22. Araki, H. Water uptake of soybean (Glycine max L. Merr.) during exposure to O2 deficiency and field level CO2 concentration in the root zone. Field Crop. Res. 2006, 96, 98–105. [Google Scholar] [CrossRef]
  23. Chen, W.; Yao, Q.; Patil, G.B.; Agarwal, G.; Deshmukh, R.K.; Lin, L.; Wang, B.; Wang, Y.; Prince, S.J.; Song, L.; et al. Identification and Comparative Analysis of Differential Gene Expression in Soybean Leaf Tissue under Drought and Flooding Stress Revealed by RNA-Seq. Front. Plant Sci. 2016, 7, 1044. [Google Scholar] [CrossRef] [Green Version]
  24. Zhou, M. Improvement of Plant Waterlogging Tolerance. In Waterlogging Signalling and Tolerance in Plants; Mancuso, S., Shabala, S., Eds.; Springer: Berlin/Heidelberg, Germany, 2010; pp. 267–285. ISBN 978-3-642-10304-9. [Google Scholar]
  25. VanToai, T.T.; St. Martin, S.K.; Chase, K.; Boru, G.; Schnipke, V.; Schmitthenner, A.F.; Lark, K.G. Identification of a QTL Associated with Tolerance of Soybean to Soil Waterlogging. Crop. Sci. 2001, 41, 1247–1252. [Google Scholar] [CrossRef] [Green Version]
  26. Reyna, N.; Cornelious, B.; Shannon, J.G.; Sneller, C.H. Evaluation of a QTL for Waterlogging Tolerance in Southern Soybean Germplasm. Crop. Sci. 2003, 43, 2077–2082. [Google Scholar] [CrossRef]
  27. Cornelious, B.; Chen, P.; Chen, Y.; De Leon, N.; Shannon, J.G.; Wang, D. Identification of QTLs Underlying Water-Logging Tolerance in Soybean. Mol. Breed. 2005, 16, 103–112. [Google Scholar] [CrossRef]
  28. Sayama, T.; Nakazaki, T.; Ishikawa, G.; Yagasaki, K.; Yamada, N.; Hirota, N.; Hirata, K.; Yoshikawa, T.; Saito, H.; Teraishi, M.; et al. QTL analysis of seed-flooding tolerance in soybean (Glycine max [L.] Merr.). Plant Sci. 2009, 176, 514–521. [Google Scholar] [CrossRef] [PubMed]
  29. Salekdeh, G.H.; Reynolds, M.; Bennett, J.; Boyer, J. Conceptual framework for drought phenotyping during molecular breeding. Trends Plant Sci. 2009, 14, 488–496. [Google Scholar] [CrossRef]
  30. Berger, B.; Parent, B.; Tester, M. High-throughput shoot imaging to study drought responses. J. Exp. Bot. 2010, 61, 3519–3528. [Google Scholar] [CrossRef] [Green Version]
  31. Cho, J.-W.; Ji, H.C.; Yamakawa, T. Comparison of Photosynthetic Response of Two Soybean Cultivars to Soil Flooding. J. Fac. Agric. Kyushu Univ. 2006, 51, 227–232. [Google Scholar] [CrossRef]
  32. Shimono, H.; Konno, T.; Sakai, H.; Sameshima, R. Interactive Effects of Elevated Atmospheric CO2 and Waterlogging on Vegetative Growth of Soybean (Glycine max (L.) Merr.). Plant Prod. Sci. 2012, 15, 238–245. [Google Scholar] [CrossRef]
  33. Hummer, W.S. Linkage Mapping for Soybean (Glycine max) Flood Tolerance. Master’s Thesis, University of Arkansas, Fayetteville, NC, USA, 2018. [Google Scholar]
  34. Dhungana, S.K.; Kim, H.-S.; Kang, B.-K.; Seo, J.-H.; Kim, H.-T.; Shin, S.-O.; Park, C.-H.; Kwak, D.-Y. Quantitative trait loci mapping for flooding tolerance at an early growth stage of soybean recombinant inbred line population. Plant Breed. 2020, 139, 626–638. [Google Scholar] [CrossRef]
  35. Soltani, A.; MafiMoghaddam, S.; Oladzad-Abbasabadi, A.; Walter, K.; Kearns, P.J.; Vasquez-Guzman, J.; Mamidi, S.; Lee, R.; Shade, A.L.; Jacobs, J.L.; et al. Genetic Analysis of Flooding Tolerance in an Andean Diversity Panel of Dry Bean (Phaseolus vulgaris L.). Front. Plant Sci. 2018, 9, 767. [Google Scholar] [CrossRef] [PubMed] [Green Version]
  36. Yu, M.; Chen, G.-Y. Conditional QTL mapping for waterlogging tolerance in two RILs populations of wheat. SpringerPlus 2013, 2, 245. [Google Scholar] [CrossRef] [Green Version]
  37. Yu, M.; Mao, S.; Chen, G.; Liu, Y.; Li, W.; Wei, Y.; Liu, C.; Zheng, Y. QTLs for Waterlogging Tolerance at Germination and Seedling Stages in Population of Recombinant Inbred Lines Derived from a Cross Between Synthetic and Cultivated Wheat Genotypes. J. Integr. Agric. 2014, 13, 31–39. [Google Scholar] [CrossRef]
  38. Ballesteros, D.C.; Mason, R.E.; Addison, C.K.; Acuña, M.A.; Arguello, M.N.; Subramanian, N.; Miller, R.G.; Sater, H.; Gbur, E.E.; Miller, D.; et al. Tolerance of wheat to vegetative stage soil waterlogging is conditioned by both constitutive and adaptive QTL. Euphytica 2015, 201, 329–343. [Google Scholar] [CrossRef]
  39. Li, H.; Vaillancourt, R.; Mendham, N.; Zhou, M. Comparative mapping of quantitative trait loci associated with waterlogging tolerance in barley (Hordeum vulgare L.). BMC Genom. 2008, 9, 401. [Google Scholar] [CrossRef] [PubMed] [Green Version]
  40. Liao, C.Y.; Wu, P.; Hu, B.; Yi, K.K. Effects of genetic background and environment on QTLs and epistasis for rice (Oryza sativa L.) panicle number. Theor. Appl. Genet. 2001, 103, 104–111. [Google Scholar] [CrossRef]
  41. Xie, X.-W.; Xu, M.-R.; Zang, J.-P.; Sun, Y.; Zhu, L.-H.; Xu, J.-L.; Zhou, Y.-L.; Li, Z.-K. Genetic Background and Environmental Effects on QTLs for Sheath Blight Resistance Revealed by Reciprocal Introgression Lines in Rice. Acta Agron. Sin. 2008, 34, 1885–1893. [Google Scholar] [CrossRef]
  42. Koo, S.C.; Kim, H.T.; Kang, B.K.; Lee, Y.H.; Oh, K.W.; Baek, I.Y.; Yun, H.T.; Choi, M.S.; Kim, H.Y. Screening of Flooding Tolerance in Soybean Germplasm Collection. Korean J. Breed. Sci. 2014, 46, 129–135. [Google Scholar] [CrossRef]
  43. Lee, C.; Choi, M.-S.; Kim, H.-T.; Yun, H.-T.; Lee, B.; Chung, Y.-S.; Kim, R.W.; Choi, H.-K. Soybean [Glycine max (L.) Merrill]: Importance as A Crop and Pedigree Reconstruction of Korean Varieties. Plant Breed. Biotechnol. 2015, 3, 179–196. [Google Scholar] [CrossRef] [Green Version]
  44. Kim, D.H.; Kim, K.H.; Van, K.; Kim, M.Y.; Lee, S.-H. Fine mapping of a resistance gene to bacterial leaf pustule in soybean. Theor. Appl. Genet. 2010, 120, 1443–1450. [Google Scholar] [CrossRef]
  45. Hong, E.H.; Kim, S.D.; Hwang, Y.H.; Lee, Y.H.; Moon, Y.H.; Park, E.H.; Park, R.K. A Semi-Dwarf, High Density-Adaptable and High Yielding Soybean Variety “Paldalkong. ” Res. Rep. Rural Dev. Adm. Crop. 1987, 29, 203–209. [Google Scholar]
  46. Lee, Y.-G.; Jeong, N.; Kim, J.H.; Lee, K.; Kim, K.H.; Pirani, A.; Ha, B.-K.; Kang, S.-T.; Park, B.-S.; Moon, J.-K.; et al. Development, validation and genetic analysis of a large soybean SNP genotyping array. Plant J. 2015, 81, 625–636. [Google Scholar] [CrossRef]
  47. Toker, C. Estimates of broad-sense heritability for seed yield and yield criteria in faba bean (Vicia faba L.). Hereditas 2004, 140, 222–225. [Google Scholar] [CrossRef]
  48. Meng, L.; Li, H.; Zhang, L.; Wang, J. QTL IciMapping: Integrated software for genetic linkage map construction and quantitative trait locus mapping in biparental populations. Crop. J. 2015, 3, 269–283. [Google Scholar] [CrossRef] [Green Version]
  49. Wang, J.; Li, H.; Zhang, L.; Meng, L. Users’ Manual of QTL IciMapping; The Quantitative Genetics Group, Institute of Crop Science, Chinese Academy of Agricultural Sciences (CAAS): Beijing, China; Genetic Resources Program, International Maize and Wheat Improvement Center (CIMMYT): Mexico City, Mexico, 2016. [Google Scholar]
  50. Wu, C.; Zeng, A.; Chen, P.; Florez-Palacios, L.; Hummer, W.; Mokua, J.; Klepadlo, M.; Yan, L.; Ma, Q.; Cheng, Y. An effective field screening method for flood tolerance in soybean. Plant Breed. 2017, 136, 710–719. [Google Scholar] [CrossRef]
  51. Wray, N.R.; Visscher, P.M. Estimating Trait Heritability. Nat. Educ. 2008, 1, 29. [Google Scholar]
  52. Djanaguiraman, M.; Prasad, P.V.; Boyle, D.L.; Schapaugh, W.T. High-Temperature Stress and Soybean Leaves: Leaf Anatomy and Photosynthesis. Crop. Sci. 2011, 51, 2125–2131. [Google Scholar] [CrossRef]
  53. Rieseberg, L.H.; Archer, M.A.; Wayne, R.K. Transgressive segregation, adaptation and speciation. Heredity 1999, 83, 363–372. [Google Scholar] [CrossRef]
  54. Wu, C.; Mozzoni, L.A.; Moseley, D.; Hummer, W.; Ye, H.; Chen, P.; Shannon, G.; Nguyen, H. Genome-wide association mapping of flooding tolerance in soybean. Mol. Breed. 2020, 40, 4. [Google Scholar] [CrossRef]
  55. Nguyen, H.T.M.; Neelakadan, A.K.; Quach, T.N.; Valliyodan, B.; Kumar, R.; Zhang, Z.; Nguyen, H.T. Molecular characterization of Glycine max squalene synthase genes in seed phytosterol biosynthesis. Plant Physiol. Biochem. 2013, 73, 23–32. [Google Scholar] [CrossRef] [PubMed]
  56. Cheng, S.; Huang, Y.; Zhu, N.; Zhao, Y. The rice WUSCHEL-related homeobox genes are involved in reproductive organ development, hormone signaling and abiotic stress response. Gene 2014, 549, 266–274. [Google Scholar] [CrossRef]
  57. Ma, J.; Li, M.-Y.; Wang, F.; Tang, J.; Xiong, A.-S. Genome-wide analysis of Dof family transcription factors and their responses to abiotic stresses in Chinese cabbage. BMC Genom. 2015, 16, 33. [Google Scholar] [CrossRef] [Green Version]
  58. Zhu, M.; Chen, G.; Dong, T.; Wang, L.; Zhang, J.; Zhao, Z.; Hu, Z. SlDEAD31, a Putative DEAD-Box RNA Helicase Gene, Regulates Salt and Drought Tolerance and Stress-Related Genes in Tomato. PLoS ONE 2015, 10, e0133849. [Google Scholar] [CrossRef] [PubMed] [Green Version]
  59. Song, H.; Wang, P.; Hou, L.; Zhao, S.; Zhao, C.; Xia, H.; Li, P.; Zhang, Y.; Bian, X.; Wang, X. Global Analysis of WRKY Genes and Their Response to Dehydration and Salt Stress in Soybean. Front. Plant Sci. 2016, 7, 9. [Google Scholar] [CrossRef] [Green Version]
  60. Liu, X.; Li, R.; Dai, Y.; Yuan, L.; Sun, Q.; Zhang, S.; Wang, X. A B-box zinc finger protein, MdBBX10, enhanced salt and drought stresses tolerance in Arabidopsis. Plant Mol. Biol. 2019, 99, 437–447. [Google Scholar] [CrossRef]
  61. Guo, R.; Qiao, H.; Zhao, J.; Wang, X.; Tu, M.; Guo, C.; Wan, R.; Li, Z.; Wang, X. The Grape VlWRKY3 Gene Promotes Abiotic and Biotic Stress Tolerance in Transgenic Arabidopsis thaliana. Front. Plant Sci. 2018, 9, 545. [Google Scholar] [CrossRef] [Green Version]
  62. Dossa, K.; Mmadi, M.A.; Zhou, R.; Zhang, T.; Su, R.; Zhang, Y.; Wang, L.; You, J.; Zhang, X. Depicting the Core Transcriptome Modulating Multiple Abiotic Stresses Responses in Sesame (Sesamum indicum L.). Int. J. Mol. Sci. 2019, 20, 3930. [Google Scholar] [CrossRef] [PubMed] [Green Version]
  63. Carther, K.; Ketehouli, T.; Ye, N.; Yang, Y.-H.; Wang, N.; Dong, Y.-Y.; Yao, N.; Liu, X.-M.; Liu, W.-C.; Li, X.-W.; et al. Comprehensive Genomic Analysis and Expression Profiling of Diacylglycerol Kinase (DGK) Gene Family in Soybean (Glycine max) under Abiotic Stresses. Int. J. Mol. Sci. 2019, 20, 1361. [Google Scholar] [CrossRef] [Green Version]
  64. Chu, H.D.; Nguyen, K.-L.; Watanabe, Y.; Le, D.T.; Tran, L.-S.P. Expression analyses of soybean genes encoding methionine-R-sulfoxide reductase under various conditions suggest a possible role in the adaptation to stress. Appl. Biol. Chem. 2016, 59, 681–687. [Google Scholar] [CrossRef]
  65. Sun, X.; Sun, M.; Jia, B.; Qin, Z.; Yang, K.; Chen, C.; Yu, Q.; Zhu, Y. A Glycine soja methionine sulfoxide reductase B5a interacts with the Ca2+/CAM-binding kinase GsCBRLK and activates ROS signaling under carbonate alkaline stress. Plant J. 2016, 86, 514–529. [Google Scholar] [CrossRef] [Green Version]
  66. Rey, P.; Tarrago, L. Physiological Roles of Plant Methionine Sulfoxide Reductases in Redox Homeostasis and Signaling. Antioxidants 2018, 7, 114. [Google Scholar] [CrossRef] [Green Version]
  67. Dhungana, S.K.; Kim, H.-S.; Kang, B.-K.; Seo, J.-H.; Kim, H.-T.; Oh, J.-H.; Shin, S.-O.; Baek, I.-Y. Analysis of differentially expressed genes in soybean leaf tissue of tolerant and susceptible cultivars under flooding stress revealed by RNA sequencing. J. Crop. Sci. Biotechnol. 2021, 24, 83–91. [Google Scholar] [CrossRef]
  68. Deshmukh, R.; Sonah, H.; Patil, G.; Chen, W.; Prince, S.; Mutava, R.; Vuong, T.; Valliyodan, B.; Nguyen, H.T. Integrating omic approaches for abiotic stress tolerance in soybean. Front. Plant Sci. 2014, 5, 244. [Google Scholar] [CrossRef] [PubMed]
  69. Sareen, S.; Tyagi, B.S.; Sarial, A.K.; Tiwari, V.; Sharma, I. Trait analysis, diversity, and genotype × environment interaction in some wheat landraces evaluated under drought and heat stress conditions. Chil. J. Agric. Res. 2014, 74, 135–142. [Google Scholar] [CrossRef] [Green Version]
  70. Lee, K.-W.; Chen, P.-W.; Lu, C.-A.; Chen, S.; Ho, T.-H.D.; Yu, S.-M. Coordinated Responses to Oxygen and Sugar Deficiency Allow Rice Seedlings to Tolerate Flooding. Sci. Signal. 2009, 2, ra61. [Google Scholar] [CrossRef]
  71. Gonzali, S.; Loreti, E.; Cardarelli, F.; Novi, G.; Parlanti, S.; Pucciariello, C.; Bassolino, L.; Banti, V.; Licausi, F.; Perata, P. Universal stress protein HRU1 mediates ROS homeostasis under anoxia. Nat. Plants 2015, 1, 15151. [Google Scholar] [CrossRef] [PubMed]
  72. Mendiondo, G.M.; Gibbs, D.J.; Szurman-Zubrzycka, M.; Korn, A.; Marquez, J.; Szarejko, I.; Maluszynski, M.; King, J.; Axcell, B.; Smart, K.; et al. Enhanced waterlogging tolerance in barley by manipulation of expression of the N-end rule pathway E3 ligase PROTEOLYSIS6. Plant Biotechnol. J. 2016, 14, 40–50. [Google Scholar] [CrossRef] [PubMed]
  73. Oh, M.; Komatsu, S. Characterization of proteins in soybean roots under flooding and drought stresses. J. Proteom. 2015, 114, 161–181. [Google Scholar] [CrossRef] [PubMed]
Figure 1. Frequency distribution of leaf chlorophyll content (CC, SPAD value) and shoot dry weight (DW, g) of 152 recombinant inbred lines (RILs) under control and flooded conditions over two years. (ac) CC in 2017, 2018, and mean of two years under the control; (df) CC in 2017, 2018, and mean of two years under flooding; (gi) DW in 2017, 2018, and mean of two years under control; (jl) DW in 2017, 2018, and mean of two years under flooding conditions, respectively.
Agronomy 11 00908 g001
Table 1. Leaf chlorophyll content (CC) and shoot dry weight (DW) of parents (‘Danbaekkong’ and ‘NTS1116’) and recombinant inbred lines under control and flooding-stressed conditions over two years.
TreatmentTraitYearParentRILH2 1
Danbaekkong
(Mean ± SD)
NTS1116
(Mean ± SD)
MeanRange
ControlCC201731.92 ± 5.1133.38 ± 5.2632.5521.00–39.58
201835.09 ± 2.5435.09 ± 2.2237.6033.04–41.27
Mean 233.50 ± 2.2434.24 ± 1.2135.2421.00–41.27
DW (g)20171.54 ± 0.711.89 ± 1.641.600.49–3.80
20181.51 ± 0.521.55 ± 0.322.210.88–3.44
Mean1.53 ± 0.021.72 ± 0.241.920.49–3.80
FloodingCC201720.25 ± 7.3314.32 ± 2.4220.679.80–29.38
201827.01 ± 2.8621.56 ± 2.9720.7012.64–30.04
Mean23.63 ± 4.7817.94 ± 5.1220.739.80–30.04
DW (g)20171.01 ± 0.590.82 ± 0.421.100.31–1.87
20180.85 ± 0.050.71 ± 0.161.030.48–1.90
Mean0.93 ± 0.110.77 ± 0.091.060.31–1.90
Combined 3CC (%) 68.35
DW (%) 68.42
1 Broad-sense heritability, calculated on a line-mean basis. 2 Average value of two years. 3 Control and flooding.
Table 2. Leaf chlorophyll content index (CCI), shoot dry weight index (DWI), and flooding tolerance index (FTI) of parents (‘Danbaekkong’ and ‘NTS1116’) and recombinant inbred lines over two years.
TraitYearParentRIL
DanbaekkongNTS1116MeanRange
CCI20170.630.430.660.29–0.97
20180.770.610.550.35–0.80
Mean 10.700.520.600.29–0.97
DWI20170.660.430.790.25–2.00
20180.560.460.470.27–0.89
Mean0.610.450.630.25–2.00
FTI20170.650.430.720.30–1.39
20180.670.540.510.35–0.75
Mean0.660.480.620.30–1.39
1 Average value of two years.
Table 3. Flooding tolerance-related QTL identified in a recombinant inbred line population derived from ‘Danbaekkong’ × ‘NTS1116’.
QTL Name 1Environment 2Chr (LG) 3Position (cM)Marker IntervalPhysical Position 4 (bp)LOD 5PVE 6 (%)Additive 7
qSFT_3-382018DWI3 (N)36.8−40.9AX-90428828–AX-9034080337,447,696–38,227,5645.1411.8−0.0509
qSFT_3-642018DWI3 (N)62.8−71.3AX-90323988–AX-9048905442,201,780–43,325,7523.398.30.0314
qSFT_4-172017CCF4 (C1)267.5−290.6AX-90368307–AX-903635506,322,051–41,712,6983.518.2−0.8676
qSFT_6-862017DWI6 (C2)200.5−215.2AX-90332662–AX-9045453318,319,783–47,839,5354.5510.4−0.1081
2017FTI 200.5−215.2AX-90332662–AX-9045453318,319,783–47,839,5354.5010.2−0.064
qSFT_7-32017FTI7 (M)77.9−115.2AX-90495740–AX-90333525418,570–7,905,0153.9830.7−0.1081
2017DWI 77.9−115.2AX-90495740–AX-90333525418,570–7,905,0154.1025.6−0.1656
MeanDWI 114.8−115.2AX-90362660–AX-903335257,854,359–7,905,0153.898.9−0.0546
qSFT_7-142017FTI 116.3−134.5AX-90316460–AX-904153977,984,980–15,641,1864.2212.8−0.0701
MeanFTI7 (M)121.2−121.9AX-90474615–AX-903298209,874,757–10,187,4324.6310.4−0.0351
qSFT_13-532018CCF13 (F)66.1−72.6AX-90380240–AX-9043923926,719,782–30,966,4593.648.1−0.9293
qSFT_15-672018CCF15 (E)125.3−140.9AX-90306554–AX-904887156,048,170–8,976,0504.7010.6−1.1020
MeanCCI 129.5−131.3AX-90436179–AX-904240487,732,934–8,240,5003.638.6−0.0223
qSFT_16-402018CCI16 (J)43.8−76.3AX-90320765–AX-9045056626,236,346–35,344,8903.859.7−0.0274
qSFT_16-622018CCF16 (J)83.7−87.2AX-90329869–AX-9031689436,148,023–36,625,4333.788.9−0.9824
1 QTL detected in different environments at the same, adjacent or overlapping marker intervals were considered the same QTL. 2 CC: leaf chlorophyll content, DW: shoot dry weight, C: control, F: flooding, I: index, FTI: flooding tolerance index, Mean: average value of 2017 and 2018. 3 Chromosome (Chr) and linkage group (LG). 4 Physical position of the marker interval. 5 Logarithm of odds value at the peak likelihood of QTL. 6 Phenotypic variation explained by the QTL. 7 Additive effect, a positive value indicates that ‘Danbaekkong’ contributed the allele, and negative value indicates that ‘NTS1116’ contributed the allele for phenotypic variation. The QTL were identified by adjusting a minimum of 20 cM between QTL and 2-LOD drop interval based on position (centiMorgans).
Publisher’s Note: MDPI stays neutral with regard to jurisdictional claims in published maps and institutional affiliations.

