Impact of Heart Rate Fragmentation on the Assessment of Heart Rate Variability †


1
Graduate School of Medical Sciences, Nagoya City University, Nagoya 467-8601, Japan
2
Graduate School of Engineering, Tohoku University, Miyagi 980-8577, Japan
*
Author to whom correspondence should be addressed.
†
This paper is an extended version of paper published in 2019 IEEE International Conference on Consumer Electronics-Taiwan (ICCE-TW), held on 20–22 May 2019, in Yilan, Taiwan.
Appl. Sci. 2020, 10(9), 3314; https://0-doi-org.brum.beds.ac.uk/10.3390/app10093314
Submission received: 19 April 2020
/
Revised: 3 May 2020
/
Accepted: 6 May 2020
/
Published: 10 May 2020
(This article belongs to the Special Issue Artificial Intelligence and Beyond in Medical and Healthcare Engineering)
Abstract
:Heart rate fragmentation (HRF) is a type of sinoatrial instability characterized by frequent (often every beat) appearance of inflection in the R-R interval time series, despite the electrocardiograms appearing to be sinus rhythm. Because the assessment of parasympathetic function by heart rate variability (HRV) analysis depends on the assumption that the high-frequency component (HF, 0.15–0.4 Hz) of HRV is mediated solely by the cardiac parasympathetic nerve, HRF that is measured as a part of HF power confounds the parasympathetic functional assessment by HRV. In this study, we analyzed HRF in a 24-h electrocardiogram big data and investigated the changes in HRF with age and sex and its influence on the assessment of HRV. We observed that HRF is often observed during childhoods (0–20 year) and increased after 75 year, but it has a large impact on individual differences in HF power at ages 60–90.
1. Introduction
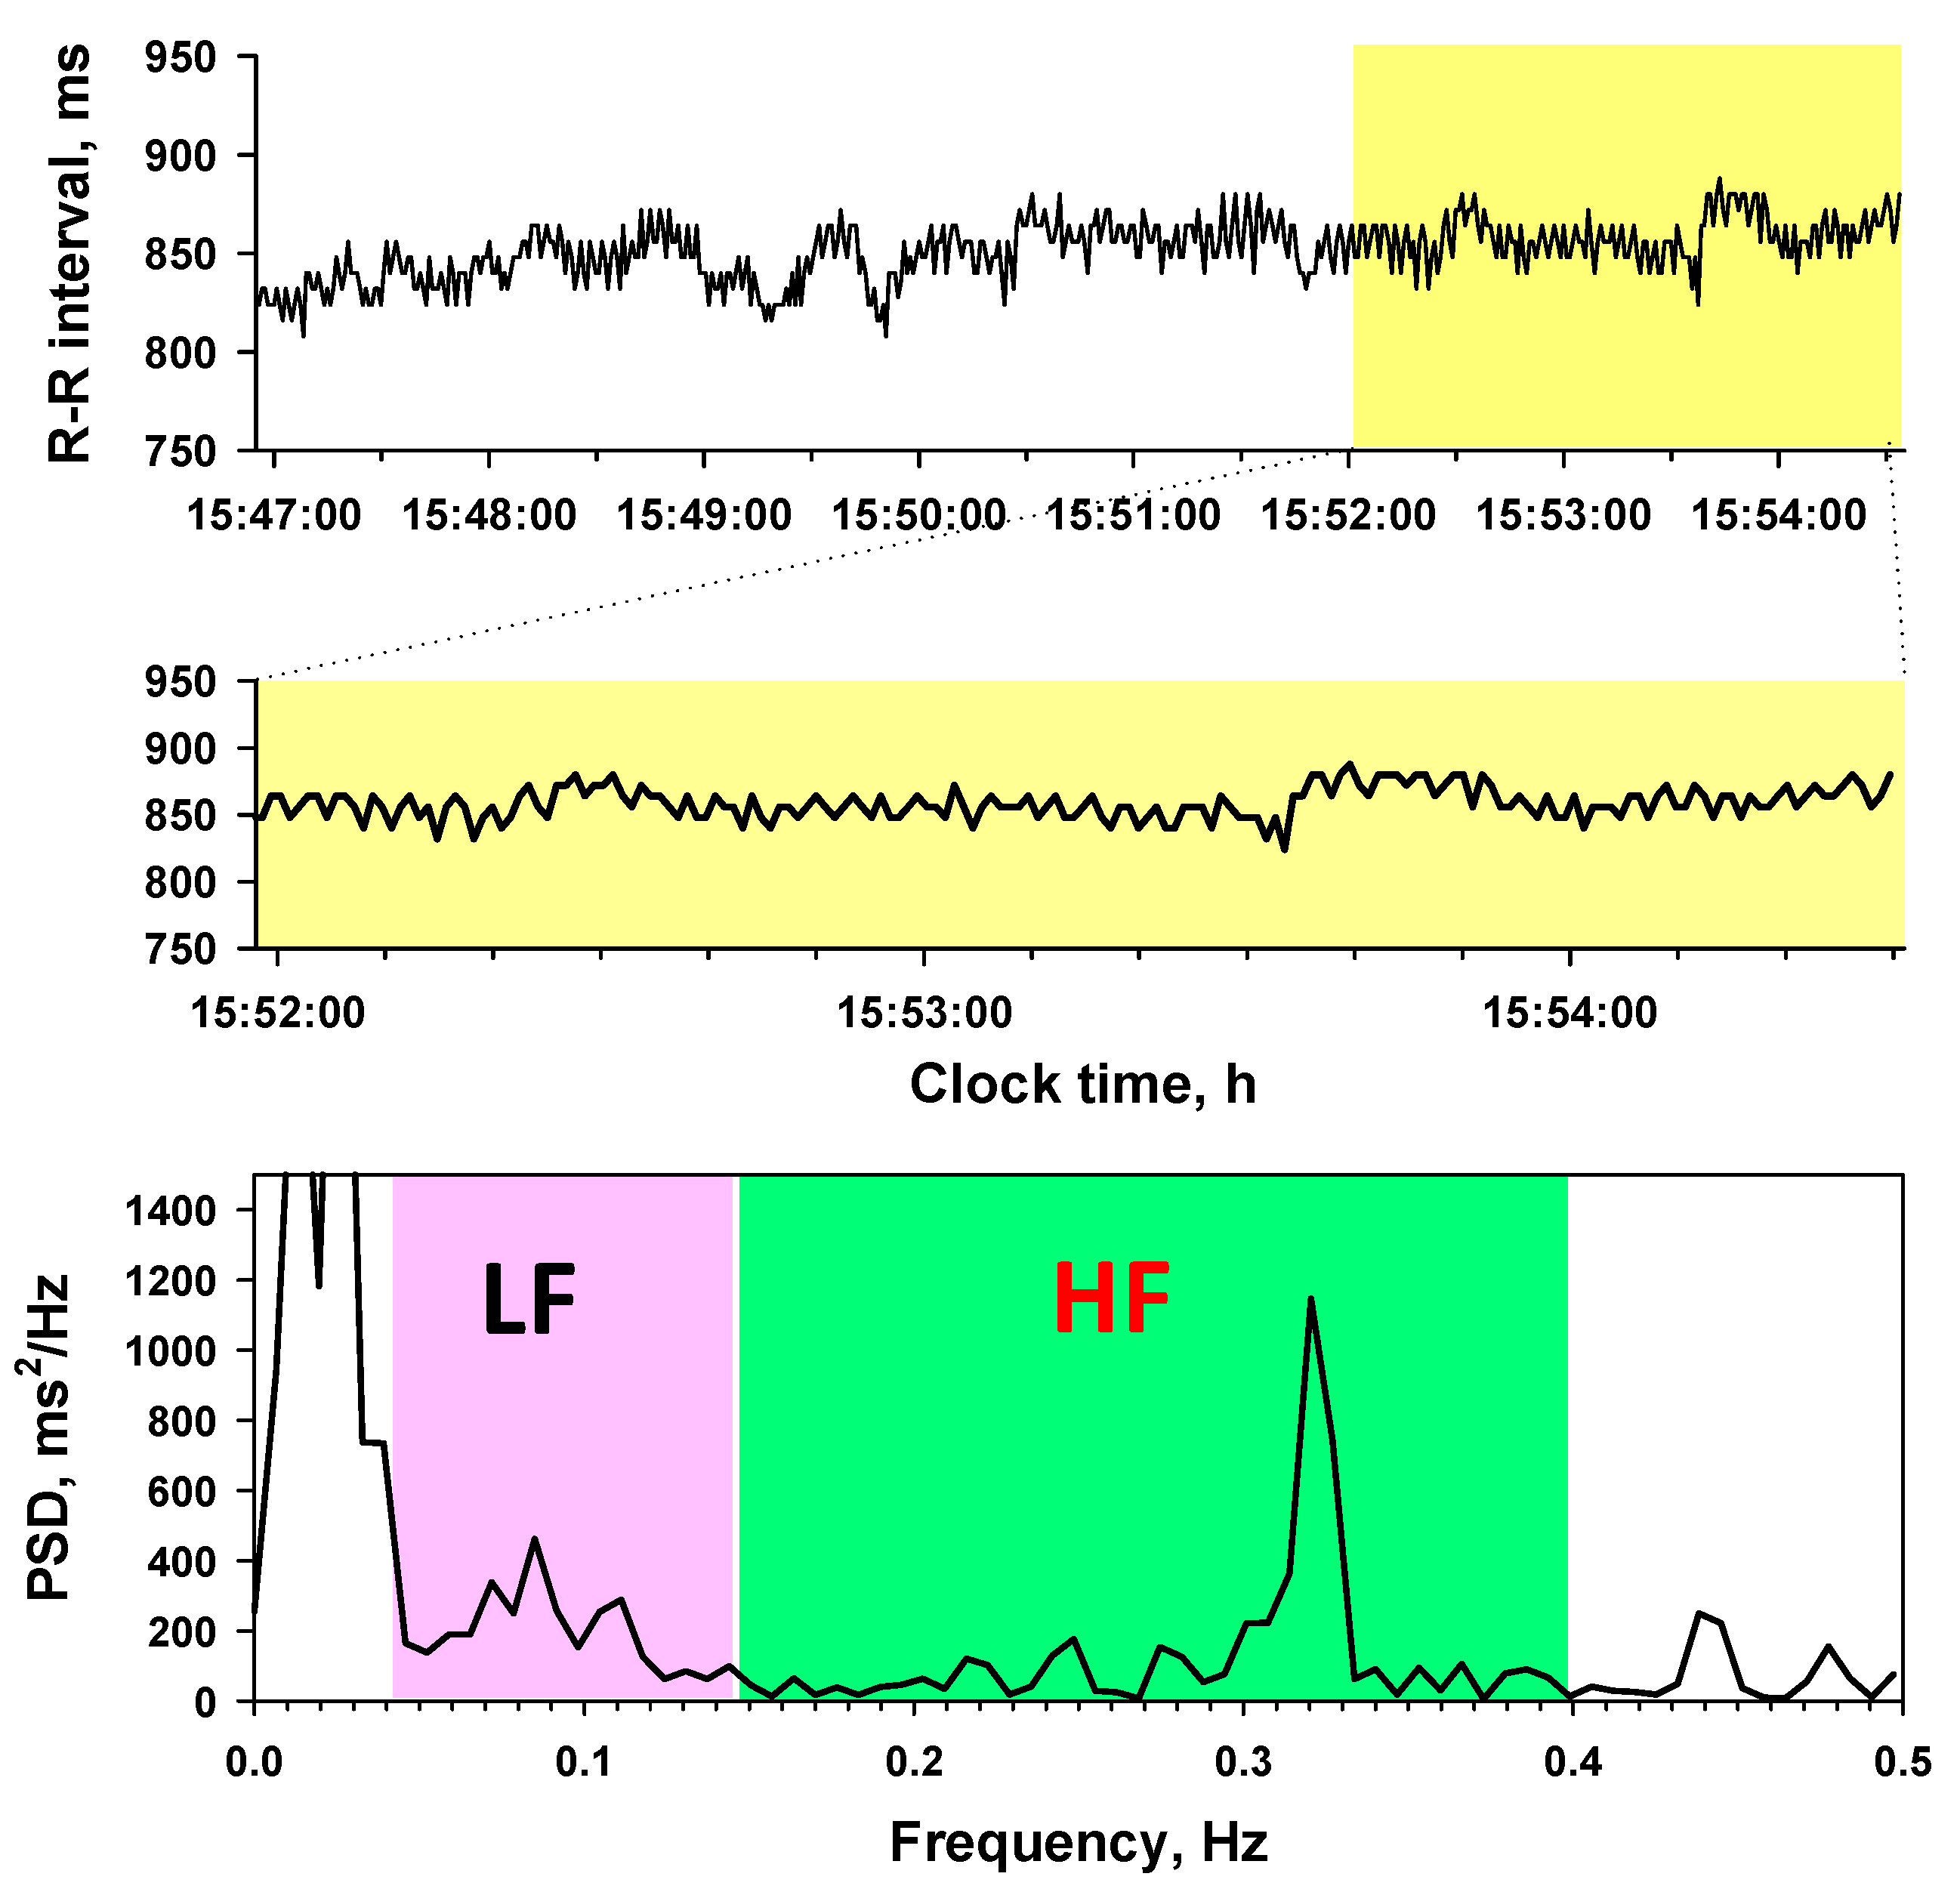
The analysis of heart rate variability (HRV) is widely used for assessing autonomic function. Particularly, the high-frequency component (HF, 0.15–0.4 Hz) of HRV is currently the most popular metric of cardiac vagal function (Figure 1). The association between HF and cardiac vagal function is supported by the fact that respiratory sinus arrhythmia (RSA), the major source of the HF, is mediated purely by the cardiac parasympathetic nerves [1].
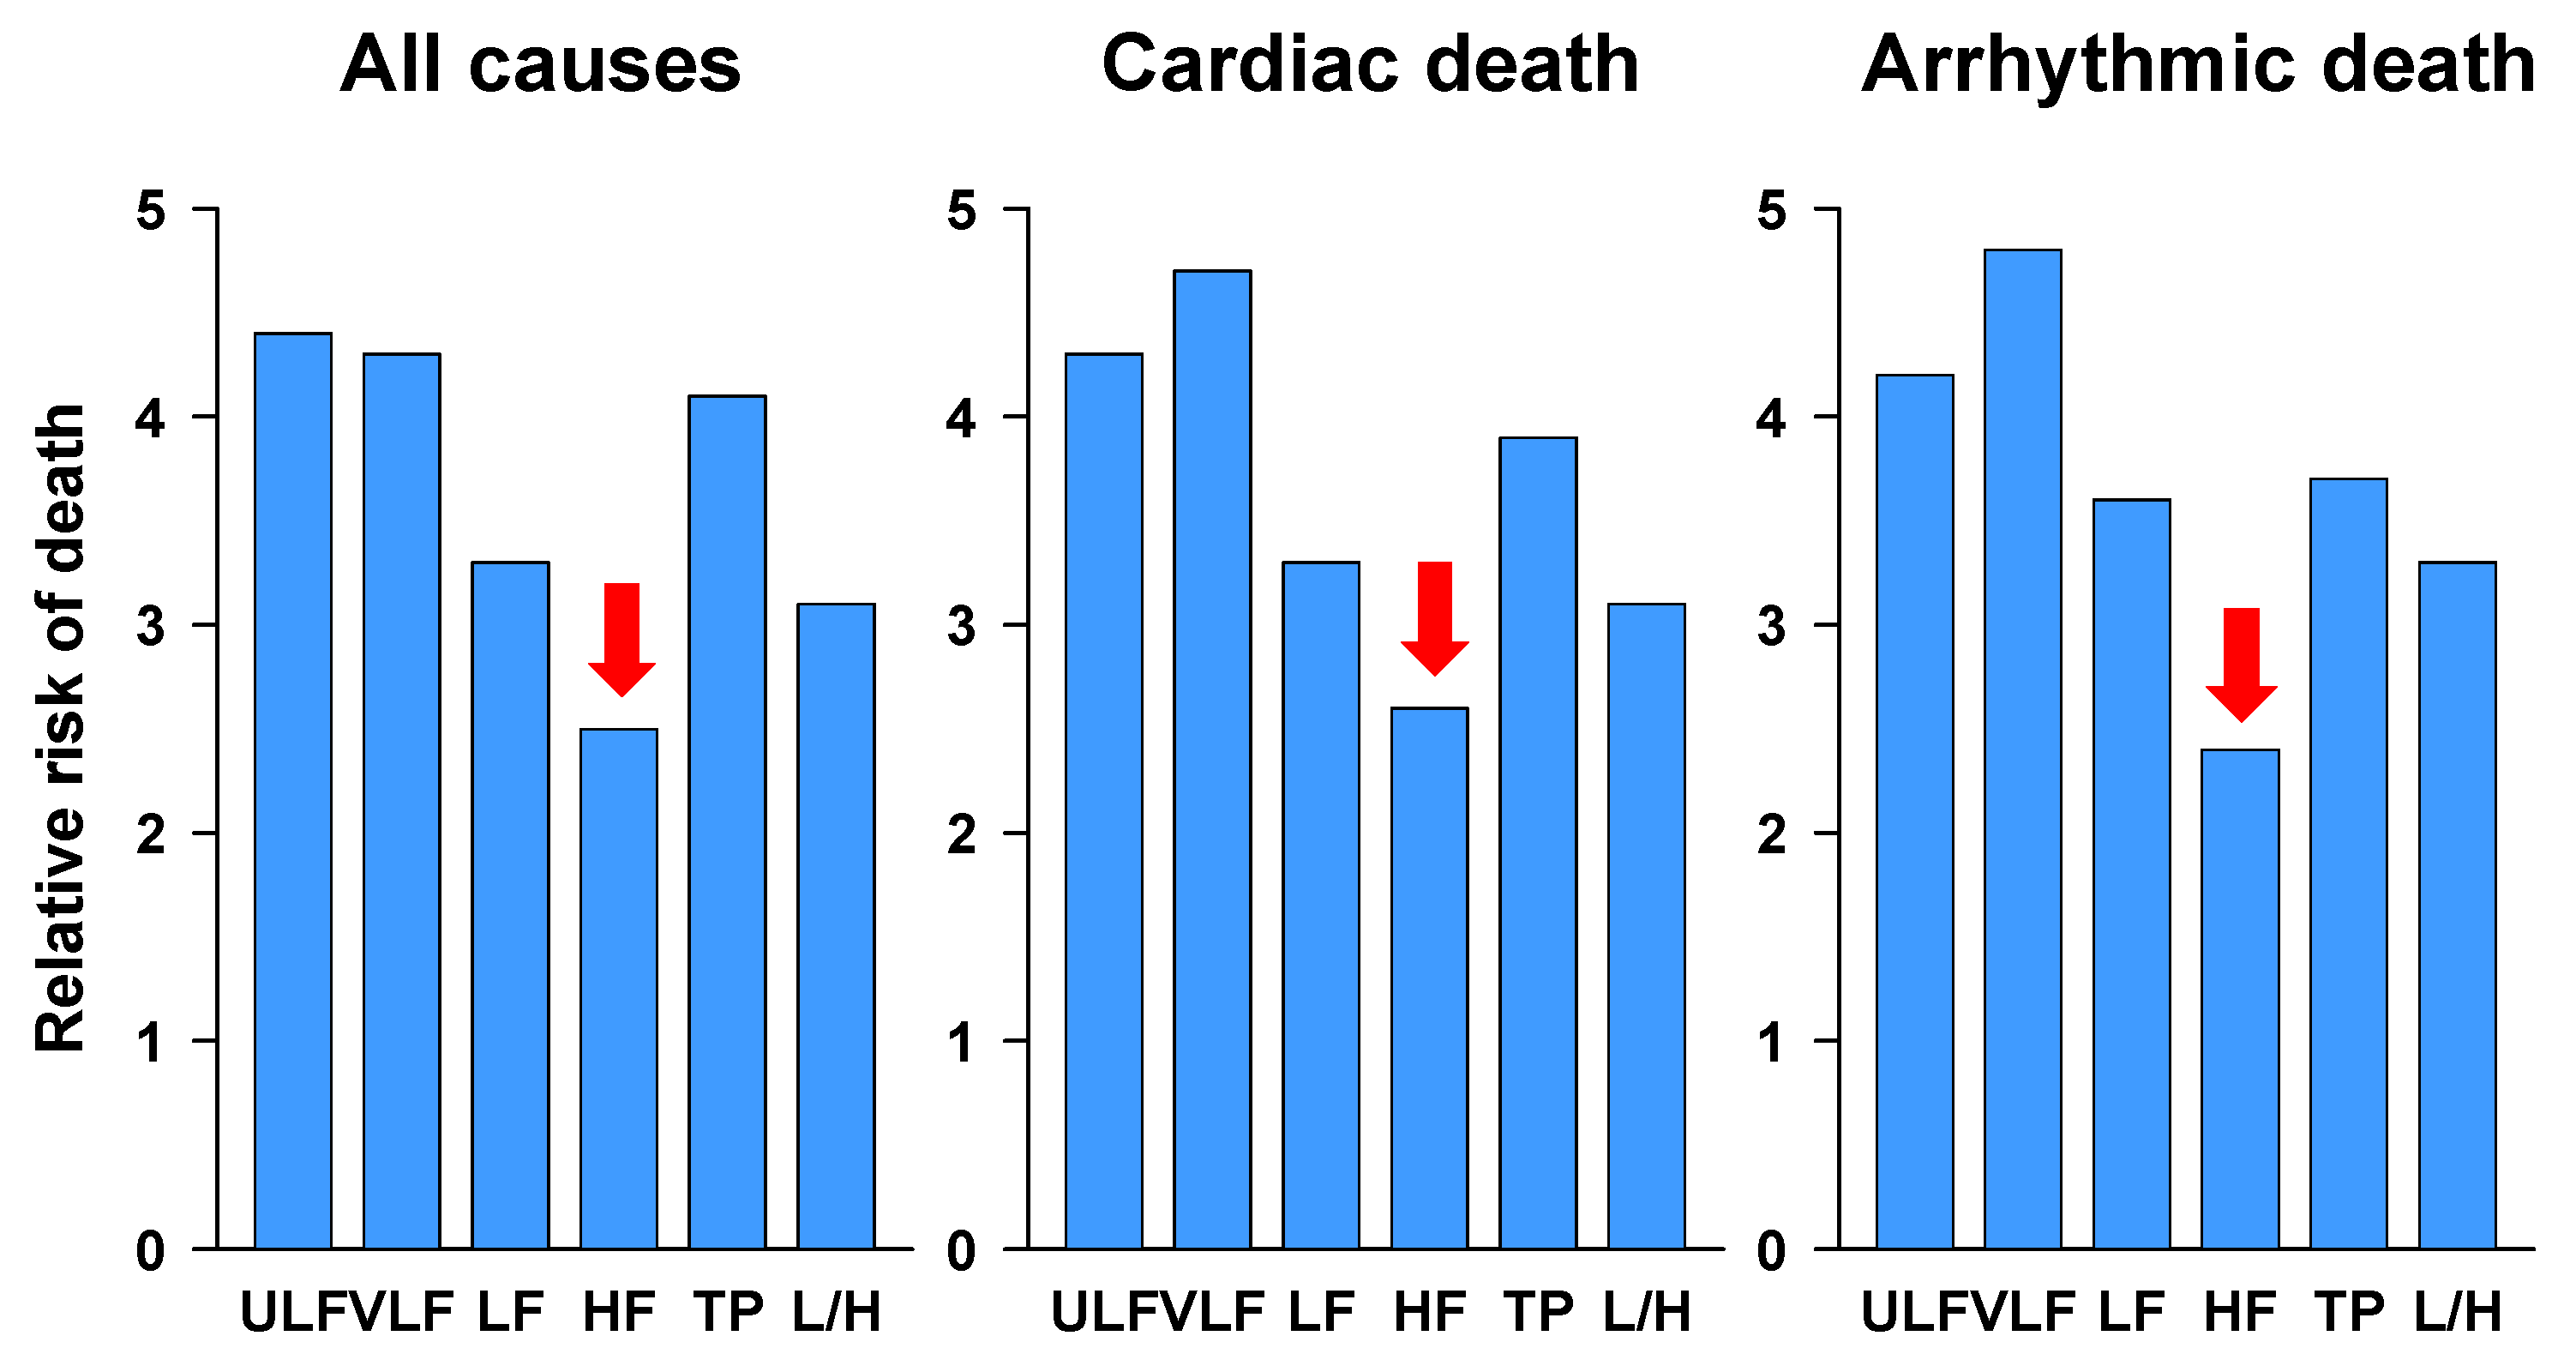
However, there are two unanswered questions about HF. The first question is the paradoxically low predictive power of HF for mortality risk after acute myocardial infarction (Figure 2) [2]. Decreased HRV is increased mortality risk after acute myocardial infarction [3], but the predictive power of HF is lowest among HRV frequency components. Why is the predictive power of HF such low, despite the fact that the association of decreased HRV with mortality risk has been explained as cardiac parasympathetic disfunction? The second question concerns the paradoxical increase in HF in the elderly (Figure 3) [4]. Cardiac parasympathetic function is believed to decrease with advancing age, but big data studies have reported that HF power increases paradoxically and progressively from age 75. Why?
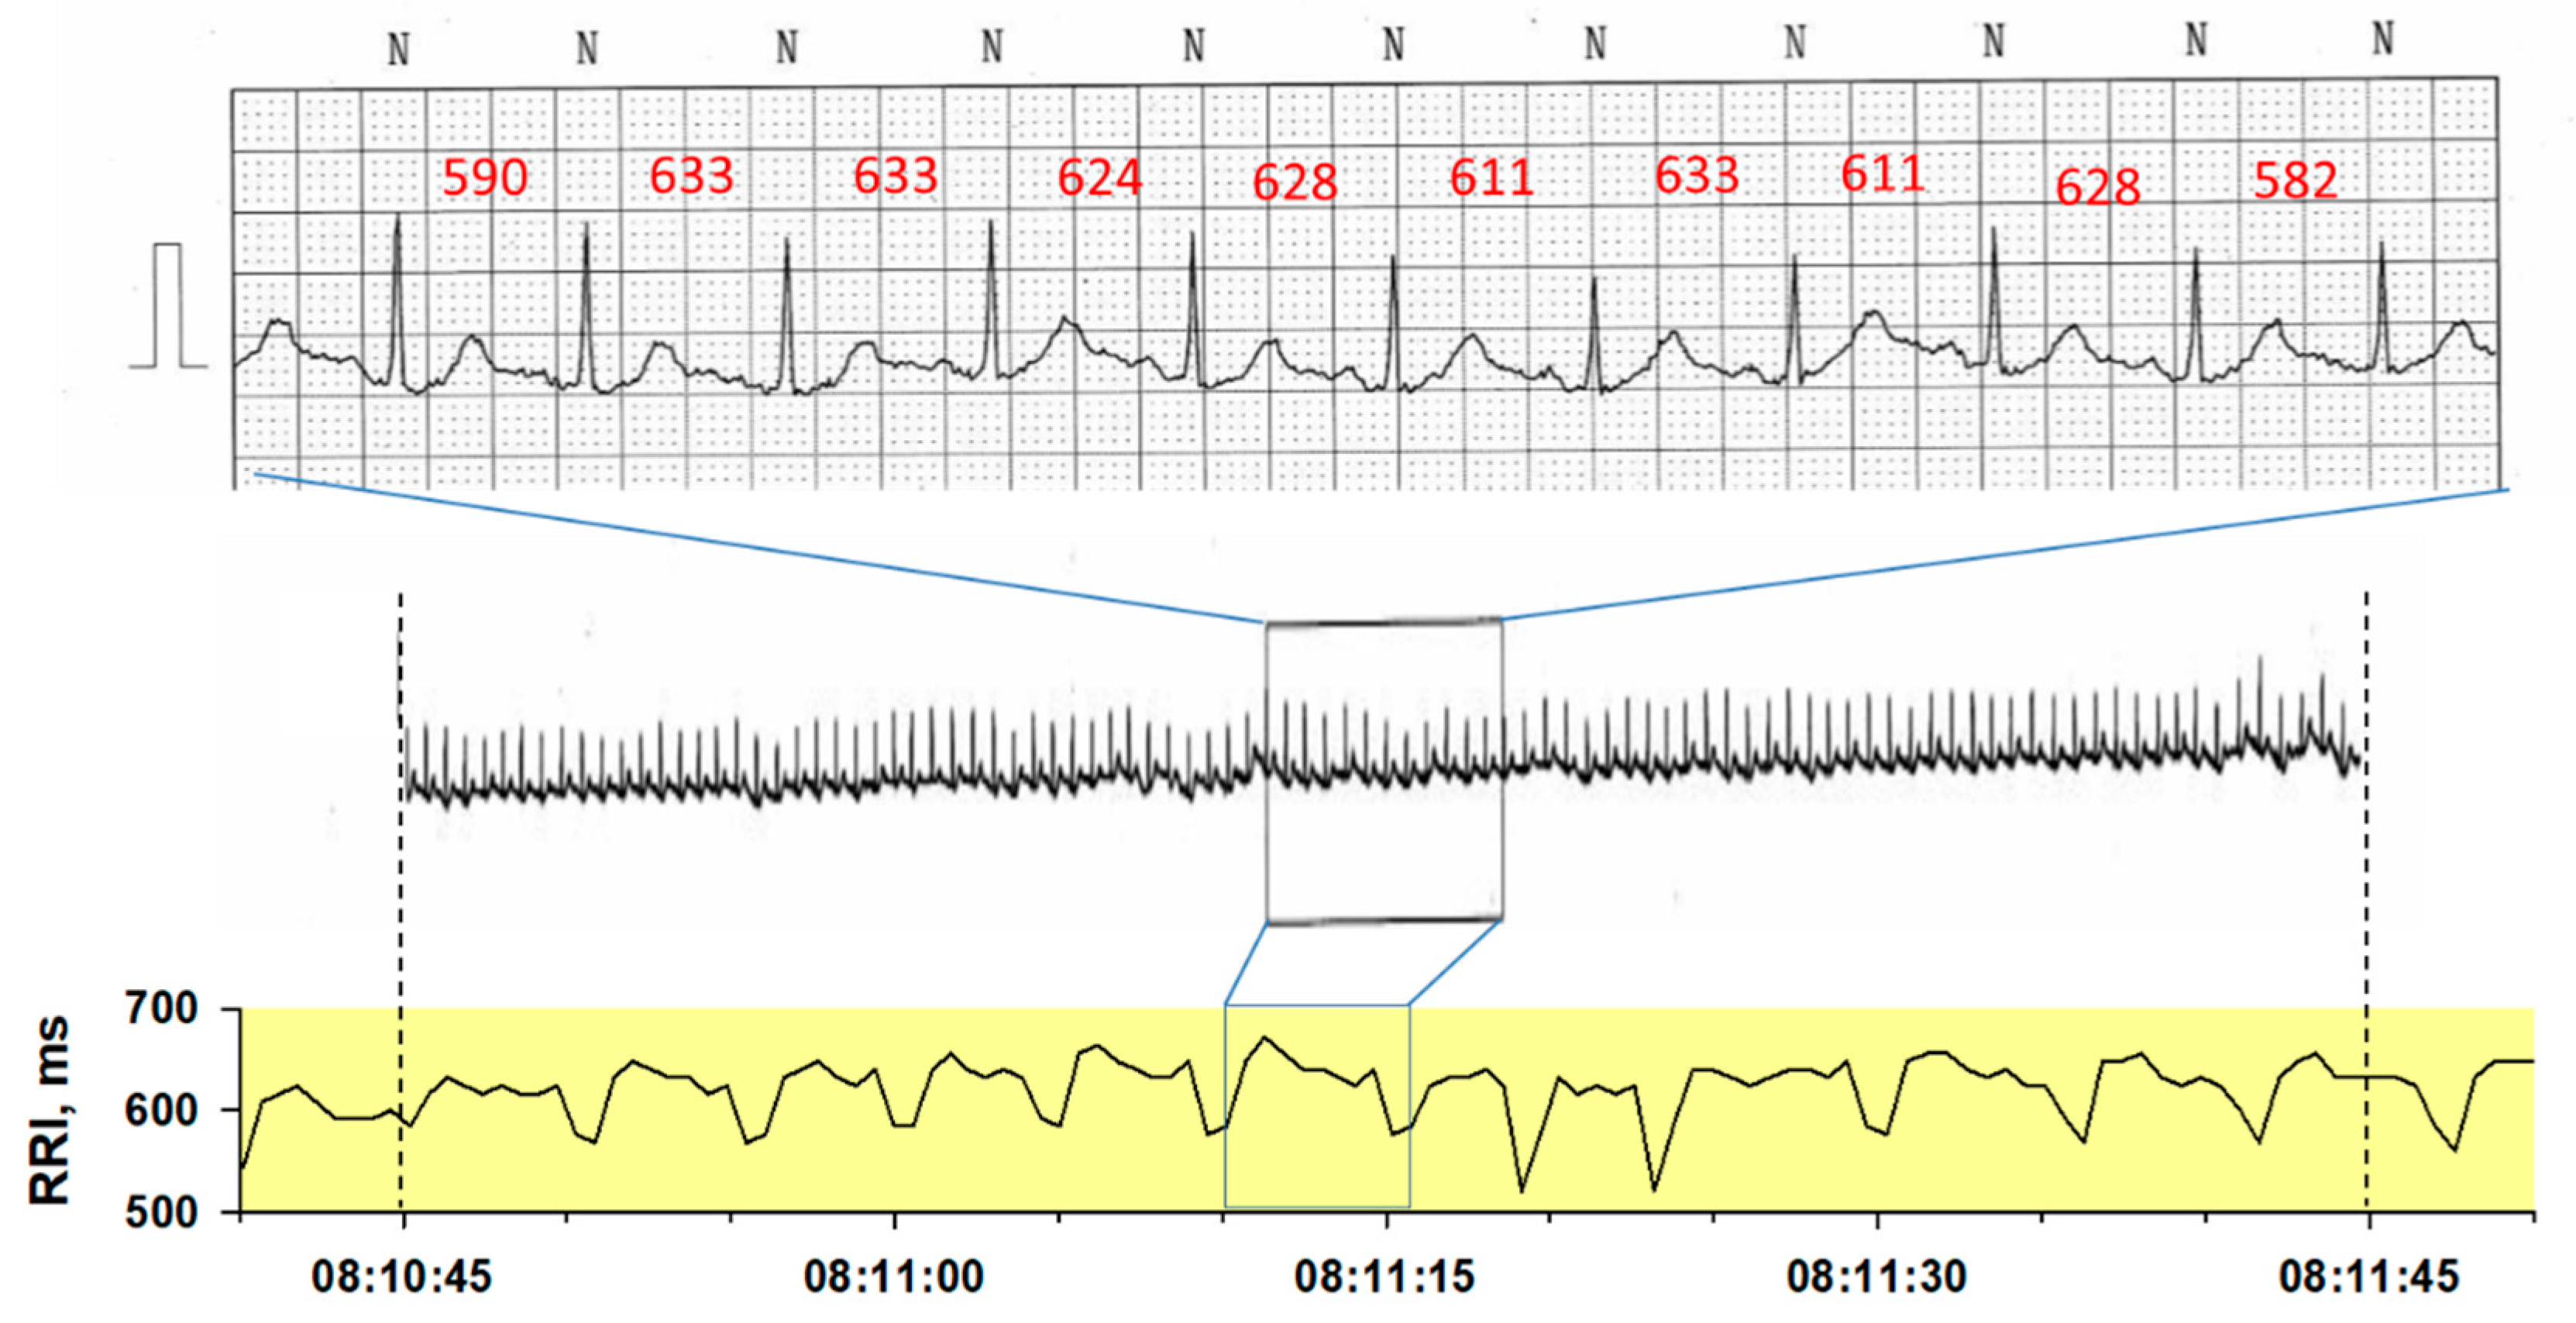
An answer to these questions may be the influence of heart rate fragmentation (HRF) [5,6,7]. While other HRV components are mediated by fluctuations in autonomic activity, HRF is thought to be a heart rate fluctuation intrinsic to the heart itself [8]. They usually appear in or above the HF band. This phenomenon has been known for a long time and called with several terms including complex HRV [9,10], sinus node alternans [11], erratic sinus rhythm [12,13], and heart rate fragmentation [5,6,7]. HRF is a type of sinoatrial instability characterized by frequent (often every beat) appearance of peak and valley in R-R interval time series despite ECG appealing normal sinus rhythm (Figure 4).
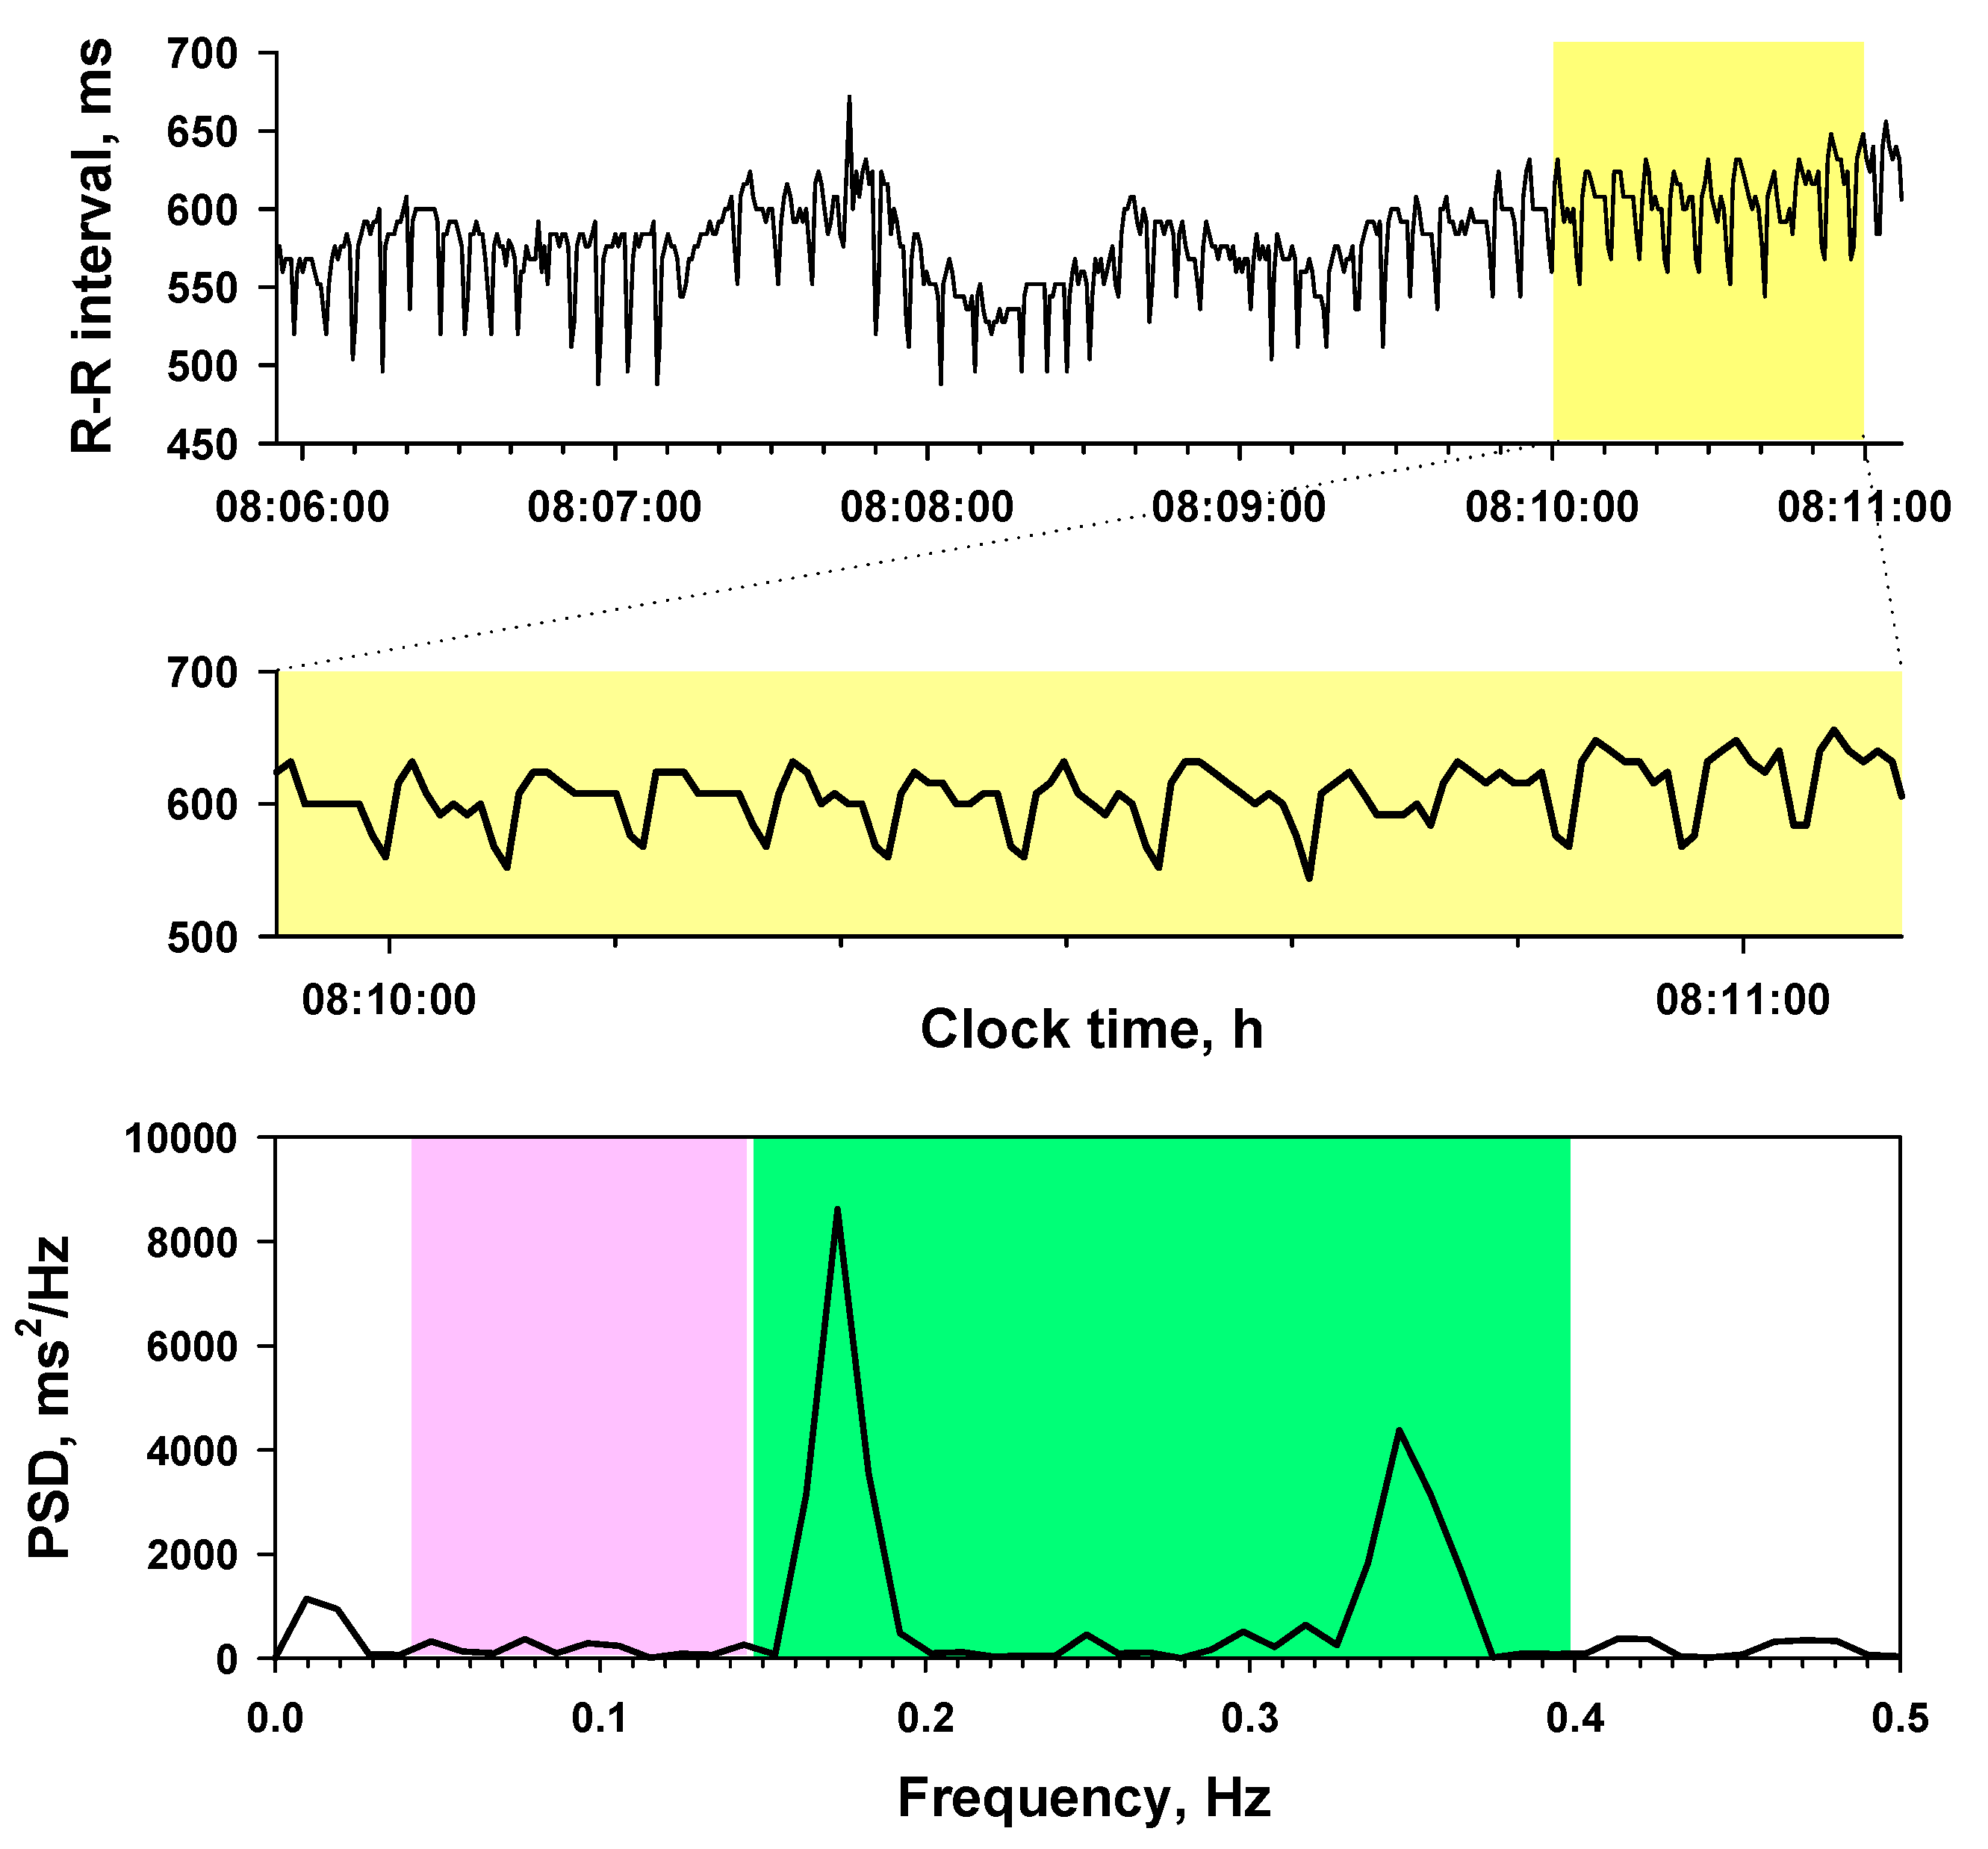
Because the assessment of parasympathetic function by HRV depends on the assumption that RSA is only source of the HF, HRF that is measured as a part of HF confounds the parasympathetic functional assessment by HRV (Figure 5). However, neither the factors affecting the occurrence of HRF nor the degree of its impact on the HF power has been clarified. In this study, we analyzed the age and sex dependency of the occurrence of HRF and the degree of the influence on HRV metrics using 24-h ECG big data of the Allostatic State Mapping by Ambulatory ECG Repository (ALLSTAR) [4,14,15].
2. Methods
This study was performed according to the protocol that has been approved by the Ethics Review Committee of Nagoya City University Graduate School of Medical Sciences and Nagoya City University Hospital (No. 709).
2.1. ECG Data Base
We used the ALLSTAR Holter electrocardiogram (ECG) database [2,13]. From this database, the data used for the present study were extracted as follows. The ALLSTAR database included 430,169 data of 24-h Holter ECG data recorded between November 2007 and February 2016, from which the candidate ECG data were selected by the following inclusion criteria:
- (1)
- Record length >21.6 h (90% of 24 h).
- (2)
- Cardiac rhythm is in sinus rhythm for >19.2 h (80% of 24 h).
ECG data were excluded from the analysis if ECG showed at least one of the followings:
- (1)
- Evidence of artificial pacemaker implantation
- (2)
- Ventricular or supraventricular ectopic beats >3000 per 24 h
- (3)
- Atrial fibrillation for >10% of recorded beats
- (4)
- Atrial flutter for >10% of recorded beats
- (5)
- ST-T abnormality suggesting myocardial ischemia
Among 430,169 data, 294,323 data (73.4%) of 24-h R-R interval time series were extracted by these criteria. From these data, 3917 data were randomly selected (up to 100 data per every 5 year old from ages 0 to 100 for each sex) for the present study by the Survey Select procedure of Statistical Analysis System (SAS Institute, Cary, NC, USA).
2.2. Data Analysis
We analyzed the conventional time- and frequency-domain HRV metrics according to the recommended standard [3] using custom-made software validated with simulated R-R interval data including HRV components of known amplitude and frequency. Briefly, from the ECG data, the time series of NN intervals, , where tNi represents the time of occurrence of the ith normal sinus beat were derived. Mean HR was calculated from the average of NNi over 24 h. For the time domain HRV metrics, SDNN was computed as 24 h standard deviation of NNi, rMSSD as the root of mean square of successive difference of NNi. For the frequency domain metrics, {NNi} time series were interpolated by a horizontal step function, resampled at 2 Hz, filtered with a Hanning window, and converted into frequency domain by Fast Fourie transformations (FFT). The power spectral density was integrated for the power within ultra-low frequency (ULF, <0.0033 Hz), very-low frequency (VLF, 0.0033–0.04 Hz), low frequency (LF, 0.04–0.15 Hz), and high frequency (HF, 0.15–0.40 Hz) bands, respectively. The power of ULF, VLF, LF, and HF was transformed into natural logarithmic values to normalize the distributions.
We also calculate LF/HF as LF-to-HF power ratio. Additionally, we calculated the power of very-high frequency component (VHF, 0.4–1.0 Hz) to detect high frequency HRF such as the alternation of NN interval every beat.
As the indicator of HRF, we calculated the percentage of inflection points (PIP) [5] and the distributions of the symbolic dynamical patterns (words) of NN interval sequence [6]. First, from the {NNi}, the time series of the differences between consecutive NN intervals, , were derived. Second, {∆NNi} were converted into a ternary symbolic sequence as follows: “A” (acceleration) if , “N” (no change) if , and “D” (deceleration) if , where ± 8 ms was used for threshold taking 125 Hz sampling frequency of the Holter ECG into consideration (1000 ms/125 Hz = 8 ms). Third, the hard inflection point was defined as the point where ∆NNi changed from “A” to “D”, or “D” to “A”. The soft inflection point was defined as the point where ∆NNi changed from “N” to “A”, “N” to “D”, “A” to “N”, or “D” to “N”. Fourth, the hard PIP (PIPh) and soft PIP (PIPs) were calculated as the percentage of hard and soft inflection points to all points connecting two consecutive NN intervals, respectively.
The symbolic dynamical patterns were analyzed as the word of length four that was consisted of the ternary symbols of four consecutive ∆NN. The words were categorized depending on the type (hard, soft, or mixed) and number (0–3) of inflection points in the sequence of ∆NN [6]. For example, sequence “DDAD” is categorized as “Wh2” because it includes two hard inflection points, “DNAN” as “Ws3” because it includes three soft inflection points, and “DDAN” as “Wm2 because it includes two mixed (hard and soft) inflection points. Table 1 shows the entire picture of the word classification. The percentage of each category of words for all observed words during 24 h was calculated.
2.3. Statistical Analysis
SAS program package (SAS Institute, Cary, NC) was used for statistical analyses. To delineate the sex and age dependent changes in HRV and HRF metrics, data were averaged for every 5 year of age in each sex. The associations among HRF metrics and between HRV and HRF metrics were evaluated by the product moment correlation coefficients for the entire sample and for every 5 year of age. The gender effects on variables were evaluated after adjusting for age effects by the analysis of covariance with the SAS general linear model procedure.
3. Results
3.1. Age and Sex Dependency of HRV Metrics
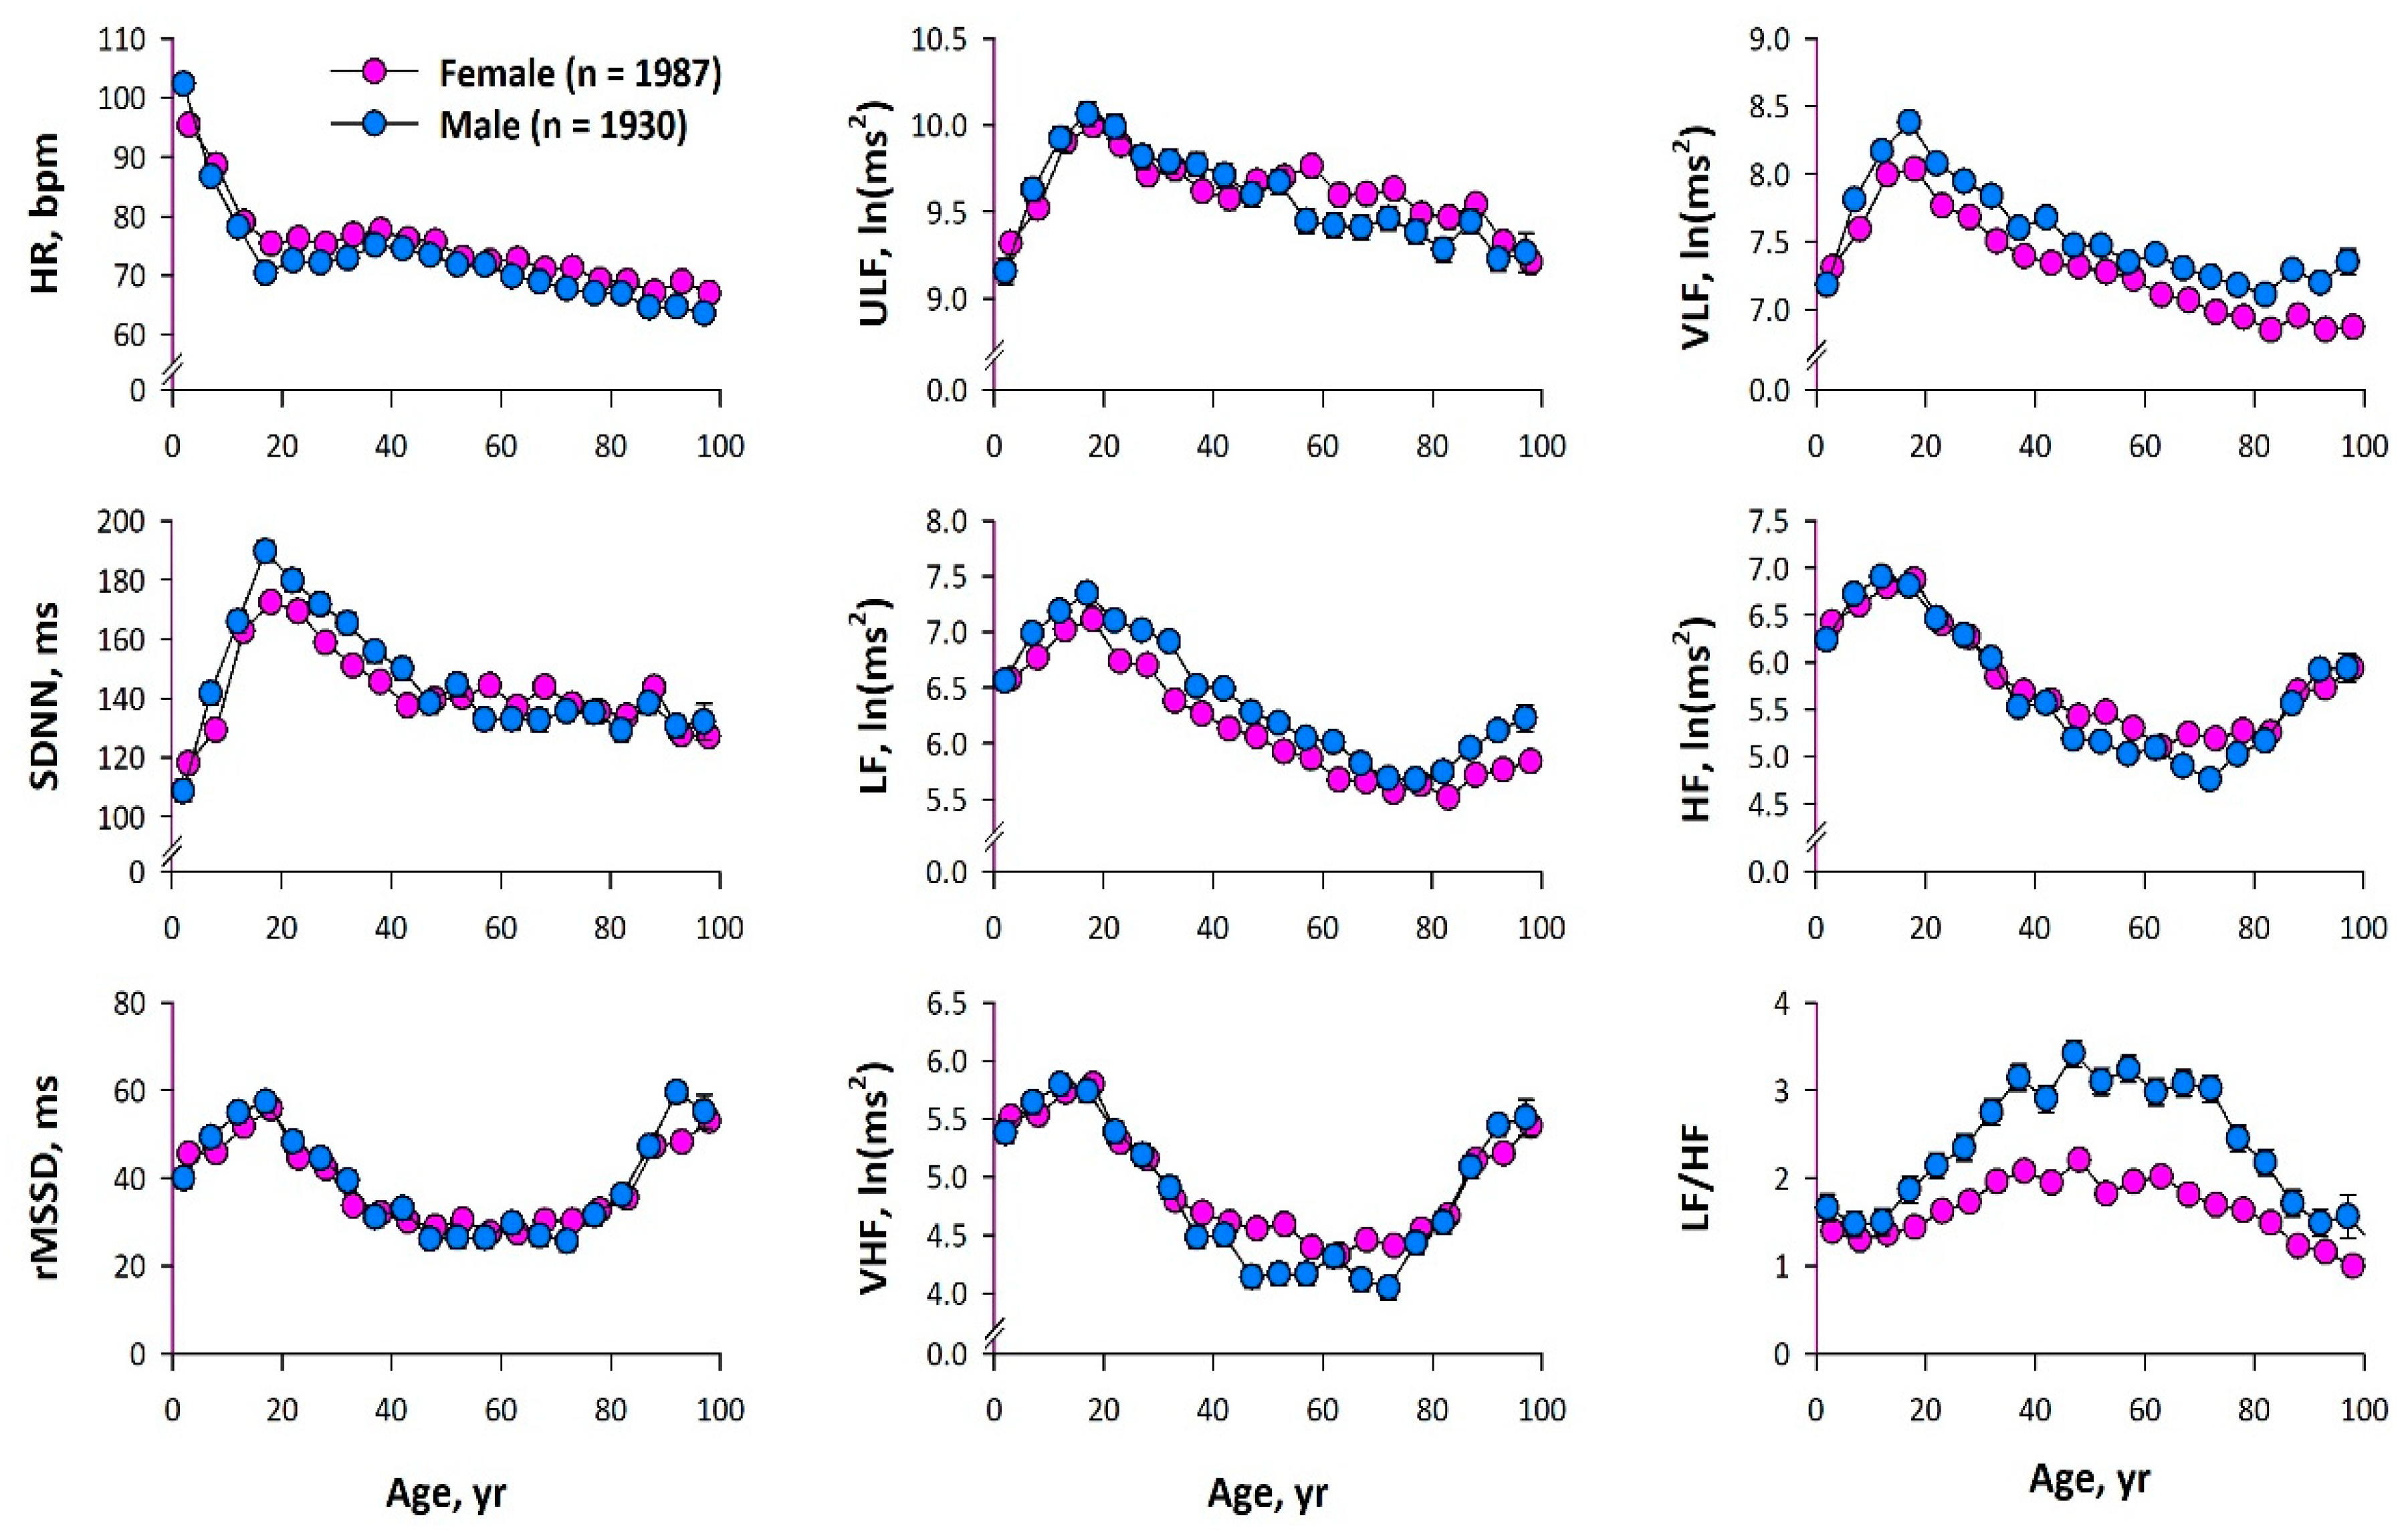
As shown in Figure 6, both time and frequency domain HRV metrics increased after birth up to age 20 in both sexes. Although they decreased with advancing age thereafter, HRV metrics affected by higher frequency oscillation (rMSSD, LF, HF, and VHF) switched from decreasing to increasing at age 75. The increase after age 75 was more pronounced for the HRV metrics in the order of frequency (LF < HF < VHF). There was no significant gender difference in rMSSD or ULF after adjusting for age effects, but VLF and LF were greater in men than in women and HF and VHF were greater in women than in men (Table S1).
3.2. Age and Sex Dependency of HRF Metrics
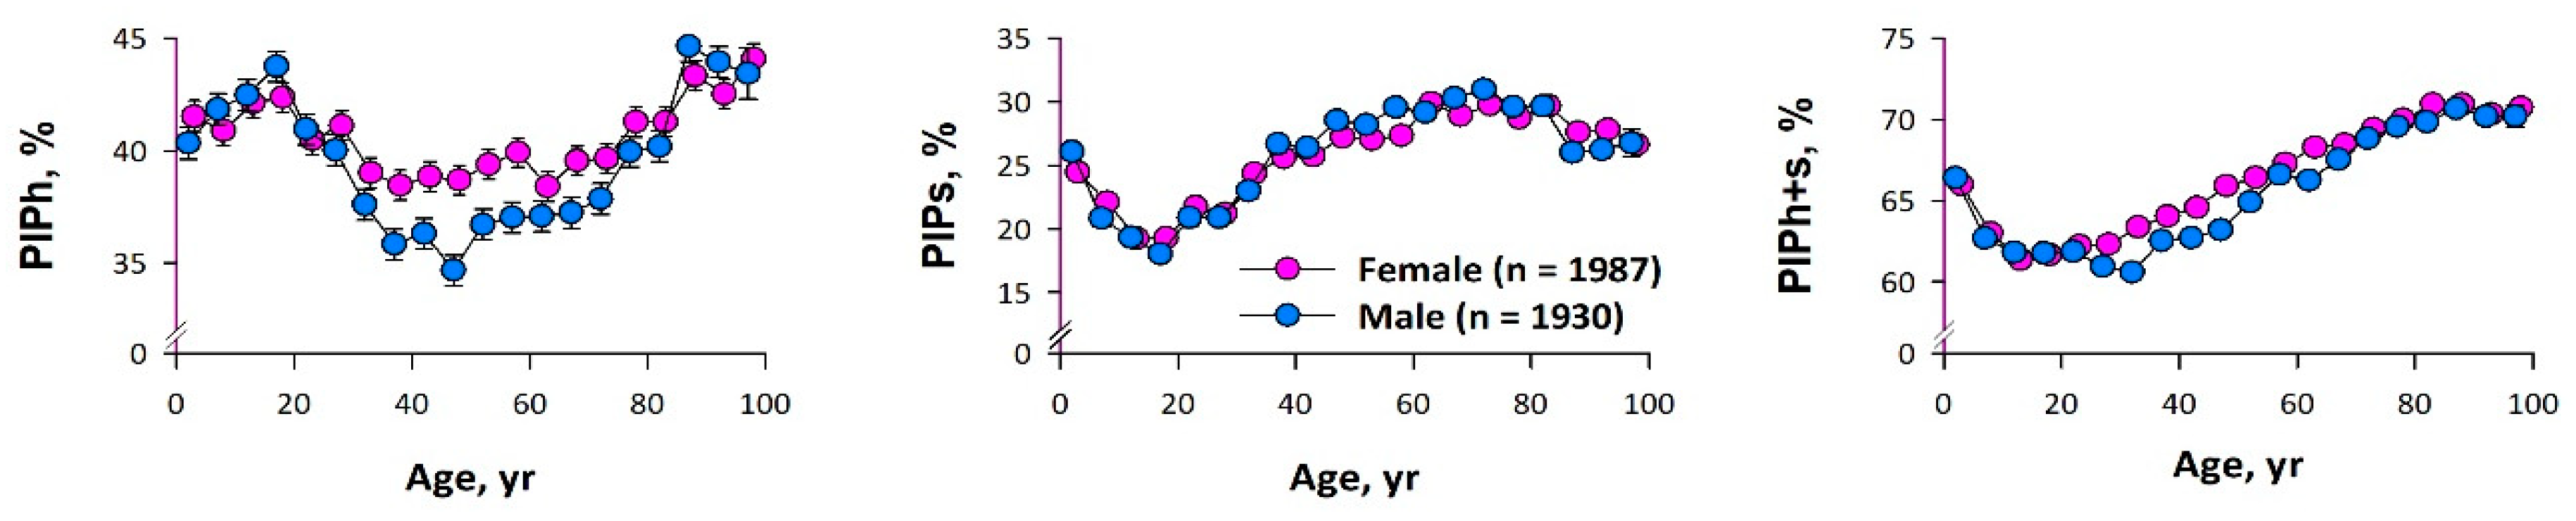
Figure 7 shows the age dependent changes in the three types of PIP in each sex. PIPh increased after birth up to age 20, decreased thereafter, and reached a plateau, but increased again after age 75. PIPs showed changes almost opposite to the age dependence of PIPh. Age-adjusted PIPh was greater in women than in men, but there was no significant difference in PIPs (Table S1).
Figure 8 shows the age dependent changes in the percentage of each word category code of the ∆NN symbolic dynamics. Wh1 and Wh2 increased after birth until age 10–20, decreased thereafter, and reached a plateau and Ws1, Ws2, Ws3, Wm2, and Wm3 showed changes almost opposite to the age dependence of Wh1 and Wh2. Wh3 gradually decreased until middle age, and then increased with age. Although there was no sex difference in age-adjusted mean of Wh1 or Wh3, Wh2, Wm2, and Wm3 were greater in women than in men and the other word categories were greater in men than in women (Supplementary Table S1).
3.3. Relationships among HRF Metrics
Table 2 shows the correlation coefficients among HRF metrics. A negative correlation was observed between PIPh and PIPs. PIPh showed close positive correlations with Wh2 and Wh3 and negative correlations with Ws1, Ws2, Ws3, and Wm2. PIPs showed close positive correlations with Ws1, Ws2, Ws3, Wm2, and Wm3 and negative correlations with Wh2.
3.4. Relationships between HRF and HRV Metrics
To estimate the impact of PIP on the interindividual differences in LF and HF power at each age, the correlations of HRV power with PIPh and PIPs were calculated (Table 3). Both LF and HF power correlated positively with PIPh and negatively with PIPs, but the correlation coefficients between HF power and PIPh exceeded 0.50 at ages 60–90. This indicates that HRF has a large impact (>25% of the variance) on individual difference in HF power in this age range.
4. Discussion
HRF is a type of sinus arrhythmia that should be noted as a potential factor confounding autonomic function evaluation and prognosis prediction by HRV [8], but the factors affecting the occurrence of HRF and the degree of its impact on HRV has been unclear. In the present study, we examined the age and sex dependency of HRF and its impact on HRV metrics using the ALLSTAR database of clinical 24-h Holter ECG big data. We quantified HRF with two types of metrics (PIP and symbolic dynamics word category) concerning the inflection pattern (hard and soft) in NN interval time series. Analysis of 24-h ECG samples with even distribution for all ages (0–100 year) for both genders revealed that the HRV metrics reflecting higher frequency oscillations (rMSSD, LF, HF, and VHF) showed a paradoxical increase after age 75 and that the increase was more pronounced the higher the frequency band (LF < HF < VHF). The similar age dependent changes were observed in the HRF metrics quantifying the occurrence of hard NN interval inflection (PIPh and Wh3), while those quantifying the occurrence of soft inflection (PIPs and Ws2 and Ws3) showed the almost opposite patterns of age dependent change. Additionally, among HRV metrics, age-adjusted HF and VHF were greater in women than in men, and age-adjusted PIPh was also greater in women than in men. Consistent with these, negative correlations were observed between PIPh and PIPs and between word categories reflecting hard and soft inflection points. Both LF and HF power correlated positively with PIPh and negatively with PIPs. The correlation coefficients between HF power and PIPh, however, exceeded 0.50 only at ages 60–90, indicating that HRF has a large impact (>25% of the variance) on individual difference in HF power in this age range.
Although the term HRF was first proposed in 2017 by Costa et al. [5], this phenomenon has long been known in several terms [9,10,11,12,13]. Although HRF is a type of HRV that is defined as the cardiac beat-to-beat cycle length variation of sinus nodal rhythm, HRF has a fundamental difference from conventional HRV. In contrast to conventional HRV that is caused by the physiological modulation of the cardiac intrinsic pacemaker rate through autonomic input to the sinus node, HRF is the pathological variation of the intrinsic pacemaker rate itself, although the occurrence of HRF may be triggered and its nature may be modified by the autonomic input [6].
Earlier studies reported the potential clinical significance of HRF. Woo et al. reported a complex pattern of R-R interval Poincaré plots that is thought to correspond to a type of HRF in patients with advanced heart failure [9] and its association with serum norepinephrine level in 27 patients [10]. Stein et al. defined erratic sinus rhythm as the pattern of Poincaré plots with numerous plots outside an ellipsoid or comet-shaped core and the pattern of HRV FFT spectrum with increased power in band >0.4 Hz (VHF in the present study) [12,13]. They reported that this pattern was associated with increased mortality risk after myocardial infarction. Costa et al. [5,6] reported that the degree of fragmentation measured as PIP and other HRF metrics increased with age in 202 ostensibly healthy subjects and in 271 patients with coronary artery disease. They also reported that the degree of HRF was greater in the cardiac patients than in the healthy subjects. Although our observations of increased PIPh and Wh3 in the elderly are consistent with those of Costa et al. [5,6], the present study also delineated the entire picture of age and sex dependency and the impact of HRF on HRV metrics.
In the present study, we observed a negative correlation between PIPh and PIPs (Table 2). Also, while PIPh showed positive correlations with LF and HF in all age groups, PIPs showed strong negative correlations with LF and HF (Table 3). These indicate that the HRF metric shows the opposite behavior depending on the definition of the inflection point. Although the soft inflection point is defined as the point at which a change in consecutive NN intervals is preceded or followed by unchanged consecutive NN intervals, even changes in consecutive NN intervals if they were below the detection threshold determined by ECG sampling frequency are not detected and are judged unchanged. Conversely, if the change exceeds the threshold, the points that had been defined as a soft inflection point could change to a hard inflection point or a non-inflection point. Therefore, increasing the amplitude of HRF could increase the points where the judgment changes from soft to hard, creating a complementary relationship between PIPs and PIPh. Similarly, increasing the amplitude of LF and HF could increase the points where the judgment changes from soft to non-inflection, creating negative correlations between PIPs and these HRV metrics. Although PIPs may help characterize the dynamic features of NN interval inflections, PIPs itself does not seem to be a measure of the degree of fragmentation, i.e., HRF.
Due to the cross-sectional nature of this study, the causal links between changes in HRF and HRV metrics are not completely clear. In short, the increase in PIPh and Wh3 in the elderly could be the result of increased HF, although this is not consistent with weak correlations between PIPh and HF before age 20. Additionally, aging is accompanied by degenerations of the regulatory network, which has been thought to reduce physiological parasympathetic modulations, such as those controlling heart rate. This is expected to reduce HF and other short-term HRV metrics. Thus, the counterintuitive increase in HF in the elderly seems to be the result but not the cause of increased HRF. Several mechanisms can be considered for the genesis of HRF [5], which include sinus node exit block, subtle atrial bigeminy originating near or within the sinoatrial (SA) node, modulated SA node parasystole caused by multiple interacting pacemaker sites in the SA node [16], and modulated periodicity of pacemaker clock in the SA node [17,18]. Thus, increased HRF may be a marker reflecting the age-related degeneration or pathologic impairment of the SA-node-atrial network for cardiac pacemaker function. Increased HRF in patients with coronary artery disease [5] and its association with adverse cardiovascular events [7] support this contention. Although it is interesting if HRF itself also plays a proarrhythmic role, particularly in the development of atrial fibrillation, it remains to be clarified.
Increasing HRF with age is thought to confound autonomic functional assessment by HRV and to dilute the association between decreased HRV and increased risk for adverse prognosis in the elderly [8]. The principle of the assessment of parasympathetic function by HRV depends on the assumptions that HRV above 0.15 Hz (including HF band) is mediated solely by the cardiac parasympathetic nerve [1] and that HRV in this band is mediated by respiratory fluctuation of autonomic outflow to the sinus node [19,20,21,22]. In the presence of HRF, however, both assumptions may not hold. HFR causes non-autonomous, non-respiratory HRV in the frequency band, well above 0.15 Hz. The HRV that the HRF causes at frequencies of 0.15 to 0.4 Hz is integrated as HF power and leads to an overestimation of parasympathetic function. The present study suggests that a substantial portion of HF power at ages 60–90 may be non-parasympathetic origin. Decreased HRV in 24-h ECG is an increased mortality risk after acute myocardial infarction [2,23,24]. These studies have reported a greater predictive power for HRV metrics that mainly reflects fluctuations at lower frequencies (SDNN and VLF) than those reflecting fluctuations at higher frequencies (rMSSD and HF). This seems resulted from increased HRF in the elderly and in patients with adverse prognosis [7]. These suggest that proper subtraction of the influence of HRF on HRV may improve the usefulness of HRV as an autonomic index and risk predictor. This is an important future research topic.
The possible limitation of the present study may be that the ALLSTAR database is composed of clinical Holter ECG data. All ECG data were recorded for some clinical purpose(s), although only data without ECG abnormality were selected for this study. On the other hand, these data can be regarded as a sample that reflects the general patient population undergoing Holter ECG in Japan. Another potential limitation is that the present findings were obtained from 24-h ECG data. Thus, they may not apply to other equipment or systems. HRF itself, however, could occur in short ECG recordings such as those used for autonomic function assessment by short-term (typically 5 min) HRV [3]. The LF and HF powers obtained from such analyses also need to consider the influence of HRF, especially in elderly subjects. On the other hand, the present observations may not apply to heartbeat interval data estimated from pulse waves. The evaluation of HRF depends on the accuracy of interval measurement, which may not be enough with pulse wave signals.
5. Conclusions
To examine the impact of HRF on HRV, the age and sex dependency of HRF were studies using a clinical 24-h Holter ECG database. The HRV metrics reflecting higher frequency oscillations increase after age 75 and the increase is more pronounced the higher the frequency band (LF < HF < VHF). HRF quantified with PIPh shows the similar age dependent changes. Although both LF and HF power correlate positively with PIPh, close correlations (r > 0.5) are observed only between HF power and PIPh at ages 60–90. HRF has a large impact (>25% of the variance) on individual difference in HF power in this age range.
Supplementary Materials
The following are available online at https://0-www-mdpi-com.brum.beds.ac.uk/2076-3417/10/9/3314/s1, Table S1: Gender difference in heart rate variability and heart rate fragmentation metrics.
Author Contributions
Conceptualization, J.H., N.U., and E.Y.; methodology, J.H.; project administration, J.H., software, M.K.; validation, M.K. and N.U.; writing—original draft preparation, J.H.; writing—review and editing, E.Y.; and funding acquisition, E.Y. All authors have read and agreed to the published version of the manuscript.
Funding
This work was supported by the grant of the Knowledge Hub of Aichi, Japan [the Priority Research Project, P3-G1-S1-2b (J. Hayano)].
Acknowledgments
The ALLSTAR database is maintained by ALLSTAR investigators with technical support by Suzuken Co., Ltd.
Conflicts of Interest
The authors declare no conflict of interest. The funders had no role in the design of the study; in the collection, analyses, or interpretation of data; in the writing of the manuscript, or in the decision to publish the results.
References
- Berger, R.D.; Saul, J.P.; Cohen, R.J. Transfer function analysis of autonomic regulation. I: Canine atrial rate response. Am. J. Physiol. 1989, 256, H142–H152. [Google Scholar] [CrossRef] [PubMed]
- Bigger, J.T., Jr.; Fleiss, J.L.; Steinman, R.C.; Rolnitzky, L.M.; Kleiger, R.E.; Rottman, J.N. Frequency domain measures of heart period variability and mortality after myocardial infarction. Circulation 1992, 85, 164–171. [Google Scholar] [CrossRef] [PubMed] [Green Version]
- Camm, A.J.; Malik, M.; Bigger, J.T., Jr.; Breithardt, G.; Cerutti, S.; Cohen, R.J.; Coumel, P.; Fallen, E.L.; Kleiger, R.E.; Lombardi, F.; et al. Task Force of the European Society of Cardiology and the North American Society of Pacing and Electrophysiology. Heart rate variability: Standards of measurement, physiological interpretation and clinical use. Circulation 1996, 93, 1043–1065. [Google Scholar]
- Hayano, J.; Ohashi, K.; Yoshida, Y.; Yuda, E.; Nakamura, T.; Kiyono, K.; Yamamoto, Y. Increase in random component of heart rate variability coinciding with developmental and degenerative stages of life. Physiol. Meas. 2018, 39, 054004. [Google Scholar] [CrossRef]
- Costa, M.D.; Davis, R.B.; Goldberger, A.L. Heart Rate Fragmentation: A New Approach to the Analysis of Cardiac Interbeat Interval Dynamics. Front. Physiol. 2017, 8, 255. [Google Scholar] [CrossRef] [Green Version]
- Costa, M.D.; Davis, R.B.; Goldberger, A.L. Heart Rate Fragmentation: A Symbolic Dynamical Approach. Front. Physiol. 2017, 8, 827. [Google Scholar] [CrossRef] [Green Version]
- Costa, M.D.; Redline, S.; Davis, R.B.; Heckbert, S.R.; Soliman, E.Z.; Goldberger, A.L. Heart Rate Fragmentation as a Novel Biomarker of Adverse Cardiovascular Events: The Multi-Ethnic Study of Atherosclerosis. Front. Physiol. 2018, 9, 1117. [Google Scholar] [CrossRef]
- Hayano, J.; Yuda, E. Pitfalls of assessment of autonomic function by heart rate variability. J. Physiol. Anthropol. 2019, 38, 3. [Google Scholar] [CrossRef] [Green Version]
- Woo, M.A.; Stevenson, W.G.; Moser, D.K.; Trelease, R.B.; Harper, R.M. Patterns of beat-to-beat heart rate variability in advanced heart failure. Am. Heart J. 1992, 123, 704–710. [Google Scholar] [CrossRef]
- Woo, M.A.; Stevenson, W.G.; Moser, D.K.; Middlekauff, H.R. Complex heart rate variability and serum norepinephrine lelvels in patients with advanced heart failure. J. Am. College Cardiol. 1994, 23, 565–569. [Google Scholar] [CrossRef] [Green Version]
- Binkley, P.F.; Eaton, G.M.; Nunziata, E.; Khot, U.; Cody, R.J. Heart rate alternans. Ann. Intern. Med. 1995, 122, 115–117. [Google Scholar] [CrossRef] [PubMed]
- Stein, P.K.; Domitrovich, P.P.; Hui, N.; Rautaharju, P.; Gottdiener, J. Sometimes higher heart rate variability is not better heart rate variability: Results of graphical and nonlinear analyses. J. Cardiovasc. Electrophysiol. 2005, 16, 954–959. [Google Scholar] [CrossRef] [PubMed]
- Stein, P.K.; Le, Q.; Domitrovich, P.P.; Investigators, C. Development of more erratic heart rate patterns is associated with mortality post-myocardial infarction. J. Electrocardiol. 2008, 41, 110–115. [Google Scholar] [CrossRef] [PubMed] [Green Version]
- Yuda, E.; Furukawa, Y.; Yoshida, Y.; Hayano, J.; ALLSTAR Research Group. Association between regional difference in heart rate variability and inter-prefecture ranking of healthy life expectancy: ALLSTAR Big Data Project in Japan. In Big Data Technologies and Applications: Proceedings of the 7th EAI International Conference, BDTA 2016; Jung, J.J., Kim, P., Eds.; Springer Nature: Seoul, Korea, 2017; pp. 23–28. [Google Scholar]
- Hayano, J.; Yuda, E.; Furukawa, Y.; Yoshida, Y. Association of 24-hour heart rate variability and daytime physical activity: ALLSTAR big data analysis. Int. J. Biosci. Biochem. Bioinform. 2018, 8, 61–67. [Google Scholar] [CrossRef] [Green Version]
- Jalife, J.; Michaels, D.C.; Langendorf, R. Modulated parasystole originating in the sinoatrial node. Circulation 1986, 74, 945–954. [Google Scholar] [CrossRef] [Green Version]
- Yaniv, Y.; Ahmet, I.; Liu, J.; Lyashkov, A.E.; Guiriba, T.R.; Okamoto, Y.; Ziman, B.D.; Lakatta, E.G. Synchronization of sinoatrial node pacemaker cell clocks and its autonomic modulation impart complexity to heart beating intervals. Heart Rhythm 2014, 11, 1210–1219. [Google Scholar] [CrossRef] [Green Version]
- Yaniv, Y.; Lyashkov, A.E.; Lakatta, E.G. Impaired signaling intrinsic to sinoatrial node pacemaker cells affects heart rate variability during cardiac disease. J. Clin. Trials 2014, 4. [Google Scholar] [CrossRef]
- Hayano, J.; Sakakibara, Y.; Yamada, A.; Yamada, M.; Mukai, S.; Fujinami, T.; Yokoyama, K.; Watanabe, Y.; Takata, K. Accuracy of assessment of cardiac vagal tone by heart rate variability in normal subjects. Am. J. Cardiol. 1991, 67, 199–204. [Google Scholar] [CrossRef]
- Hayano, J.; Yasuma, F.; Okada, A.; Mukai, S.; Fujinami, T. Respiratory sinus arrhythmia. A phenomenon improving pulmonary gas exchange and circulatory efficiency. Circulation 1996, 94, 842–847. [Google Scholar] [CrossRef]
- Berntson, G.G.; Bigger, J.T., Jr.; Eckberg, D.L.; Grossman, P.; Kaufmann, P.G.; Malik, M.; Nagaraja, H.N.; Porges, S.W.; Saul, J.P.; Stone, P.H.; et al. Heart rate variability: Origins, methods, and interpretive caveats. Psychophysiology 1997, 34, 623–648. [Google Scholar] [CrossRef]
- Hayano, J.; Yasuma, F. Hypothesis: Respiratory sinus arrhythmia is an intrinsic resting function of cardiopulmonary system. Cardiovasc. Res. 2003, 58, 1–9. [Google Scholar] [CrossRef] [Green Version]
- Kleiger, R.E.; Miller, J.P.; Bigger, J.T., Jr.; Moss, A.J. Decreased heart rate variability and its association with increased mortality after acute myocardial infarction. Am. J. Cardiol. 1987, 59, 256–262. [Google Scholar] [CrossRef]
- Huikuri, H.V.; Makikallio, T.H.; Peng, C.K.; Goldberger, A.L.; Hintze, U.; Moller, M. Fractal correlation properties of R-R interval dynamics and mortality in patients with depressed left ventricular function after an acute myocardial infarction. Circulation 2000, 101, 47–53. [Google Scholar] [CrossRef] [PubMed] [Green Version]
Figure 1.
Analysis of heart rate variability (HRV) under sinus rhythm. HF = high-frequency component (0.15–0.4 Hz), LF = low-frequency component (0.04–0.15 Hz), PSD = power spectral density.
Figure 1.
Analysis of heart rate variability (HRV) under sinus rhythm. HF = high-frequency component (0.15–0.4 Hz), LF = low-frequency component (0.04–0.15 Hz), PSD = power spectral density.

Figure 2.
Relative risk of death predicted by the decrease in HRV frequency components. L/H = LF to HF ratio in power, TP = total power, ULF = ultra-low-frequency component (<0.003 Hz), VLF = very-low-frequency component (0.003–0.04 Hz). Made from Table 2 in reference [2].
Figure 2.
Relative risk of death predicted by the decrease in HRV frequency components. L/H = LF to HF ratio in power, TP = total power, ULF = ultra-low-frequency component (<0.003 Hz), VLF = very-low-frequency component (0.003–0.04 Hz). Made from Table 2 in reference [2].

Figure 3.
Age-dependent changes in HRV frequency components. Made from data from a previous study [4].
Figure 3.
Age-dependent changes in HRV frequency components. Made from data from a previous study [4].

Figure 4.
ECG and R-R intervals showing heart rate fragmentation (HRF). Although ECGs look like sinus rhythm (upper and middle panels), R-R interval trend gram shows periodic dip (lower panel).
Figure 4.
ECG and R-R intervals showing heart rate fragmentation (HRF). Although ECGs look like sinus rhythm (upper and middle panels), R-R interval trend gram shows periodic dip (lower panel).

Figure 5.
R-R interval trend grams and power spectrum of the same case as Figure 4. HRF causes frequent inflection points in R-R interval (upper panel) and forms a spectral peak often in HF band (lower panel).
Figure 5.
R-R interval trend grams and power spectrum of the same case as Figure 4. HRF causes frequent inflection points in R-R interval (upper panel) and forms a spectral peak often in HF band (lower panel).

Figure 6.
Age and sex dependency of the metrics of heart rate variability (HRV). HR = 24-h mean heart rate, SDNN = standard deviation of 24-h normal-to-normal R-R (NN) intervals, rMSSD = root mean square of successive difference in NN intervals, ULF = ultra-low frequency (<0.0033 Hz), VLF = very-low frequency (0.0033–0.04 Hz), LF = low frequency (0.04–0.15 Hz), HF = high frequency (0.15–0.4 Hz), VHF = very-high frequency (0.4–1.0 Hz), LF/HF = LF-to-LF ratio.

Figure 7.
Age and sex dependency of the percentage of hard and soft inflection points (PIPh and PIPs). PIPh+s = PIP calculated for both hard and soft inflection points.
Figure 7.
Age and sex dependency of the percentage of hard and soft inflection points (PIPh and PIPs). PIPh+s = PIP calculated for both hard and soft inflection points.

Figure 8.
Age and sex dependency of the percentage of each word category codes for the symbolic dynamics of four consecutive ∆NN. The definition of word category codes was explained in Table 1.
Figure 8.
Age and sex dependency of the percentage of each word category codes for the symbolic dynamics of four consecutive ∆NN. The definition of word category codes was explained in Table 1.


Table 1.
Classification of all different words of length four by nine category codes.
| Category Code | Words | |||||
|---|---|---|---|---|---|---|
| W0 | AAAA | NNNN | DDDD | |||
| W1h | AAAD | AADD | ADDD | DAAA | DDAA | DDDA |
| W2h | AADA | ADAA | ADDA | DAAD | DADD | DDAD |
| W3h | ADAD | DADA | ||||
| W1s | AAAN | AANN | ANNN | NAAA | NNAA | NNNA |
| NNND | NNDD | NDDD | DNNN | DDNN | DDDN | |
| W2s | NAAN | NANN | AANA | AAND | ANAA | ANNA |
| ANND | ANDD | NNAN | NNDN | NDNN | NDDN | |
| DNAA | DNNA | DNND | DNDD | DDNA | DDND | |
| W3s | ANAN | ANDN | NANA | NAND | NDNA | NDND |
| DNAN | DNDN | |||||
| W2m | ADDN | NDDA | AADN | ADNN | NAAD | NADD |
| NNAD | NNDA | NDAA | DAAN | DANN | DDAN | |
| W3m | ADAN | NADA | NDAD | DADN | ANAD | ANDA |
| ADNA | ADND | NADN | NDAN | DANA | DAND | |
| DNAD | DNDA | |||||
Words consist of four letters representing the beat-to-beat changes in heart rate; A = acceleration, D = deceleration, and N = no change. Category codes consist of letter “W” with the type (h = hard, s = soft, and m = mixed) and number of inflection points within the word.
Table 2.
Correlation coefficients among HRF metrics (N = 3927).
| PIPh | PIPs | PIPh+s | |
|---|---|---|---|
| PIPh | − | −0.73 | 0.35 |
| PIPs | −0.73 | − | 0.39 |
| PIPh+s | 0.35 | 0.39 | − |
| W0 | −0.38 | −0.09 | −0.63 |
| Wh1 | −0.11 | −0.55 | −0.90 |
| Wh2 | 0.85 | −0.84 | −0.01 NS |
| Wh3 | 0.74 | −0.32 | 0.56 |
| Ws1 | −0.86 | 0.79 | −0.09 |
| Ws2 | −0.92 | 0.88 | −0.04 |
| Ws3 | −0.74 | 0.98 | 0.33 |
| Wm2 | −0.70 | 0.90 | 0.29 |
| Wm3 | −0.13 | 0.74 | 0.85 |
Table 3.
Correlation coefficients between HRF and HRV metrics.
| Age | N | PIPh | PIPs | ||
|---|---|---|---|---|---|
| LF | HF | LF | HF | ||
| 0 | 181 | 0.40 | 0.25 | −0.55 | −0.54 |
| 5 | 200 | 0.25 | 0.08 NS | −0.50 | −0.42 |
| 10 | 201 | 0.37 | 0.37 | −0.57 | −0.56 |
| 15 | 201 | 0.27 | 0.33 | −0.46 | −0.53 |
| 20 | 200 | 0.33 | 0.38 | −0.65 | −0.72 |
| 25 | 200 | 0.37 | 0.42 | −0.69 | −0.71 |
| 30 | 202 | 0.34 | 0.43 | −0.67 | −0.75 |
| 35 | 200 | 0.28 | 0.46 | −0.66 | −0.76 |
| 40 | 200 | 0.24 | 0.49 | −0.65 | −0.80 |
| 45 | 200 | 0.14 | 0.49 | −0.57 | −0.75 |
| 50 | 200 | 0.30 | 0.46 | −0.68 | −0.75 |
| 55 | 201 | 0.28 | 0.50 | −0.60 | −0.77 |
| 60 | 200 | 0.39 | 0.60 | −0.66 | −0.77 |
| 65 | 200 | 0.34 | 0.60 | −0.66 | −0.81 |
| 70 | 201 | 0.30 | 0.51 | −0.60 | −0.69 |
| 75 | 202 | 0.35 | 0.56 | −0.60 | −0.74 |
| 80 | 202 | 0.40 | 0.60 | −0.62 | −0.75 |
| 85 | 200 | 0.40 | 0.52 | −0.70 | −0.74 |
| 90 | 200 | 0.42 | 0.53 | −0.64 | −0.72 |
| 95 | 136 | 0.29 | 0.41 | −0.62 | −0.70 |
© 2020 by the authors. Licensee MDPI, Basel, Switzerland. This article is an open access article distributed under the terms and conditions of the Creative Commons Attribution (CC BY) license (http://creativecommons.org/licenses/by/4.0/).
Share and Cite
MDPI and ACS Style
Hayano, J.; Kisohara, M.; Ueda, N.; Yuda, E. Impact of Heart Rate Fragmentation on the Assessment of Heart Rate Variability. Appl. Sci. 2020, 10, 3314. https://0-doi-org.brum.beds.ac.uk/10.3390/app10093314
AMA Style
Hayano J, Kisohara M, Ueda N, Yuda E. Impact of Heart Rate Fragmentation on the Assessment of Heart Rate Variability. Applied Sciences. 2020; 10(9):3314. https://0-doi-org.brum.beds.ac.uk/10.3390/app10093314
Chicago/Turabian StyleHayano, Junichiro, Masaya Kisohara, Norihiro Ueda, and Emi Yuda. 2020. "Impact of Heart Rate Fragmentation on the Assessment of Heart Rate Variability" Applied Sciences 10, no. 9: 3314. https://0-doi-org.brum.beds.ac.uk/10.3390/app10093314
Note that from the first issue of 2016, this journal uses article numbers instead of page numbers. See further details here.