Article

Flexibility Measurement Affecting the Reduction Pattern of Back Muscle Activation during Trunk Flexion

1
Department of Industrial Engineering and Management, Ming Chi University of Technology, New Taipei 24301, Taiwan
2
Department of Industrial Design, Chang Gung University, Touyuan 33302, Taiwan
3
Department of Electrical Engineering, National Central University, Touyuan 32001, Taiwan
*
Author to whom correspondence should be addressed.
Submission received: 10 July 2020 / Revised: 14 August 2020 / Accepted: 27 August 2020 / Published: 28 August 2020

Abstract

:
Numerous studies have been conducted on lower back injury caused by deeper stooped posture, which is associated with the back muscle flexion–relaxation phenomenon (FRP). Individual flexibility also affects FRP; individuals with high flexibility have the benefit of delayed FRP occurrence. This study attempted to determine the most efficient measurement of flexibility for evaluating the occurrence and degree of FRP when participants flexed their trunk forward. We recruited 40 male university students who were grouped on the basis of three flexibility measurements (toe-touch test, TTT; sit-and-reach test, SRT; modified Schober’s test, MST) into three levels (high, middle and low). Muscle activation (thoracic and lumbar erector spinae, TES and LES, respectively; hamstring, HMS) and lumbosacral angle (LSA) were recorded when the trunk flexed forward from 0° (upright) to 15°, 30°, 45°, 60°, 75° and 90°. The results indicated that trunk angle had a significant effect on three muscle activation levels and LSA. The effects of muscles and LSA varied depending on flexibility measurement. TTT significantly discriminated LES electromyography findings between high and low flexibility groups, whereas MST and SRT distinguished between high and non-high flexibility groups. The TTT values positively correlated with the time of LES FRP occurrence, showing that the higher the TTT, the slower the occurrence of FRP. This is beneficial in delaying or avoiding excessive loading on the passive tissue of the lumbar spine when performing a deeper trunk flexion.

1. Introduction

Studies have revealed that awkward posture, excessive exertion and repetitive work are the primary causes of musculoskeletal injuries [1]. This includes exposure of the static upper trunk of humans to deeper flexion postures or prolonged stooping in many workplaces [2,3,4]. Such postures are commonly observed in agriculture, manufacturing, mining and construction industries, which are more likely to employ males than females in Taiwan [5]. Although experts in occupational medicine or ergonomics have called for the use of squatting rather than a stooped posture, a field survey has shown that the stoop is considered to be one of the most effective postures for frontline workers [6,7]. When considering the work experience, however, novices are more inclined to use the stooped working postures than the experienced workers, and this may cause higher injury risks [8,9].
The mechanism of lower back loading is associated with the flexion–relaxation phenomenon (FRP) of the back muscle, which is generated when the human trunk is bent forward. Floyd and Silver [10] were the first to propose the existence of FRP. The reason for the occurrence of FRP is that when the trunk is flexed deeply, the role of back muscles (especially lumbar erector spinae, LES) in balancing the torque generated by the trunk on the lumbar region shifts to the passive tissues of the adjacent lumbar spine. Because identical torque needs to be balanced with a shorter arm, it generates more force on the tissues. FRP generally leads to elongated and even damaged passive tissue of the lumbar spine [11], which may cause lower back injury [12,13]. When FRP occurs as a result of trunk flexion, it may be a warning of lower back injury. To determine the occurrence of FRP, an absolute threshold using maximum voluntary contraction (MVC) from electromyography (EMG) is commonly adopted [2,12]. A threshold of 5% integrated EMG (IEMG) is a typical threshold for MVC, which is then employed for all testing trials to identify the silences in EMG signals. Jin et al. [14] developed an algorithm to identify the onset and cessation of FRP in lower back muscle. However, a generally accepted protocol is that when the trunk is flexed forward, the LES EMG value begins to decrease, and thus FRP occurs [15,16,17,18].
When a person bends the trunk forward from a standing position, the LES and hamstring (HMS) are gradually stretched, which results in FRP. This may imply that individual flexibility in these muscle groups is closely related to FRP. It has been found that when performing identical deep trunk flexion, flexible people exhibited relatively delayed FRP compared with less flexible people [3,19,20]. Hashemirad et al. found that participants with high toe-touch test (TTT) scores had to flex their trunk and rotate their hip more than others, and then back muscle FRP was observed [21]. This may be because flexibility provides spinal stabilization in back muscle recruitment patterns and the central nervous system strategy. In a recent study, Chen et al. found that participant’s TTT scores significantly affected the FRP of back muscles. When the trunk was bent close to 90°, flexible participants produced a greater ES contraction than less flexible participants. The authors speculated that this was because flexible people have a larger range of motion in the trunk, and thus lumbar lordosis could be maintained, resulting in a slighter degree of FRP [20].
Although the effect of flexibility on FRP has been preliminarily confirmed, flexibility is commonly examined using TTT. Different flexibility measurements, however, can be used to evaluate different stretches of body parts. Generally, TTT and sit-and-reach test (SRT) are primarily used to assess the stretch ability of the HMS muscle, although the two involve different postures. Therefore, although the correlation between them is high, they cannot completely substitute each other [22]. Nevertheless, the flexibility measurement has been widely employed in the functional evaluation of patients with lower back pain (LBP) or spinal disease [23,24,25]. Additionally, patients with LBP may experience difficulty with trunk forward flexion due to spine rigidity, and the modified Schober’s test (MST) for measuring lumbar spine mobility has thus become a commonly used clinical indicator [26]. Because FRP mainly occurs in the lumbar muscles, lumbar spine mobility may also affect FRP. However, SRT and MST have not been evaluated in previous FRP studies. To fill the gap, this study was intended to determine the most efficient measurement of flexibility among the three tests for evaluating the occurrence and degree of FRP when participants were requested to statically flex their trunk forward from an upright position (0°) to 90°. The result will serve as a reference for on-site worker recruitment and flexibility training.

2. Materials and Methods

2.1. Participants

A total of 40 healthy male university students with no history of musculoskeletal disorders or injuries were recruited for this study. Prior to the experiment, participants were requested to familiarize themselves with test procedures. All testing procedures were approved by the National Taiwan University in Taiwan (NTU-REC 201712EM014), and all participants provided written consent and received remuneration before the experiment. Table 1 shows the basic data and flexibility measurements of participants.

2.2. Flexibility Measurements and Grouping

Three flexibility measurements were employed: TTT, SRT and MST. For TTT measurement, in line with the method of the previous studies [19,20], participants kept their knees fully extended and tried to touch or overreach the floor baseline with their fingertips (Figure 1a). For SRT measurement, in line with the method of López-Miñarro and Rodríguez-García [22], participants sat with their heels firmly against a fixed wooden box and kept their legs straight, placed one hand on top of the other, and then reached forward as far as they could by moving their fingers along the measuring ruler. How far beyond the toes each participant was able to reach was set as the SRT score (Figure 1b). For MST measurement, in line with the method of Yen et al. [26], participants stood erect while the lumbosacral junction was marked as indicated by the dimples of Venus. A mark 5 cm below and 10 cm above the junction was then made. Participants were then requested to perform their maximum trunk flexion, and the stretched distance between these two points was measured as the MST value (Figure 1c). Each measurement for all participants was repeated twice for the reliability assessment, and the mean values were then included in data analyses. For flexibility grouping, high and low flexibility groups for the TTT were set to be 3 cm below and 3 cm above the floor baseline (i.e., 0 cm), respectively [3]. Besides the TTT, there was no clear-cut point of high and low flexibility for both SRT and MST measurements. The flexibility levels (i.e., high, middle and low) for the three measurements in the study were thus determined based on the average flexibility values, as suggested by the previous studies [3,26,27,28], as well as the sample size and the flexibility allocation.

2.3. Lumbosacral Angle (LSA) Measurements

Prior to data collection, four adhesive reflective markers were attached to participants’ specific joints (i.e., acromial shelf, greater trochanter, lateral epicondyle and lateral malleolus) and two stick markers we applied to specific skin areas (i.e., first lumbar (L1) and first sacral spinous processes (S1); Figure 2). In this study, lumbosacral angle (LSA) was measured when participants stood upright and flexed their trunk to 90° in increments of 15°; the trunk angle was formed by the line linking the acromial shelf and the hip (points S and H, respectively; Figure 2) to the vertical. Each participant’s external LSA (formed by stick markers S1 and L1) at a specific trunk position was subsequently used to calculate the internal LSA according to the prediction equations developed by Chen and Lee [29]. The equations are as follows:
IL1 = 0.9882 × EL1 + 3.6274,    R2 = 0.968
IS1 = 0.7339 × ES1 + 29.6776,    R2 = 0.916
where EL1 and ES1 indicate the respective angles of the external stick markers L1 and S1, respectively. IL1 and IS1 indicate the internal angles. The LSA can be obtained by calculating the angle between IL1 and IS1 [29].
A motion analysis system (Qualisys MacReflex, Göteborg, Sweden) was used and positioned approximately 5 m to the participant’s dominant side and perpendicular to the participant’s sagittal plane to record the 2D marker positions during the test. To ensure that the trunk flexion angle of each participant was in the desired position, the participants were requested to adjust until their trunk line (i.e., line SH, Figure 2) matched with a preset line in the feedback monitor [3].

2.4. Electromyography

This study used an EMG device (TeleMyo 2400, Noraxon, Scottsdale, AZ, USA) to record three muscle group activations (i.e., TES, LES and HMS) on each participant’s dominant side. The procedure of EMG data collection mainly referred to the study of Chen et al. [3]. The pairs of Ag/AgCl surface electrodes (lead-off area, 10 × 10 mm2; center-to-center electrode distance, 25 mm) were parallel-attached on the skin of muscles with adhesive tape to avoid artifacts after standard skin preparation. Before EMG recording, participants performed standardized muscle-specific maximal voluntary contractions (MVCs) to normalize the signals measured for all testing trials. MVC measurement was conducted as suggested by Vera-Garcia et al. [30] and the participants were encouraged to exert the maximum contraction during each MVC measurement, and to hold for 5 s each, with a 3 min rest interval between the measurements. For each muscle tested, participants were requested to perform the MVC three times and the highest value among the three recordings was used as the MVC value for normalization purposes [31]. The EMG signals collected from both MVC tests and experimental trials were filtered (band pass 20–600 Hz), sampled (1200 Hz) and full wave rectified to yield integrated EMG (IEMG) data for a period of 5 s. All muscle IEMG values were presented as percentages of the IEMG MVC data (i.e., %MVC). In addition, to identify FRP occurrence, this study defined the FRP occurrence as when the EMG values of the muscles suddenly reduced between two adjacent trunk angles, as suggested by the previous studies [18,19,20].

2.5. Experimental Design and Procedure

During the test, seven trunk flexions were performed by each participant from 0° to 90° in increments of 15°. In total, 560 test combinations (40 participants × 7 trunk positions × 2 repetitions) were implemented to measure muscle activation and LSA. The participants’ upper body was shirtless, and they performed a natural trunk flexion movement that maintained the symmetrical sagittal plane. Each combination for all participants was repeated twice to examine the measurement’s reliability, and the mean values were used for further analyses. An FRP onset index of each participant’s muscle groups during full trunk flexion was developed and identified, as shown in Figure 3.
The index of FRP onset refers to the trunk angle interval once FRP occurred; this indicates that the muscle group activation in this interval began to exhibit a downward trend. For example, when a participant flexes his trunk in the initial phase, the muscle activity may gradually increase, reaching its maximum at the trunk position of 45°; once muscle activity was lower than that at 60°, the FRP onset was determined as zone 4 (between 45° and 60°) and the rest was inferred by analogy.

2.6. Statistical Analysis

The data comprised three flexibility measurements for each participant, as well as muscle EMG and LSA values under varying trunk flexions. The data were analyzed using SPSS 23.0, and the significance level was set at 0.05. In the analyses, an independent t test was first utilized to examine the measurement reliability and a Pearson product-moment correlation (r) was used to analyze the three individual flexibility values. Analysis of variance (ANOVA) was then employed to determine the effects of independent variables (flexibility and trunk angle) on the responses, and a Duncan’s multiple range test (MRT) was used to examine the differences between levels when the independent variable was significant. In addition, to identify the FRP onset index of two back muscles (TES and LES) among three flexibility measurements (TTT, SRT and MST), a Pearson product-moment correlation was also used.

3. Results

The reliability of the repeated measurements of each flexibility measurement, muscle activation and LSA for all participants was higher than 0.826 using an independent t test (all p < 0.05). This indicates that the consistency of the data collected in the study was satisfactory.

3.1. Flexibility Grouping and Correlation between Grouped Flexibilities

All the participants’ flexibility values from three measurements are shown in Table 1. The average TTT value was 0.1 cm, which is almost equal to the middle flexibility defined by Shin et al. [19] and Chen et al. [20]. Similarly, the averaged SRT value was 0.9 cm, which is also close to the point differentiating between high and low levels [28]. Atilgan et al. [27] measured MST in 98 Turkish university students, and found that the average MST value was 6.6 cm, which is similar to that in our study (6.8 cm). Table 2 presents the grouping results and sample sizes for participants with different flexibility levels. The grouping was considered mainly based on the average flexibility of three measurements (Table 1), with the average score obtained for the middle flexibility group. The sample size of each group had to be greater than or equal to 12, and less than or equal to 15, to ensure that each group had a sufficient sample and to minimize any variation in sample size among the groups. As shown in Table 3, the correlation between TTT and SRT was the highest (r = 0.810, p < 0.001), and the correlations of MST with TTT and SRT were 0.485 (p < 0.01) and 0.459 (p < 0.01), respectively.

3.2. Two-Way Analysis of Variance (ANOVA) Results

As shown in Table 4, the trunk angle affected all responses (TES, LES, HMS and LSA; all p < 0.001). Because all interactions were nonsignificant (all p > 0.05), the main effects were confirmed. The significance of muscle activities and LSA varied according to the flexibility measurement. TTT and SRT revealed a similar result, indicating that all muscle EMGs and LSA were significantly affected by the flexibility group, whereas MST exhibited differences only in LES and HMS activations.
Table 5 presents the Duncan MRT grouping results for responses under varying trunk angles. Because these were averaged across the other variable, the results are shown regardless of which flexibility measurement was grouped. Figure 4 illustrates the alterations in the muscle EMG values of each trunk position. When participants flexed their trunk forward from upright to 45°, the activations of all three muscles increased. As trunk flexion continued, the LES EMG began to decrease first, followed by TES EMG after 60° and the HMS EMG after 75°. Table 5 also shows the changes in LSA during trunk flexion, indicating that LSA was close to 40° when the participant was standing upright, and then gradually decreased with more trunk flexion, becoming negative when the trunk was flexed at 90°. Table 6 presents the Duncan grouping results for each variable under different flexibility levels. As shown, different flexibility groups (i.e., high, middle and low) cause different degrees of LES activations. TTT can significantly discriminate the difference in LES activations between groups with high and low flexibilities, whereas MST and SRT can discriminate between groups with high and non-high flexibilities. Figure 5 further illustrates LES EMG alterations at varying trunk flexions for three flexibility grouping methods. Differences in the EMG alterations were more notable among the measurements when the trunk was flexed between 45° and 75°.

3.3. FRP Onset Index for Flexibility Measurements

Table 7 illustrates the correlations of the FRP onset index with back muscle activation using three measurement methods. As shown, TTT was significantly positively correlated with the FRP onset index of the TES (r = 0.365, p < 0.05) and LES (r = 0.553, p < 0.01). By contrast, the SRT and MST measurements only correlated with the FRP onset index in the TES.

4. Discussion

The aim of this study was to determine which flexibility measurement was best able to predict the corresponding FRP. The results indicated that TTT can significantly discriminate differences in LES FRP between high and low flexibility groups, and a positive correlation with the FRP onset was also found. This suggests that the higher the TTT, the slower the occurrence of FRP. The TTT could be considered as an appropriate tool for on-site worker recruitment and flexibility training when work requires a deeper trunk flexion.
The correlations between MST and TTT, and MST and SRT, were relatively low, which may be because MST primarily measures lumbar spine flexibility. Regardless of whether the original Schober’s test or MST used in this study is employed, it has been developed to detect patients with LBP such as ankylosing spondylitis (AS) [32]. Typical early symptoms include chronic low back pain and spinal stiffness, which cause difficulty in trunk bending [33]. The Schober’s test is commonly used and is useful for screening the status of AS disease, and also for determining the progression and therapeutic effects of AS [34,35]. In a validation study utilizing a Taiwanese sample, Yen et al. [26] further clarified that the original Schober’s test strongly correlated with MST measurements. Compared with TTT and SRT, which involve different extensibilities of muscle groups throughout the body, especially the HMS, MST only evaluates lumbar spine mobility, which results in a lower correlation with TTT and SRT.
To assess the flexibility of the HMS muscle, field tests such as TTT and SRT are commonly used in sports training and physical fitness evaluation. The procedures of these measurements are simple, easy to administer, and have minimal skill requirements [36]. However, López-Miñarro and Rodríguez-García [22] have identified significant differences in thoracic and lumbar spine postures; this may have affected the validity of the measurement and resulted in a correlation coefficient of 0.55–0.61 for TTT and SRT. Ayala et al. [37] also found that the corresponding correlation coefficient for young Spanish men and women (average 21 years) was 0.829 (p < 0.001), which was similar to the results of this study. Although the body postures between the two measurements appeared to be alike, it is difficult for them to replace each other. One of the possible reasons for this is that the sitting posture of the SRT anteriorly limits the rotation of the pelvis during measurement, and causes differences in postures between the thoracic and lumbar spine [28]. López-Miñarro et al. compared lumbar and thoracic spine angles during TTT and SRT measurements, and found that although the lumbar spine angles of the two were not significantly different, the difference in thoracic spine angle was approximately 8°, which can be attributed to the effect of the pelvis being restricted [28].
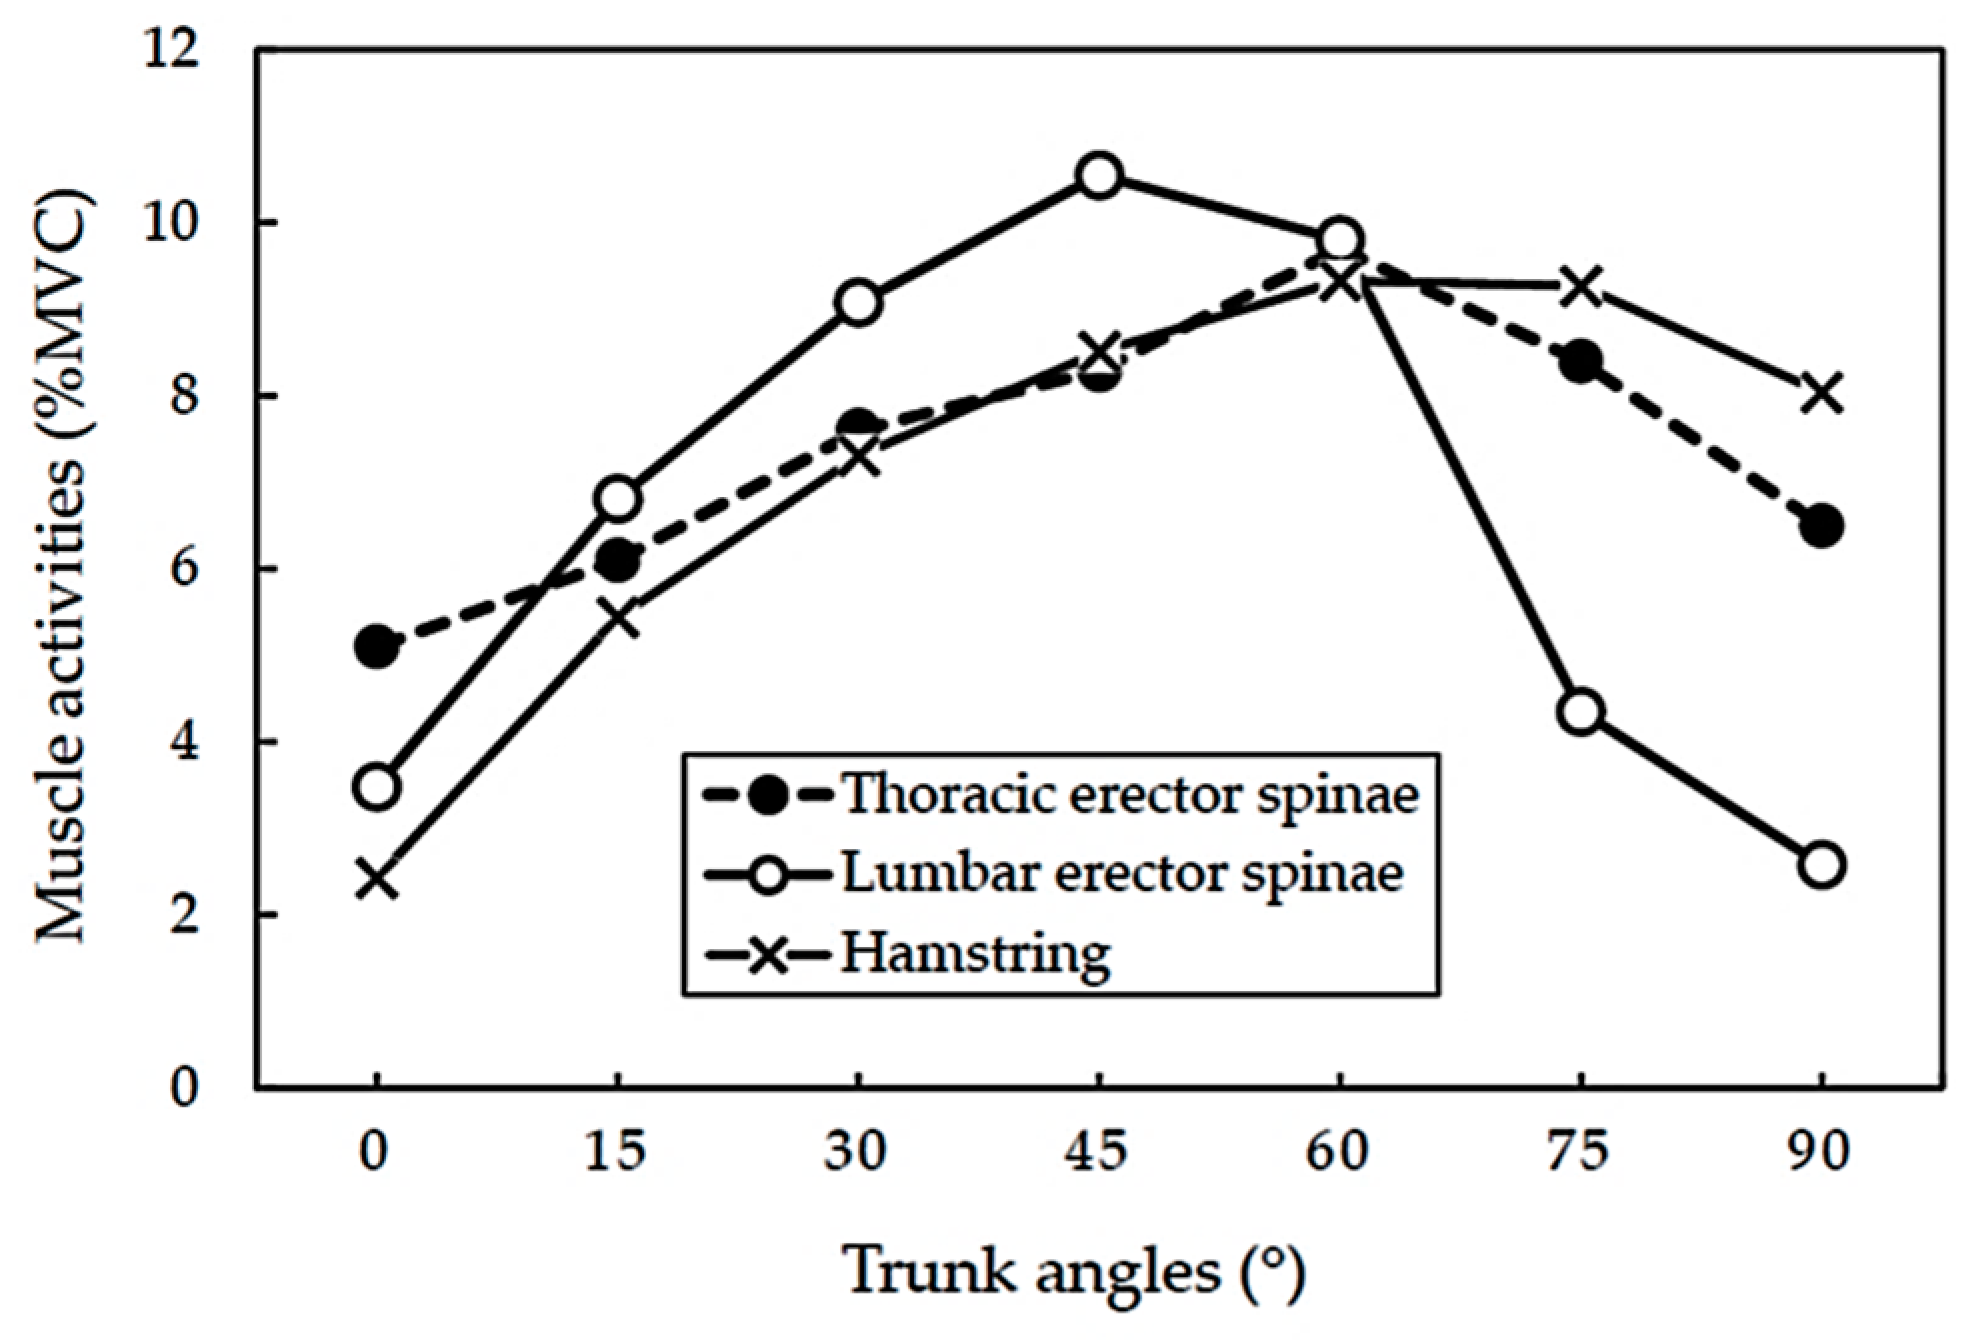
In the current study, when participants flexed their trunk from upright to 45°, all muscle EMG values gradually increased as the trunk angle increased (TES: 5.1–8.3 %MVC, LES: 3.5–10.6 %MVC, HMS: 2.4–8.5 %MVC). Once the trunk was flexed beyond 45°, FRP occurred first at LES (10.6–9.8 %MVC), followed by TES (60°, 9.7–8.4 %MVC) and then HMS (75°, 9.3–8.0 %MVC), as shown in Figure 4. This indicates a time sequence in the occurrence of FRP among the three muscle groups. This may be due to the roles these muscle groups play. Nordin et al. [38] observed that in normal trunk flexion, the lumbar vertebral bodies bend forward during the first 50°–60°, and after that, the pelvis rotates anteriorly. At approximately 75–85% trunk flexion, the lumbar spine reaches its maximum range of motion, while the pelvis undergoes terminal flexion to accomplish total trunk flexion [15]. At this stage, passive soft tissues that are noncontractile, such as intervertebral discs and intervertebral ligaments, begin to provide most of the spinal support and reduce the back muscle activation to maintain the posture [12,15]. This leads to the occurrence of FRP. It can be inferred that the FRP of the HMS would occur after the occurrence of back muscle FRP. Sihvonen examined the LES and HMS EMGs during trunk flexion, and found that the TES FRP occurred when the trunk was bent forward at about 80°, whereas the HMS FRP occurred at almost full trunk flexion [39]. This implies that when the trunk is bent forward, in addition to the elongation of back muscles, the HMS, which is closely related to pelvic movement, is subsequently elongated, and FRP occurs. This has been confirmed by several recent studies [3,20].
Gupta found that when TES FRP occurs, all participants display more active HMS contraction. Our result is consistent with that of Gupta, in which the trunk was flexed forward from 45° to 75° [16]. Gupta postulated that increased HMS contraction occurs because the pelvis turns to stabilize the spine. Figure 4 shows that the TES FRP occurred after the LES and before the HMS. During trunk flexion, the contribution of lumbar spine bending is greater than that of the thoracic spine [40], which explains why TES EMG was relatively low at the first 30° of trunk flexion. LSA was maintained at approximately 40° when the trunk was upright. Once flexion began, it gradually decreased until it eventually became negative at 90°. Thus, the lumbar spine changed from lordotic, converting into a kyphotic posture [20]. Furthermore, when LSA dropped to about 20°, and the trunk was flexed at 45°, LES FRP began to occur.
Different flexibility levels had a significant effect on LES activation for all three measurements (all p < 0.05, Table 4). This verified that individual flexibility (high, middle and low) caused different degrees of contraction of LES, within which TTT significantly distinguished groups with high and low flexibility, whereas MST and SRT distinguished between high and non-high flexibility groups (high vs. middle and low), as shown in Table 6. In previous studies on flexibility and FRP, investigators have tended to employ TTT to classify flexibility levels [3,19,21], and have demonstrated that participants with high and low flexibility exhibit different FRP patterns; however, they rarely evaluated participants whose flexibility was within the full range. The results of this study regarding TTT and FRP conform to those of previous studies, which indicates that compared with the TTT, MST and SRT may be appropriate for discriminating between high and non-high flexibility classifications in FRP assessment.
This study suggests that flexibility grouped by MST did not exert a significant effect on LSA, which was different from the results for TTT and SRT. This is because the measurements of TTT and SRT examine whole-body extensibility, and include the ability to stretch and soften joint tissues, muscles, tendons and ligaments, that is, the joint mobility of various body parts and tissues [41]. By contrast, MST primarily measures lumbar spine mobility, and the HMS is almost absent. Because LSA is affected by pelvic rotation, and HMS is a crucial factor affecting lumbopelvic movement [16,42], this may mean that LSA is not affected by the flexibility groups identified by MST measurement. However, past studies have found that LSA affected back muscle activation [43], which can cause different lumbar spine extension forces to have different effects on FRP.
This study is the first attempt at developing an onset indicator to quantify the definition of FRP. Determining when FRP occurs is more practical and meaningful. From the perspective of occupational ergonomics, when a flexible worker engages in a deep trunk flexion posture, they bear a relatively low spinal load. This is useful for the prevention of possible lower back injury on site. In this study, when TTT was used to classify the flexibility group, a significant positive correlation was found between LES FRP onset and the flexibility value (r = 0.553, p < 0.01). The higher the TTT value, the slower the FRP occurrence, which means that FRP can be delayed or even avoided in specific trunk postures. Compared with TTT, the methods of measuring MST and SRT were positively correlated only with the FRP onset of the TES (r = 0.388–0.399, all p < 0.05). Regarding the HMS, no correlation was observed between the flexibility value and the FRP onset, regardless of the measurement of flexibility. This is reasonable because HMS FRP occurs in the final stage of trunk flexion [39]. These findings provide a practical reference for screening and health training employees who require deeper trunk flexion during their daily work.
Several study limitations should be highlighted. The sample size (40 young male participants) in this study is relatively small because the sample was divided into three flexibility groups and then analyzed, even though the results may be significant. The results could not be applicable to the female population because of the inherent difference in flexibility between the genders [44]. Another concern in the study was that static trunk positions were examined, and the results should be further verified through a test of dynamic trunk movement. Because specific trunk positions were performed by the participants, the FRP occurrence was judged by these trunk flexion ranges, instead of a distinct trunk angle. In addition, besides the TTT, the flexibility levels (i.e., high, middle and low) in the study were determined based on the average flexibility values, as suggested by the previous studies, as well as the sample size and the flexibility allocation. This merits further investigation.

5. Conclusions

The objective of this study was to find the most efficient flexibility test for evaluating the occurrence and degree of FRP when participants flexed their trunks forward. The main findings in this study were that the TTT measurement method can efficiently determine the difference in LES FRP between flexible and less flexible participants, whereas the MST and SRT can distinguish between high and non-high flexibility groups. This implies that the MST and SRT could not clearly identify the less flexible group, who may be exposed to higher LBP risks based on this FRP study result. In addition, the TTT value was positively correlated with the FRP onset of the lower back muscle, showing that the higher the TTT value, the later the occurrence of FRP. This is beneficial in delaying or even avoiding excessive stress acting on the passive tissues of the lumbar spine when deeper trunk flexion is performed.

Author Contributions

Conceptualization, methodology, Y.-L.C.; formal analysis, investigation and data curation, Y.-M.H., Y.-C.C., and T.-C.W.; writing—original draft preparation and review and editing, Y.-L.C.; project administration and funding acquisition, Y.-L.C.; validation and visualization, Y.C. All authors have read and agreed to the published version of the manuscript.

Funding

This research was partially supported by the Ministry of Science and Technology, Taiwan, MOST107-2221-E-131-021-MY3, and also the APC of this article.

Acknowledgments

The authors wish to acknowledge all respondents and participants for their support of the study.

Conflicts of Interest

The authors declare no conflict of interest.

References

  1. Keyserling, W.M. Workplace risk factors and occupational musculoskeletal disorders, Part 2: A review of biomechanical and psychophysical research on risk factors associated with upper extremity disorders. Am. Ind. Hyg. Assoc. J. 2000, 61, 231–243. [Google Scholar] [CrossRef]
  2. Shin, G.; D’souza, C.; Liu, Y.H. Creep and fatigue development in the low back in static flexion. Spine 2009, 34, 1873–1878. [Google Scholar] [CrossRef] [PubMed]
  3. Chen, Y.L.; Lin, W.C.; Chen, Y.; Wen, Y.W.; Tsai, T.L.; Yan, S.Q. Effect of wearing jean on back muscle flexion-relaxation phenomenon. Int. J. Ind. Ergon. 2020, 76, 102938. [Google Scholar] [CrossRef]
  4. Ulrey, B.L.; Fathallah, F.A. Evaluation of a personal device in reducing the risk of low back disorders during stooped work. Work 2012, 41, 2381–2383. [Google Scholar] [CrossRef] [Green Version]
  5. Institute of Labor and Occupational Safety and Health (ILOSH). Survey of Perceptions of Safety and Health in the Work Environment in 2016 Taiwan; Project no. ILOSH105-M309; ILOSH: New Taipei, Taiwan, 2017.
  6. Baril-Gingras, G.; Lortie, M. The handling of objects other than boxes: Univariate analysis of handling techniques in a large transport company. Ergonomics 1995, 38, 905–925. [Google Scholar] [CrossRef]
  7. Jin, S.; McCulloch, R.; Mirka, G.A. Biomechanical evaluation of postures assumed when harvesting from bush crops. Int. J. Ind. Ergon. 2009, 39, 347–352. [Google Scholar] [CrossRef] [Green Version]
  8. Chen, Y.L.; Lee, Y.C.; Chen, C.J. Differences in lifting strength profiles between experienced workers and novices at various exertion heights. Int. J. Ind. Ergon. 2011, 41, 53–58. [Google Scholar] [CrossRef]
  9. Plamondon, A.; Delisle, A.; Bellefeuille, S.; Denis, D.; Gagnon, D.; Larivière, C.; IRSST MMH Research Group. Lifting strategies of expert and novice workers during a repetitive palletizing task. Appl. Ergon. 2014, 45, 471–481. [Google Scholar] [CrossRef]
  10. Floyd, W.F.; Silver, P.H.S. Function of erector spinae in flexion of the trunk. Lancet 1951, 257, 133–134. [Google Scholar] [CrossRef]
  11. Zwambag, D.P.; Brown, S.H. Experimental validation of a novel spine model demonstrates the large contribution of passive muscle to the flexion relaxation phenomenon. J. Biomech. 2019, 109431. [Google Scholar] [CrossRef]
  12. McGill, S.M.; Kippers, V. Transfer of loads between lumbar tissues during the flexion-relaxation phenomenon. Spine 1994, 19, 2190–2196. [Google Scholar] [CrossRef] [PubMed]
  13. Solomonow, M.; Baratta, R.V.; Banks, A.; Freudenberger, C.; Zhou, B.H. Flexion-relaxation response to static lumbar flexion in males and females. Clin. Biomech. 2003, 18, 273–279. [Google Scholar] [CrossRef]
  14. Jin, S.; Ning, X.; Mirka, G.A. An algorithm for defining the onset and cessation of the flexion-relaxation phenomenon in the low back musculature. J. Electromyogr. Kinesiol. 2012, 22, 376–382. [Google Scholar] [CrossRef] [PubMed] [Green Version]
  15. Schultz, A.B.; Haderspeck-Grib, K.; Sinkora, G.; Warwick, D.N. Quantitative studies of the flexion-relaxation phenomenon in the back muscles. J. Orthop. Res. 1985, 3, 189–197. [Google Scholar] [CrossRef]
  16. Gupta, A. Analyses of myo-electrical silence of erectors spinae. J. Biomech. 2001, 34, 491–496. [Google Scholar] [CrossRef]
  17. Descarreaux, M.; Lafond, D.; Cantin, V. Changes in the flexion-relaxation response induced by hip extensor and erector spinae muscle fatigue. BMC Musculoskel. Dis. 2010, 11, 112. [Google Scholar] [CrossRef] [Green Version]
  18. Alessa, F.; Ning, X. Changes of lumbar posture and tissue loading during static trunk bending. Hum. Mov. Sci. 2018, 57, 59–68. [Google Scholar] [CrossRef]
  19. Shin, G.; Shu, Y.; Li, Z.; Jiang, Z.; Mirka, G. Influence of knee angle and individual flexibility on the flexion–relaxation response of the low back musculature. J. Electromyogr. Kinesiol. 2004, 14, 485–494. [Google Scholar] [CrossRef]
  20. Chen, Y.L.; Lin, W.C.; Liao, Y.H.; Lin, C.J. Effect of individual flexibility and knee posture on the back muscle flexion-relaxation phenomenon. Int. J. Ind. Ergon. 2018, 68, 82–88. [Google Scholar] [CrossRef]
  21. Hashemirad, F.; Talebian, S.; Hatef, B.; Kahlaee, A.H. The relationship between flexibility and EMG activity pattern of the erector spinae muscles during trunk flexion–extension. J. Electromyogr. Kinesiol. 2009, 19, 746–753. [Google Scholar] [CrossRef]
  22. López-Miñarro, P.A.; Rodríguez-García, P.L. Hamstring muscle extensibility influences the criterion-related validity of sit-and-reach and toe-touch tests. J. Strength Cond. Res. 2010, 24, 1013–1018. [Google Scholar] [CrossRef] [PubMed]
  23. Jackson, A.W.; Morrow, J.R., Jr.; Brill, P.A.; Kohl III, H.W.; Gordon, N.F.; Blair, S.N. Relations of sit-up and sit-and-reach tests to low back pain in adults. J. Orthop. Sports Phys. Ther. 1998, 27, 22–26. [Google Scholar] [CrossRef] [PubMed]
  24. Aartun, E.; Hartvigsen, J.; Hestbaek, L. Validity of commonly used clinical tests to diagnose and screen for spinal pain in adolescents: A school-based cohort study in 1300 Danes aged 11–15 years. J. Manip. Physiol. Ther. 2016, 39, 76–87. [Google Scholar] [CrossRef] [PubMed]
  25. Eyvazov, K.; Samartzis, D.; Cheung, J.P.Y. The association of lumbar curve magnitude and spinal range of motion in adolescent idiopathic scoliosis: A cross-sectional study. BMC Musculoskelet. Disord. 2017, 18, 51. [Google Scholar] [CrossRef] [PubMed] [Green Version]
  26. Yen, Y.R.; Luo, J.F.; Liu, M.L.; Lu, F.J.; Wang, S.R. The anthropometric measurement of Schober’s test in normal Taiwanese population. Biomed. Res. Int. 2015. [Google Scholar] [CrossRef] [Green Version]
  27. Atilgan, E.; Tarakci, D.; Mutluay, F. Examining the postural awareness and flexibility changes in physical therapy students who took clinical Pilates class. Pak. J. Med. Sci. 2017, 33, 640. [Google Scholar] [CrossRef]
  28. López-Miñarro, P.A.; de Baranda Andújar, P.S.; García, P.L.R.; Toro, E.O. A comparison of the spine posture among several sit-and-reach test protocols. J. Sci. Med. Sport 2007, 10, 456–462. [Google Scholar] [CrossRef]
  29. Chen, Y.L.; Lee, Y.H. A noninvasive protocol for the determination of lumbosacral vertebral angle. Clin. Biomech. 1997, 12, 185–189. [Google Scholar] [CrossRef]
  30. Vera-Garcia, F.J.; Moreside, J.M.; McGill, S.M. MVC techniques to normalize trunk muscle EMG in healthy women. J. Electromyogr. Kinesiol. 2010, 20, 10–16. [Google Scholar] [CrossRef]
  31. Yavuz, Ş.U.; Şendemir-Ürkmez, A.; Türker, K.S. Effect of gender, age, fatigue and contraction level on electromechanical delay. Clin. Neurophysiol. 2010, 121, 1700–1706. [Google Scholar] [CrossRef]
  32. Viitanen, J.V.; Kautiainen, H.; Suni, J.; Kokko, M.L.; Lehtinen, K. The relative value of spinal and thoracic mobility measurements in ankylosing spondylitis. Scand. J. Rheumatol. 1995, 24, 94–97. [Google Scholar] [CrossRef] [PubMed]
  33. Bollow, M.; Hermann, K.A.; Biedermann, T.; Sieper, J.; Schöntube, M.; Braun, J. Very early spondyloarthritis: Where the inflammation in the sacroiliac joints starts. Ann. Rheum. Dis. 2005, 64, 1644–1646. [Google Scholar] [CrossRef] [PubMed]
  34. Leung, Y.Y.; Ho, K.W.; Tam, L.S.; Zhu, T.Y.; Kwok, L.W.; Li, T.K.; Kun, E.W.; Li, E.K. Evaluation of spinal mobility measurements in predicting axial psoriatic arthritis. Clin. Rheumatol. 2011, 30, 1157–1162. [Google Scholar] [CrossRef] [PubMed]
  35. Kiyak, E. The impact of wool in the patients with chronic non-specific low back pain. Coll. Antropol. 2012, 36, 623–626. [Google Scholar]
  36. Hui, S.C.; Yuen, P.Y. Validity of the modified back-saver sit-and reach test: A comparison with other protocols. Med. Sci. Sports Exerc. 2000, 32, 1655–1659. [Google Scholar] [CrossRef]
  37. Ayala, F.; de Baranda, P.S.; Croix, M.D.S.; Santonja, F. Reproducibility and criterion-related validity of the sit and reach test and toe touch test for estimating hamstring flexibility in recreationally active young adults. Phys. Sport 2012, 13, 219–226. [Google Scholar] [CrossRef]
  38. Nordin, M.; Weiner, S.S.; Lindh, M. Biomechanics of the Lumbar Spine. In Basic Biomechanics of the Musculoskeletal System; Nordin, M., Frankel, V., Eds.; Lippincott Williams and Wilkins: Philadelphia, PA, USA, 2001. [Google Scholar]
  39. Sihvonen, T. Flexion relaxation of the hamstring muscles during lumbar-pelvic rhythm. Arch. Phys. Med. Rehabil. 1997, 78, 486–490. [Google Scholar] [CrossRef]
  40. Davis, P.R.; Troup, J.D.G.; Burnard, J.H. Movements of the thoracic and lumbar spine when lifting: A chrono-cyclophotographic study. J. Anat. 1965, 99, 13–26. [Google Scholar]
  41. Tudor, V. Conditional, Coordinating and Intermediate Capacities-Components of Motor Capacity; RAI Publishing House: Bucharest, Romania, 1999. [Google Scholar]
  42. Babault, N.; Bazine, W.; Deley, G.; Paizis, C.; Lattier, G. Acute effects of static stretching on isokinetic torque production are directly related to the initial flexibility level. Int. J. Sports Physiol. Perform. 2014, 2, 121–126. [Google Scholar]
  43. Chen, Y.L. Vertebral centroid measurement of lumbar lordosis compared with the Cobb technique. Spine 1999, 24, 1786–1790. [Google Scholar] [CrossRef]
  44. Cornbleet, S.L.; Woolsey, N.B. Assessment of hamstring muscle length in school-aged children using the sit-and-reach test and the inclinometer measure of hip joint angle. Phys. Ther. 1996, 76, 850–855. [Google Scholar] [CrossRef] [PubMed] [Green Version]
Figure 1. The three flexibility measurements employed in this study: (a) toe-touch test; (b) sit-and-reach test; (c) modified Schober’s test.
Applsci 10 05967 g001
Figure 2. Schematic of marker locations and body angles utilized in this study.
Applsci 10 05967 g002
Figure 3. An FRP onset index of muscles used in this study during full trunk flexion.
Applsci 10 05967 g003
Figure 4. Alterations of the TES, LES and HMS muscles under varying trunk flexions (%MVC, percentage of MVC data).
Applsci 10 05967 g004
Figure 5. LES EMG alterations at varying trunk flexions for three flexibility grouping methods (%MVC, percentage of MVC data).
Applsci 10 05967 g005
Table 1. Anthropometric data and the flexibility values of participants in the study.
VariablesMeanStandard DeviationRange
Age (years)20.00.419.0–21.0
Height (cm)172.23.9166.0–179.0
Weight (kg)63.54.555.0–73.0
Acromial height (cm)139.53.7134.0–146.5
Knuckle height (cm)71.73.066.0–78.0
Hip height (cm)88.92.784.0–93.8
Knee height (cm)44.02.140.5–47.5
Toe-touch test, TTT (cm)0.111.4−26.0–30.0
Sit-reach test, SRT (cm)0.99.9−24.0–21.6
Modified Schober’s test, MST (cm)6.81.14.5–9.2
Table 2. Criteria for classifying the flexibility levels.
FlexibilityTTT (cm)nSRT (cm)nMST (cm)n
High3.2–30.0155.1–21.6157.5–9.212
Middle−2.5–−2.112−0.5–4.6136.3–7.014
Low−26.0–−3.013−24.0–−3.5124.5–6.214
Notes: TTT—toe-touch test, SRT—sit-and-reach test, MST—modified Schober’s test, n—sample size.
Table 3. Pearson correlations among the flexibility tests.
ComparisonsrSignificance
TTT vs. MST0.485p < 0.01
TTT vs. SRT0.810p < 0.001
MST vs. SRT0.459p < 0.01
Notes: TTT—toe-touch test, SRT—sit-and-reach test, MST—modified Schober’s test.
Table 4. Main effects of the variables for three flexibility measurements based on a 2-way ANOVA.
VariablesResponsesTTTSRTMST
FSignificanceFSignificanceFSignificance
Trunk angleTES11.06p < 0.00110.7p < 0.00111.55p < 0.001
LES47.43p < 0.00149.01p < 0.00149.50p < 0.001
HMS30.14p < 0.00129.5p < 0.00128.92p < 0.001
LSA220.65p < 0.001208.1p < 0.001159.62p < 0.001
FlexibilityTES4.81p < 0.014.33p < 0.051.56p = 0.214
LES3.95p < 0.059.09p < 0.0017.43p < 0.01
HMS5.52p < 0.014.19p < 0.055.11p < 0.01
LSA13.98p < 0.00112.12p < 0.0010.94p = 0.391
Notes: TTT—toe-touch test, SRT—sit-and-reach test, MST—modified Schober’s test, TES—thoracic erector spinae, LES—lumbar erector spinae, HMS—hamstring, LSA—lumbosacral angle.
Table 5. Muscle activity and LSA of Duncan groups with varying trunk angles.
Trunk AngleTES (%MVC)Duncan GroupLES (%MVC)Duncan GroupHMS (%MVC)Duncan GroupLSA (°)Duncan Group
5.1 (1.5)A3.5 (1.6)AB2.4 (1.8)A38.8 (8.4)A
15°6.0 (2.3)A6.8 (2.0)C5.4 (2.6)B36.5 (7.0)A
30°7.6 (3.6)BC9.1 (2.7)D7.3 (2.7)C29.3 (6.2)B
45°8.3 (3.1)CD10.6 (3.1)E8.5 (2.9)CD20.3 (5.5)C
60°9.7 (3.6)D9.8 (5.0)DE9.3 (3.1)D11.9 (6.5)D
75°8.4 (3.3)CD4.4 (3.4)B9.3 (3.6)D5.6 (7.0)E
90°6.5 (2.9)AB2.6 (1.2)A8.0 (3.4)CD−0.6 (7.0)F
Notes: TES—thoracic erector spinae, LES—lumbar erector spinae, HMS—hamstring, LSA—lumbosacral angle, %MVC—percentage of MVC data; Data are presented in mean (standard deviation).
Table 6. Duncan grouping results for each variable under varying flexibility levels.
Flexibility GroupingTES (%MVC)Duncan GroupLES (%MVC)Duncan GroupHMS (%MVC)Duncan GroupLSA (°)Duncan Group
TTTH8.1 (3.4)A7.3 (4.9)A6.4 (3.1)B22.9 (16.5)A
M7.4 (2.9)AB6.5 (3.9)AB7.6 (3.4)A19.0 (17.3)B
L6.6 (3.5)B6.1 (3.5)B7.6 (4.4)A18.4 (12.8)B
SRTH8.0 (3.2)A7.6 (4.8)A6.7 (3.3)B22.7 (16.1)A
M7.3 (3.3)AB6.0 (4.0)B7.0 (3.3)B18.3 (16.2)B
L6.7 (3.4)A6.2 (3.4)B7.9 (4.5)A19.3 (14.4)B
MSTH7.6 (3.5)A7.6 (4.8)A7.3 (3.5)AB20.4 (16.7)A
M7.1 (2.7)A6.0 (3.8)B6.5 (3.5)B21.2 (15.4)A
L7.5 (3.6)A6.5 (4.0)B7.8 (3.9)A19.6 (14.7)A
Notes: TTT—toe-touch test, SRT—sit-and-reach test, MST—modified Schober’s test, TES—thoracic erector spinae, LES—lumbar erector spinae, HMS—hamstring, LSA—lumbosacral angle, H—high, M—middle, L—low, %MVC—percentage of MVC data; Data are presented in mean (standard deviation).
Table 7. Correlation of FRP onset index with three flexibility measurements.
TestsMusclesrSignificance
TTTTES0.365p < 0.05
LES0.553p < 0.01
SRTTES0.388p < 0.05
LES0.260p = 0.097
MSTTES0.399p < 0.05
LES0.253p = 0.104
Notes: TTT—toe-touch test, SRT—sit-and-reach test, MST—modified Schober’s test, TES—thoracic erector spinae, LES—lumbar erector spinae.

