Article

Identification and Monitoring of Parkinson’s Disease Dysgraphia Based on Fractional-Order Derivatives of Online Handwriting †

1
Department of Telecommunications and SIX Research Centre, Brno University of Technology, Technicka 10, 61600 Brno, Czech Republic
2
Applied Neuroscience Research Group, Central European Institute of Technology, Masaryk University, Kamenice 5, 62500 Brno, Czech Republic
3
Escola Superior Politecnica, Tecnocampus Avda. Ernest Lluch 32, 08302 Mataro, Barcelona, Spain
4
Department of Systems Engineering and Automation, University of the Basque Country UPV/EHU, Av de Tolosa 54, 20018 Donostia, Spain
5
First Department of Neurology, Masaryk University and St. Anne’s University Hospital, Pekarska 53, 65691 Brno, Czech Republic
*
Author to whom correspondence should be addressed.
This paper is an extended version of our paper published in Mucha, J.; Zvoncak, V.; Galaz, Z.; Faundez-Zanuy, M.; Mekyska, J.; Kiska, T.; Smekal, Z.; Brabenec, L.; Rektorova, I.; Ipina, K.L. Fractional Derivatives of Online Handwriting: a New Approach of Parkinsonic Dysgraphia Analysis. In Proceedings of the 2018 41st International Conference on Telecommunications and Signal Processing (TSP), Athens, Greece, 4–6 July 2018; pp. 1–4.
Submission received: 30 October 2018 / Revised: 3 December 2018 / Accepted: 6 December 2018 / Published: 11 December 2018

Abstract

:
Parkinson’s disease dysgraphia affects the majority of Parkinson’s disease (PD) patients and is the result of handwriting abnormalities mainly caused by motor dysfunctions. Several effective approaches to quantitative PD dysgraphia analysis, such as online handwriting processing, have been utilized. In this study, we aim to deeply explore the impact of advanced online handwriting parameterization based on fractional-order derivatives (FD) on the PD dysgraphia diagnosis and its monitoring. For this purpose, we used 33 PD patients and 36 healthy controls from the PaHaW (PD handwriting database). Partial correlation analysis (Spearman’s and Pearson’s) was performed to investigate the relationship between the newly designed features and patients’ clinical data. Next, the discrimination power of the FD features was evaluated by a binary classification analysis. Finally, regression models were trained to explore the new features’ ability to assess the progress and severity of PD. These results were compared to a baseline, which is based on conventional online handwriting features. In comparison with the conventional parameters, the FD handwriting features correlated more significantly with the patients’ clinical characteristics and provided a more accurate assessment of PD severity (error around 12%). On the other hand, the highest classification accuracy (ACC = 97.14%) was obtained by the conventional parameters. The results of this study suggest that utilization of FD in combination with properly selected tasks (continuous and/or repetitive, such as the Archimedean spiral) could improve computerized PD severity assessment.

Graphical Abstract

1. Introduction

As a second most common neurodegenerative disorder, Parkinson’s disease (PD) is expected to impose an increasing social and economic burden on societies as populations age [1]. Its prevalence rate is estimated to approximately 1.5% for people aged over 65 years [2]. The risk of being affected by PD strongly increases with age, and, in the next 15 years, the incidence of PD is expected to be doubled [3,4]. The rapid degeneration of dopaminergic cells in the substantia nigra pars compacta [5] arose as the most significant biological finding associated with the disease, but the exact pathophysiological cause of PD has not yet been discovered. PD cardinal motor symptoms involve bradykinesia (slowness of movement), tremor at rest, rigidity, gait impairment, and postural instability [6,7,8]. A variety of non-motor symptoms may emerge as well—for instance, cognitive impairment, dementia, depression, sleep disorders, or anxiety [6,9,10].
Handwriting requires cognitive, perceptual, and fine motor abilities. In conjunction with motor dysfunctions in people suffering from PD, it has been proven that disrupted handwriting may be used as a significant biomarker for PD diagnosis [11,12]. Micrographia, which is associated with the progressive decrease in letters’ amplitude, is the most commonly observed handwriting abnormality in patients with PD [13,14]. Moreover, according to McLennan et al. [14], in approximately 5% of PD patients, micrographia may be observed even before the onset of the cardinal motor symptoms.
The recent advantage of new technologies coming hand-in-hand with Health 4.0 systems enables the acquisition of online handwriting signals, where temporal information is added to the x and y position. Therefore, by using a digitizing tablet, the analysis is not limited to spatial features which mainly quantify PD micrographia. In addition, we are able to quantify temporal, kinematic, and dynamic manifestations of PD dysgraphia, such as hesitations, pauses, and slow movement [7], which cannot be studied objectively using a classical paper-and-pen method. Due to this complexity, Letanneux et al. [15] started to refer to these manifestations using the generalized term PD dysgraphia.
Several research teams have explored the impact of quantitative PD dysgraphia analysis utilizing simple handwriting/drawing tasks (e.g., separate characters, a combination of two or three characters, repetitive loops, circles), as well as more complex ones (e.g., words, sentences, figures, 3D objects, and the Archimedean spiral) [8,16,17,18,19,20]. An overview of recent related works (2015–present) can be seen in Table 1. Most of them confirm the irreplaceability of kinematic features in PD dysgraphia analysis. Additionally, the researchers usually employ temporal, spatial, and dynamic features. Some more advanced parameters are reported too. For instance, Drotar et al. [8,16,17] demonstrated a combination of kinematic, pressure, energy, or empirical mode decomposition (EMD)-based features that resulted in a classification accuracy of up to 89% using several handwriting tasks. Kotsavasilogloua et al. [21] achieved an average prediction accuracy of 91% using simple horizontal lines and features describing the variability in the pen tip’s velocity, a deviation from the horizontal plane, and the trajectory’s entropy. Other works report even higher classification accuracies (approximately 97%), e.g., Loconsole et al. [18], who used computer vision and electromyography signal processing techniques, or Taleb et al. [22], who used a combination of features related to the correlation between kinematic and pressure characteristics (but, in this case, applied to a very small dataset). Another promising approach was published by Moetesum et al. [23], who reached an 83% classification accuracy by employing convolutional neural networks (CNN) that were used to extract discriminating visual features from handwriting data transformed into the offline mode. In 2018, Impedovo et al. reported the results of a study focused only on the early stages of PD; the best accuracy was 74.76% for a combination of three handwriting tasks. Finally, in our previous work [20], we proposed a new approach of advanced kinematic feature extraction that utilizes fractional-order derivatives (FD). This approach increased the classification accuracy by 10% (72.39%) for Archimedean spiral tasks in comparison with the baseline [20].
Although the authors of the previously mentioned studies reported high classification accuracies, further signal processing and machine learning pipeline improvements are expected to make the differential analysis even more accurate. One possible approach could involve an advanced feature extraction methodology based on fractional calculus (FC) [29,30], which enables the use of an arbitrary order of derivatives and/or integrals. Generally, FC has many applications in different fields of science [31,32,33]. For instance, it has been advantageously used during the modeling of different diseases, such as human immunodeficiency virus (HIV) [34] and malaria [35]. In addition, FC-based analytical tools have outperformed classical techniques in geology [36,37], economics and finance [38,39], etc. Moreover, in our recent paper [20], we identified a high potential for the use of FC in the kinematic analysis of PD drawings. Based on these preliminary results, we assume that FD-based handwriting features may bring improvements to PD diagnosis and assessment. In the frame of this article, we would like to go further and deeply explore the impact of FD on the PD dysgraphia diagnosis and its monitoring. More specifically, we aim to:
  • investigate the relationship between newly designed FD handwriting features and a patient’s clinical data and compare these results with a baseline (i.e., results based on conventional parameters),
  • evaluate the discrimination power of the FD features in terms of binary classification accuracy and compare the results to the baseline,
  • use the newly designed features to establish regression models that will estimate the severity of PD and compare its performance to that of a baseline.
The rest of this paper is organized as follows: Section 2 describes the cohort of patients and the methodology, and Section 3 includes the results. A discussion is presented in Section 4, and, finally, conclusions are drawn in Section 5.

2. Materials and Methods

2.1. Dataset

For the purpose of this work, the Parkinson’s disease handwriting database (PaHaW) [8], which consists of multiple handwriting/drawing samples from 37 PD patients and 38 age- and gender-matched healthy controls (HC), was used. Since the Archimedean spiral drawing task is missing for some participants, we reduced the analyzed cohort to 33 PD patients and 36 HC. Demographic and clinical data of the participants can be found in Table 2. The participants were enrolled at the First Department of Neurology, St. Anne’s University Hospital in Brno, Czech Republic. All participants reported the Czech language as their native language and were right-handed. The patients completed their tasks approximately 1 h after their regular dopaminergic medication (L-dopa). All participants signed an informed consent form approved by the local ethics committee. Unified Parkinson’s disease rating scale, part V (UPDRS V): Modified Hoehn and Yahr staging score [40], was used to assess clinical symptoms of PD. In the frame of this work, the duration of the disease was considered as well. Descriptive visualization (histograms, regression, and residual plots) of the clinical data for the subjects participating in this study can be seen in Figure 1.

2.2. Data Acquisition

The PaHaW database [8] includes nine different handwriting tasks written in the Czech language. Their description and translation to English can be found in Table 3. During all handwriting tasks, the participants were rested and seated in a comfortable position with the possibility to look at the prefilled template (see Figure 2). A digitizing tablet (Wacom Intuos 4M, Wacom, Kazo, Saitama, Japan) was overlaid with an empty paper template and participants were asked to perform all tasks using a special Wacom inking pen that gave the patients immediate visual feedback. Online handwriting signals were recorded with a sampling frequency of f s = 150 Hz . The following time sequences were acquired: x and y coordinates ( x [ t ] , y [ t ] ); time-stamp (t); in-air/on-surface (on-surface movement is a movement of a pen when its tip is touching the surface, e.g., paper (i.e., it provides the information about the pen writing/drawing on the paper); vice versa, in-air movement is a movement of a pen when its tip is up to 1.5 cm above the surface [42,43]) status ( b [ t ] ); pressure ( p [ t ] ); azimuth ( a z [ t ] ); and altitude ( a l [ t ] ).

2.3. Feature Extraction

The main goal of this work is to compare a set of commonly used kinematic features with newly proposed FD-based features in terms of quantitative PD dysgraphia analysis. All of the handwriting features were computed using both on-surface as well as in-air movements. The two movements were quantified separately using velocity (rate at which the position of the pen changes with time [mm/s]), acceleration (rate at which the velocity of the pen changes with time [mm/s2]), jerk (rate at which the acceleration of the pen changes with time [mm/s3]), and their horizontal and vertical variants [8,44,45]. FD-based features were extracted for different values of α . In the frame of this work, α ranging from 0.1 to 1.0 with a step of 0.1 was used. Subsequently, the statistical properties of the computed handwriting features were described using the mean, median, standard deviation (std), and maximum (max). Finally, all of the extracted features were divided into nine different feature sets according to the type of the movement (on-surface, in-air, and combined) and the calculation approach, i.e., the type of feature (FD-based, conventional, and combined). For more information, see Table 4.

Fractional-Order Derivatives

Utilization of the FD as a substitution for the conventional differential derivative during calculation of the basic kinematic features provides a new advanced approach. The advantage of FDs is in their wide range of settings and many different approaches to approximation, e.g., Riemann–Liouville, Caputo, or Grünwald–Letnikov formulations [31,46,47]. For the purpose of this work, Jonathan Hadida’s FD Matlab implementation was used following the Grünwald–Letnikov approximation [31,48]. A direct definition of the FD D α y ( t ) is based on the finite differences of an equidistant grid in [ 0 , τ ] , assuming that the function y ( τ ) satisfies certain smoothness conditions in every finite interval ( 0 , t ) , t T . Choosing the grid [31],
0 = τ 0 < τ 1 < < τ n + 1 = t = ( n + 1 ) h
with
τ k + 1 τ k = h
and using the notation of finite differences
1 h α Δ h α y ( t ) = 1 h α y ( τ n + 1 ) v = 1 n + 1 c v α y ( τ n + 1 v ) ,
where
c v α = ( 1 ) v 1 ( v α ) .
The Grünwald–Letnikov implementation is defined as
D α y ( t ) = lim h 0 1 h α Δ h α y ( t ) ,
where D α y ( t ) denotes a derivative with order α of function y ( t ) , and h represents a sampling lattice.

2.4. Statistical Analysis

Prior to providing a description of the analytical setup, it is important to note that the effect of well-known confounding factors, also known as covariates, was controlled for in all of the analytical steps described below. In the frame of this work, we controlled for the effect of participants’ age, gender, and L-dopa [41] (dopaminergic medication).
To assess the strength of the relationship between the computed handwriting features and patient’s clinical data (UPDRS V and PD duration), we computed the partial Pearson’s correlation coefficient (assessment of a linear relationship), as well as the partial Spearman’s correlation coefficient (assessment of a monotonic relationship). With this approach, we aimed to identify the handwriting features that are significantly correlated with the clinical measures under focus and also to compare the FD features with conventional ones. A significance level of correlation (p) of 0.05 was selected for both of the correlation types. Only the results with a p-value below the significance level in both correlation coefficients were considered statistically significant.
Next, to evaluate and compare the power of the handwriting features to discriminate PD patients and HC, multivariate binary classification analysis was performed. For this purpose, state-of-the-art gradient boosted trees were employed. Specifically, we used the famous XGBoost algorithm [49]. The XGBoost algorithm was chosen for its ability to achieve a good performance, even for small datasets; its inherent robustness to outliers; its ability to model complex interdependencies in the data; and also its recent successes in the field of machine learning (e.g., the winning algorithm in many www.kaggle.com competitions). To train and evaluate the models, we used the following supervised learning setup: stratified 10-fold cross-validation with 20 repetitions. The performance of the trained classification models was evaluated by Matthew’s correlation coefficient (MCC) [50], classification accuracy (ACC), sensitivity (SEN), and specificity (SPE), which are defined as follows:
MCC = TP × TN FP × FN ( TP + FP ) ( TP + FN ) ( TN + FP ) ( TN + FN ) ,
ACC = TP + TN TP + TN + FP + FN · 100 [ % ] ,
SEN = TP TP + FN · 100 [ % ] ,
SPE = TN TN + FP · 100 [ % ] ,
where TP is the number of true positives, TN is the number of true negatives, FP is the number of false positives, and FN is the number false negatives.
Finally, to evaluate and compare the power of the handwriting features’ ability to predict the values of the selected clinical characteristics (UPDRS V and PD duration), multivariate regression analysis was performed. For this purpose, the same boosting tree algorithm (XGBoost) and the supervised learning setup were used. The performance of the trained regression models was evaluated by the mean absolute error (MAE), root mean square error (RMSE), and estimated error rate (EER), which are defined as follows:
MAE = 1 n i = 1 n | y i y i ^ | ,
RMSE = 1 n i = 1 n ( y i y i ^ ) 2 ,
EER = 1 n · r i = 1 n | y i y i ^ | · 100 [ % ] ,
where y i represents the true label of the ith observation, y i ^ denotes the predicted label of the ith observation, n is the number of observations, and r is the range of the values of the predicted clinical characteristic (not the range that can be theoretically reached, but the actual range of the values in the dataset). Therefore, the EER describes a percentage of error predictions in regard to the statistical properties of the data.

3. Results

In Table 5, the results of partial correlation analysis between the handwriting features (FD-based features, conventional features) and patients’ clinical characteristics (UPDRS V, PD duration) are summarized. The table shows the five best features according to Spearman’s correlation coefficient for each movement (on-surface, in-air).
In the case of UPDRS V (on-surface movement), the following FD-based features achieved a statistical significance of correlation: the median of jerk ( α = 0.3 , α = 0.4 ) and horizontal velocity ( α = 0.1) for the repetitive letter l, the mean of vertical acceleration ( α = 0.7 ) for repetitive loops, and the standard deviation of the vertical velocity ( α = 0.3 ) for the sentence. The following conventional features achieved a statistical significance of correlation (p-value of only one of the coefficients was below the threshold): the maximum of horizontal jerk and velocity for the repetitive letters le, the maximum of horizontal jerk and horizontal velocity for the repetitive letter l, and the maximum of horizontal velocity for the letter l. Regarding UPDRS V (in-air movement), the following FD-based features achieved a statistical significance of correlation: the median of vertical velocity ( α = 0.9 , α = 0.8 , α = 0.7 ) for the sentence and the median of horizontal velocity ( α = 0.5 ) and vertical jerk ( α = 0.3 ) for the repetitive letters le. The following conventional features achieved a statistical significance of correlation (p-value of only one of the coefficients was below the threshold): the mean of acceleration for the repetitive word lektorka, the maximum of horizontal jerk for the word porovnat, the median of the vertical velocity for the repetitive letter l, and the median of the horizontal velocity of the repetitive letters le.
For PD duration (on-surface movement), the following FD-based features achieved a statistical significance of correlation (of note: all of these features satisfied the stronger threshold for statistical significance of correlation p < 0.01 ): the maximum of the velocity ( α = 0.1 ) and acceleration ( α = 0.8 , α = 0.7 , α = 0.6 , α = 0.2 ) for the Archimedean spiral. The following conventional features achieved a statistical significance of correlation (p-value of only one of the coefficients was below the threshold): the maximum of horizontal velocity, horizontal jerk, and velocity for the repetitive letter l; the mean of the vertical velocity for the Archimedean spiral; and the mean of horizontal acceleration for repetitive loops. For PD duration (in-air movement), the following FD-based features achieved a statistical significance of correlation: the median of jerk ( α = 0.4 ) for sentence, the maximum of jerk ( α = 0.1 , α = 0.2 , α = 0.3 ) and velocity ( α = 0.1 ) for repetitive word les. The following conventional features achieved a statistical significance of correlation (p-value of only one of the coefficients was below the threshold): the median and mean of horizontal jerk for the word lektorka, the maximum of the velocity for the word nepopadnout, and the mean of horizontal velocity for the repetitive word lektorka and the word nepopadnout.
The results of the multivariate binary classification analysis are summarized in Table 6. In total, we built and evaluated nine different classification models. These models were selected according to the following criteria: movement type (on-surface, in-air, all), feature type (FD features, conventional features, all). We built models based on the combinations of these criteria as well. For more information, see Table 4.
With respect to the classification performance, the highest MCC achieved was 0.95 was for eight out of the total nine feature sets (with the exception being the feature set composed of conventional handwriting features computed for the on-surface movements). An interesting fact to note is that for all models based on conventional handwriting features, only a single feature was capable of providing the classification models with such a high discrimination power. In terms of the specific features important for the trained models, the following feature importances were returned by the models (feature importance quantifies the relative importance of the features in the ensemble of the trained XGBoost model [49]; therefore, the higher the value of the feature importance, the more important the feature for the prediction of the dependent variable): conventional on-surface (horizontal jerk (median) of repetitive loops), conventional in-air (horizontal velocity (median) of the sentence), conventional together (horizontal velocity (median) of the sentence), FD on-surface (jerk (max) α = 0.3 of the letters le), FD in-air (vertical acceleration (mean) α = 0.6 of the word nepopadnout ( FI = 0.33 ), horizontal jerk (mean) α = 0.9 of the word nepopadnout ( FI = 0.33 ), horizontal jerk (mean) α = 0.2 of the repetitive word lektorka ( FI = 0.33 )), FD together (jerk (max) α = 0.3 of the letters le (on-surface; FI = 0.67 ), horizontal jerk (mean) α = 0.9 of the word nepopadnout (in-air; FI = 0.33 )), all on-surface (horizontal jerk (median) of repetitive loops ( FI = 0.50 ), jerk (max) α = 0.3 of the letters le ( FI = 0.50 )), all in-air (horizontal velocity (median) of the sentence), and all together (horizontal velocity (median) of the sentence (in-air)).
The results of multivariate regression analysis are summarized in Table 7. For this purpose, we used UPDRS V and PD duration as our target variables. As in the case of binary classification, we built and evaluated nine different regression models according to the same criteria. For each of the rating scales, the table shows the results achieved using the trained models and the associated feature importance values. All obtained results are discussed in the following section.
Considering EER as our performance evaluation metric, the following results are worth pointing out. In the case of UPDRS V, the lowest EER was achieved using a single FD-based feature—specifically, the standard deviation of vertical velocity ( α = 0.1 ) computed for the on-surface movements ( 12.51 ± 7.55 % ). The same feature was selected when both FD and conventional features were considered while building the model. In general, all models achieved an EER of around 12–13%. In comparison with the conventional features, the FD-based features performed better, with a difference of about 1%. In terms of the specific features important for the trained models, the following feature importances were returned by the models: conventional on-surface (vertical normalized jerk (mean) of the repetitive word lektorka), conventional in-air (vertical velocity (mean) of the sentence), conventional together (vertical velocity (mean) of the sentence), FD on-surface (vertical velocity (std) α = 0.1 of the sentence), FD in-air (vertical velocity (median) α = 0.3 of the sentence), FD together (vertical velocity (std) α = 0.1 of the sentence (on-surface; FI = 0.50 ), vertical velocity (median) α = 0.3 of the sentence (in-air; FI = 0.50 )), all on-surface (vertical velocity (std) α = 0.1 of the sentence), all in-air (vertical velocity (median) α = 0.3 of the sentence), and all together (vertical velocity (std) α = 0.1 of the sentence (on-surface; FI = 0.50 ), vertical velocity (median) α = 0.3 of the sentence (in-air; FI = 0.50 )). With respect to PD duration, the lowest EER was achieved using conventional handwriting features computed for both on-surface as well as in-air movements ( 23.64 ± 7.55 % ).

4. Discussion

To the best of our knowledge, except for our pilot work [20], there are no prior studies which integrate FD into a handwriting parameterization for quantitative PD dysgraphia analysis. Therefore, the results published in this paper are exploratory in nature.
In comparison with the conventional kinematic features, FD-based ones correlate more significantly with the clinical characteristics (UPDRS V and PD duration). We observed especially strong correlations for handwriting tasks based on the periodic repetition of specific movements (Archimedean spiral; repetitive letter l, syllable le, or word les). Although the levels of significance based on the conventional handwriting parameters are lower, similar handwriting tasks are involved in the most significant results. We hypothesize that this is due to their ability to highlight or better quantify the cardinal motor symptoms of PD. For example, the most significant relationship between handwriting performance and PD duration was identified in acceleration extracted from the Archimedean spiral. Rigidity combined with tremor and/or bradykinesia makes a PD patient’s handwriting/drawing less fluent (increased changes in velocity and higher acceleration). This is highlighted in a task such as the spiral, where the proper coordination of the fingers, wrist, and arm is required. Generally, the observed problems with coordination are in line with the work of Dounskaia et al. [51] and Teulings et al. [
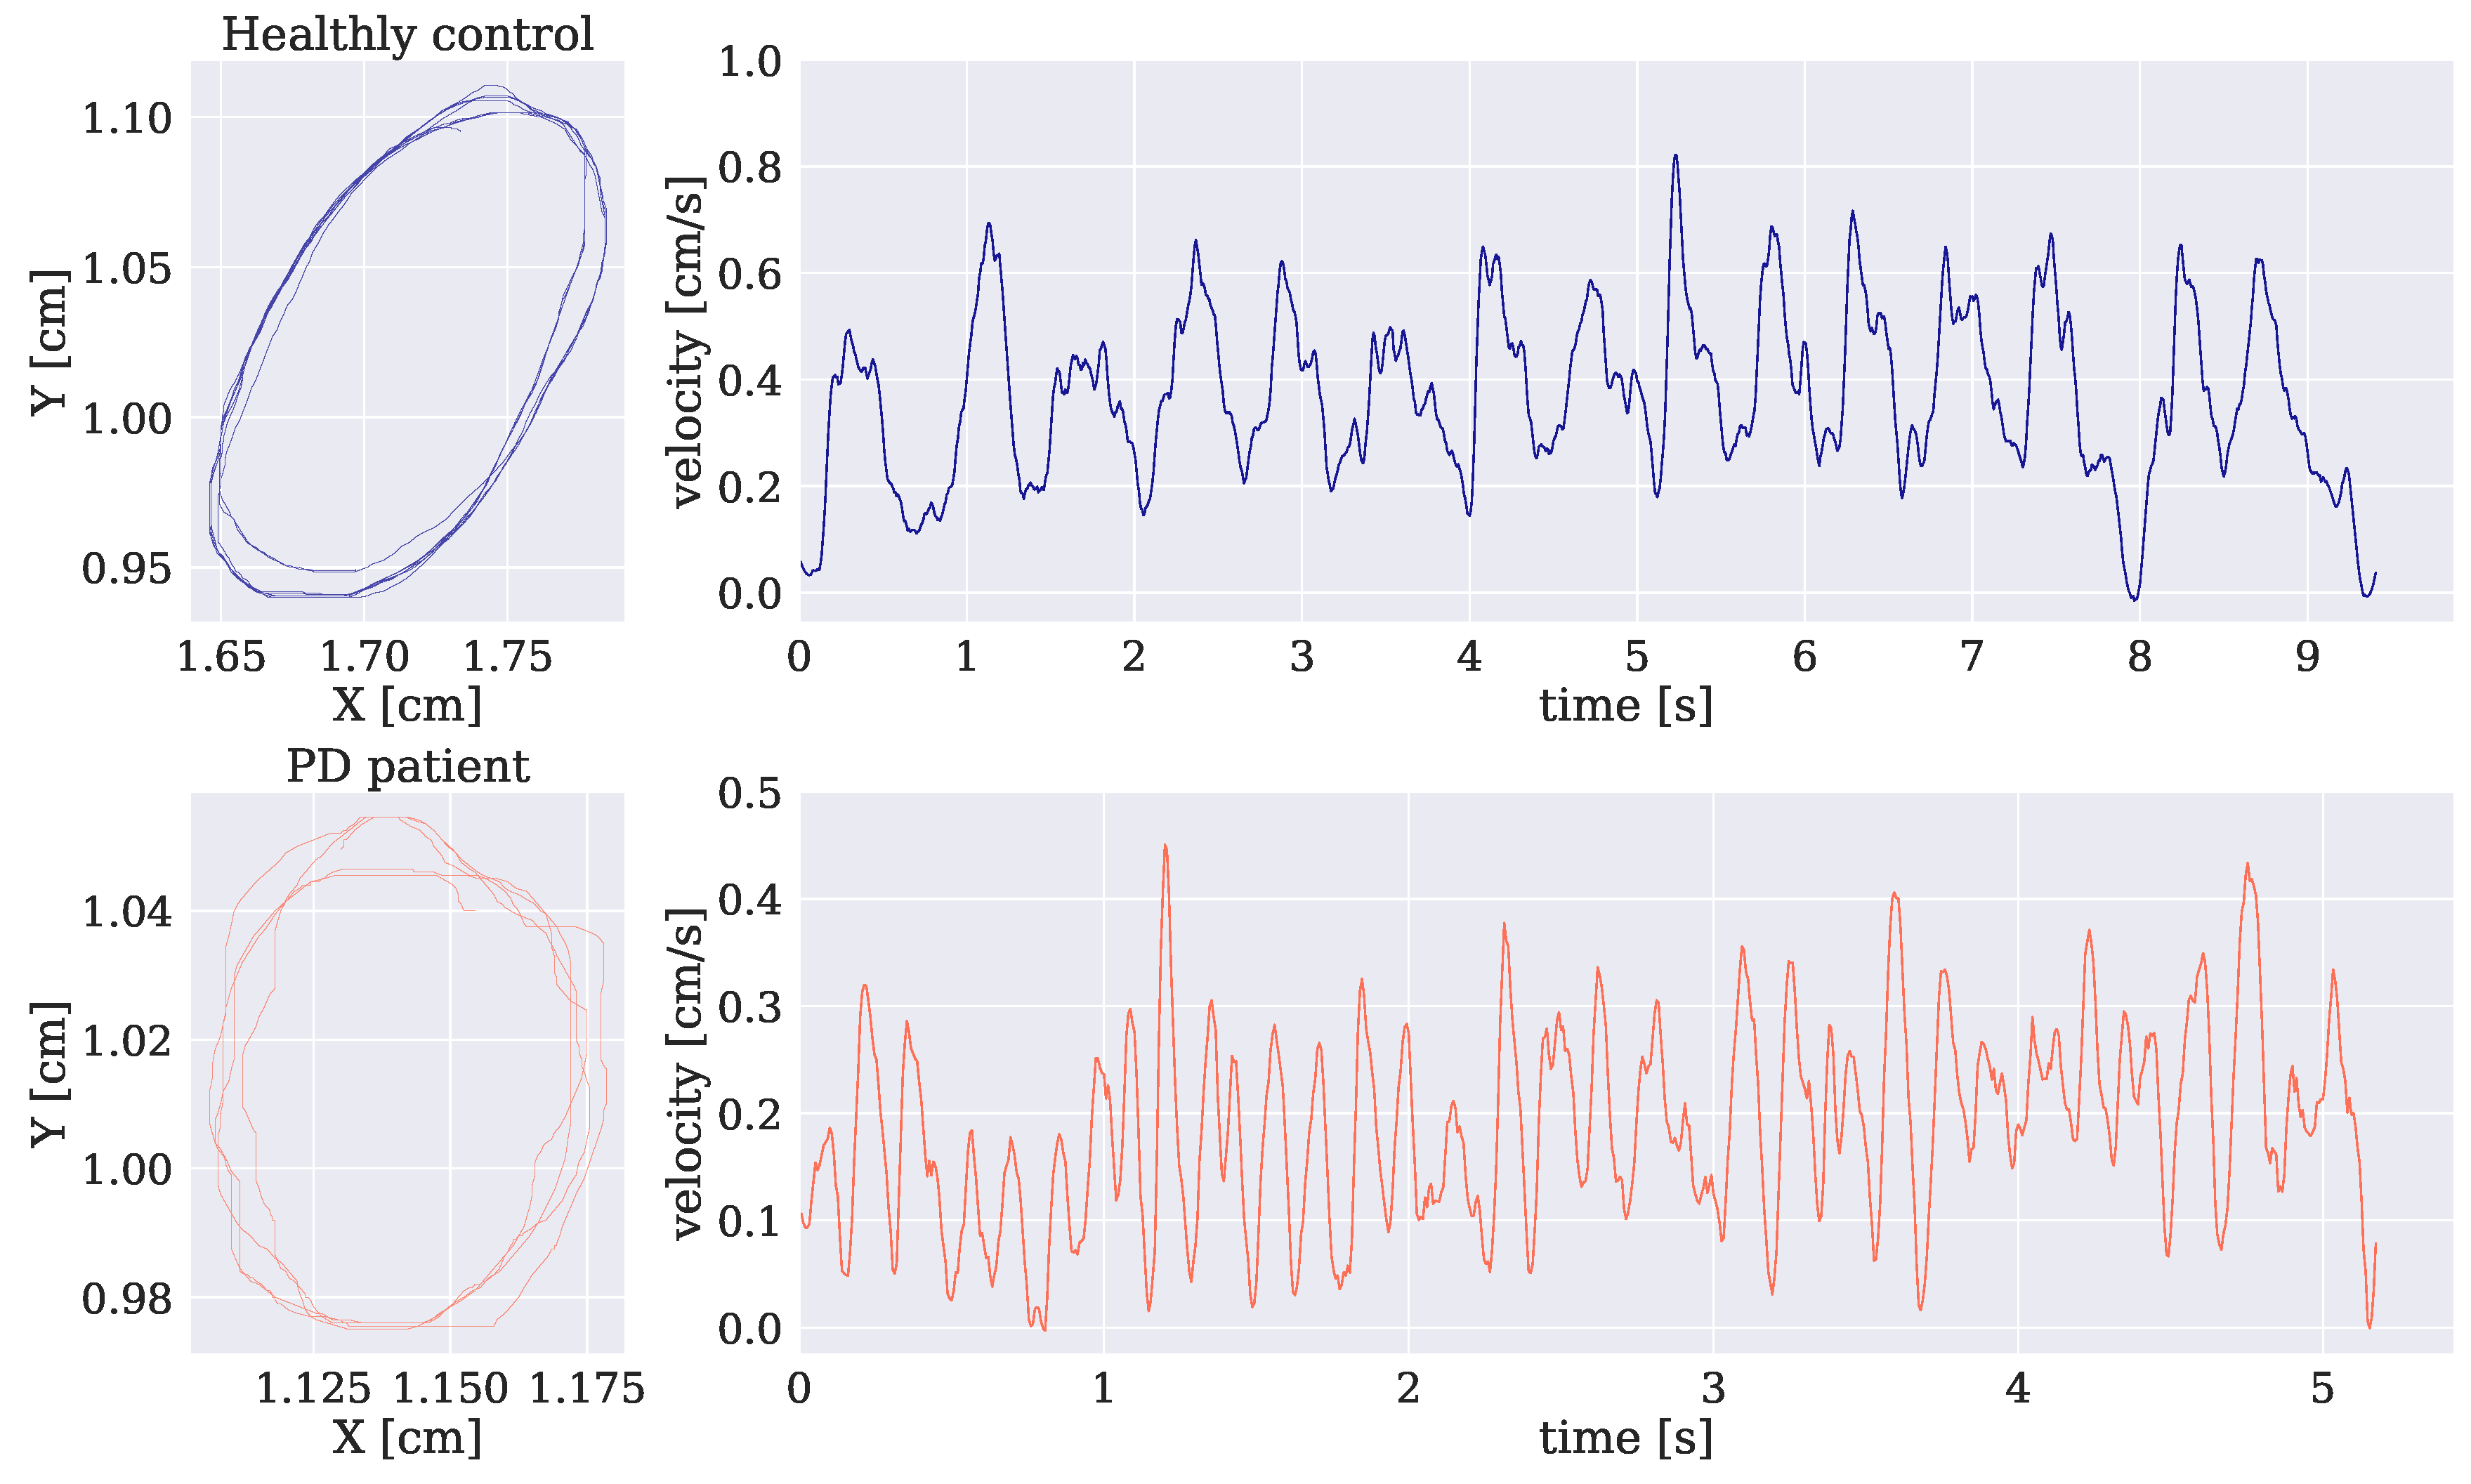
52]. To better illustrate these manifestations, 
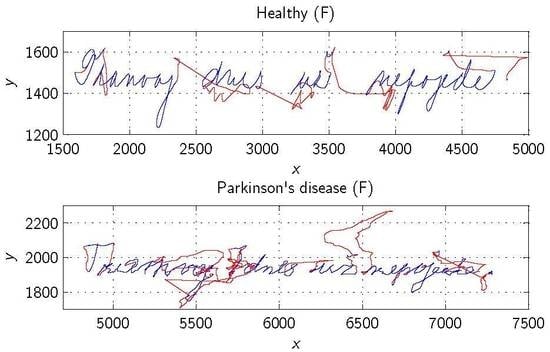
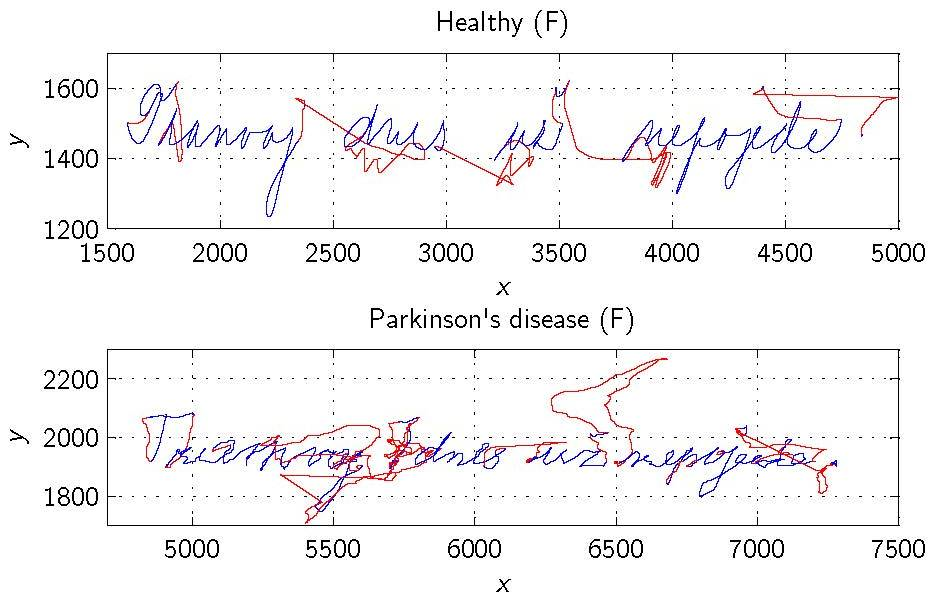
Figure 3 plots the velocity profiles of repetitive loops for a healthy control and a PD patient. As can be seen, the patient introduced more changes in velocity, and their drawing became much more non-fluent. To summarize these findings, FD features in combination with properly selected tasks provide a stronger relationship with the severity and progress of PD.
On the other hand, in terms of binary classification, the conventional parameters provided the best results. The classification performance is remarkable: ACC = 97.74 % , SEN = 95.50 % , and SPE = 100 % . In fact, our results represent the highest classification accuracy that has ever been reported based on the PaHaW database (see Table 1). We hypothesize that the improvement was caused by the inclusion of the state-of-the-art XGBoost algorithm into our machine learning pipelines. As already mentioned, the result is based on one in-air feature: median horizontal velocity of a sentence. In comparison with the HC cohort, the PD patients exhibited much lower values of this measure, i.e., while writing the sentence, the PD patients were not able to perform horizontal transitions (movement between neighboring letters or words) as quickly as the HC could. This finding is in line with the work of Ma et al. [53], who observed that wrist extension stiffness in PD patients makes the handwriting in the horizontal direction more problematic. Therefore, scientists started to use the term horizontal dysgraphia [13]. Generally, vertical or horizontal dysgraphia may be considered a presymptomatic neurobehavioral biomarker of PD with possible significance in early PD diagnosis [13].
In [20], we proved that the FD features improved the accuracy of PD dysgraphia diagnosis in the Archimedean spiral drawing task by 10%. Contrary to our pilot results, in the frame of this work, these features did not lead to any improvements. After a deeper analysis, we found that this was caused by a combined task approach. Performance of the Archimedean spiral is a quasiparticle and continuous task with some repetitive patterns. It looks as though the FD features work especially well in these specific cases. Nevertheless, when combining these tasks with a complex handwriting task (such as a sentence), the measures quantifying in-air movement tend to be more discriminative (in our case, the median in-air horizontal velocity of a sentence). This brings us to the same conclusion that was given during the correlation analysis—the FD features advance the PD dysgraphia diagnosis only in some specific cases.
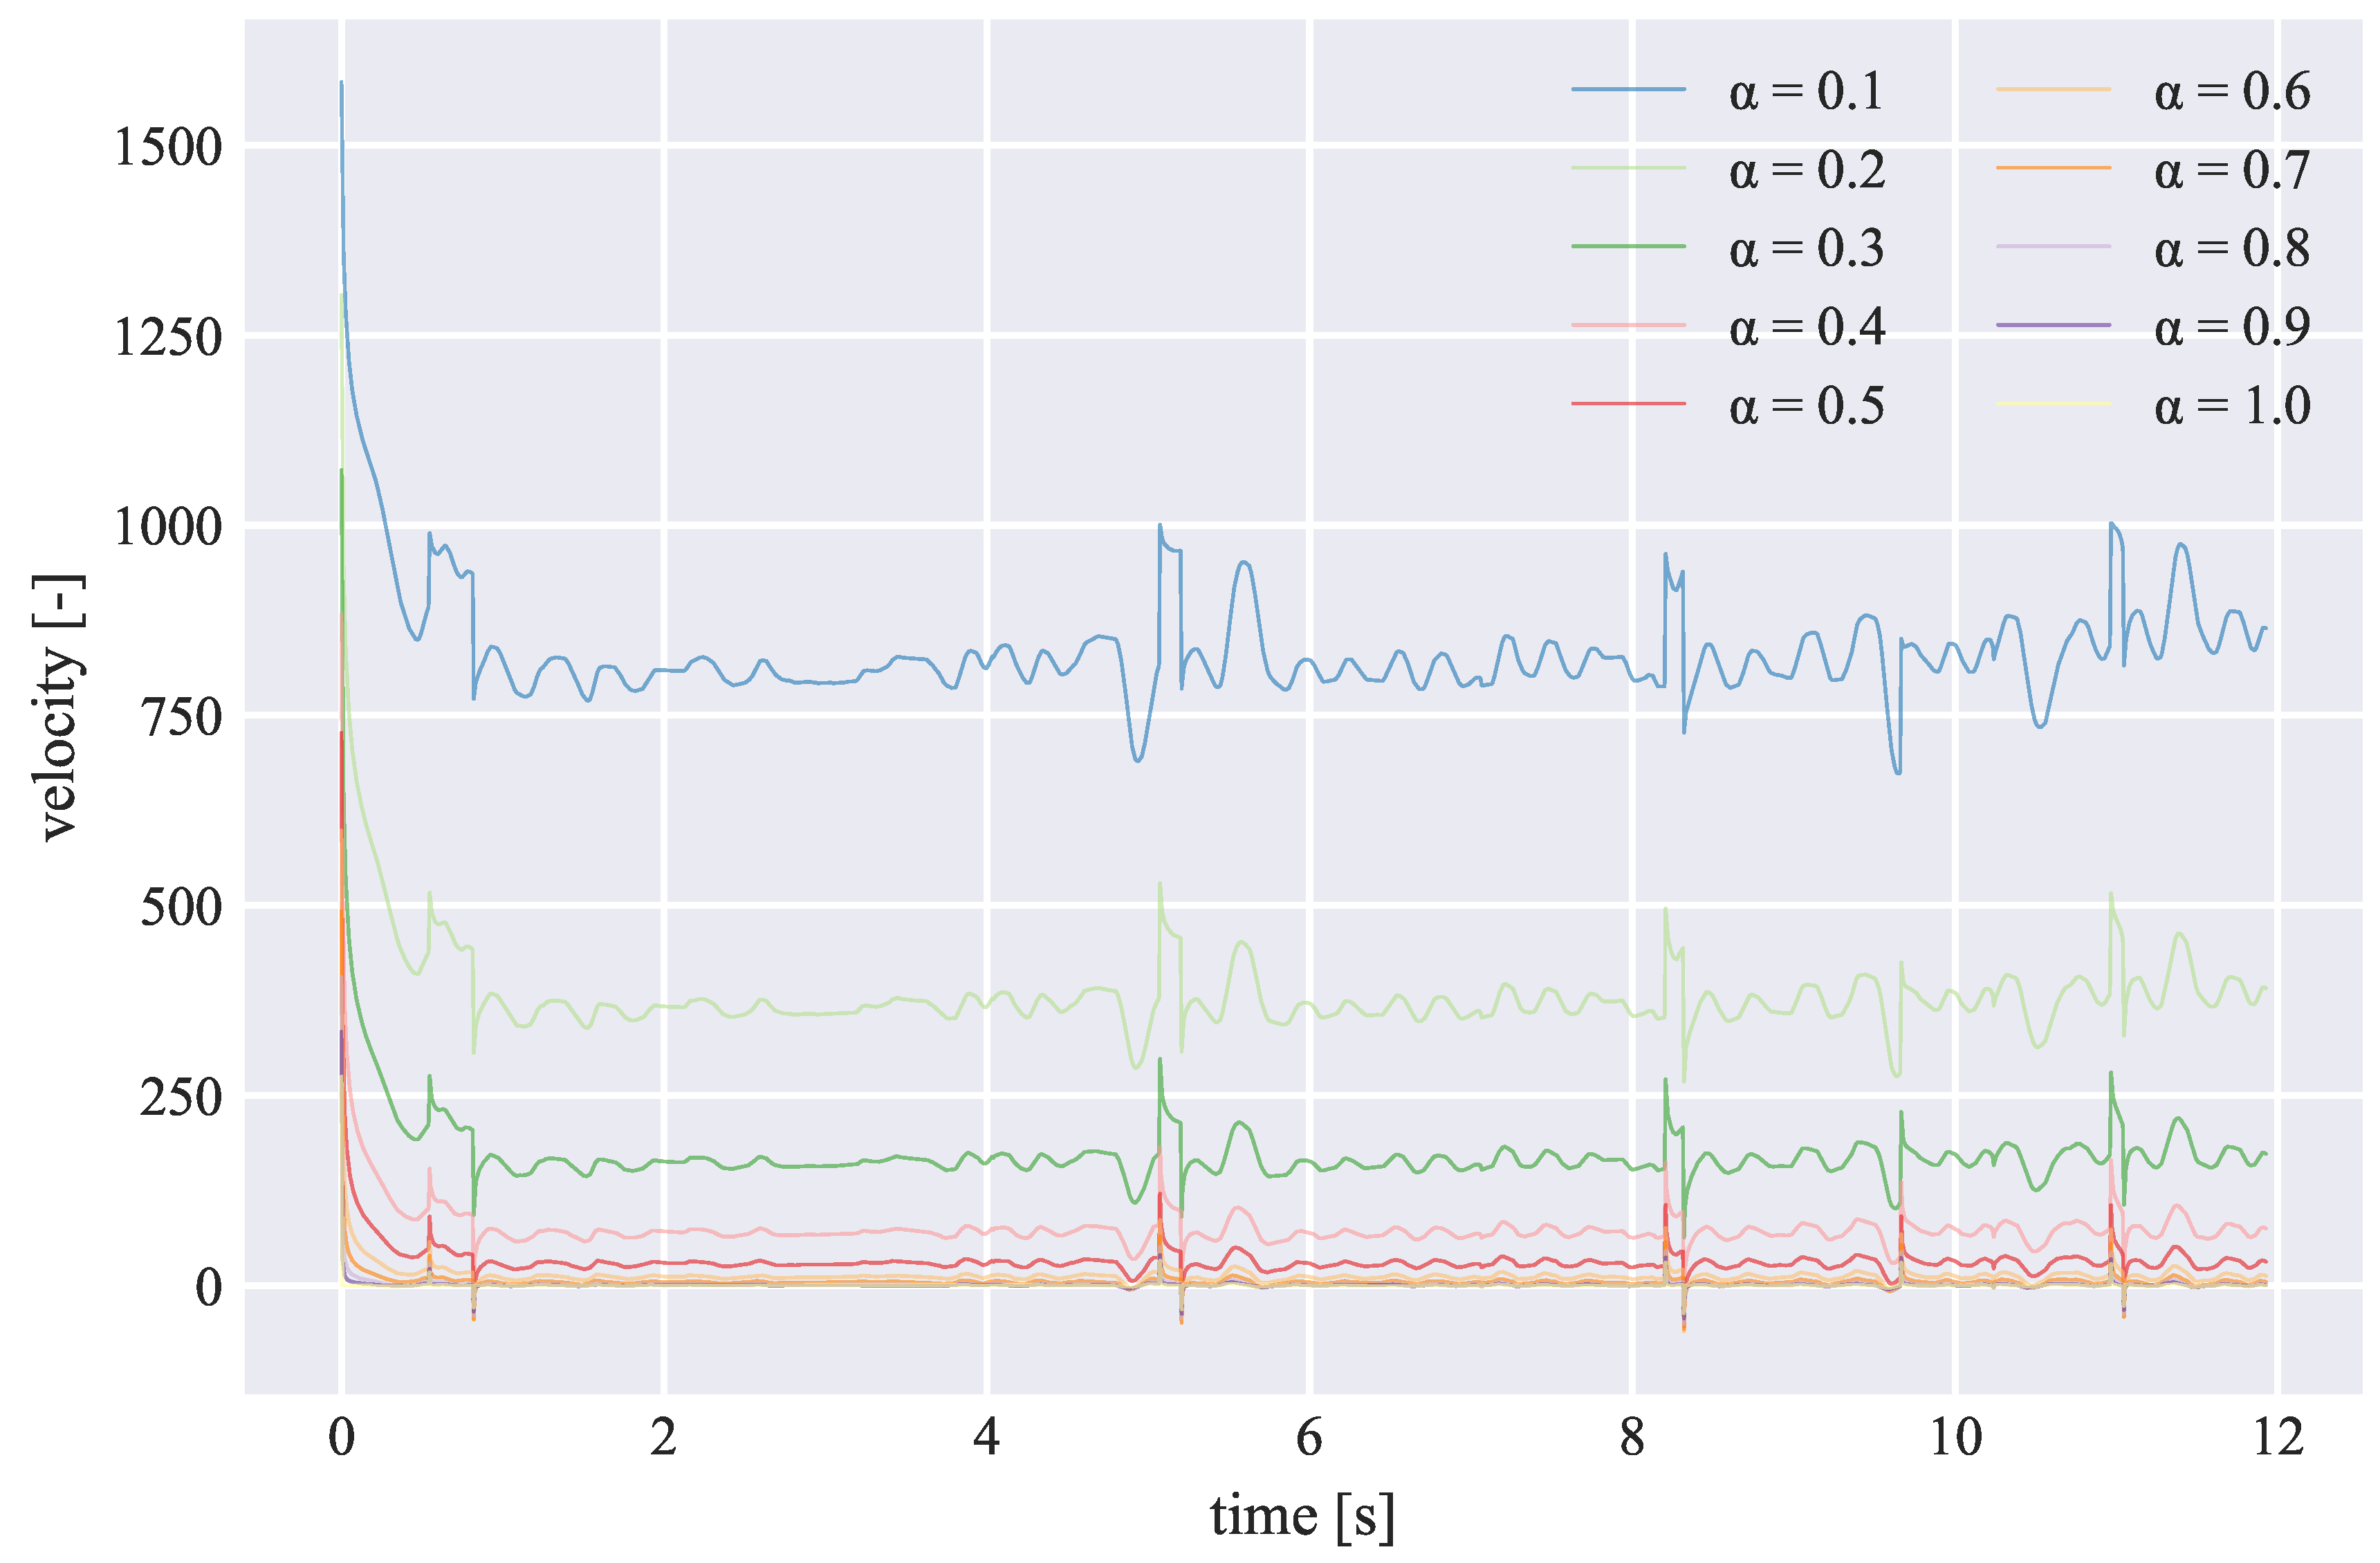
The best regression model, estimating the UPDRS V score with a 12.51% error, is based only on the standard deviation of on-surface vertical velocity ( α = 0.1 ) extracted from the sentence. This FD-based parameter was selected from the feature set combining all on-surface measures; therefore, we can confirm the positive influence of FC on the regression analysis performance. In fact, the FD features outperformed the conventional ones in all scenarios. To better understand this result, we plotted vertical velocity patterns of the sentence task for different orders of FD (see Figure 4). We can observe a big difference between α = 0.1 and the rest of the orders, including the full derivative. This large distance means that we are working with completely new information that is far from that contained in the full derivative. Although it is difficult to clinically interpret this information, it is clear that FC opens new possibilities for monitoring PD severity.
Regarding the PD duration estimation results, the most successful model ( EER = 23.46 % ) consists of 16 conventional on-surface/in-air features (all features’ importance values can be found in Supplementary Table S1). The most frequent feature with the highest feature importance is the jerk extracted from several handwriting tasks. This probably means that as PD progresses, handwriting becomes more jerky and irregular. Vertical velocity is the second most frequent feature involved in the models, which is probably linked with micrographia. Generally, in the case of PD duration estimation, the FD-based features did not yield any improvement.
In conclusion, the FD-based features are better for modeling PD severity (in terms of UPDRS V score estimation), but they do not lead to an improvement in PD duration modeling. The progress of PD is nonlinear and very individual. This means that patients with the same PD duration can be in different stages of the disease. This fact supports our results: the estimation error of PD duration was generally much worse than the estimation error of the UPDRS V score. Since PD duration estimation is a difficult task with poor results, fine improvements based on FD parameters play no role.

5. Conclusions

This study deals with advanced approaches to PD dysgraphia diagnosis and monitoring based on FC integrated with online handwriting/drawing parameterization. To the best of our knowledge, it is the first work that performs a complex investigation into the possibilities for FC in online handwriting processing and proposes new advances in kinematic analyses based on FD. Although the conventional features provided better and very high classification accuracy, which is at the top of the state-of-the-art analyses based on the PaHaW database ( ACC = 97.74 % , SEN = 95.50 % , and SPE = 100 % ), the newly designed parameters were proven to work better for specific tasks (continuous and/or repetitive, such as the Archimedean spiral) and for specific applications, i.e., PD severity estimation (EER = 12.51%). However, our results need to be confirmed by subsequent scientific research.
This study has several limitations and suggestions for further improvements. Since the dataset is small, to be able to generalize the results, bigger databases should be involved. On the other hand, it is common to have such small numbers of PD patients and HC samples in PD dysgraphia analysis, e.g., see our review in Table 1. Next, we considered only the kinematic measures. To better evaluate the discrimination power of the FD features and better evaluate their ability to estimate PD severity or progress, other feature types, such as temporal, spatial, and dynamic, should be included in future comparisons. Finally, the FD-based parameters could be further explored. For instance, we can consider other approximations (e.g., Caputo) or employ FC for other measures (e.g., entropies).

Supplementary Materials

The following are available online at https://0-www-mdpi-com.brum.beds.ac.uk/2076-3417/8/12/2566/s1, Table S1: Feature relevance from multivariate regression (modeling PD duration).

Author Contributions

Conceptualization, J.M. (Jan Mucha), J.M. (Jiri Mekyska) and M.F.-Z.; methodology, J.M. (Jan Mucha), M.F.-Z. and J.M. (Jiri Mekyska); software, J.M. (Jan Mucha) and J.M. (Jiri Mekyska); validation, J.M. (Jan Mucha); formal analysis, J.M. (Jan Mucha) and J.M. (Jiri Mekyska); investigation, J.M. (Jan Mucha), M.F.-Z., J.M. (Jiri Mekyska), I.R. and L.B.; resources, I.R. and L.B.; data curation, J.M. (Jan Mucha), J.M. (Jiri Mekyska), Z.G., V.Z., T.K., L.B. and I.R.; writing—original draft preparation, J.M. (Jan Mucha), J.M. (Jiri Mekyska), Z.G. and M.F.-Z.; visualization, J.M. (Jan Mucha) and Z.G.; supervision, J.M. (Jiri Mekyska), Z.S., I.R., M.F.-Z. and K.L.-d.-I.; project administration, J.M. (Jiri Mekyska), Z.S., I.R., M.F.-Z. and K.L.-d.-I.; funding acquisition, J.M. (Jiri Mekyska), Z.S., I.R., M.F.-Z. and K.L.-d.-I.

Funding

This project has received funding from the European Union’s Horizon 2020 research and innovation programme under the Marie Skłodowska-Curie grant agreement No. 734718 (CoBeN). In addition, this work was supported by the grant of the Czech Science Foundation 18-16835S (Research of advanced developmental dysgraphia diagnosis and rating methods based on quantitative analysis of online handwriting and drawing) and the following projects: LO1401, FEDER and MEC, and TEC2016-77791-C4-2-R from the Ministry of Economic Affairs and Competitiveness of Spain. This article is based upon work from COST Action CA15225, a network supported by COST (European Cooperation in Science and Technology), and, for the research, infrastructure of the SIX Center was used.

Conflicts of Interest

The authors declare no conflict of interest.

Disclaimer

The article reflects only the authors’ view, and the Research Executive Agency (REA) is not responsible for any use that may be made of the information it contains.

Abbreviations

The following abbreviations are used in this manuscript:
ACCaccuracy
ADAAdaBoost
ANNartificial neural network
ANOVAanalysis of variance
AUCarea under the ROC curve
CNNconvolutional neural network
EMDempirical mode decomposition
EERestimated error rate
FNfalse negatives
FPfalse positives
FCfractional calculus
FDfractional-order derivative
FIfeature importance
K-NNK-nearest neighbors
LEDL-dopa equivalent daily dose
LDAlinear discriminant analysis
MCCMatthew’s correlation coefficient
maxmaximum
MAEmean absolute error
NBnaïve Bayes classifier
OPFoptimum path forest
PDParkinson’s disease
RFrandom forests
RMSEroot mean squared error
SENsensitivity
r p Pearson’s correlation coefficient
r s Spearman’s correlation coefficient
SPEspecificity
stdstandard deviation
TNtrue negatives
TPtrue positives
SVMsupport vector machine
UPDRS Vunified Parkinson’s disease rating scale, part V: Modified Hoehn and Yahr staging score

References

  1. Bellou, V.; Belbasis, L.; Tzoulaki, I.; Evangelou, E.; Ioannidis, J.P. Environmental risk factors and Parkinson’s disease: An umbrella review of meta-analyses. Parkinsonism Relat. Disord. 2016, 23, 1–9. [Google Scholar] [CrossRef] [PubMed]
  2. Berg, D.; Postuma, R.B.; Adler, C.H.; Bloem, B.R.; Chan, P.; Dubois, B.; Gasser, T.; Goetz, C.G.; Halliday, G.; Joseph, L.; et al. MDS research criteria for prodromal Parkinson’s disease. Mov. Disord. 2015, 30, 1600–1611. [Google Scholar] [CrossRef] [PubMed]
  3. Sapir, S.; Ramig, L.; Fox, C. Speech and swallowing disorders in Parkinson disease. Curr. Opin. Otolaryngol. Head Neck Surg. 2008, 16, 205–210. [Google Scholar] [CrossRef] [PubMed]
  4. Hirsch, L.; Jette, N.; Frolkis, A.; Steeves, T.; Pringsheim, T. The incidence of Parkinson’s disease: A systematic review and meta-analysis. Neuroepidemiology 2016, 46, 292–300. [Google Scholar] [CrossRef] [PubMed]
  5. Hornykiewicz, O. Biochemical aspects of Parkinson’s disease. Neurology 1998, 51, S2–S9. [Google Scholar] [CrossRef] [PubMed]
  6. Elbaz, A.; Carcaillon, L.; Kab, S.; Moisan, F. Epidemiology of Parkinson’s disease. Rev. Neurol. 2016, 172, 14–26. [Google Scholar] [CrossRef] [PubMed]
  7. Contreras-Vidal, J.L.; Poluha, P.; Teulings, H.L.; Stelmach, G.E. Neural dynamics of short and medium-term motor control effects of levodopa therapy in Parkinson’s disease. Artif. Intell. Med. 1998, 13, 57–79. [Google Scholar] [CrossRef]
  8. Drotar, P.; Mekyska, J.; Rektorova, I.; Masarova, L.; Smekal, Z.; Faundez-Zanuy, M. Evaluation of handwriting kinematics and pressure for differential diagnosis of Parkinson’s disease. Artif. Intell. Med. 2016, 67, 39–46. [Google Scholar] [CrossRef]
  9. Brabenec, L.; Mekyska, J.; Galaz, Z.; Rektorova, I. Speech disorders in Parkinson’s disease: Early diagnostics and effects of medication and brain stimulation. J. Neural Transm. 2017, 124, 303–334. [Google Scholar] [CrossRef]
  10. Mucha, J.; Galaz, Z.; Mekyska, J.; Kiska, T.; Zvoncak, V.; Smekal, Z.; Eliasova, I.; Mrackova, M.; Kostalova, M.; Rektorova, I.; et al. Identification of hypokinetic dysarthria using acoustic analysis of poem recitation. In Proceedings of the 2017 40th International Conference on Telecommunications and Signal Processing (TSP), Barcelona, Spain, 5–7 July 2017; pp. 739–742. [Google Scholar]
  11. De Stefano, C.; Fontanella, F.; Impedovo, D.; Pirlo, G.; di Freca, A.S. Handwriting analysis to support neurodegenerative diseases diagnosis: A review. Pattern Recognit. Lett. 2018, in press. [Google Scholar] [CrossRef]
  12. Rosenblum, S.; Samuel, M.; Zlotnik, S.; Erikh, I.; Schlesinger, I. Handwriting as an objective tool for Parkinson’s disease diagnosis. J. Neurol. 2013, 260, 2357–2361. [Google Scholar] [CrossRef]
  13. Thomas, M.; Lenka, A.; Kumar Pal, P. Handwriting Analysis in Parkinson’s Disease: Current Status and Future Directions. Mov. Disord. Clin. Pract. 2017, 4, 806–818. [Google Scholar] [CrossRef] [PubMed]
  14. McLennan, J.; Nakano, K.; Tyler, H.; Schwab, R. Micrographia in Parkinson’s Disease. J. Neurol. Sci. 1972, 15, 141–152. [Google Scholar] [CrossRef]
  15. Letanneux, A.; Danna, J.; Velay, J.L.; Viallet, F.; Pinto, S. From micrographia to Parkinson’s disease dysgraphia. Mov. Disord. 2014, 29, 1467–1475. [Google Scholar] [CrossRef] [PubMed]
  16. Drotar, P.; Mekyska, J.; Smekal, Z.; Rektorova, I.; Masarova, L.; Faundez-Zanuy, M. Contribution of different handwriting modalities to differential diagnosis of Parkinson’s Disease. In Proceedings of the 2015 IEEE International Symposium Medical Measurements and Applications (MeMeA), Turin, Italy, 7–9 May 2015; pp. 1–5. [Google Scholar]
  17. Drotar, P.; Mekyska, J.; Rektorova, I.; Masarova, L.; Smekal, Z.; Zanuy, M.F. Decision support framework for Parkinson’s disease based on novel handwriting markers. IEEE Trans. Neural Syst. Rehabil. Eng. 2015, 23, 508–516. [Google Scholar] [CrossRef] [PubMed]
  18. Loconsole, C.; Trotta, G.F.; Brunetti, A.; Trotta, J.; Schiavone, A.; Tato, S.I.; Losavio, G.; Bevilacqua, V. Computer Vision and EMG-Based Handwriting Analysis for Classification in Parkinson’s Disease. In Intelligent Computing Theories and Application; Springer International Publishing: Cham, Switzerland, 2017; pp. 493–503. [Google Scholar]
  19. Nackaerts, E.; Broeder, S.; Pereira, M.P.; Swinnen, S.P.; Vandenberghe, W.; Nieuwboer, A.; Heremans, E. Handwriting training in Parkinson’s disease: A trade-off between size, speed and fluency. PLoS ONE 2017, 12, e0190223. [Google Scholar] [CrossRef] [PubMed]
  20. Mucha, J.; Zvoncak, V.; Galaz, Z.; Faundez-Zanuy, M.; Mekyska, J.; Kiska, T.; Smekal, Z.; Brabenec, L.; Rektorova, I.; Lopez-de Ipina, K. Fractional Derivatives of Online Handwriting: A New Approach of Parkinsonic Dysgraphia Analysis. In Proceedings of the 2018 41st International Conference on Telecommunications and Signal Processing (TSP), Athens, Greece, 4–6 July 2018; pp. 214–217. [Google Scholar]
  21. Kotsavasiloglou, C.; Kostikis, N.; Hristu-Varsakelis, D.; Arnaoutoglou, M. Machine learning-based classification of simple drawing movements in Parkinson’s disease. Biomed. Signal Process. Control 2017, 31, 174–180. [Google Scholar] [CrossRef]
  22. Taleb, C.; Khachab, M.; Mokbel, C.; Likforman-Sulem, L. Feature selection for an improved Parkinson’s disease identification based on handwriting. In Proceedings of the 2017 1st International Workshop on Arabic Script Analysis and Recognition (ASAR), Nancy, France, 3–5 April 2017; pp. 52–56. [Google Scholar]
  23. Moetesum, M.; Siddiqi, I.; Vincent, N.; Cloppet, F. Assessing visual attributes of handwriting for prediction of neurological disorders: A case study on Parkinson’s disease. Pattern Recognit. Lett. 2018. [Google Scholar] [CrossRef]
  24. Heremans, E.; Nackaerts, E.; Vervoort, G.; Vercruysse, S.; Broeder, S.; Strouwen, C.; Swinnen, S.P.; Nieuwboer, A. Amplitude Manipulation Evokes Upper Limb Freezing during Handwriting in Patients with Parkinson’s Disease with Freezing of Gait. PLoS ONE 2015, 10, e0142874. [Google Scholar] [CrossRef] [PubMed]
  25. Pereira, C.R.; Pereira, D.R.; da Silva, F.A.; Hook, C.; Weber, S.A.; Pereira, L.A.; Papa, J.P. A step towards the automated diagnosis of parkinson’s disease: Analyzing handwriting movements. In Proceedings of the 2015 IEEE 28th International Symposium on Computer-Based Medical Systems (CBMS), Sao Carlos, Brazil, 22–25 June 2015; pp. 171–176. [Google Scholar]
  26. Heremans, E.; Nackaerts, E.; Broeder, S.; Vervoort, G.; Swinnen, S.P.; Nieuwboer, A. Handwriting Impairments in People With Parkinson’s Disease and Freezing of Gait. Neurorehabil. Neural Repair 2016, 30, 911–919. [Google Scholar] [CrossRef]
  27. Pereira, C.R.; Weber, S.A.; Hook, C.; Rosa, G.H.; Papa, J.P. Deep Learning-Aided Parkinson. In Proceedings of the 2016 29th SIBGRAPI Conference on Graphics, Patterns and Images (SIBGRAPI), Sao Paulo, Brazil, 4–7 October 2016; pp. 340–346. [Google Scholar]
  28. Impedovo, D.; Pirlo, G.; Vessio, G. Dynamic Handwriting Analysis for Supporting Earlier Parkinson’s Disease Diagnosis. Information 2018, 9, 247. [Google Scholar] [CrossRef]
  29. Baleanu, D.; Jajarmi, A.; Bonyah, E.; Hajipour, M. New aspects of poor nutrition in the life cycle within the fractional calculus. Adv. Differ. Equ. 2018, 2018, 230. [Google Scholar] [CrossRef]
  30. Khalili Golmankhaneh, A.; Baleanu, D. New Derivatives on the Fractal Subset of Real-Line. Entropy 2016, 18, 1. [Google Scholar] [CrossRef]
  31. Podlubny, I. Fractional Differential Equations an Introduction to Fractional Derivatives, Fractional Differential Equations, to Methods of Their Solution and Some of Their Applications; Academic Press: San Diego, CA, USA, 1999. [Google Scholar]
  32. Uchaikin, V.V. Fractional Derivatives for Physicists and Engineers; Springer: Berlin, Germany, 2013; Volume 2. [Google Scholar]
  33. Samko, S.G.; Kilbas, A.A.; Marichev, O.I. Fractional Integrals and Derivatives: Theory and Applications; Gordon and Breach: Yverdon, Switzerland, 1993; p. 44. [Google Scholar]
  34. Arshad, S.; Baleanu, D.; Bu, W.; Tang, Y. Effects of HIV infection on CD4+ T-cell population based on a fractional-order model. Adv. Differ. Equ. 2017, 2017, 92. [Google Scholar] [CrossRef]
  35. Pinto, C.M.; Machado, J.T. Fractional model for malaria transmission under control strategies. Comput. Math. Appl. 2013, 66, 908–916. [Google Scholar] [CrossRef] [Green Version]
  36. Lopes, A.M.; Machado, J.T. Integer and fractional-order entropy analysis of earthquake data series. Nonlinear Dyn. 2016, 84, 79–90. [Google Scholar] [CrossRef]
  37. Lopes, A.M.; Machado, J.T. Application of fractional techniques in the analysis of forest fires. Int. J. Nonlinear Sci. Numer. Simul. 2016, 17, 381–390. [Google Scholar] [CrossRef]
  38. Scalas, E.; Gorenflo, R.; Mainardi, F. Fractional calculus and continuous-time finance. Phys. A Stat. Mech. Its Appl. 2000, 284, 376–384. [Google Scholar] [CrossRef]
  39. Baleanu, D. Fractional Calculus: Models and Numerical Methods; World Scientific: Singapore, 2012; Volume 3. [Google Scholar]
  40. Fahn, S.; Elton, R.L. UPDRS Development Committee (1987) Unified Parkinson’s Disease Rating Scale. In Recent Developments in Parkinson’s Disease; Macmillan: Florham Park, NJ, USA, 1987. [Google Scholar]
  41. Lee, J.Y.; Kim, J.W.; Lee, W.Y.; Kim, J.M.; Ahn, T.B.; Kim, H.J.; Cho, J.; Jeon, B.S. Daily dose of dopaminergic medications in Parkinson’s disease: Clinical correlates and a posteriori equation. Neurol. Asia 2010, 15, 137–143. [Google Scholar]
  42. Sesa-Nogueras, E.; Faundez-Zanuy, M.; Mekyska, J. An information analysis of in-air and on-surface trajectories in online handwriting. Cogn. Comput. 2012, 4, 195–205. [Google Scholar] [CrossRef]
  43. Alonso-Martinez, C.; Faundez-Zanuy, M.; Mekyska, J. A comparative study of in-air trajectories at short and long distances in online handwriting. Cogn. Comput. 2017, 9, 712–720. [Google Scholar] [CrossRef] [PubMed]
  44. Drotar, P.; Mekyska, J.; Rektorova, I.; Masarova, L.; Smekal, Z.; Faundez-Zanuy, M. A new modality for quantitative evaluation of Parkinson’s disease: In-air movement. In Proceedings of the 13th IEEE International Conference on BioInformatics and BioEngineering (BIBE 2013), Chania, Greece, 10–13 November 2013; pp. 1–4. [Google Scholar]
  45. Mekyska, J.; Faundez-Zanuy, M.; Mzourek, Z.; Galaz, Z.; Smekal, Z.; Rosenblum, S. Identification and rating of developmental dysgraphia by handwriting analysis. IEEE Trans. Hum.-Mach. Syst. 2017, 47, 235–248. [Google Scholar] [CrossRef]
  46. Tenreiro Machado, J. Fractional coins and fractional derivatives. Abstr. Appl. Anal. 2013, 2013, 205097. [Google Scholar] [CrossRef]
  47. Kilbas, A.A.; Srivastava, H.M.; Trujillo, J.J. Theory and Applications of Fractional Differential Equations; Elsevier: Amsterdam, The Netherlands, 2006. [Google Scholar]
  48. Scherer, R.; Kalla, S.L.; Tang, Y.; Huang, J. The Grünwald–Letnikov method for fractional differential equations. Comput. Math. Appl. 2011, 62, 902–917. [Google Scholar] [CrossRef]
  49. Chen, T.; Guestrin, C. Xgboost: A scalable tree boosting system. In Proceedings of the 22nd ACM Sigkdd International Conference on Knowledge Discovery and Data Mining, San Francisco, CA, USA, 13–17 August 2016; pp. 785–794. [Google Scholar]
  50. Matthews, B.W. Comparison of the predicted and observed secondary structure of T4 phage lysozyme. Biochim. Biophys. Acta 1975, 405, 442–451. [Google Scholar] [CrossRef]
  51. Dounskaia, N.; Van Gemmert, A.W.; Leis, B.C.; Stelmach, G.E. Biased wrist and finger coordination in Parkinsonian patients during performance of graphical tasks. Neuropsychologia 2009, 47, 2504–2514. [Google Scholar] [CrossRef] [Green Version]
  52. Teulings, H.L.; Contreras-Vidal, J.L.; Stelmach, G.E.; Adler, C.H. Parkinsonism Reduces Coordination of Fingers, Wrist, and Arm in Fine Motor Control. Exp. Neurol. 1997, 146, 159–170. [Google Scholar] [CrossRef]
  53. Ma, H.I.; Hwang, W.J.; Chang, S.H.; Wang, T.Y. Progressive micrographia shown in horizontal, but not vertical, writing in Parkinson’s disease. Behav. Neurol. 2013, 27, 169–174. [Google Scholar] [CrossRef]
Figure 1. Descriptive graphs of patients’ clinical characteristics: Unified Parkinson’s disease rating scale (UPDRS V) and Parkinson’s disease (PD) duration (in years). Histograms are visualized on the diagonal. A scatterplot with a line fitted using linear regression is visualized in the top-right corner. Residuals of the trained linear model are visualized in the bottom-left corner.
Applsci 08 02566 g001
Figure 2. Filled template of the PaHaW database.
Applsci 08 02566 g002
Figure 3. Handwriting samples of the repetitive loop task for HC and PD patients are on the left, and the resulting velocity profiles are on the right.
Applsci 08 02566 g003
Figure 4. Vertical velocity patterns of the sentence task for different orders of fractional-order derivatives (FD).
Applsci 08 02566 g004
Table 1. Overview of related works focused on computerized analysis of Parkinson’s disease (PD) dysgraphia.
First AuthorYearPD/HCHandwriting TaskAnalysisFeaturesConclusions
Drotar * [17]201537/38letters, words, sentencesdifferential analysis (SVM)kinematic, temporal, spatial, entropy, EMD, signal energyThe highest classification accuracy after feature selection approach was 88.13%.
Drotar * [16]201537/38letters, words, sentencesdifferential analysis (SVM)kinematic, temporal, spatial, entropy, EMD, pressureClassification performance was at its peak with on-surface features equal to AUC = 89.09%.
Heremans [24]201534/10up/down strokes at varying amplitudesANOVAspatial and kinematicSignificant difference between groups was in spatial (F(2.41) = 3.97; p = 0.03).
Pereira [25]201537/18Archimedean spiraldifferential an. (SVM, NB, OPF)mean relative tremor and spatial parametersThe best results were obtained by NB classifier that provided around 79% classification accuracy.
Drotar * [8]201637/38letters, words, Archimedean spiral, sentencesdifferential an. (SVM, K-NN, ADA)kinematic, temporal, spatial, entropy, EMD, pressureCombining all exercises, SVM proved to be the best classifier with 82.5% accuracy.
Heremans [26]201630/15repetitive cursive loopsANOVA, correlation an.writing amplitude and velocityPD dysgraphia is more severe in patients with freezing of gait.
Pereira [27]201614/21Archimedean spiral, meanderdifferential an. (CNN, OPF)pen-based featuresThe best result was obtained by CNN with 87.14% classification accuracy using meander task.
Kotsavasil [21]201724/20horizontal linesdifferential analysis (NB)kinematicAverage classification accuracy was 91%.
Loconsole [18]20174/7sentence, repetitive loopsdifferential analysis (ANN)temporal, kinematic, spatialHighest classification accuracy (96.81%) was achieved using all the extracted features.
Taleb [22]201716/16letters, waves, wordsdifferential analysis (SVM)kinematic, stroke, pressure, entropy, energy, EMDThe highest classification accuracy was 96.88% for 12 kinematic and pressure features.
Moetesum * [23]201837/38Archimedean spiral, letters, words, sentence, loopsdifferential analysis (SVM)CNN-based featuresExtraction of features using CNN applied on raw handwriting data resulted in 83% classification accuracy.
Mucha * [20]201830/36Archimedean spiraldifferential analysis (RF, SVM)fractional derivatives based kinematic featuresImprovement of classification accuracy by 10% (72.38%) in comparison to the baseline.
Impedovo * [28]201837/38Archimedean spiral letters, words, sentencedifferential an. (RF, SVM, K-NN, NB, LDA, ADA)kinematic, temporal, spatial, entropy, EMD, pressureAnalysis focused on PD diagnosis at earlier stages resulted in 74.76% classification accuracy.
SVM—support vector machine; EMD—empirical mode decomposition; K-NN—K-nearest neighbors; ANOVA—analysis of variance; NB—naïve Bayes classifier; OPF—optimum path forest; ANN—artificial neural network; CNN—convolutional neural network; RF—random forests; LDA—Linear Discriminant Analysis; ADA—AdaBoost; AUC—area under the receiver operating characteristics (ROC) curve; articles are sorted by the year of release and then alphabetically; * analyzes performed on the same database (Parkinson’s disease handwriting database (PaHaW) [8]).
Table 2. Demographic and clinical data of the enrolled participants.
GenderNAge [years]PD dur [years]UPDRS VLED [mg/day]
Parkinson’s disease patients
Females1771.76 ± 10.939.88 ± 5.272.18 ± 0.861146.03 ± 543.89
Males1666.50 ± 13.447.44 ± 4.042.31 ± 0.751673.38 ± 616.66
All3369.21 ± 11.108.70 ± 4.822.24 ± 0.801401.72 ± 630.71
Healthy controls
Females1761.59 ± 10.17---
Males1963.32 ± 13.14---
All3662.50 ± 11.70---
PD—Parkinson’s disease; N—number of subjects; PD dur—PD duration; UPDRS V—Unified Parkinson’s disease rating scale, part V: Modified Hoehn and Yahr staging score [40]; LED—L-dopa equivalent daily dose [41].
Table 3. Description of the PaHaW handwriting tasks.
NTaskCzech (Original)English (Translation)
1Archimedean spiral--
2repetitive loops--
3letterll
4syllablelele
5wordlesforest
6wordlektorkalecturer
7wordporovnatcompare
8wordnepopadnoutnot grasped
9sentenceTramvaj dnes už nepojede.The tram will no longer go today.
Table 4. Feature sets matrix.
MovementFD (Count)Conventional (Count)Together (Count)
on-surface45366185154
in-air29164043320
together745210228474
Table 5. Results of partial correlation analysis between handwriting features and clinical data.
UPDRS V
FD on-sufaceConventional on-surface
feature name α task r p r s r s r p taskfeature name
jerk (median)0.3r. letters l0.37 *0.48 **−0.45 *−0.24r. letters leh. jerk (max)
jerk (median)0.4r. letters l0.43 *0.46 *−0.43 *−0.2r. letters levelocity (max)
h. velocity (std)0.1r. letters l−0.42 *−0.41 *−0.42 *0.25r. letters lh. jerk (max)
v. acceleration (mean)0.7r. loops0.48 **0.40 *−0.42 *−0.16r. letters lh. velocity (max)
v. velocity (std)0.3sentence0.40 *0.40 *−0.41 *−0.15letter lh. velocity (max)
FD in-airConventional in-air
feature name α task r p r s r s r p taskfeature name
v. velocity (median)0.9sentence0.44 *0.53 **0.43 *0.28r. word lektorkaacceleration (mean)
v. velocity (median)0.8sentence0.40 *0.52 **−0.37 *−0.31word porovnath. jerk (max)
h. velocity (median)0.5r. letters le−0.38 *−0.49 **0.36 *0.25r. letters lv. velocity (median)
v. jerk (median)0.3r. letters le−0.43 *−0.49 **0.350.41 *r. letters leh. velocity (median)
v. velocity (median)0.7sentence0.37 *0.48 **0.350.19r. word lektorkaacceleration (median)
PD Duration
FD on-surfaceConventional on-surface
feature name α task r p r s r s r p taskfeature name
velocity (max)0.1spiral0.54 **0.55 **−0.46 *−0.40 *r. letters lh. velocity (max)
acceleration (max)0.8spiral0.54 **0.54 **−0.40 *−0.37 *r. letters lh. jerk (max)
acceleration (max)0.6spiral0.54 **0.54 **−0.38 *−0.37 *r. letters lvelocity (max)
acceleration (max)0.2spiral0.54 **0.54 **0.46 **0.34spiralv. velocity (mean)
acceleration (max)0.7spiral0.54 **0.53 **0.40 *0.14r. loopsh. acceleration (mean)
FD in-airConventional in-air
feature name α task r p r s r s r p taskfeature name
jerk (median)0.4sentence−0.37 *−0.49 **−0.44 *−0.38 *word lektorkah. jerk (median)
jerk (max)0.1r. word les0.57 **0.46 *0.38 *0.40 *word nepopad.velocity (max)
jerk (max)0.3r. word les0.57 **0.45 *0.37 *0.42 *word lektorkah. n. jerk (mean)
velocity (max)0.1r. word les0.57 **0.45 *−0.47 **−0.13r. word lektorkah. velocity (mean)
jerk (max)0.2r. word les0.57 **0.45 *−0.42 *−0.13word nepopad.h. velocity (mean)
α —order of FD; r p —Pearson’s correlation coefficient; r s —Spearman’s correlation coefficient; v.—vertical; h.—horizontal; r.—repetitive task; *— p < 0.05 ; **— p < 0.01 ; rows are ordered by the absolute value of Spearman’s correlation coefficient.
Table 6. Results of multivariate binary classification analysis (PD/HC).
Feature SetMCCACC [%]SEN [%]SPE [%]Feat
conventional on-surface0.83 ± 0.1891.19 ± 9.6593.00 ± 15.5270.00 ± 0.461
conventional in-air0.95 ± 0.1097.14 ± 5.7195.50 ± 9.07100.00 ± 0.001
conventional together0.95 ± 0.1197.14 ± 5.7195.50 ± 9.07100.00 ± 0.001
FD on-surface0.95 ± 0.1287.14 ± 13.4882.00 ± 21.2490.00 ± 30.001
FD in-air0.95 ± 0.1381.43 ± 12.8671.50 ± 30.8360.00 ± 48.993
FD together0.95 ± 0.1481.43 ± 15.7169.50 ± 32.1370.00 ± 45.832
all on-surface0.95 ± 0.1588.33 ± 14.0689.00 ± 22.1170.00 ± 45.832
all in-air0.95 ± 0.1697.14 ± 5.7195.50 ± 9.07100.00 ± 0.001
all together0.95 ± 0.1797.14 ± 5.7195.50 ± 9.07100.00 ± 0.001
MCC—Matthew’s correlation coefficient; ACC—accuracy; SEN—sensitivity; SPE—specificity; feat.—number of features important for the trained model (i.e., feature importance of the feature > 0.0); The feature importances, as well as the exact names of these features, are summarized in the text.
Table 7. Results of regression analysis for clinical data.
Feature SetMAERMSEEER [%]Feat
UPDRS V
conventional on-surface0.59 ± 0.290.71 ± 0.4113.82 ± 6.711
conventional in-air0.60 ± 0.300.72 ± 0.4214.01 ± 6.981
conventional together0.60 ± 0.310.73 ± 0.4214.05 ± 6.901
FD on-surface0.60 ± 0.320.65 ± 0.4512.51 ± 7.551
FD in-air0.60 ± 0.330.68 ± 0.4313.49 ± 7.291
FD together0.60 ± 0.340.66 ± 0.4513.06 ± 7.552
all on-surface0.60 ± 0.350.65 ± 0.4512.51 ± 7.551
all in-air0.60 ± 0.360.71 ± 0.4313.72 ± 7.361
all together0.60 ± 0.370.66 ± 0.4513.06 ± 7.552
PD duration
conventional on-surface4.29 ± 0.945.03 ± 1.0924.52 ± 5.3918
conventional in-air4.91 ± 1.385.56 ± 1.5028.03 ± 7.8516
conventional together4.14 ± 1.324.85 ± 1.5223.64 ± 7.5516
FD on-surface4.45 ± 0.665.06 ± 0.8525.40 ± 3.7514
FD in-air4.79 ± 0.735.48 ± 0.7227.36 ± 4.2019
FD together4.55 ± 0.685.32 ± 0.7826.00 ± 3.8821
all on-surface4.48 ± 0.865.12 ± 0.9625.62 ± 4.9216 (12 F, 4 C)
all in-air4.95 ± 1.185.59 ± 1.1728.30 ± 6.7517 (13 F, 4 C)
all together4.70 ± 1.105.45 ± 1.2326.82 ± 6.3017 (12 F, 6 C)
UPDRS V—Unified Parkinson’s disease rating scale, part V: Modified Hoehn and Yahr staging score [40]; MAE—mean absolute error; RMSE—root mean squared error; EER—estimation error rate; F—FD-based features; C—conventional handwriting features; feat.—number of features important for the trained model (i.e., feature importance of the feature > 0.0); The feature importances, as well as the exact names of these features for models built to assess UPDRS V, are summarized in the text. In the case of PD duration, this data can be found in Table S1 provided in the Supplementary Material.

