Article

Relationship between Cerebrospinal Fluid Matrix Metalloproteinases Levels and Brain Amyloid Deposition in Mild Cognitive Impairment

1
Department of Neurology, Faculty of Medicine, Oita University, Oita 879-5593, Japan
2
Kameda Medical Center, Chiba 296-8602, Japan
*
Author to whom correspondence should be addressed.
Submission received: 25 August 2021 / Revised: 6 October 2021 / Accepted: 8 October 2021 / Published: 11 October 2021
(This article belongs to the Special Issue Matrix Metalloproteinases in Health and Disease 2.0)

Abstract

:
This study aimed to explore whether cerebrospinal fluid (CSF) levels of matrix metalloproteinases (MMPs), and their inhibitors (TIMPs) were associated with brain amyloid deposition, cortical glucose metabolism, and white matter lesions (WMLs) in individuals with amnestic mild cognitive impairment (MCI). A total of 33 individuals with amnestic MCI (mean age, 75.6 years) underwent 11C-Pittsburgh compound B positron emission tomography (PiB-PET), 18F-fluorodeoxyglucose positron emission tomography, magnetic resonance imaging or computed tomography, and CSF analysis. PET uptake of the frontal and temporoparietal lobes and posterior cingulate gyrus was assessed using the cerebellar cortex as the reference region. WMLs were assessed by the Fazekas scale. CSF levels of MMPs and TIMPs were measured with bead-based multiplex assays. After adjusting for covariates, multiple linear regression analysis showed that CSF levels of MMP-2 were negatively correlated with global PiB uptake (p = 0.035), especially in the parietotemporal lobe and posterior cingulate gyrus (p = 0.016 and p = 0.041, respectively). Moreover, CSF levels of MMP-7 were positively correlated with the severity of WMLs (p = 0.033). CSF levels of MMP-2 and MMP-7 are associated with brain amyloid deposition and severity of WMLs, respectively. These findings provide valuable insights into the role of MMPs in amyloid β catabolism and blood–brain barrier integration at the MCI stage.

1. Introduction

Matrix metalloproteinases (MMPs) are a family of zinc- and calcium-dependent endopeptidases secreted primarily from neurons and glia [1]. Their activation or activity is regulated by members of the tissue inhibitor of the metalloproteinase (TIMP) family [2]. MMPs cleave most extracellular matrix proteins and are implicated in various physiological functions, such as tissue remodeling, inflammation, and angiogenesis [1,3]. Recent evidence suggests that MMPs and TIMPs contribute to the pathogenesis of Alzheimer’s disease (AD) [4,5,6,7,8]. The two-hit vascular hypothesis of AD proposes that aging and vascular risk factors lead to the dysregulation of the blood–brain barrier (BBB) and oligemia, resulting in impaired amyloid β (Aβ) clearance and increased Aβ production [9,10]. MMPs is highly expressed in the postmortem AD brain tissue [5]. Moreover, MMPs degrade Aβ protein [4,5], tight junction, and basement membrane proteins [11,12,13,14]. However, it remains unclear whether MMPs have protective or detrimental roles in the pathogenesis of AD. Previously, we reported that plasma levels of MMPs and TIMPs were not associated with brain amyloid deposition but the severity of white matter lesions (WMLs) in individuals with amnestic mild cognitive impairment (MCI) [15]. However, cerebrospinal fluid (CSF) more precisely reflects biochemical changes in the brain compared with blood [16]. In fact, several studies showed that the CSF levels of MMPs and TIMPs were correlated with AD biomarkers [17,18,19,20]. To our knowledge, few studies have investigated the relationship between CSF levels of MMPs and TIMPs and imaging biomarkers, such as 11C-Pittsburgh compound B positron emission tomography (PiB-PET), 18F-fluorodeoxyglucose positron emission tomography (FDG-PET), and magnetic resonance imaging (MRI) or computed tomography (CT). Structural and functional imaging techniques are useful for identifying individuals at increased risk of developing AD. In particular, PiB-PET can detect brain amyloid deposition and predict conversion from MCI to AD [21,22]. WMLs on MRI or CT are frequently observed in patients with AD and influence cognitive function or cerebral perfusion [23,24]. BBB disruption and chronic hypoperfusion are the main causes of WMLs [25,26]. We hypothesized that CSF levels of MMPs and TIMPs may be associated with brain amyloid deposition and BBB disruption, resulting in white matter degeneration at the MCI stage. Therefore, this study aimed to examine the potential associations among CSF levels of MMPs and TIMPs, brain amyloid deposition, cortical glucose metabolism, and WMLs in individuals with amnestic MCI.

2. Materials and Methods

2.1. Subjects

Thirty-three individuals with amnestic MCI (11 men and 22 women; mean age, 75.6 ± 5.4 years) were recruited from outpatients at the Department of Neurology, Oita University Hospital, between 2012 and 2018. The diagnosis of amnestic MCI was made according to previous study [15]. All individuals had an ischemic score of 4 or lower on Hachinski’s scale [27]. Evaluation of cognitive function, brain MRI or CT, PiB- and FDG-PET, and CSF measurements of MMPs and TIMPs were performed in all individuals. Information regarding age, sex, and education level was collected. Mini-Mental State Examination (MMSE) was used to evaluate cognitive function. Assessment of vascular risk factor data, including hypertension, diabetes mellitus, and hypercholesterolemia, was based on detailed clinical history and medication use.

2.2. Multiplex Assay

Lumbar puncture was performed between 9:00 and 10:00 a.m. with fasted patients in the lateral recumbent position. CSF samples were collected after centrifugation at 1500× g for 10 min. The supernatant was frozen and stored in 1 mL aliquots at −80 °C until use. We performed multiplex bead-based assays to determine the CSF levels of MMPs and TIMPs. CSF concentrations of nine MMPs and two TIMPs were simultaneously measured using the Bio-Plex Pro Human MMP panel, including MMP-1, MMP-2, MMP-3, MMP-7, MMP-8, MMP-9, MMP-10, MMP-12, and MMP-13 (171-AM001M; Bio-Rad) and Milliplex Map Human TIMP Magnetic Bead Panel 1, including TIMP-1 and TIMP-2 (HTMP1MAG-54K; Millipore). Data analysis was conducted on Bio-Plex 200 suspension array system (Bio-Rad, Hercules, CA, USA) with Bio-Plex Manager Software version 6.0. All CSF samples were run in duplicate on the same plate. These results were represented as the mean fluorescence intensity.

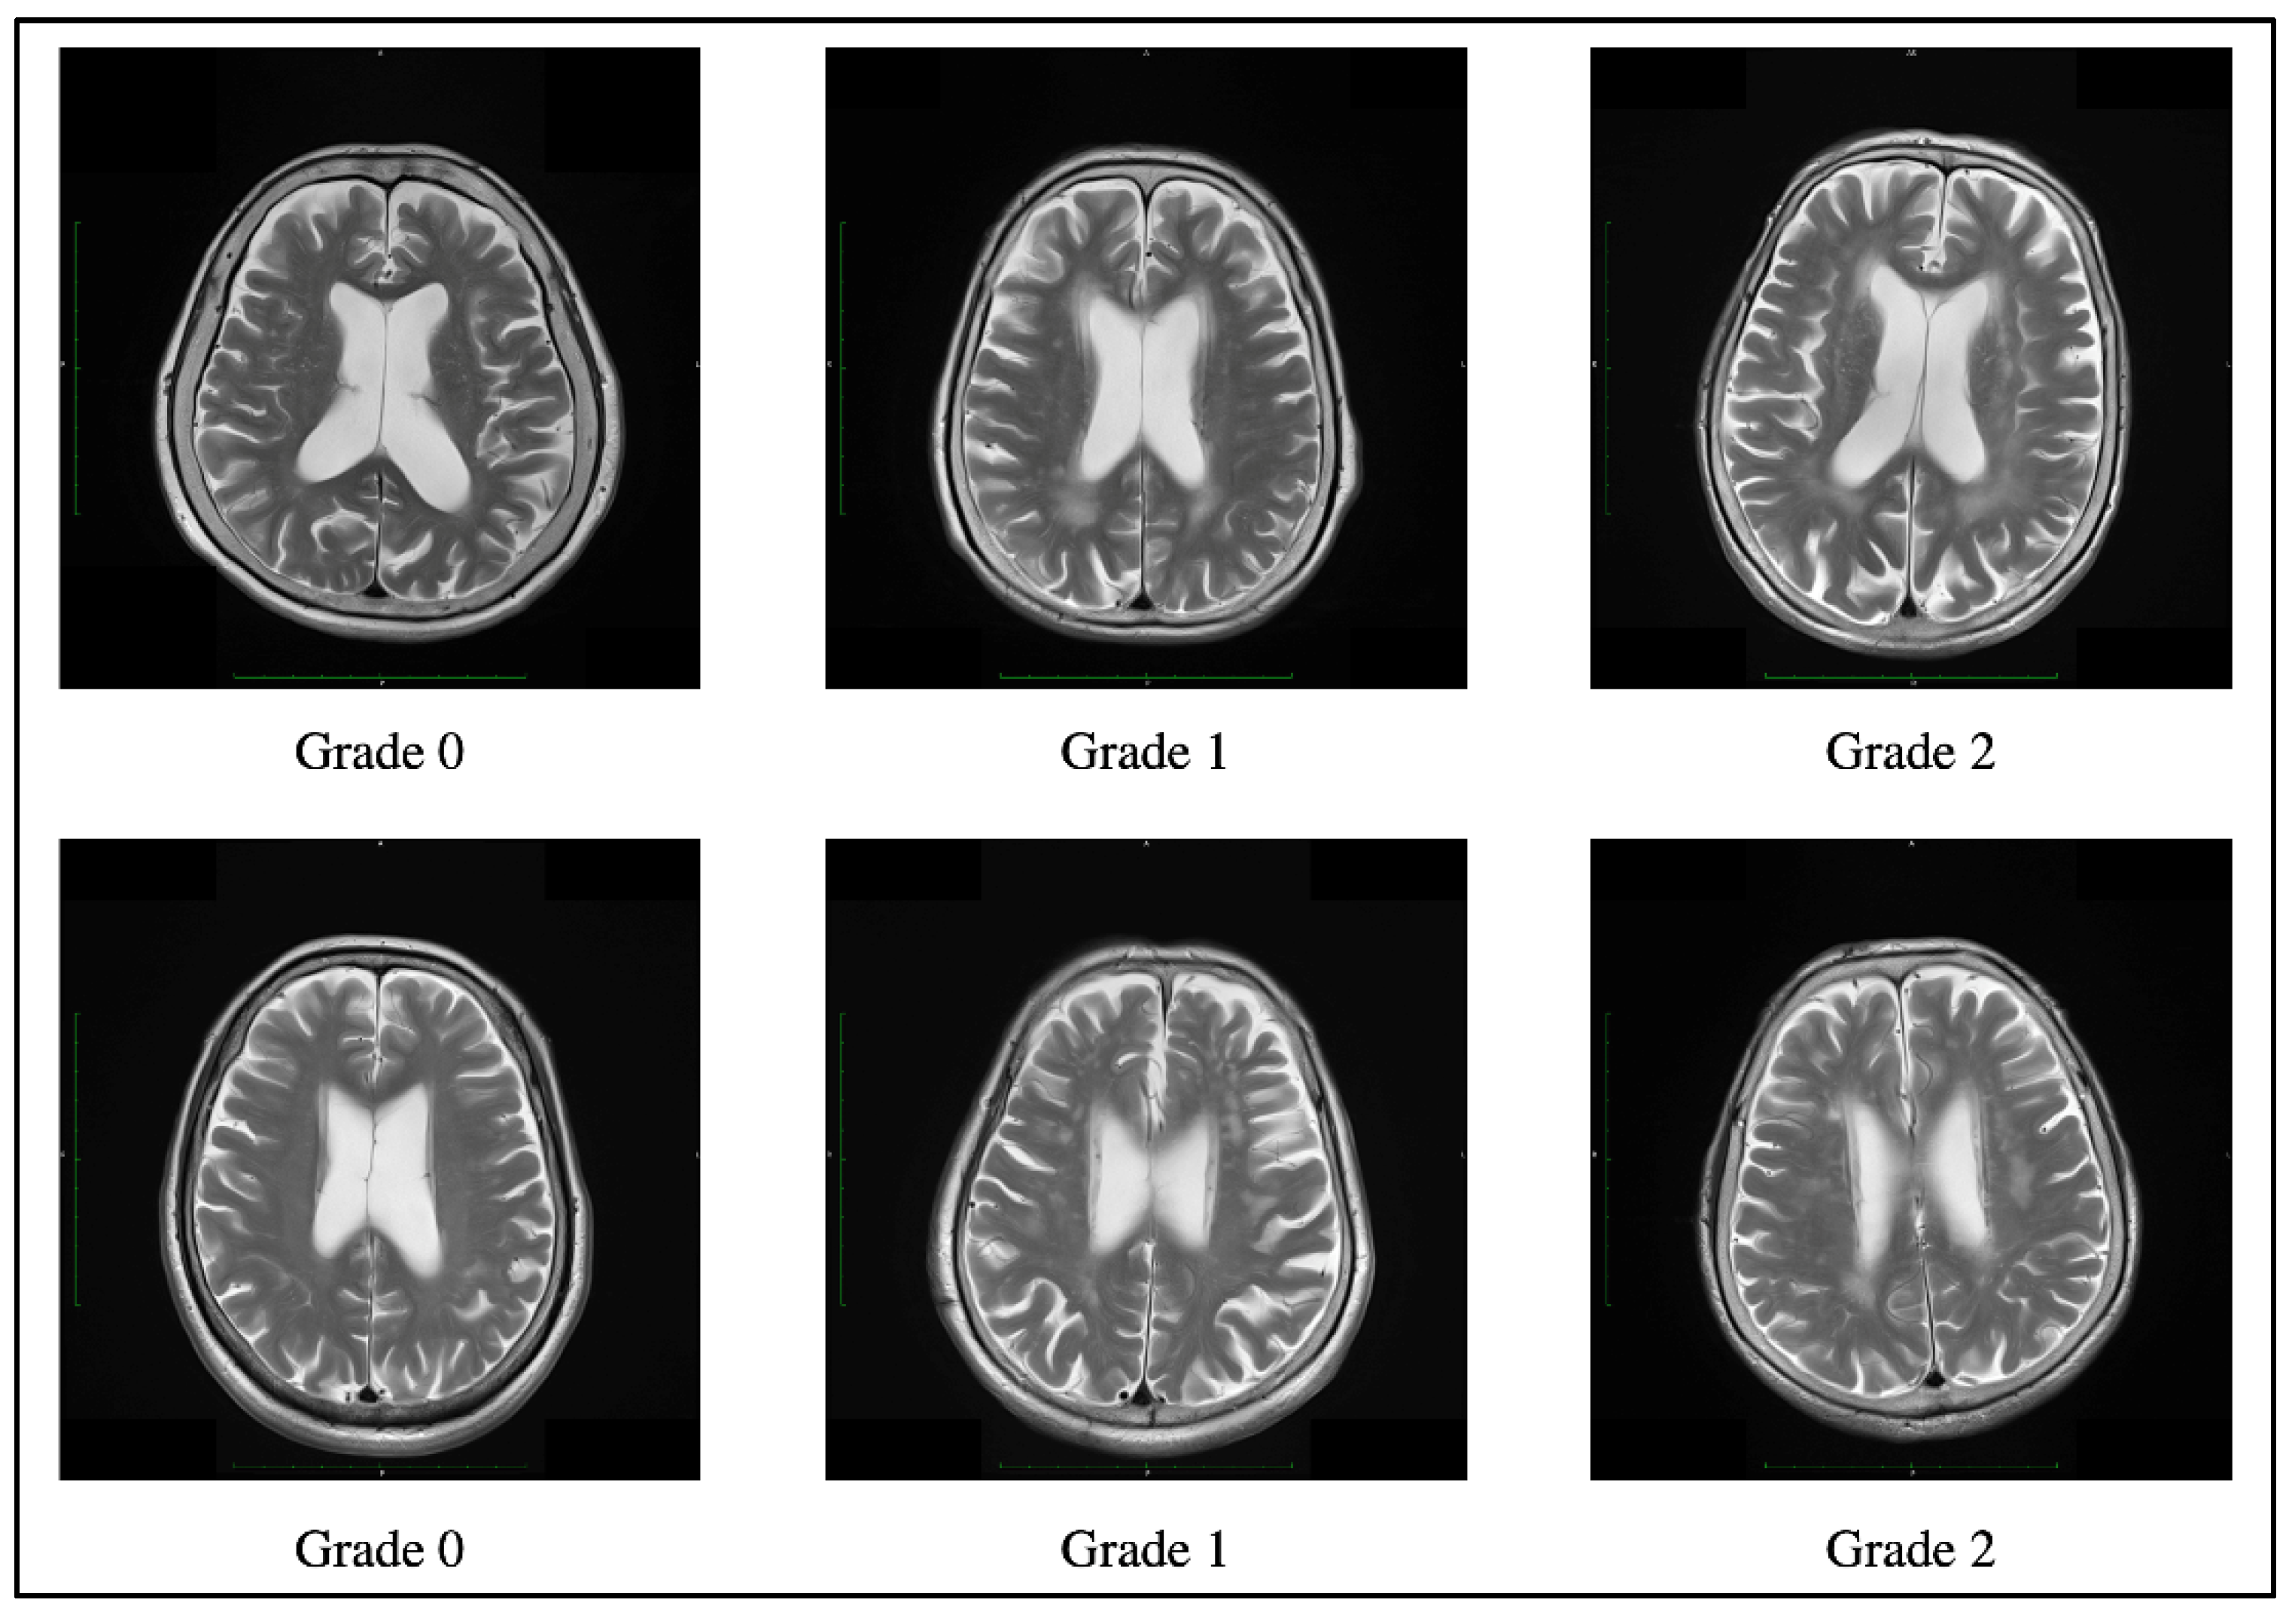
2.3. White Matter Lesion Assessment

WMLs were evaluated by MRI for 30 individuals and by CT for 3 individuals. Axial T1-weighted and T2-weighted MR images were obtained using a 3.0 T Siemens MRI scanner (Magnetom Verio; Siemens, Erlangen, Germany). The imaging parameters were as follows: repetition time (TR) of 1900 ms/echo time (TE) of 2.53 ms for T1-weighted images and TR 4000–5000 ms/TE 80–100 ms for T2-weighted images. Non-enhanced brain CT was performed with 3 mm continuous slices using Biograph 40 (Siemens, Erlangen, Germany). WML severity was assessed on T2-weighted images or CT scans using the Fazekas scale [28], according to previous studies [15,24]. Fazekas scale is widely used to classify periventricular or deep WMLs as graded 0 (absent) through 3 (severe). Briefly, the severity of periventricular WMLs was graded as follows: 0 for absent, 1 for “caps” or pencil-thin lining, 2 for smooth “halo”, and 3 for irregular periventricular lesions extending into the deep white matter. The severity of deep WMLs was graded as follows: 0 for absent, 1 for punctate foci, 2 for the beginning of confluent foci, and 3 for large confluent areas. In this study, the Fazekas scale was determined as the sum of the periventricular and deep WMLs scores (Figure 1). All images were independently evaluated by two neurologists blinded to the medical information. They discussed together for consensus in cases of disagreement. The severity of WMLs in all individuals was classified as grade 0, 1, or 2 on the Fazekas scale. Therefore, individuals with severe WMLs that might indicate vascular dementia were not included in this study.

2.4. Apolipoprotein E Phenotype
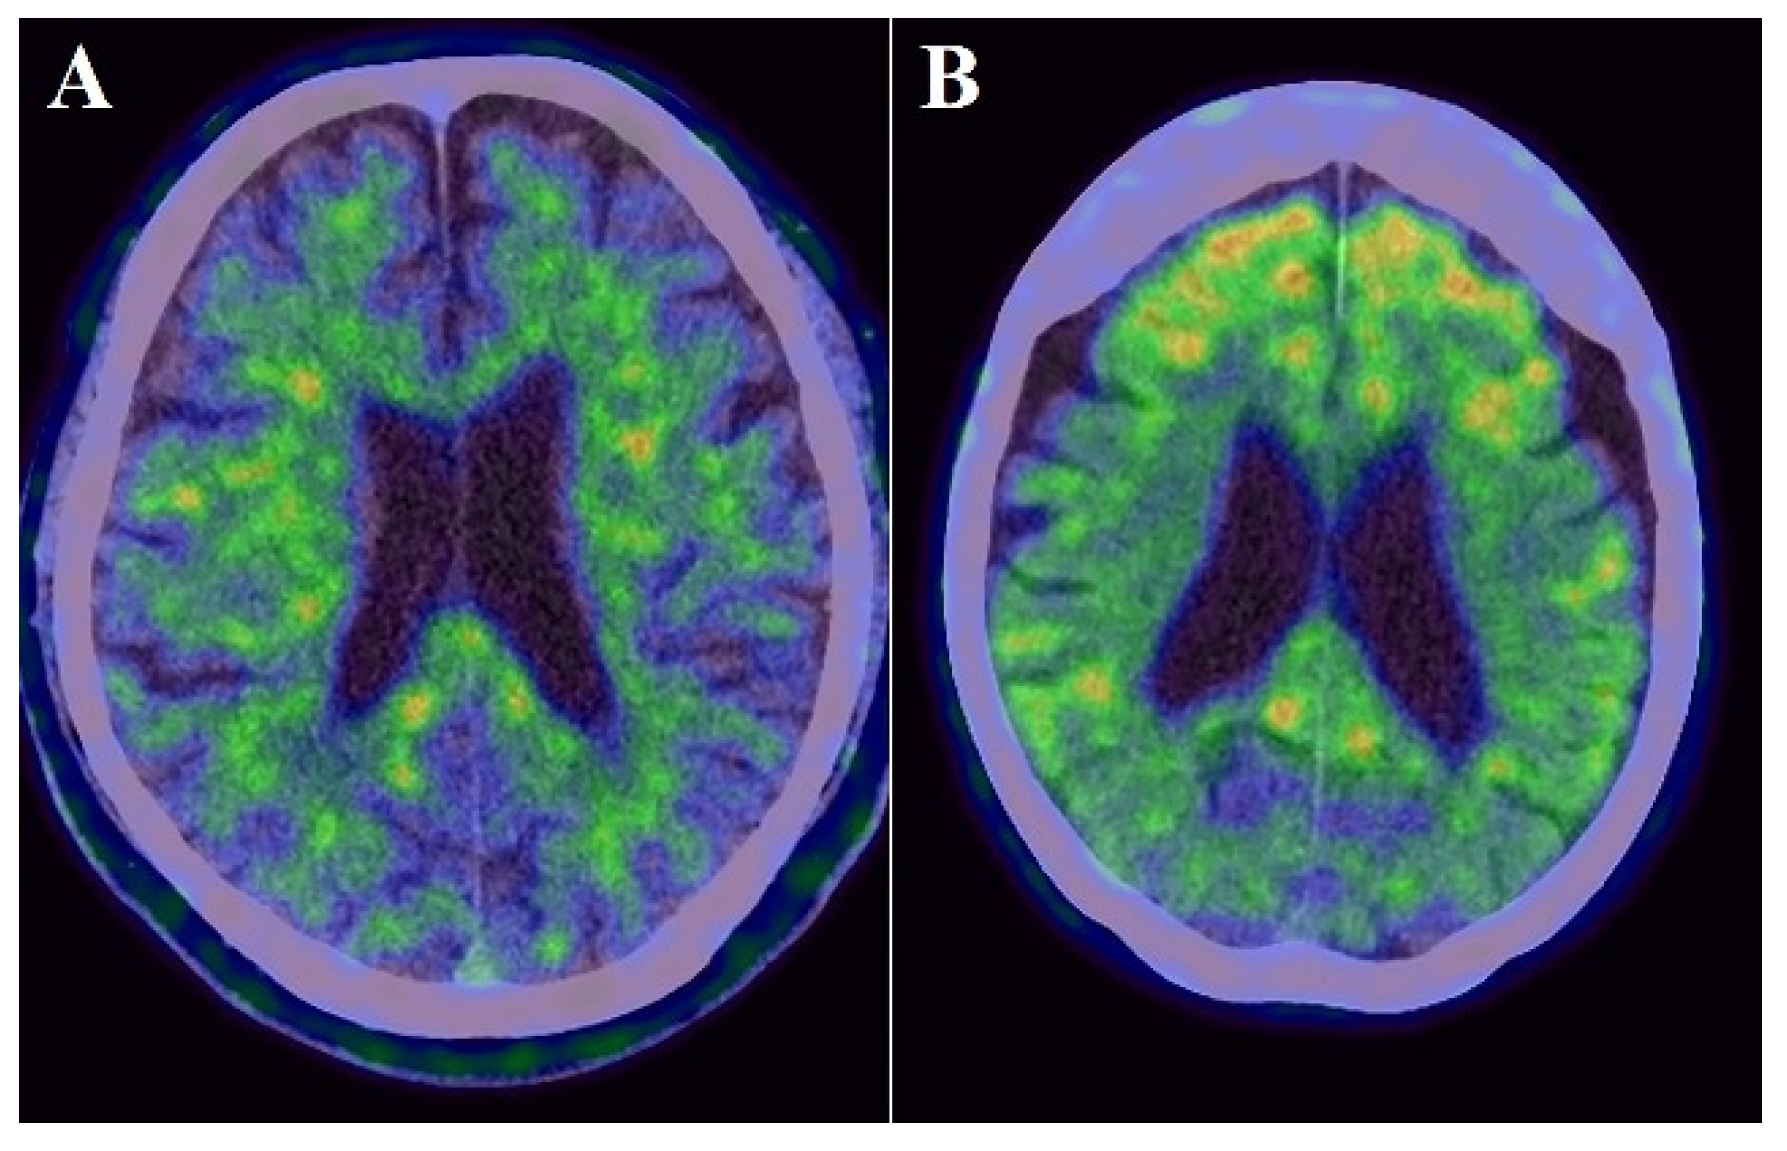
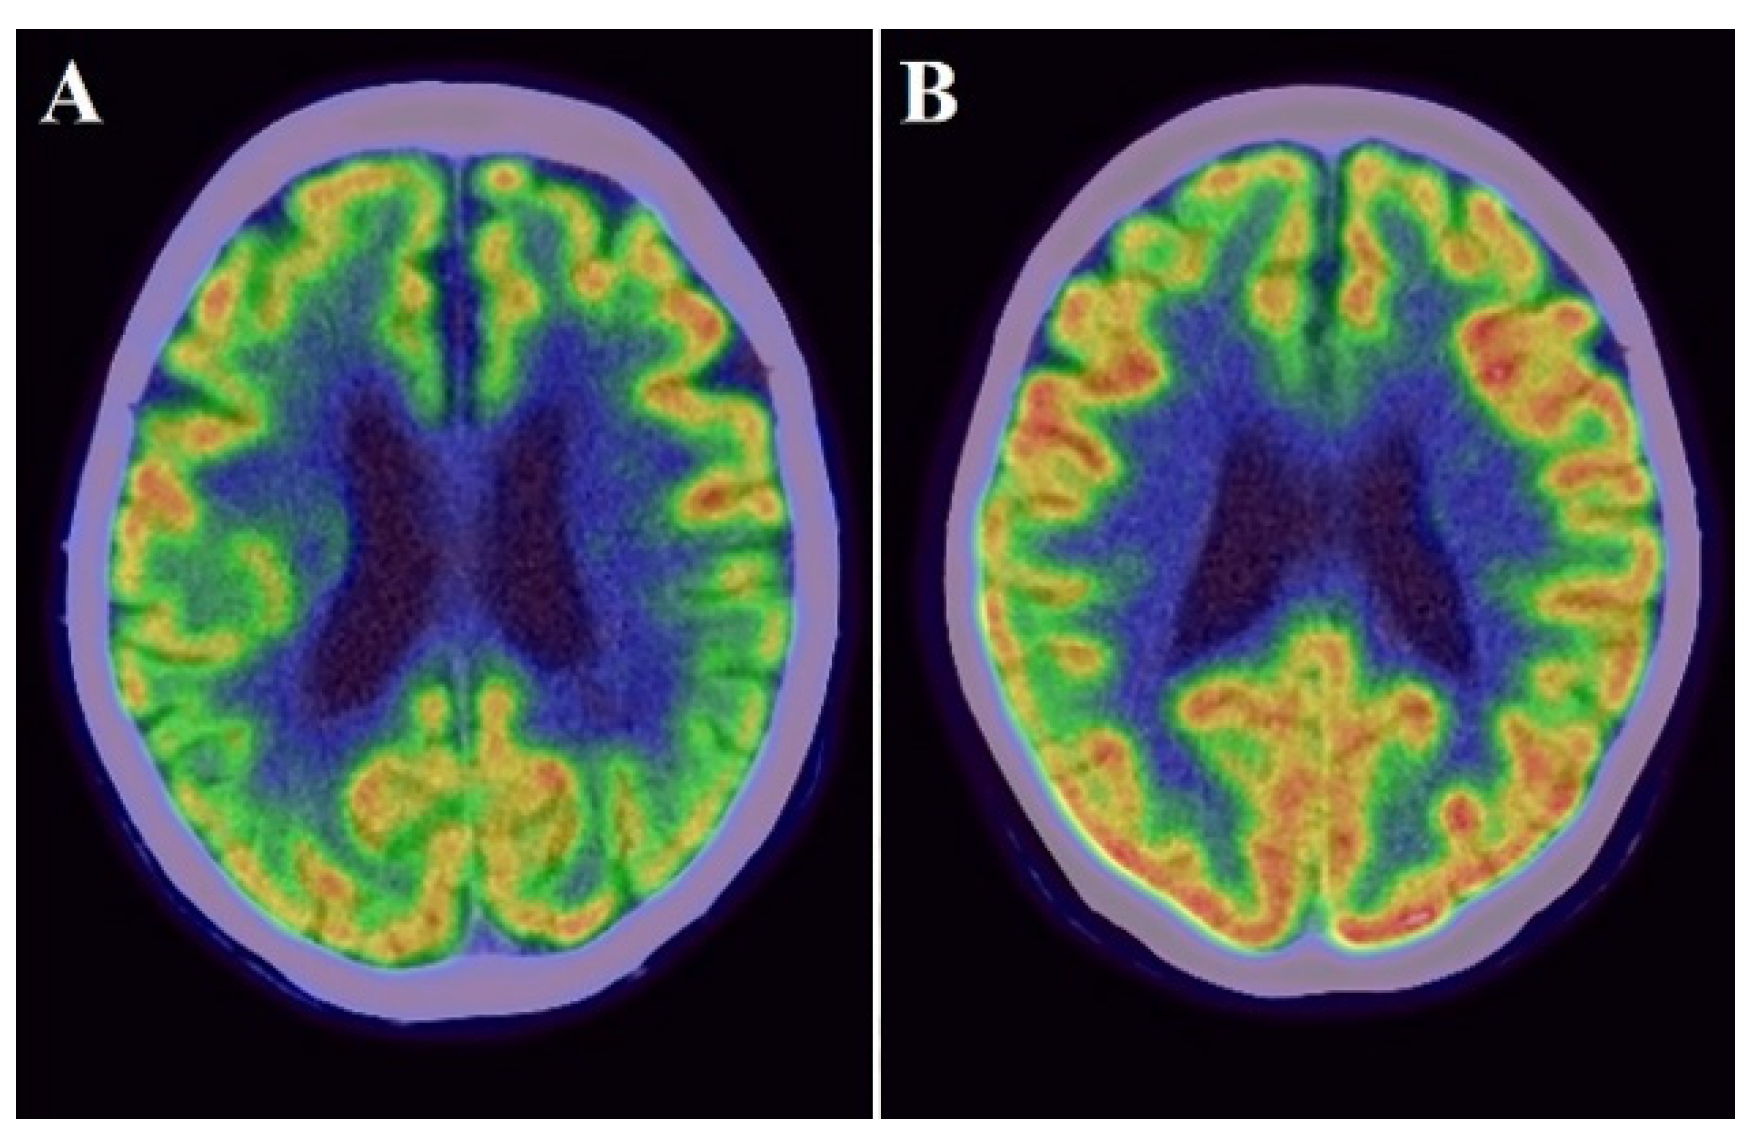
Human Apolipoprotein E4/Pan-APOE ELISA kit (MBL Co., Ltd., Woburn, MA, USA) was used to determine apolipoprotein E (APOE) phenotype. The amount of APOE4 and total APOE was measured with high sensitivity using an affinity-purified polyclonal antibody against APOE and a monoclonal antibody against APOE4 by sandwich enzyme-linked immunosorbent assay. The ratio of APOE and APOE4 levels can discriminate between homozygotes (ε4/ε4) or heterozygotes (ε2/ε4, ε3/ε4) of APOE4 phenotypes and non-APOE4 zygotes (ε2/ε2, ε3/ε3, and ε2/ε3) [29,30].

2.5. PET

Static PiB-PET and FDG-PET studies were conducted in three-dimensional scanning mode using a Siemens Biograph mCT PET scanner (Siemens) as previously described [15,30]. The reagents were provided by the PET center of our hospital. Participants received an intravenous bolus injection of PiB [mean ± standard deviation (SD) of radioactivity = 523 ± 47 MBq] and subsequent saline flush in the PiB-PET study. Then, PET images were acquired 50–70 min after the injection. To perform FDG-PET, all participants kept close their eyes and relaxed in a dimly lit room for 10 min before the injection. Then, they received a bolus intravenous injection of 3.0 MBq/kg FDG and subsequent saline flush. PET images were acquired 40–60 min after the injection. The radiation in pre-pose and post-dose samples was measured using a radiation detector for the calculation of injected dose in each participant. All imaging data were reconstructed into a 3.0-mm thick slice, on a 256 × 256 matrix, and at 3.0× magnification with an ordered-subset expectation maximization that includes four iterations and 12 subsets. The reconstructed images had a pixel size of 1.06 mm. The PiB-PET and FDG-PET scans were both spatially normalized to the Montreal Neurological Institute reference space through a customized PET template using Statistical Parametric Mapping version 8 (Wellcome Trust Centre for Neuroimaging, https://www.fil.ion.ucl.ac.uk/spm/) (accessed date 7 October 2021). Regions of interest (ROIs), such as the frontal lobe, temporoparietal lobe, posterior cingulate gyrus, and cerebellum, were determined using the MarsBaR (MRC Cognition and Brain Sciences Unit) ROI toolbox for Statistical Parametric Mapping as described previously [24]. These ROIs were established as areas with amyloid deposition and decreased cortical glucose metabolism in patients with AD [31,32]. PiB and FDG uptake was assessed by a standardized uptake value ratio (SUVR). The ROI values were averaged across both hemispheres. The globally standardized uptake value ratio of FDG-PET and PiB-PET was represented as a single mean value for all regions combined (Figure 2 and Figure 3). Higher amyloid uptake was determined using a mean cortical SUVR of 1.4 or higher as the cut off [30].

2.6. Statistical Analysis

We performed a multiple regression model to investigate the relationship among the CSF levels of MMPs and TIMPs, the PiB and FDG uptake values, and Fazekas scale scores after adjusting for covariates, such as age, sex, education level, frequency of each vascular risk factor, and APOE4 status. Additionally, the relationship between the CSF levels of MMPs and TIMPs and PiB uptake values in each ROI was assessed by a multiple regression model. Statistical analyses were performed using IBM SPSS Statistics for Windows version 25.0 (IBM Corp., Armonk, NY, USA). A p-value < 0.05 was considered significant.

3. Results

3.1. Clinical and Demographic Characteristics

Table 1 summarizes the sociodemographic factors, PET imaging, and Fazekas scale of individuals with amnestic MCI. The mean participant age was 75.6 ± 5.4 years; 11 (33.3%) were males, and 22 (66.7%) were females. The mean education level of 11.4 ± 1.9 years. The mean MMSE score was 24.8 ± 2.0. Additionally, 11 individuals (33.3%) were APOE4 carriers. The frequencies of hypertension, diabetes mellitus, and hypercholesterolemia were 60.6%, 9.1%, and 51.5%, respectively. 17 individuals (51.5%) were included in the higher PiB subgroup based on a PiB-PET SUVR cutoff of 1.4, while 20 individuals (60.6%) showed WMLs on MRI or CT. The severity of WMLs in all individuals was classified as grade 0, 1, or 2 on the Fazekas scale. The severity of periventricular WMLs was grade 1 in 9 individuals (27.3%) and grade 2 in 7 individuals (21.2%); the scores for deep WMLs were grade 1 in 7 individuals (21.2%) and grade 2 in 7 individuals (21.2%). There were no significant differences in CSF levels of MMPs and TIMPs between individuals with and without APOE4 or between individuals with and without vascular risk factors (Supplementary Tables S1 and S2).

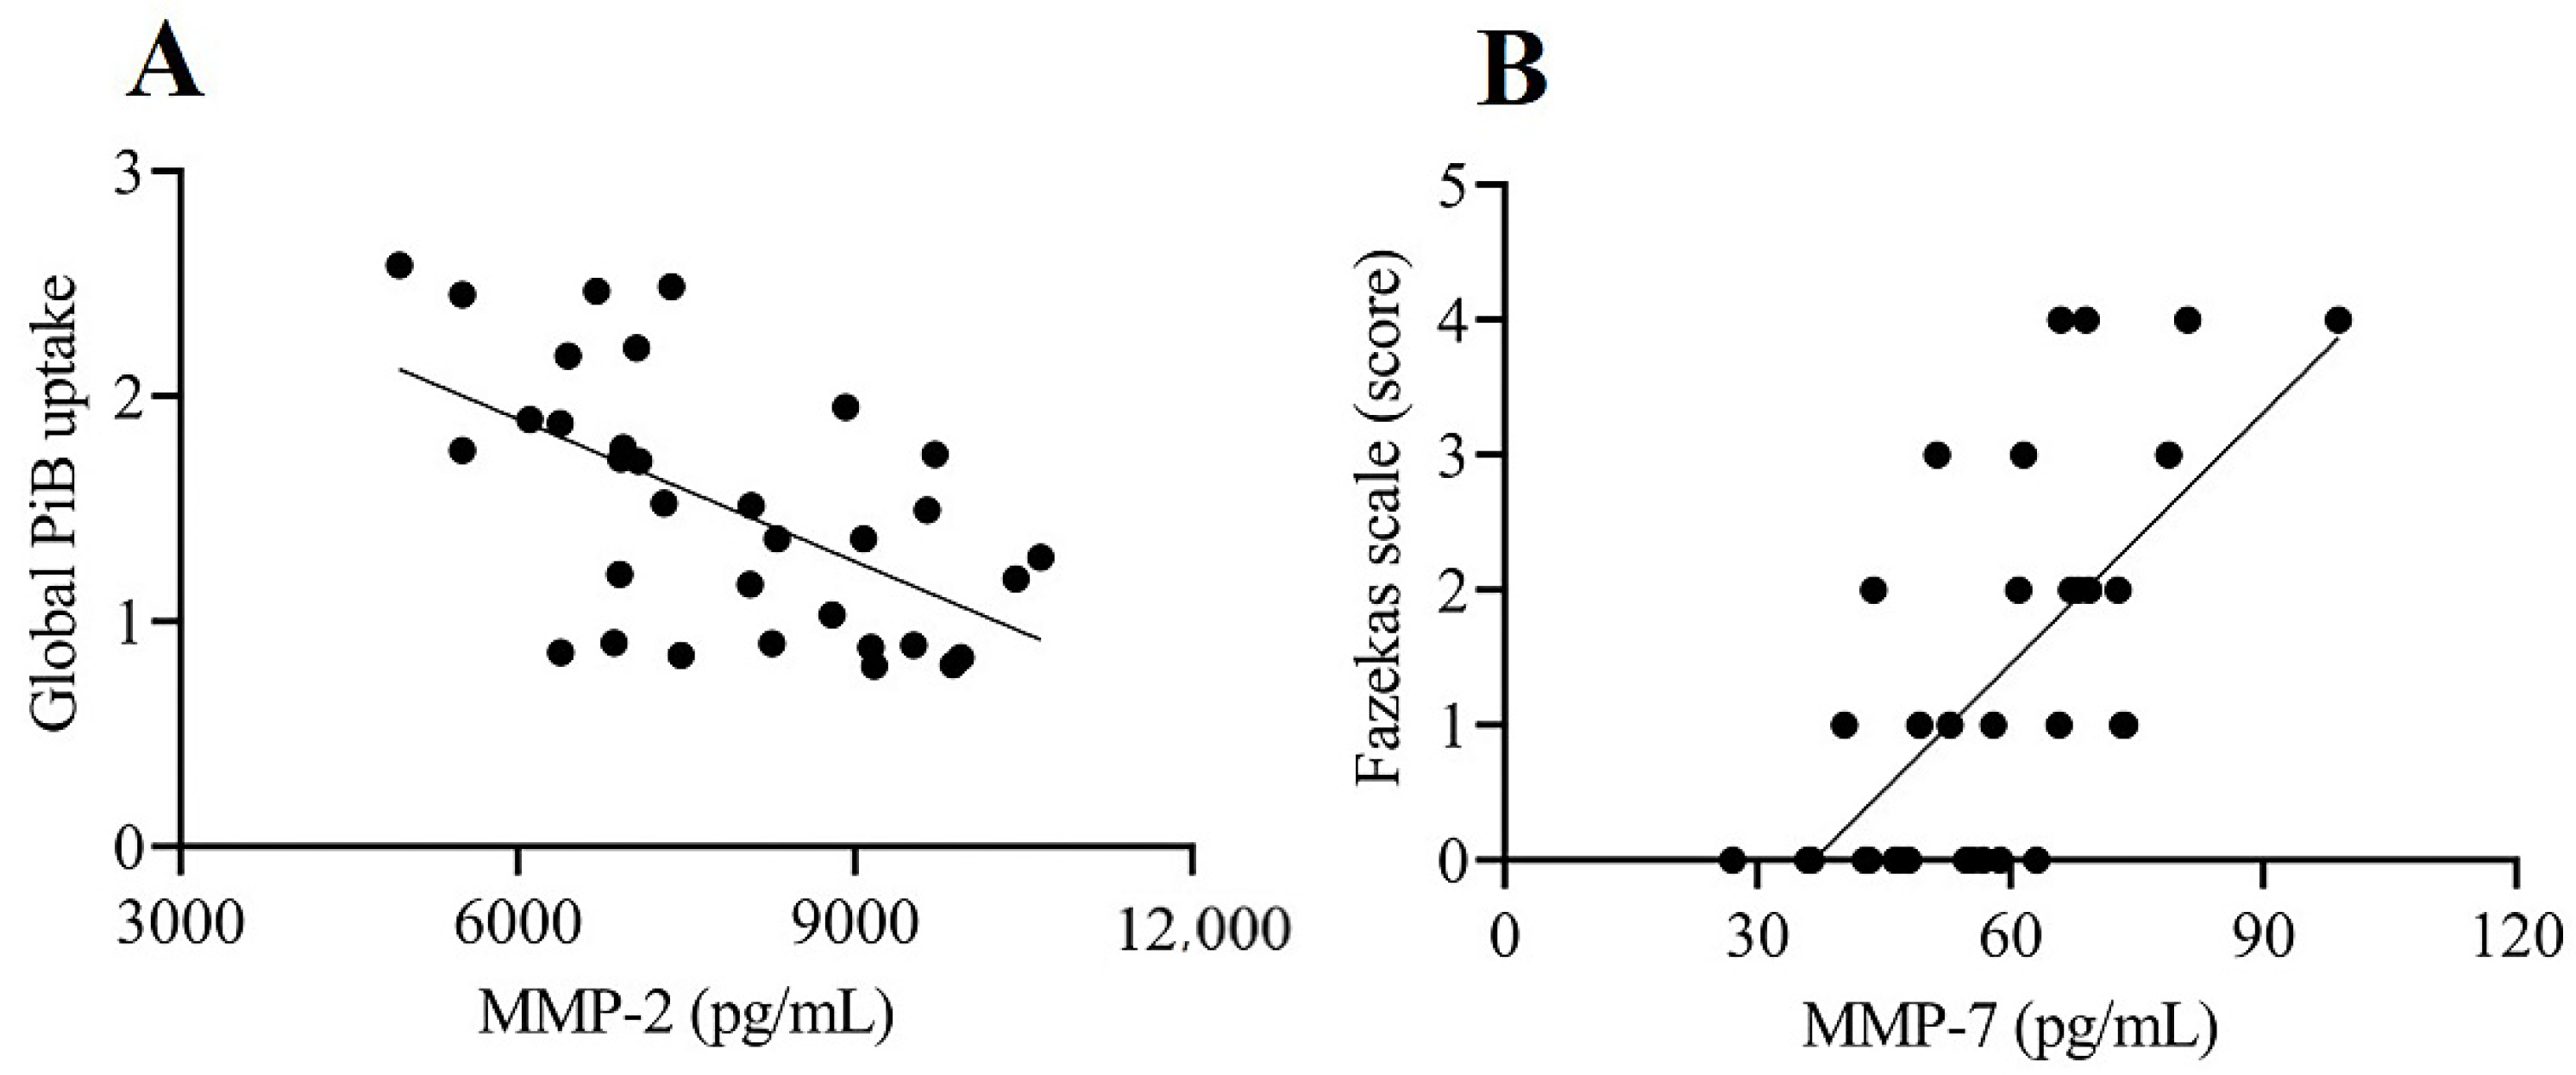
3.2. Relationship among CSF Levels of MMPs and TIMPs and PiB and FDG Uptake Values and Fazekas Scale Scores

The results of the multiple regression models among CSF levels of MMPs and TIMPs, PET imaging variables, and Fazekas scale scores are summarized in Table 2 and Table 3. MMP-1, MMP-3, MMP-8, MMP-9, MMP-10, and MMP-13 were below the limit of detection in most samples. The remaining three MMPs (MMP-2, MMP-7, and MMP-12) and two TIMPs (TIMP-1 and TIMP-2) were detectable and included in the analysis. CSF levels of MMP-2 were negatively correlated with global PiB uptake after adjusting for covariates [β = −0.414; 95% confidence interval (CI), −0.796 to −0.032, p = 0.035; Table 2 and Figure 4A). Particularly, CSF levels of MMP-2 were significantly correlated with PiB uptake in the posterior cingulate gyrus and parietotemporal lobe (β = −0.399; 95% CI, −0.782 to −0.017, p = 0.041 and β = −0.476; 95% CI, −0.856 to −0.096, p = 0.016, respectively; Table 3 and Figure 5A,B). Moreover, the CSF levels of MMP-7 were positively correlated with Fazekas scale score (β = 0.419; 95% CI, 0.036 to 0.802, p = 0.033; Table 2, Figure 4B). No significant correlation was found between the CSF levels of MMPs and TIMPs and global and regional FDG uptake.

4. Discussion

To the best of our knowledge, this study is the first to investigate whether CSF levels of MMPs and TIMPs are associated with brain amyloid deposition, glucose metabolism, and WML severity in individuals with amnestic MCI. Out of 33 subjects, 17 (51.5%) had higher PiB uptake and 20 (60.6%) had WMLs. The frequency of higher amyloid deposition is reported to be 54.6% in individuals with MCI aged 75–80 years [33] and that of WMLs to be 5–87% in individuals aged 65 years and older, depending on the clinical characteristics and the method used to assess WMLs [34]. Moreover, two prior studies reported that WMLs were observed in approximately 70–80% of patients with AD [35,36]. Therefore, the frequency of individuals with higher PiB uptake or WMLs in the present study is consistent with findings from previous research. We discovered that CSF levels of MMP-2 were negatively correlated with PiB uptake, especially in the posterior cingulate gyrus and parietotemporal lobe. Moreover, CSF levels of MMP-7 were positively correlated with the Fazekas scale score. These results provide new and valuable insights into the role of MMPs in brain amyloid deposition and white matter degeneration at the MCI stage.
The most interesting finding of our study was the negative correlation between MMP-2 CSF levels and brain amyloid deposition. This finding supports the protective role of MMP-2 in the accumulation of Aβ in the brain [14]. MMPs are classified into gelatinases (MMP-2 and MMP-9), matrilysin (MMP-7), stromelysins (MMP-3 and MMP-10), collagenases (MMP-1, MMP-8, and MMP-13), membrane-type MMPs, and other MMPs based on structure and substrate specificity [1,3,16,37]. Several studies have reported an association between CSF levels of MMPs and AD pathology. MMP-2, MMP-3, and MMP-9 are implicated in the degradation of Aβ, and their expression is increased near amyloid plaques [38,39,40]. Other studies have found that MMP-2 levels are lower in patients with AD compared to controls [8,41]. Moreover, it was reported that decreased levels of MMP-2 and MMP-3 are associated with low Aβ levels [41], and increased levels of MMP-3, MMP-9, and MMP-10 are associated with high total tau or phosphorylated tau levels in CSF [18,32,42]. We showed an association between decreased MMP-2 CSF levels and increased PiB uptake, which is consistent with previous studies. These findings suggest that decreased MMP-2 levels in CSF reflect impaired Aβ degradation, thereby leading to senile plaque formation in the MCI stage.
Another interesting finding of this study was the positive correlation between MMP-7 CSF levels and Fazekas scale score in our cohort. MMP-7 is secreted from microglia [43]. MMP-2, MMP-7, and MMP-9 are implicated in BBB disruption through the degradation of tight junction proteins and basement membrane components, such as laminin, entactin, and type IV collagen [4,14,18,44,45]. Moreover, MMP-7 CSF level is associated with major depressive disorder, multiple sclerosis, and human immunodeficiency virus dementia [43,46,47]. We showed an association between MMP-7 in CSF and WMLs in individuals with amnestic MCI for the first time. These findings suggest that MMP-7 is involved in BBB disruption, which leads to white matter degeneration at the MCI stage. Although a previous in vitro study reported that MMP-7 may degrade Aβ1-42 to result in the prevention of Aβ aggregation [48], our results showed no correlation between MMP-7 and brain amyloid deposition. One possible explanation for this discrepancy is that PiB-PET mainly detects insoluble fibrillar Aβ deposits [49].
Effective disease-modifying drugs are urgently needed to prevent the onset or slow the progression of AD. Potential targets for novel AD drugs include amyloid, tau, inflammation, metabolism, and neuroprotection [50]. Moreover, upregulation of lysosomal hydrolase and cathepsin B has been identified as a potential disease-modifying therapy in transgenic mouse models of AD [51,52]. Our results suggest that MMPs are a potential therapeutic target for slowing the progression of MCI to AD. However, activation of MMPs appears to have both a beneficial role in Aβ catabolism and a detrimental role in BBB integration [53]. Therefore, we emphasize that caution must be taken when using MMPs as a therapeutic target due to their complex role in the pathology of AD.
In this study, several MMPs, namely, MMP-1, MMP-3, MMP-8, MMP-9, MMP-10, and MMP-13, were below the limit of detection in CSF. A number of studies have reported variable findings regarding the CSF levels of MMPs and TIMPs in patients with AD, such as increased or decreased levels of MMP-3 [8,32,41,42], increased or undetectable levels of MMP-9 and MMP-10 [42,54], increased or decreased levels of TIMP-1 [32,42], and increased levels of TIMP-2 [55] compared to controls. These confounding findings may be due to differences in subject selection and the measurement methods used to determine MMP and TIMP.
There are several limitations to this study. Our study cohort was diagnosed based on clinical findings. Therefore, our recruited participants may have concomitant suspected non-Alzheimer’s pathology. It is not possible to determine the causal direction of the association among MMPs, brain amyloid deposition, and WMLs. Moreover, the number of individuals recruited in our study was modest. Therefore, future longitudinal studies with larger sample sizes are required to evaluate the temporal change in CSF levels of MMPs with the progression of brain amyloid deposition and white matter degeneration in AD.

5. Conclusions

We found that CSF levels of MMP-2 are associated with brain amyloid deposition, and MMP-7 CSF levels are associated WMLs. The findings of the present study suggest that MMPs play an important role in amyloid catabolism and BBB disruption at the MCI stage.

Supplementary Materials

The following are available online at https://0-www-mdpi-com.brum.beds.ac.uk/article/10.3390/biom11101496/s1, Table S1: Comparison of CSF MMP and TIMP levels between APOE4-negative and APOE4-positive groups, Table S2: Comparison of CSF MMP and TIMP levels between individuals with and without vascular risk factors.

Author Contributions

N.K. and E.M. conceived and designed the project. M.A., Y.A., K.Y. and Y.S. performed the PET study and conducted the data analysis. N.K. wrote the paper. All authors have read and agreed to the published version of the manuscript.

Funding

N.K. was supported by Grant-in-Aid for Scientific Research (C) under Grant Number 19K07916.

Institutional Review Board Statement

The study was conducted according to the guidelines of the Declaration of Helsinki and approved by the Ethics Committee of Oita University Hospital (B12-013, 9 August 2012).

Informed Consent Statement

Informed consent was obtained from all subjects involved in the study. Written informed consent was obtained from all individuals for publication of this research.

Data Availability Statement

Anonymized data will be shared at the reasonable request of qualified investigators.

Acknowledgments

We gratefully acknowledge Fusa Matsuzaki for database construction. The authors would like to thank Enago (www.enago.jp accessed on 7 October 2021) for the English language review.

Conflicts of Interest

The authors declare no conflict of interest.

Abbreviations

amyloid β
ADAlzheimer’s disease
APOEapolipoprotein E
BBBblood–brain barrier
CIconfidence interval
CSFcerebrospinal fluid
CTcomputed tomography
Ffemale
FDG18F-fluorodeoxyglucose
FLfrontal lobe
Mmale
MCImild cognitive impairment
MMPmatrix metalloproteinase
MMSEMini-Mental State Examination
MRImagnetic resonance imaging
PETpositron emission tomography
PiB11C-Pittsburgh Compound B
PL-TLparietotemporal lobe
POSCposterior cingulate gyrus
ROIregion of interest
SDstandard deviation
SUVRstandardized uptake value ratio
TIMPtissue inhibitor of metalloproteinase
WMLwhite matter lesion

References

  1. Yong, V.W.; Power, C.; Forsyth, P.; Edwards, D.R. Metalloproteinases in biology and pathology of the nervous system. Nat. Rev. Neurosci. 2001, 2, 502–511. [Google Scholar] [CrossRef] [PubMed]
  2. Massova, I.; Kotra, L.P.; Fridman, R.; Mobashery, S. Matrix metalloproteinases: Structures, evolution, and diversification. FASEB J. 1998, 12, 1075–1095. [Google Scholar] [CrossRef] [PubMed] [Green Version]
  3. Rosenberg, G.A. Matrix metalloproteinases and their multiple roles in neurodegenerative diseases. Lancet Neurol. 2009, 8, 205–216. [Google Scholar] [CrossRef]
  4. Rivera, S.; García-González, L.; Khrestchatisky, M.; Baranger, K. Metalloproteinases and their tissue inhibitors in Alzheimer’s disease and other neurodegenerative disorders. Cell. Mol. Life Sci. 2019, 76, 3167–3191. [Google Scholar] [CrossRef]
  5. Bruno, M.A.; Mufson, E.J.; Wuu, J.; Cuello, A.C. Increased matrix metalloproteinase 9 activity in mild cognitive impairment. J. Neuropathol. Exp. Neurol. 2009, 68, 1309–1318. [Google Scholar] [CrossRef] [PubMed]
  6. Peress, N.; Perillo, E.; Zucker, S. Localization of tissue inhibitor of matrix metalloproteinases in Alzheimer’s disease and normal brain. J. Neuropathol. Exp. Neurol. 1995, 54, 16–22. [Google Scholar] [CrossRef] [PubMed]
  7. Yin, K.J.; Cirrito, J.R.; Yan, P.; Hu, X.; Xiao, Q.; Pan, X.; Bateman, R.; Song, H.; Hsu, F.F.; Turk, J.; et al. Matrix metalloproteinases expressed by astrocytes mediate extracellular amyloid-beta peptide catabolism. J. Neurosci. 2006, 26, 10939–10948. [Google Scholar] [CrossRef]
  8. Horstmann, S.; Budig, L.; Gardner, H.; Koziol, J.; Deuschle, M.; Schilling, C.; Wagner, S. Matrix metalloproteinases in peripheral blood and cerebrospinal fluid in patients with Alzheimer’s disease. Int. Psychogeriatr. 2010, 22, 966–972. [Google Scholar] [CrossRef]
  9. Zlokovic, B.V. Neurovascular pathways to neurodegeneration in Alzheimer’s disease and other disorders. Nat. Rev. Neurosci. 2011, 12, 723–738. [Google Scholar] [CrossRef]
  10. Zlokovic, B.V. The blood-brain barrier in health and chronic neurodegenerative disorders. Neuron 2008, 57, 178–201. [Google Scholar] [CrossRef] [Green Version]
  11. Feng, S.; Cen, J.; Huang, Y.; Shen, H.; Yao, L.; Wang, Y.; Chen, Z. Matrix metalloproteinase-2 and -9 secreted by leukemic cells increase the permeability of blood-brain barrier by disrupting tight junction proteins. PLoS ONE 2011, 6, e20599. [Google Scholar] [CrossRef]
  12. Rempe, R.G.; Hartz, A.M.S.; Bauer, B. Matrix metalloproteinases in the brain and blood-brain barrier: Versatile breakers and makers. J. Cereb. Blood Flow Metab. 2016, 36, 1481–1507. [Google Scholar] [CrossRef] [PubMed] [Green Version]
  13. Brkic, M.; Balusu, S.; Van Wonterghem, E.; Gorlé, N.; Benilova, I.; Kremer, A.; Van Hove, I.; Moons, L.; De Strooper, B.; Kanazir, S.; et al. Amyloid β oligomers disrupt Blood-CSF barrier integrity by activating matrix metalloproteinases. J. Neurosci. 2015, 35, 12766–12778. [Google Scholar] [CrossRef] [PubMed] [Green Version]
  14. Wang, X.X.; Tan, M.S.; Yu, J.T.; Tan, L. Matrix metalloproteinases and their multiple roles in Alzheimer’s disease. BioMed Res. Int. 2014, 2014, 908636. [Google Scholar] [CrossRef]
  15. Kimura, N.; Aikawa, M.; Etou, K.; Aso, Y.; Matsubara, E. Association between matrix metalloproteinases, their tissue inhibitor and white matter lesions in mild cognitive impairment. Curr. Alzheimer Res. 2020, 17, 547–555. [Google Scholar] [CrossRef]
  16. Hanzel, C.E.; Iulita, M.F.; Eyjolfsdottir, H.; Hjorth, E.; Schultzberg, M.; Eriksdotter, M.; Cuello, A.C. Analysis of matrix metallo-proteases and the plasminogen system in mild cognitive impairment and Alzheimer’s disease cerebrospinal fluid. J. Alzheimers Dis. 2014, 40, 667–678. [Google Scholar] [CrossRef]
  17. Whelan, C.D.; Mattsson, N.; Nagle, M.W.; Vijayaraghavan, S.; Hyde, C.; Janelidze, S.; Stomrud, E.; Lee, J.; Fitz, L.; Samad, T.A.; et al. Multiplex proteomics identifies novel CSF and plasma biomarkers of early Alzheimer’s disease. Acta Neuropathol. Commun. 2019, 7, 169. [Google Scholar] [CrossRef]
  18. Duits, F.H.; Hernandez-Guillamon, M.; Montaner, J.; Goos, J.D.; Montañola, A.; Wattjes, M.P.; Barkhof, F.; Scheltens, P.; Teunissen, C.E.; van der Flier, W.M. Matrix metalloproteinases in Alzheimer’s disease and concurrent cerebral microbleeds. J. Alzheimers Dis. 2015, 48, 711–720. [Google Scholar] [CrossRef]
  19. Bjerke, M.; Zetterberg, H.; Edman, Å.; Blennow, K.; Wallin, A.; Andreasson, U. Cerebrospinal fluid matrix metalloproteinases and tissue inhibitor of metalloproteinases in combination with subcortical and cortical biomarkers in vascular dementia and Alzheimer’s disease. J. Alzheimers Dis. 2011, 27, 665–676. [Google Scholar] [CrossRef]
  20. Tuna, G.; Yener, G.G.; Oktay, G.; İşlekel, G.H.; Kİrkalİ, F.G. Evaluation of matrix metalloproteinase-2 (MMP-2) and -9. J. Alzheimers Dis. 2018, 66, 1265–1273. [Google Scholar] [CrossRef] [PubMed]
  21. Ma, Y.; Zhang, S.; Li, J.; Zheng, D.M.; Guo, Y.; Feng, J.; Ren, W.D. Predictive accuracy of amyloid imaging for progression from mild cognitive impairment to Alzheimer disease with different lengths of follow-up: A meta-analysis. Medicine 2014, 93, e150. [Google Scholar] [CrossRef]
  22. Jack, C.R., Jr.; Knopman, D.S.; Jagust, W.J.; Petersen, R.C.; Weiner, M.W.; Aisen, P.S.; Shaw, L.M.; Vemuri, P.; Wiste, H.J.; Weigand, S.D.; et al. Tracking pathophysiological processes in Alzheimer’s disease: An updated hypothetical model of dynamic biomarkers. Lancet Neurol. 2013, 12, 207–216. [Google Scholar] [CrossRef] [Green Version]
  23. Brun, A.; Englund, E. A white matter disorder in dementia of the Alzheimer type: A pathoanatomical study. Ann. Neurol. 1986, 19, 253–262. [Google Scholar] [CrossRef]
  24. Kimura, N.; Nakama, H.; Nakamura, K.; Aso, Y.; Kumamoto, T. Effect of white matter lesions on brain perfusion in Alzheimer’s disease. Dement. Geriatr. Cogn. Disord. 2012, 34, 256–261. [Google Scholar] [CrossRef]
  25. Wardlaw, J.M.; Smith, E.E.; Biessels, G.J.; Cordonnier, C.; Fazekas, F.; Frayne, R.; Lindley, R.I.; O’Brien, J.T.; Barkhof, F.; Benavente, O.R.; et al. Neuroimaging standards for research into small vessel disease and its contribution to ageing and neurodegeneration. Lancet Neurol. 2013, 12, 822–838. [Google Scholar] [CrossRef] [Green Version]
  26. Freeze, W.M.; Jacobs, H.I.L.; de Jong, J.J.; Verheggen, I.C.M.; Gronenschild, E.H.B.M.; Palm, W.M.; Hoff, E.I.; Wardlaw, J.M.; Jansen, J.F.A.; Verhey, F.R.; et al. White matter hyperintensities mediate the association between blood-brain barrier leakage and information processing speed. Neurobiol. Aging 2020, 85, 113–122. [Google Scholar] [CrossRef]
  27. Molgaard, C.A. Multivariate analysis of Hachinski’s Scale for discriminating senile dementia of the Alzheimer’s type from multiinfarct dementia. Neuroepidemiology 1987, 6, 153–160. [Google Scholar] [CrossRef] [PubMed]
  28. Fazekas, F.; Chawluk, J.B.; Alavi, A.; Hurtig, H.I.; Zimmerman, R.A. MR signal abnormalities at 1.5 T in Alzheimer’s dementia and normal aging. Am. J. Roentgenol. 1987, 149, 351–356. [Google Scholar] [CrossRef] [PubMed] [Green Version]
  29. Gupta, V.B.; Laws, S.M.; Villemagne, V.L.; Ames, D.; Bush, A.I.; Ellis, K.A.; Lui, J.K.; Masters, C.; Rowe, C.C.; Szoeke, C.; et al. Plasma apolipoprotein E and Alzheimer disease risk: The AIBL study of aging. Neurology 2011, 76, 1091–1098. [Google Scholar] [CrossRef] [PubMed]
  30. Kimura, N.; Aso, Y.; Yabuuchi, K.; Ishibashi, M.; Hori, D.; Sasaki, Y.; Nakamichi, A.; Uesugi, S.; Jikumaru, M.; Sumi, K.; et al. Association of modifiable lifestyle factors with cortical amyloid burden and cerebral glucose metabolism in older adults with mild cognitive impairment. JAMA Netw. Open 2020, 3, e205719. [Google Scholar] [CrossRef] [PubMed]
  31. Herholz, K.; Salmon, E.; Perani, D.; Baron, J.C.; Holthoff, V.; Frölich, L.; Schönknecht, P.; Ito, K.; Mielke, R.; Kalbe, E.; et al. Discrimination between Alzheimer dementia and controls by automated analysis of multicenter FDG PET. Neuroimage 2002, 17, 302–316. [Google Scholar] [CrossRef] [PubMed] [Green Version]
  32. Jack, C.R., Jr.; Lowe, V.J.; Senjem, M.L.; Weigand, S.D.; Kemp, B.J.; Shiung, M.M.; Knopman, D.S.; Boeve, B.F.; Klunk, W.E.; Mathis, C.A.; et al. 11C PiB and structural MRI provide complementary information in imaging of Alzheimer’s disease and amnestic mild cognitive impairment. Brain 2008, 131, 665–680. [Google Scholar] [CrossRef] [PubMed] [Green Version]
  33. Jansen, W.J.; Ossenkoppele, R.; Knol, D.L.; Tijms, B.M.; Scheltens, P.; Verhey, F.R.; Visser, P.J.; Aalten, P.; Aarsland, D.; Alcolea, D.; et al. Prevalence of cerebral amyloid pathology in persons without dementia: A meta-analysis. JAMA 2015, 313, 1924–1938. [Google Scholar] [CrossRef] [PubMed]
  34. Targosz-Gajniak, M.; Siuda, J.; Ochudło, S.; Opala, G. Cerebral white matter lesions in patients with dementia—From MCI to severe Alzheimer’s disease. J. Neurol. Sci. 2009, 283, 79–82. [Google Scholar] [CrossRef] [PubMed]
  35. Heo, J.H.; Lee, S.T.; Kon, C.; Park, H.J.; Shim, J.Y.; Kim, M. White matter hyperintensities and cognitive dysfunction in Alzheimer disease. J. Geriatr. Psychiatr. Neurol. 2009, 22, 207–212. [Google Scholar] [CrossRef]
  36. Kao, Y.H.; Chou, M.C.; Chen, C.H.; Yang, Y.H. White Matter Changes in Patients with Alzheimer’s Disease and Associated Factors. J. Clin. Med. 2019, 8, 167. [Google Scholar] [CrossRef] [PubMed] [Green Version]
  37. Snoek-van Beurden, P.A.M.; Von den Hoff, J.W. Zymographic techniques for the analysis of matrix metalloproteinases and their inhibitors. BioTechniques 2005, 38, 73–83. [Google Scholar] [CrossRef] [Green Version]
  38. Backstrom, J.R.; Lim, G.P.; Cullen, M.J.; Tökés, Z.A. Matrix metalloproteinase-9 (MMP-9) is synthesized in neurons of the human hippocampus and is capable of degrading the amyloidbeta peptide. J. Neurosci. 1996, 16, 7910–7919. [Google Scholar] [CrossRef] [PubMed] [Green Version]
  39. Yan, P.; Hu, X.; Song, H.; Yin, K.; Bateman, R.J.; Cirrito, J.R.; Xiao, Q.; Hsu, F.F.; Turk, J.W.; Xu, J.; et al. Matrix metalloproteinase-9 degrades amyloid-beta fibrils in vitro and compact plaques in situ. J. Biol. Chem. 2006, 281, 24566–24574. [Google Scholar] [CrossRef] [Green Version]
  40. Miners, J.S.; Baig, S.; Palmer, J.; Palmer, L.E.; Kehoe, P.G.; Love, S. Abeta-degrading enzymes in Alzheimer’s disease. Brain Pathol. 2008, 18, 240–252. [Google Scholar] [CrossRef] [PubMed]
  41. Mlekusch, R.; Humpel, C. Matrix metalloproteinases-2 and -3 are reduced in cerebrospinal fluid with low beta-amyloid1-42 levels. Neurosci. Lett. 2009, 466, 135–138. [Google Scholar] [CrossRef] [PubMed] [Green Version]
  42. Stomrud, E.; Björkqvist, M.; Janciauskiene, S.; Minthon, L.; Hansson, O. Alterations of matrix metalloproteinases in the healthy elderly with increased risk of prodromal Alzheimer’s disease. Alzheimers Res. Ther. 2010, 2, 20. [Google Scholar] [CrossRef] [PubMed] [Green Version]
  43. Omori, W.; Hattori, K.; Kajitani, N.; Tsuchioka, M.O.; Boku, S.; Kunugi, H.; Okamoto, Y.; Takebayashi, M. Increased matrix metalloproteinases in cerebrospinal fluids of patients with major depressive disorder and schizophrenia. Int. J. Neuropsychopharmacol. 2020, 23, 713–720. [Google Scholar] [CrossRef] [PubMed]
  44. Wilson, C.L.; Matrisian, L.M. Matrilysin: An epithelial matrix metalloproteinase with potentially novel functions. Int. J. Biochem. Cell Biol. 1996, 28, 123–136. [Google Scholar] [CrossRef]
  45. Conant, K.; McArthur, J.C.; Griffin, D.E.; Sjulson, L.; Wahl, L.M.; Irani, D.N. Cerebrospinal fluid levels of MMP-2, 7, and 9 are elevated in association with human immunodeficiency virus dementia. Ann. Neurol. 1999, 46, 391–398. [Google Scholar] [CrossRef]
  46. Castellazzi, M.; Ligi, D.; Contaldi, E.; Quartana, D.; Fonderico, M.; Borgatti, L.; Bellini, T.; Trentini, A.; Granieri, E.; Fainardi, E.; et al. Multiplex matrix metalloproteinases analysis in the cerebrospinal fluid reveals potential specific patterns in multiple sclerosis patients. Front Neurol. 2018, 9, 1080. [Google Scholar] [CrossRef]
  47. Ragin, A.B.; Wu, Y.; Ochs, R.; Du, H.; Epstein, L.G.; Conant, K.; McArthur, J.C. Marked relationship between matrix metalloproteinase 7 and brain atrophy in HIV infection. J. Neurovirol. 2011, 17, 153–158. [Google Scholar] [CrossRef] [Green Version]
  48. Taniguchi, M.; Matsuura, K.; Nakamura, R.; Kojima, A.; Konishi, M.; Akizawa, T. MMP-7 cleaves amyloid β fragment peptides and copper ion inhibits the degradation. Biometals 2017, 30, 797–807. [Google Scholar] [CrossRef]
  49. Ikonomovic, M.D.; Klunk, W.E.; Abrahamson, E.E.; Mathis, C.A.; Price, J.C.; Tsopelas, N.D.; Lopresti, B.J.; Ziolko, S.; Bi, W.; Paljug, W.R.; et al. Post-mortem correlates of in vivo PiB-PET amyloid imaging in a typical case of Alzheimer’s disease. Brain 2008, 131, 1630–1645. [Google Scholar] [CrossRef] [Green Version]
  50. Cummings, J.; Lee, G.; Ritter, A.; Sabbagh, M.; Zhong, K. Alzheimer’s disease drug development pipeline: 2020. Alzheimers Dement. 2020, 6, e12050. [Google Scholar] [CrossRef]
  51. Marasco, R.A. Current and evolving treatment strategies for the Alzheimer disease continuum. Am. J. Manag. Care 2020, 26, 167–176. [Google Scholar]
  52. Hwang, J.; Estick, C.M.; Ikonne, U.S.; Butler, D.; Pait, M.C.; Elliott, L.H.; Ruiz, S.; Smith, K.; Rentschler, K.M.; Mundell, C.; et al. The Role of Lysosomes in a Broad Disease-Modifying Approach Evaluated across Transgenic Mouse Models of Alzheimer’s Disease and Parkinson’s Disease and Models of Mild Cognitive Impairment. Int. J. Mol. Sci. 2019, 20, 4432. [Google Scholar] [CrossRef] [PubMed] [Green Version]
  53. Li, W.; Poteet, E.; Xie, L.; Liu, R.; Wen, Y.; Yang, S.-H. Regulation of matrix metalloproteinase 2 by oligomeric amyloid β protein. Brain Res. 2011, 1387, 141–148. [Google Scholar] [CrossRef] [PubMed] [Green Version]
  54. Boström, G.; Freyhult, E.; Virhammar, J.; Alcolea, D.; Tumani, H.; Otto, M.; Brundin, R.M.; Kilander, L.; Löwenmark, M.; Giedraitis, V.; et al. Different inflammatory signatures in Alzheimer’s disease and frontotemporal dementia cerebrospinal fluid. J. Alzheimers Dis. 2021, 81, 629–640. [Google Scholar] [CrossRef] [PubMed]
  55. Lorenzl, S.; Albers, D.S.; LeWitt, P.A.; Chirichigno, J.W.; Hilgenberg, S.L.; Cudkowicz, M.E.; Beal, M.F. Tissue inhibitors of matrix metalloproteinases are elevated in cerebrospinal fluid of neurodegenerative diseases. J. Neurol. Sci. 2003, 207, 71–76. [Google Scholar] [CrossRef]
Figure 1. Example of a Fazekas scale score of 0, 1, and 2 periventricular hyperintensity (top) and deep white matter hyperintensity (bottom) on T2-weighted images.
Biomolecules 11 01496 g001
Figure 2. Examples images of an individual with lower PiB uptake ((A): cortical SUVR value = 0.804) and with higher PiB uptake ((B): cortical SUVR value = 2.584).
Biomolecules 11 01496 g002
Figure 3. Examples images of an individual with lower FDG uptake ((A): cortical SUVR value = 0.709) and with higher FDG uptake ((B): cortical SUVR value = 0.874).
Biomolecules 11 01496 g003
Figure 4. Relationship between CSF levels of MMPs and PiB uptake and Fazekas scale score. (A) MMP-2 CSF levels are negatively correlated with global PiB uptake (β = −0.414; 95% confidence interval, −0.796 to −0.032, p = 0.035). (B) MMP-7 CSF levels are positively correlated with Fazekas scale score (β = 0.419; 95% confidence interval, 0.036 to 0.802, p = 0.033).
Biomolecules 11 01496 g004
Figure 5. Relationship between CSF levels of MMP-2 and PiB uptake in the brain ROI. CSF levels of MMP-2 are negatively correlated with PiB uptake in the (A) posterior cingulate gyrus (β = −0.399; 95% CI, −0.782 to −0.017, p = 0.041) and (B) parietotemporal lobe (β = −0.476; 95% CI, −0.856 to −0.096, p = 0.016). PL-TL—parietotemporal lobe; POSC—posterior cingulate gyrus.
Biomolecules 11 01496 g005
Table 1. Clinical and demographic characteristics.
CharacteristicCohort (N = 33)
Age, mean (SD), years75.6 (5.4)
Sex (M/F)11:22
Education level, mean (SD), years11.4 (1.9)
APOE4, no. (%)11 (33.3%)
Hypertension (%)20 (60.6%)
Diabetes (%)3 (9.1%)
Hypercholesterolemia (%)17 (51.5%)
MMSE, mean (SD), score24.8 (2.0)
FL PiB uptake, mean (SD)1.46 (0.55)
POSC PiB uptake, mean (SD)1.91 (0.81)
PL-TL PiB uptake, mean (SD)1.48 (0.53)
Global PiB uptake, mean (SD)1.51 (0.56)
Global FDG uptake, mean (SD)0.88 (0.08)
Fazekas scale, mean (SD)1.33 (1.41)
APOE—apolipoprotein E; F—female; FDG—18F-fluorodeoxyglucose; FL—frontal lobe; M—male; MMSE—Mini-Mental State Examination; PiB—11C-Pittsburgh Compound B; PL-TL—parietotemporal lobe; POSC—posterior cingulate gyrus; SD—standard deviation.
Table 2. Multiple regression model between CSF MMPs and TIMPs levels and global PiB uptake, global FDG uptake, and Fazekas scale score.
CSF Level Global PiB UptakeGlobal FDG UptakeFazekas Scale Score
β (95% CI)pβ (95% CI)pβ (95% CI)p
MMP-2−0.414 (−0.796, −0.032)0.035 10.174 (−0.247, 0.595)0.4030.106 (−0.304, 0.517)0.598
MMP-7−0.259 (−0.674, 0.156)0.2090.105 (−0.329, 0.539)0.6230.419 (0.036, 0.802)0.033 1
MMP-12−0.139 (−0.531, 0.253)0.473−0.069 (−0.471, 0.333)0.724−0.04 (−0.43, 0.349)0.832
TIMP-1−0.177 (−0.587, 0.233)0.382−0.126 (−0.547, 0.295)0.5440.253 (−0.143, 0.649)0.20
TIMP-2−0.103 (−0.519, 0.313)0.615−0.14 (−0.561, 0.282)0.500.166 (−0.239, 0.571)0.406
CI—confidence interval; CSF—cerebrospinal fluid; MMP—matrix metalloproteinase; TIMP—tissue inhibitor of metalloproteinase. 1 A p-value < 0.05 was considered statistically significant.
Table 3. Multiple regression model between CSF MMPs and TIMPs levels and PiB uptake in each brain ROI.
CSF Level FLPOSCPL-TL
β (95% CI)pβ (95% CI)pβ (95% CI)p
MMP-2−0.376 (−0.76, 0.008)0.055−0.399 (−0.782, −0.017)0.041 1−0.476 (−0.856, −0.096)0.016 1
MMP-7−0.226 (−0.64, 0.187)0.27−0.282 (−0.692, 0.128)0.169−0.303 (−0.723, 0.117)0.149
MMP-12−0.147 (−0.534, 0.241)0.442−0.098 (−0.49, 0.294)0.611−0.131 (−0.532, 0.271)0.509
TIMP-1−0.157 (−0.564, 0.251)0.435−0.221 (−0.626, 0.183)0.269−0.188 (−0.608, 0.231)0.363
TIMP-2−0.108 (−0.52, 0.303)0.592−0.133 (−0.545, 0.28)0.513−0.068 (−0.495, 0.359)0.744
ROI—region of interest; FL—frontal lobe; PL-TL—parietotemporal lobe; POSC—posterior cingulate gyrus. 1 A p-value < 0.05 was considered statistically significant.
Publisher’s Note: MDPI stays neutral with regard to jurisdictional claims in published maps and institutional affiliations.

