A Comparative Analysis of Tumors and Plasma Circulating Tumor DNA in 145 Advanced Cancer Patients Annotated by 3 Core Cellular Processes

 ,
,
Abstract
: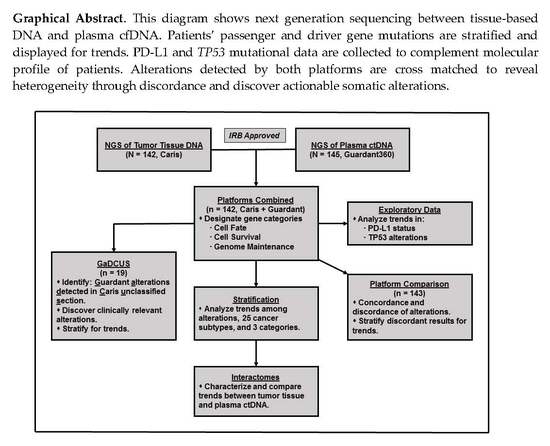
1. Introduction
2. Results
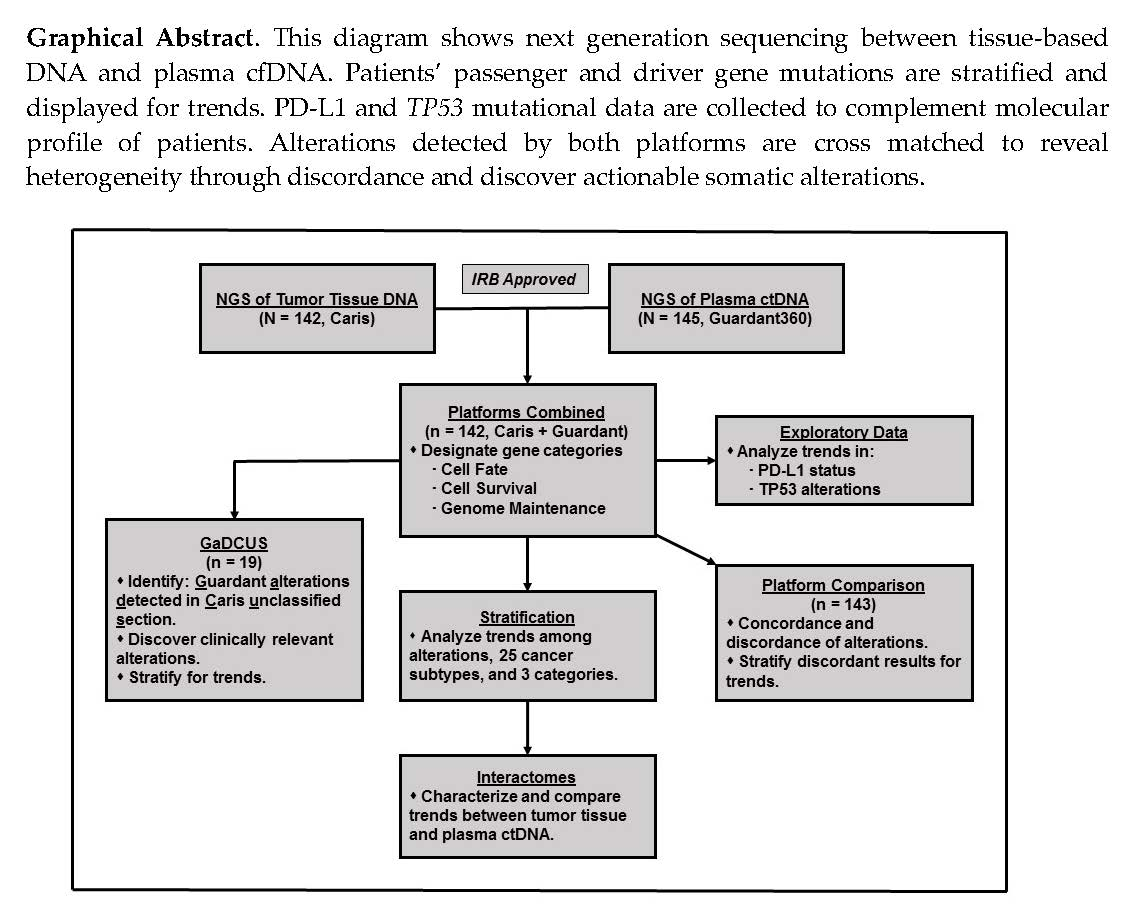
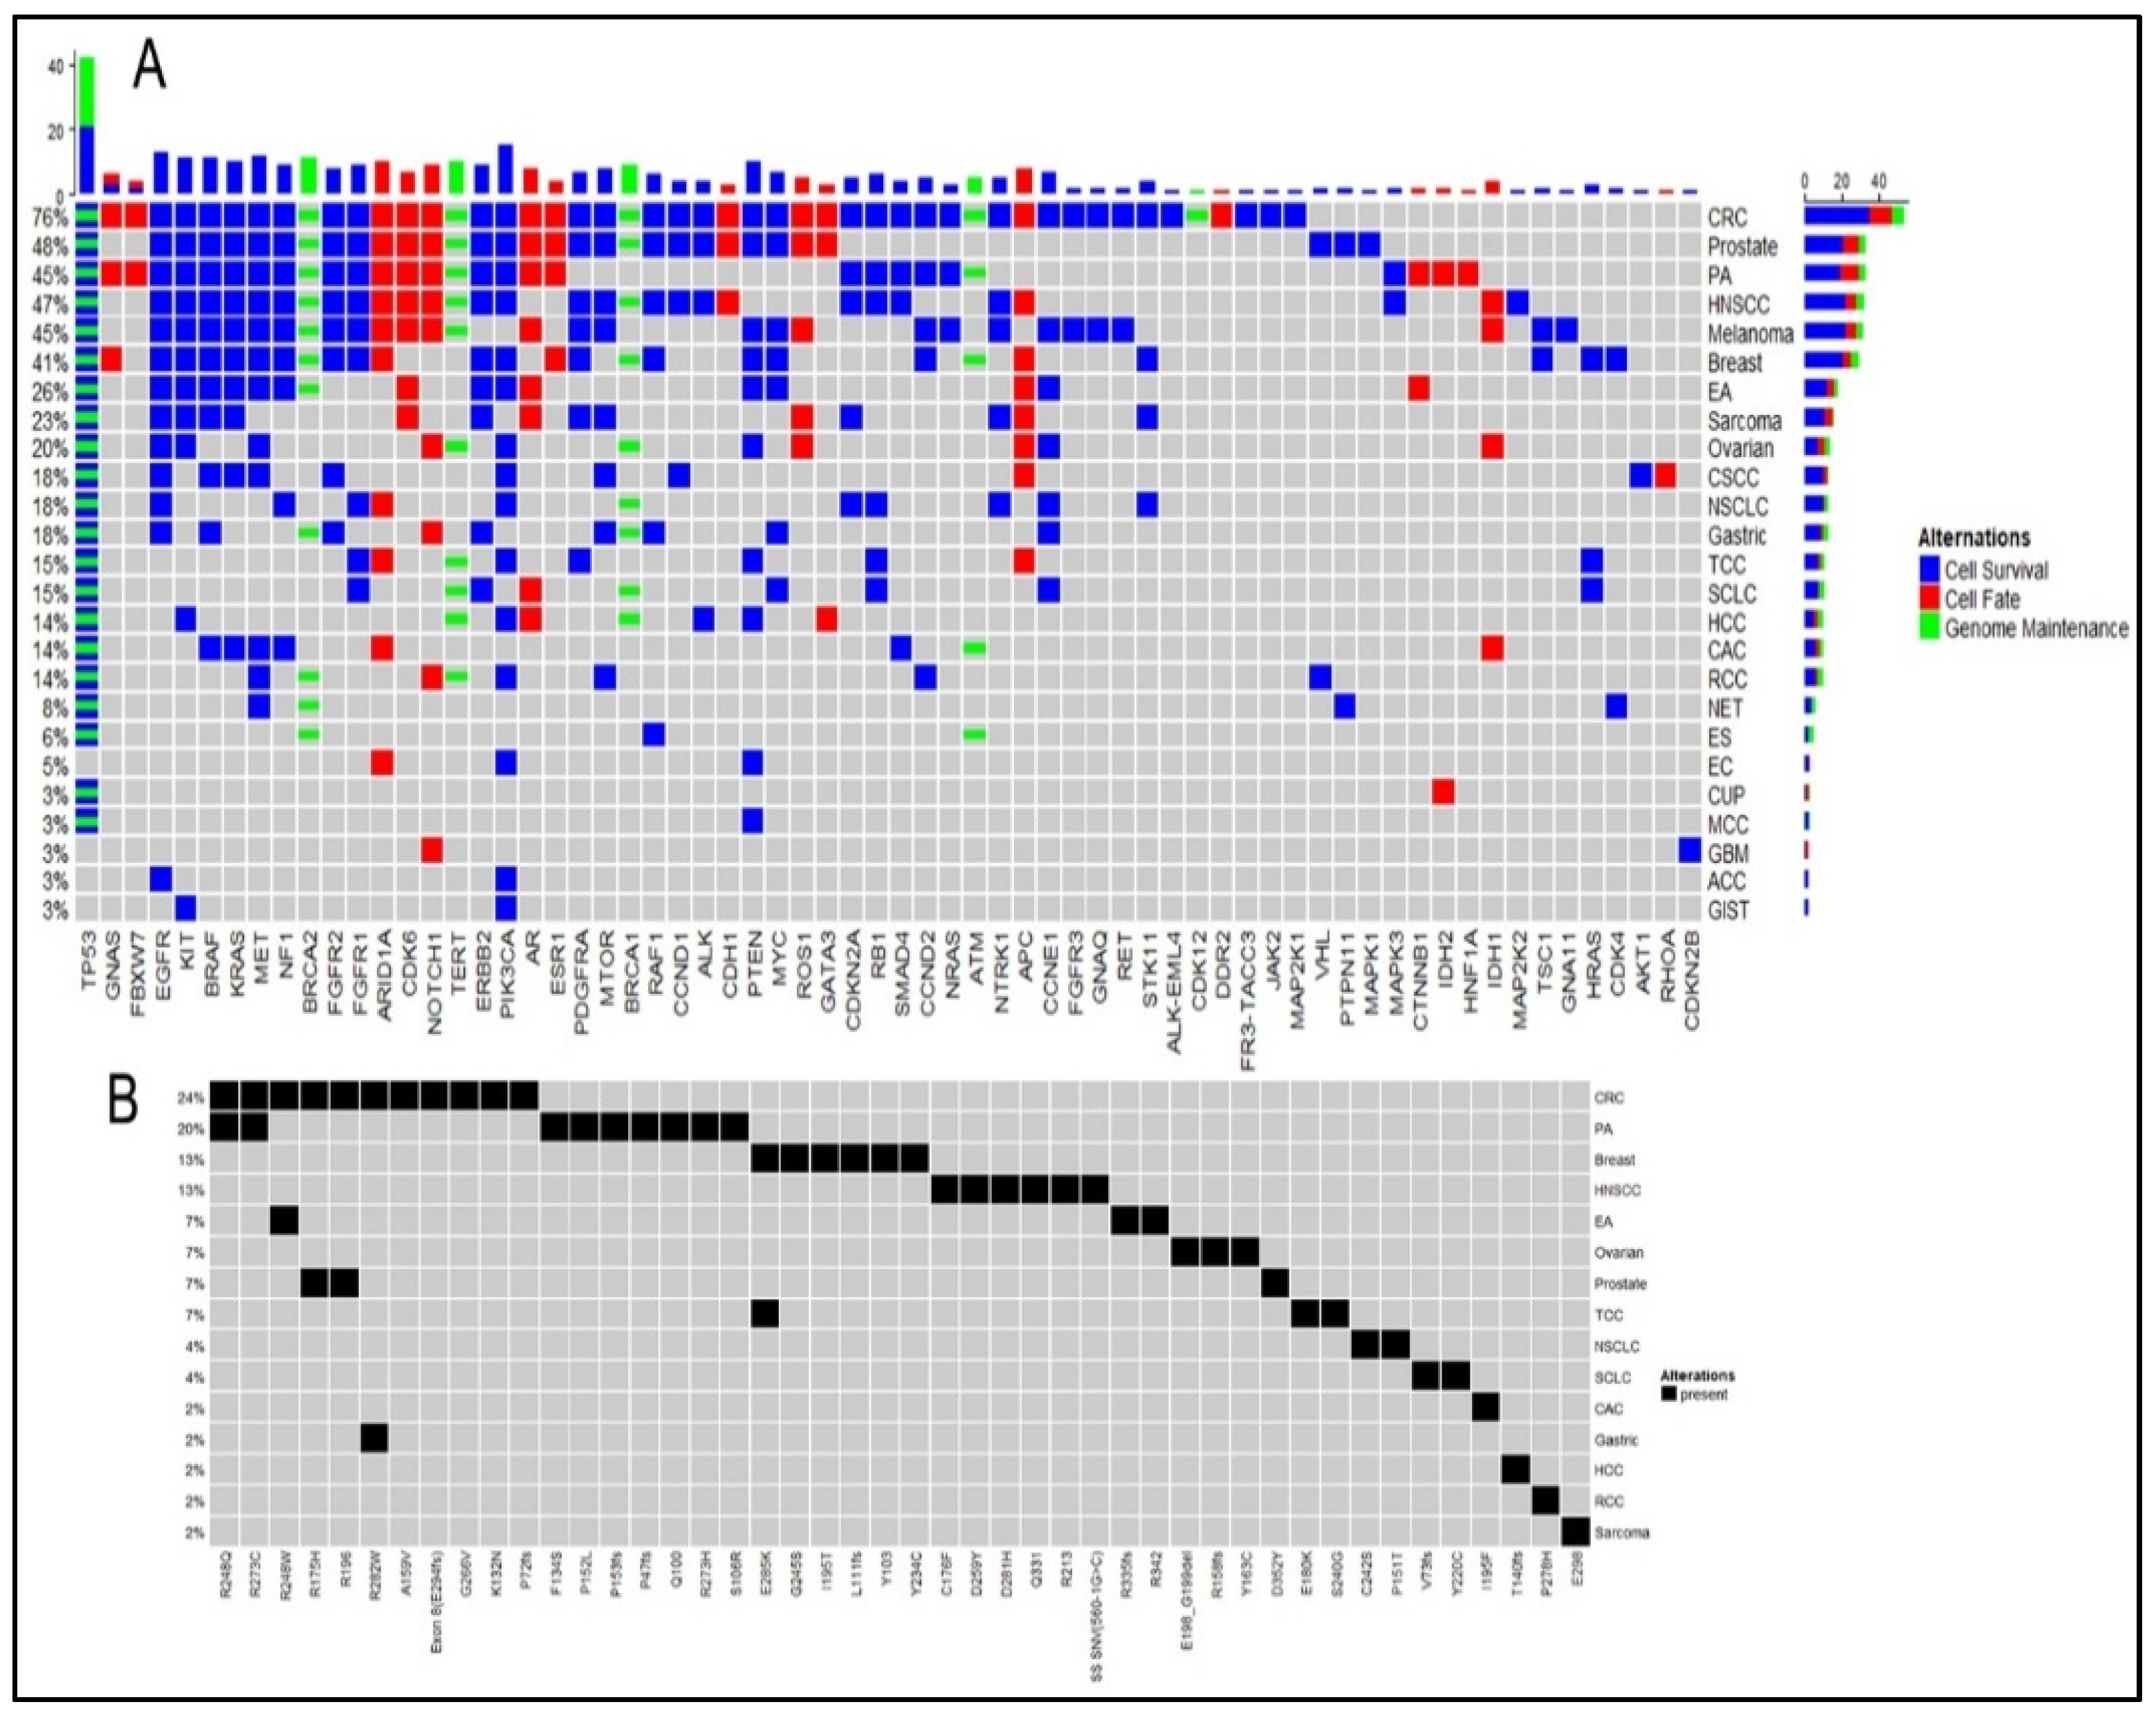
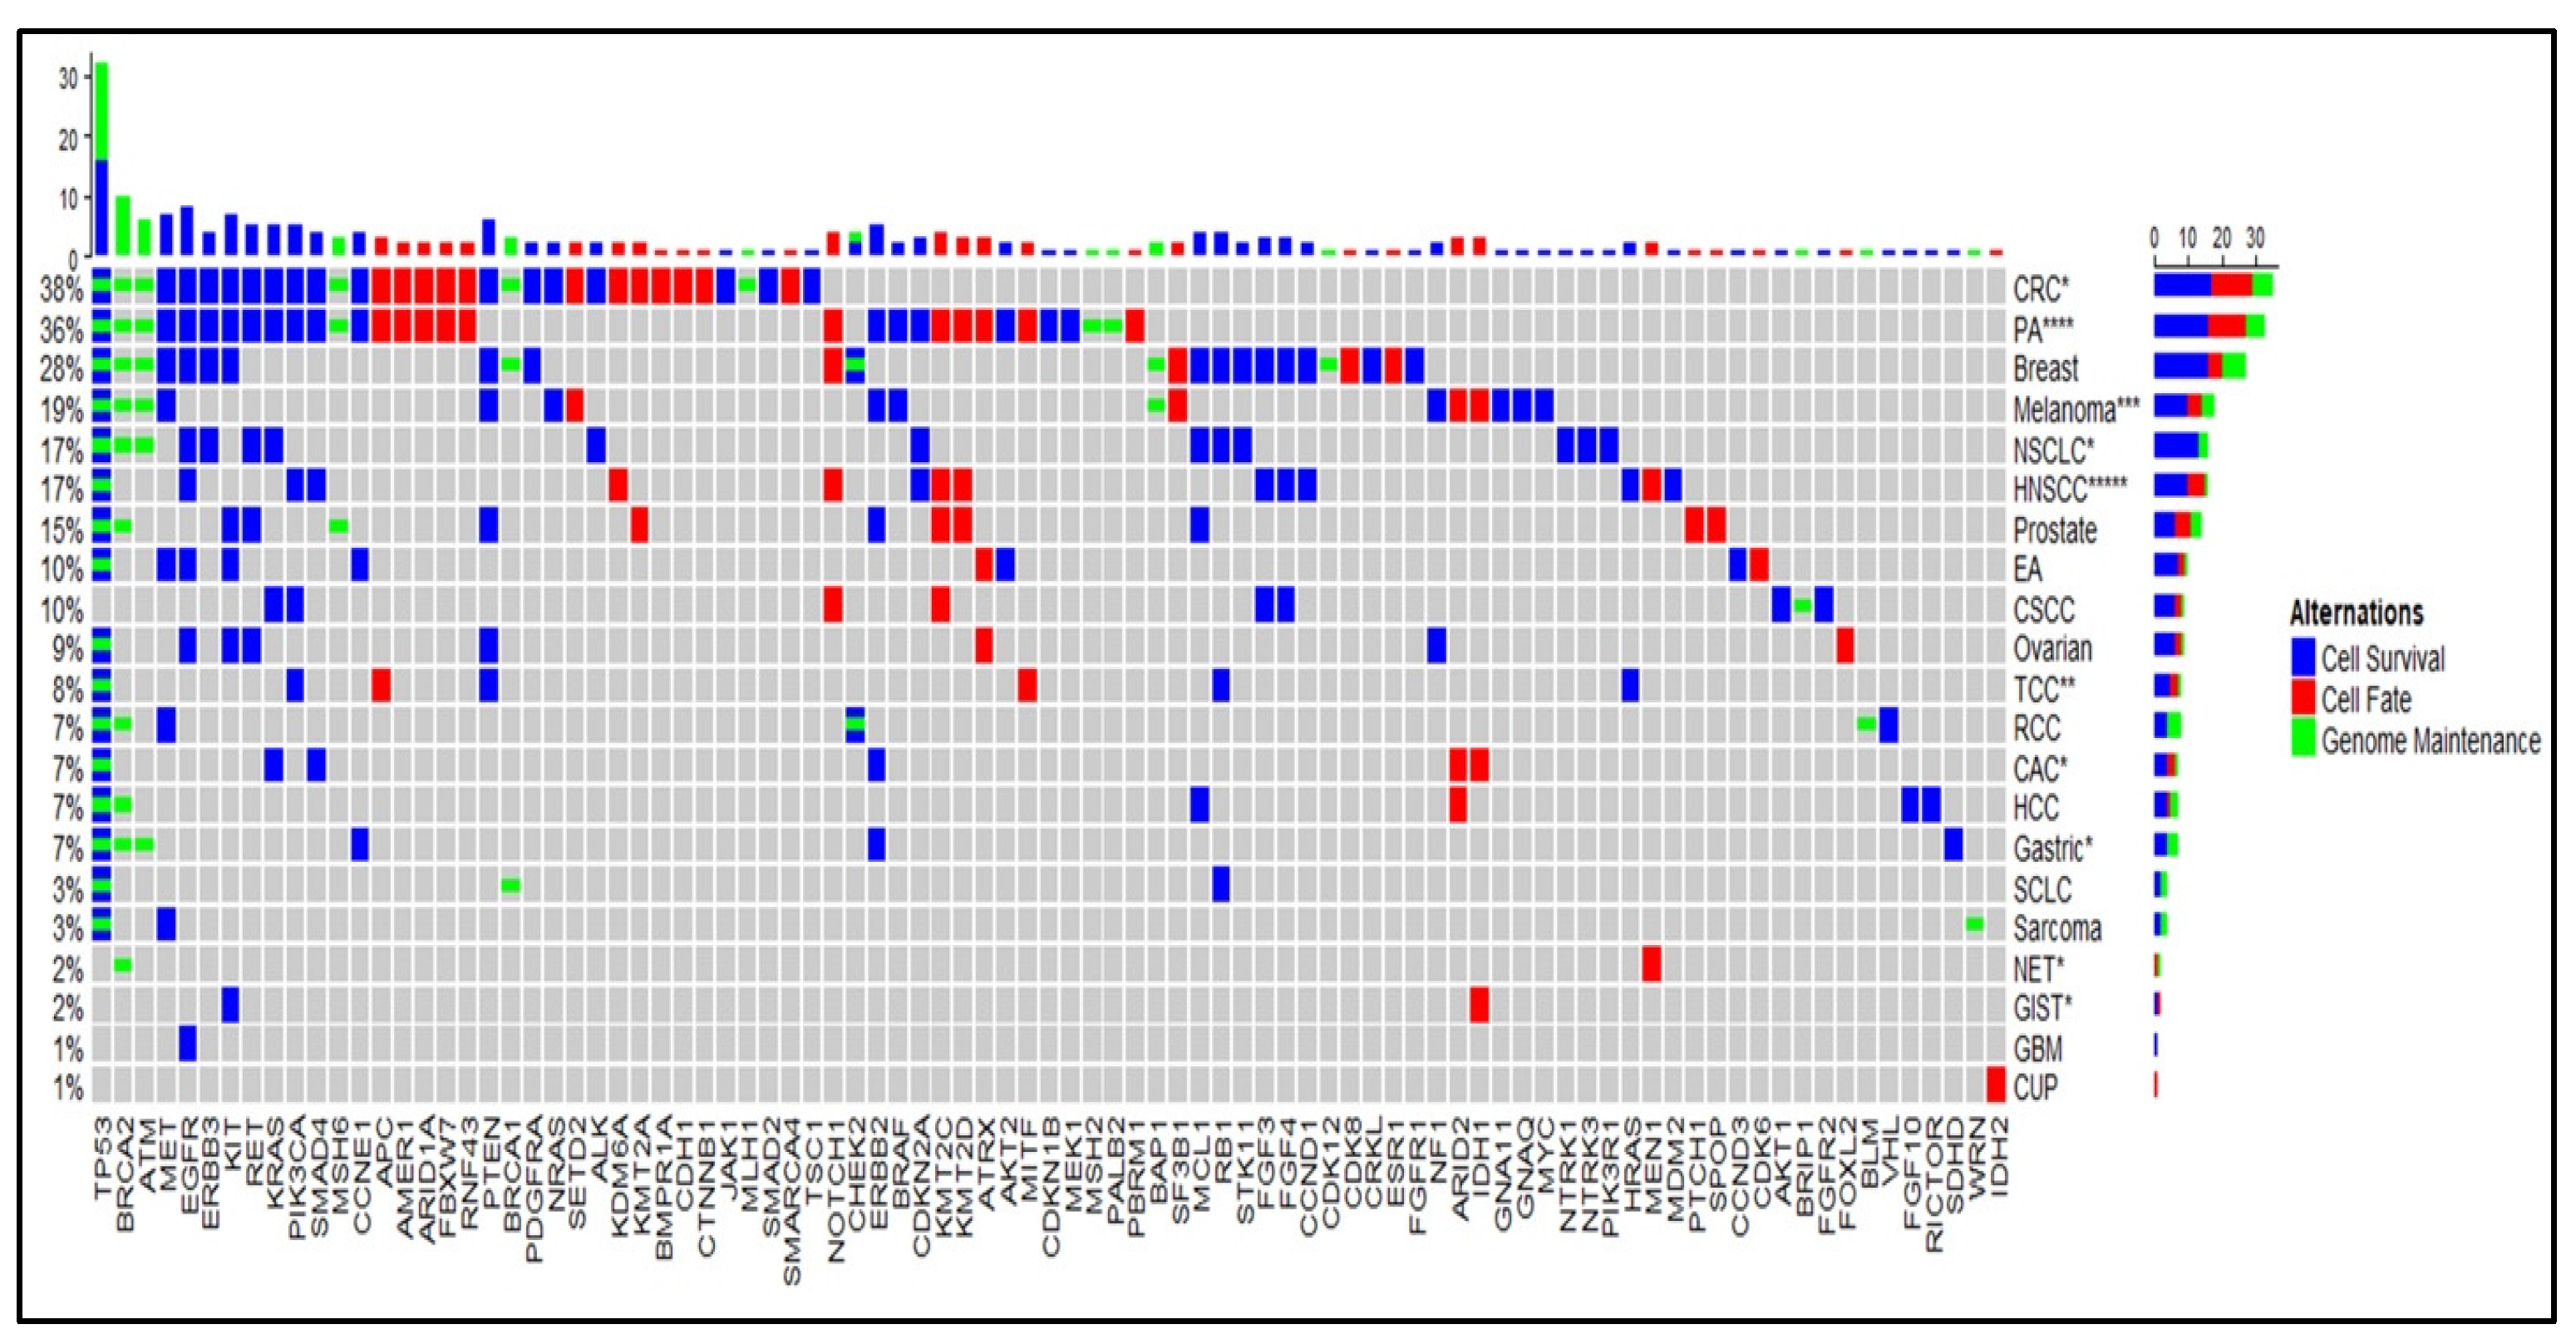
2.1. Cell Survival (CS) Mutations Dominate Cell Fate (CF) and Genome Maintenance (GM) Mutations
2.2. TP53 is the Most Frequent Mutation
2.3. Trend in PD-L1 Status
2.4. Marked Discordance Across the Platforms
2.5. Identification of Potentially Actionable Mutations
3. Discussion
Limitations
4. Materials and Methods
4.1. Patient Selection, NGS Platforms, and Sample Acquisition
4.2. Cell Fate, Cell Survival, and Genome Maintenance Category Determination
4.3. Statistical Analysis
4.4. Mutation Maps Generation
4.5. Concordance–Discordance Analysis
5. Conclusions
Supplementary Materials
Author Contributions
Funding
Acknowledgments
Conflicts of Interest
Abbreviations for Tables and Figures
| ACC | adenoid cystic carcinoma |
| BAC | Breast adenocarcinoma |
| C-CF | Caris-cell fate |
| C-CS | Caris-cell survival |
| C-GM | Caris-genome maintenance |
| CAC | cholangiocarcinoma |
| CDM | Caris detected mutations |
| CF | cell fate |
| CRC | colorectal carcinoma |
| CS | cell survival |
| CSCC | cutaneous squamous cell carcinoma |
| CUP | carcinoma of unknown primary |
| DPT | difference between platform sample collection times (in months) |
| EA | esophageal adenocarcinoma |
| EC | endometrial carcinoma |
| ES | esophageal squamous cell carcinoma |
| G-CF | Guardant360-cell fate |
| G-CS | Guardant360-cell survival |
| G-GM | Guardant360-genome maintenance |
| GaDCUS | Guardant360 alterations detected in Caris unclassified section |
| GBM | glioblastoma multiforme |
| GDM | Guardant360 detected mutations |
| GIST | gastrointestinal stromal tumor |
| GM | genome maintenance |
| HCC | hepatocellular carcinoma |
| HNSCC | head and neck squamous cell carcinoma |
| MCC | merkel cell carcinoma |
| NET | neuroendocrine tumor |
| NGS | next generation sequencing |
| NSCLC | non-small cell lung cancer |
| PA | pancreatic adenocarcinoma |
| PT | patient study number |
| RCC | renal cell carcinoma |
| SCLC | small cell lung cancer |
| TCC | transitional cell carcinoma |
| Q | quantity of patients per cancer subtype |
References
- Schmidt, K.T.; Chau, C.H.; Price, U.K.; Figg, W.D. Precision oncology medicine: The clinical relevance of patient-specific biomarkers used to optimize cancer treatment. J. Clin. Pharmacol. 2016, 56, 1484–1499. [Google Scholar] [CrossRef] [PubMed] [Green Version]
- Tsimberidou, A.M.; Hong, D.S.; Ye, Y.; Cartwright, C.; Wheler, J.J.; Falchook, G.S.; Naing, A.; Fu, S.; Piha-Paul, S.; Janku, F.; et al. Initiative for Molecular Profiling and Advanced Cancer Therapy (IMPACT): An MD Anderson Precision Medicine Study. JCO Precis. Oncol. 2017. [Google Scholar] [CrossRef] [PubMed]
- Rodon, J.; Soria, J.-C.; Berger, R.; Miller, W.H.; Rubin, E.; Kugel, A.; Tsimberidou, A.; Saintigny, P.; Ackerstein, A.; Braña, I.; et al. Genomic and transcriptomic profiling expands precision cancer medicine: The WINTHER trial. Nat. Med. 2019, 25, 751–758. [Google Scholar] [CrossRef] [PubMed]
- Chapman, P.B.; Hauschild, A.; Robert, C.; Haanen, J.B.; Ascierto, P.; Larkin, J.; Dummer, R.; Garbe, C.; Testori, A.; Maio, M.; et al. Improved survival with vemurafenib in melanoma with BRAF V600E mutation. N. Engl. J. Med. 2011, 364, 2507–2516. [Google Scholar] [CrossRef] [PubMed] [Green Version]
- Kwak, E.L.; Bang, Y.-J.; Camidge, D.R.; Shaw, A.T.; Solomon, B.; Maki, R.G.; Ou, S.-H.I.; Dezube, B.J.; Janne, P.A.; Costa, D.; et al. Anaplastic lymphoma kinase inhibition in non-small-cell lung cancer. N. Engl. J. Med. 2010, 363, 1693–1703. [Google Scholar] [CrossRef] [PubMed] [Green Version]
- Deben, C.; Van Der Steen, N.; Lardon, F.; De Beeck, K.O.; Hermans, C.; Deschoolmeester, V.; Pauwels, P.; Wouters, A.; Peeters, M.; Rolfo, C.C.; et al. Deep sequencing of the TP53 gene reveals a potential risk allele for non-small cell lung cancer and supports the negative prognostic value of TP53 variants. Tumor Boil. 2017, 39. [Google Scholar] [CrossRef] [Green Version]
- Wheler, J.J.; Janku, F.; Naing, A.; Li, Y.; Stephen, B.; Zinner, R.; Subbiah, V.; Fu, S.; Karp, D.; Falchook, G.S.; et al. TP53 Alterations Correlate with Response to VEGF/VEGFR Inhibitors: Implications for Targeted Therapeutics. Mol. Cancer Ther. 2016, 15, 2475–2485. [Google Scholar] [CrossRef] [Green Version]
- Oltmann, J.; Heselmeyer-Haddad, K.; Hernandez, L.S.; Meyer, R.; Torres, I.; Hu, Y.; Doberstein, N.; Killian, J.K.; Petersen, D.; Zhu, Y.J.; et al. Aneuploidy, TP53 mutation, and amplification of MYC correlate with increased intratumor heterogeneity and poor prognosis of breast cancer patients. Genes Chromosom. Cancer 2018, 57, 165–175. [Google Scholar] [CrossRef]
- Melaiu, O.; Mina, M.; Chierici, M.; Boldrini, R.; Jurman, G.; Romania, P.; D’Alicandro, V.; Benedetti, M.C.; Castellano, A.; Liu, T.; et al. PD-L1 Is a Therapeutic Target of the Bromodomain Inhibitor JQ1 and, Combined with HLA Class I, a Promising Prognostic Biomarker in Neuroblastoma. Clin. Cancer Res. 2017, 23, 4462–4472. [Google Scholar] [CrossRef] [Green Version]
- Li, J.; Chen, L.; Xiong, Y.; Zheng, X.; Xie, Q.; Zhou, Q.; Shi, L.; Wu, C.; Jiang, J.; Wang, H. Knockdown of PD-L1 in Human Gastric Cancer Cells Inhibits Tumor Progression and Improves the Cytotoxic Sensitivity to CIK Therapy. Cell. Physiol. Biochem. 2017, 41, 907–920. [Google Scholar] [CrossRef]
- Jiao, S.; Xia, W.; Yamaguchi, H.; Wei, Y.; Chen, M.-K.; Hsu, J.-M.; Hsu, J.L.; Yu, W.-H.; Du, Y.; Lee, H.-H.; et al. PARP Inhibitor Upregulates PD-L1 Expression and Enhances Cancer-Associated Immunosuppression. Clin. Cancer Res. 2017, 23, 3711–3720. [Google Scholar] [CrossRef] [PubMed] [Green Version]
- De Bono, J.S.; Ashworth, A. Translating cancer research into targeted therapeutics. Nature 2010, 467, 543–549. [Google Scholar] [CrossRef] [PubMed]
- Vogelstein, B.; Papadopoulos, N.; Velculescu, V.E.; Zhou, S.; Diaz, L.A.; Kinzler, K.W. Cancer Genome Landscapes. Science 2013, 339, 1546–1558. [Google Scholar] [CrossRef] [PubMed]
- Lanman, R.B.; Mortimer, S.A.; Zill, O.A.; Sebisanovic, D.; Lopez, R.; Blau, S.; Collisson, E.A.; Divers, S.G.; Hoon, D.S.; Kopetz, S.; et al. Analytical and Clinical Validation of a Digital Sequencing Panel for Quantitative, Highly Accurate Evaluation of Cell-Free Circulating Tumor DNA. PLoS ONE 2015, 10, e0140712. [Google Scholar] [CrossRef]
- Carr, T.; McEwen, R.; Dougherty, B.; Johnson, J.H.; Dry, J.R.; Lai, Z.; Ghazoui, Z.; Laing, N.M.; Hodgson, D.R.; Cruzalegui, F.; et al. Defining actionable mutations for oncology therapeutic development. Nat. Rev. Cancer 2016, 16, 319–329. [Google Scholar] [CrossRef]
- Yun, J.; Rago, C.; Cheong, I.; Pagliarini, R.; Angenendt, P.; Rajagopalan, H.; Schmidt, K.; Willson, J.K.V.; Markowitz, S.; Zhou, S.; et al. Glucose Deprivation Contributes to the Development of KRAS Pathway Mutations in Tumor Cells. Science 2009, 325, 1555–1559. [Google Scholar] [CrossRef] [Green Version]
- Kawauchi, K.; Araki, K.; Tobiume, K.; Tanaka, N. p53 regulates glucose metabolism through an IKK-NF-κB pathway and inhibits cell transformation. Nature 2008, 10, 611–618. [Google Scholar] [CrossRef]
- Gao, Y.; Chen, Z.-L.; Li, J.-G.; Hu, X.-D.; Shi, X.-J.; Sun, Z.-M.; Zhang, F.; Zhao, Z.-R.; Li, Z.-T.; Liu, Z.-Y.; et al. Genetic landscape of esophageal squamous cell carcinoma. Nat. Genet. 2014, 46, 1097–1102. [Google Scholar] [CrossRef]
- Hagemann, I.; Devarakonda, S.; Lockwood, C.; Spencer, D.H.; Guebert, K.; Bredemeyer, A.J.; Al-Kateb, H.; Nguyen, T.T.; Duncavage, E.J.; Cottrell, C.E.; et al. Clinical next-generation sequencing in patients with non-small cell lung cancer. Cancer 2014, 121, 631–639. [Google Scholar] [CrossRef]
- Olivier, M.; Petitjean, A.; De Fromentel, C.C.; Hainaut, P.; Ayed, A.; Hupp, T. TP53 Mutations in Human Cancers: Selection versus Mutagenesis. Sphingolipid-Mediat. Signal Transduct. 2010, 1, 1–18. [Google Scholar]
- Tsoulos, N.; Papadopoulou, E.; Metaxa-Mariatou, V.; Tsaousis, G.N.; Efstathiadou, C.; Tounta, G.; Scapeti, A.; Bourkoula, E.; Zarogoulidis, P.; Pentheroudakis, G.; et al. Tumor molecular profiling of NSCLC patients using next generation sequencing. Oncol. Rep. 2017, 38, 3419–3429. [Google Scholar] [CrossRef] [PubMed] [Green Version]
- Kikuchi-Yanoshita, R.; Konishi, M.; Ito, S.; Seki, M.; Tanaka, K.; Maeda, Y.; Iino, H.; Fukayama, M.; Koike, M.; Mori, T. Genetic changes of both p53 alleles associated with the conversion from colorectal adenoma to early carcinoma in familial adenomatous polyposis and non-familial adenomatous polyposis patients. Cancer Res. 1992, 52, 3965–3971. [Google Scholar] [PubMed]
- Schwaederle, M.; Lazar, V.; Validire, P.; Hansson, J.; Lacroix, L.; Soria, J.-C.; Pawitan, Y.; Kurzrock, R.; Vladimir, L. VEGF-A Expression Correlates with TP53 Mutations in Non–Small Cell Lung Cancer: Implications for Antiangiogenesis Therapy. Cancer Res. 2015, 75, 1187–1190. [Google Scholar] [CrossRef] [PubMed] [Green Version]
- Ojesina, A.; Lichtenstein, L.; Freeman, S.; Pedamallu, C.S.; Rosshandler, I.I.; Pugh, T.J.; Cherniack, A.D.; Ambrogio, L.; Cibulskis, K.; Bertelsen, B.; et al. Landscape of genomic alterations in cervical carcinomas. Nature 2013, 506, 371–375. [Google Scholar] [CrossRef] [PubMed]
- Feng, M.; Xiong, G.; Cao, Z.; Yang, G.; Zheng, S.; Song, X.; You, L.; Zheng, L.; Zhang, T.; Zhao, Y. PD-1/PD-L1 and immunotherapy for pancreatic cancer. Cancer Lett. 2017, 407, 57–65. [Google Scholar] [CrossRef] [PubMed]
- Kuderer, N.M.; Burton, K.A.; Blau, S.; Rose, A.L.; Parker, S.; Lyman, G.H.; Blau, C.A. Comparison of 2 Commercially Available Next-Generation Sequencing Platforms in Oncology. JAMA Oncol. 2017, 3, 996–998. [Google Scholar] [CrossRef]
- Taavitsainen, S.; Annala, M.; Ledet, E.; Beja, K.; Miller, P.J.; Moses, M.; Nykter, M.; Chi, K.N.; Sartor, O.; Wyatt, A.W. Evaluation of Commercial Circulating Tumor DNA Test in Metastatic Prostate Cancer. JCO Precis. Oncol. 2019, 3, 1–9. [Google Scholar] [CrossRef]
- Lawrence, M.S.; Stojanov, P.; Mermel, C.H.; Robinson, J.T.; Garraway, L.A.; Golub, T.R.; Meyerson, M.; Gabriel, S.B.; Lander, E.S.; Getz, G. Discovery and saturation analysis of cancer genes across 21 tumor types. Nature 2014, 505, 495–501. [Google Scholar] [CrossRef] [Green Version]
- Zill, O.A.; Banks, K.C.; Fairclough, S.R.; Mortimer, S.A.; Vowles, J.V.; Mokhtari, R.; Gandara, D.R.; Mack, P.C.; Odegaard, J.I.; Nagy, R.J.; et al. The Landscape of Actionable Genomic Alterations in Cell-Free Circulating Tumor DNA from 21,807 Advanced Cancer Patients. Clin. Cancer Res. 2018, 24, 3528–3538. [Google Scholar] [CrossRef] [Green Version]
- Page, K.; Guttery, D.; Garcia, D.F.; Hills, A.; Hastings, R.; Luo, J.; Goddard, K.; Shahin, V.; Woodley-Barker, L.; Rosales, B.M.; et al. Next Generation Sequencing of Circulating Cell-Free DNA for Evaluating Mutations and Gene Amplification in Metastatic Breast Cancer. Clin. Chem. 2017, 63, 532–541. [Google Scholar] [CrossRef] [Green Version]
- Merker, J.D.; Oxnard, G.R.; Compton, C.; Diehn, M.; Hurley, P.; Lazar, A.; Lindeman, N.; Lockwood, C.; Rai, A.J.; Schilsky, R.L.; et al. Circulating Tumor DNA Analysis in Patients With Cancer: American Society of Clinical Oncology and College of American Pathologists Joint Review. J. Clin. Oncol. 2018, 36, 1631–1641. [Google Scholar] [CrossRef] [PubMed]
- Strickler, J.H.; Loree, J.; Ahronian, L.G.; Parikh, A.R.; Niedzwiecki, N.; Pereira, A.; McKinney, M.; Korn, W.M.; Atreya, C.E.; Banks, K.C.; et al. Genomic Landscape of Cell-Free DNA in Patients with Colorectal Cancer. Cancer Discov. 2017, 8, 164–173. [Google Scholar] [CrossRef] [PubMed] [Green Version]
- Tokheim, C.J.; Papadopoulos, N.; Kinzler, K.W.; Vogelstein, B.; Karchin, R. Evaluating the evaluation of cancer driver genes. Proc. Natl. Acad. Sci. USA 2016, 113, 14330–14335. [Google Scholar] [CrossRef] [PubMed] [Green Version]
- Carter, P.; Alifrangis, C.; Cereser, B.; Chandrasinghe, P.; Belluz, L.D.B.; Herzog, T.; Levitan, J.; Moderau, N.; Schwartzberg, L.; Tabassum, N.; et al. Does molecular profiling of tumors using the Caris molecular intelligence platform improve outcomes for cancer patients? Oncotarget 2018, 9, 9456–9467. [Google Scholar]
- Rothwell, D.G.; Ayub, M.; Cook, N.; Thistlethwaite, F.; Carter, L.; Dean, E.; Smith, N.; Villa, S.; Dransfield, J.; Clipson, A.; et al. Utility of ctDNA to support patient selection for early phase clinical trials: The TARGET study. Nat. Med. 2019, 25, 738–743. [Google Scholar] [CrossRef] [Green Version]
- Slavin, T.P.; Banks, K.C.; Chudova, D.; Oxnard, G.R.; Odegaard, J.I.; Nagy, R.J.; Tsang, K.W.K.; Neuhausen, S.L.; Gray, S.W.; Cristofanilli, M.; et al. Identification of Incidental Germline Mutations in Patients With Advanced Solid Tumors Who Underwent Cell-Free Circulating Tumor DNA Sequencing. J. Clin. Oncol. 2018, 36, 3459–3465. [Google Scholar] [CrossRef]
- Zhang, X.; Mar, V.; Zhou, W.; Harrington, L.; Robinson, M. Telomere shortening and apoptosis in telomerase-inhibited human tumor cells. Genome Res. 1999, 13, 2388–2399. [Google Scholar] [CrossRef]
- Tamborero, D.; Gonzalez-Perez, A.; Perez-Llamas, C.; Deu-Pons, J.; Kandoth, C.; Reimand, J.; Lawrence, M.S.; Getz, G.; Bader, G.D.; Ding, L.; et al. Comprehensive identification of mutational cancer driver genes across 12 tumor types. Sci. Rep. 2013, 3, 2650. [Google Scholar] [CrossRef]
- Dees, N.D.; Zhang, Q.; Kandoth, C.; Wendl, M.C.; Schierding, W.; Koboldt, D.C.; Mooney, T.B.; Callaway, M.B.; Dooling, D.; Mardis, E.R.; et al. MuSiC: Identifying mutational significance in cancer genomes. Genome Res. 2012, 22, 1589–1598. [Google Scholar] [CrossRef] [Green Version]
- Shannon, P.; Markiel, A.; Ozier, O.; Baliga, N.S.; Wang, J.T.; Ramage, D.; Amin, N.; Schwikowski, B.; Ideker, T. Cytoscape: A Software Environment for Integrated Models of Biomolecular Interaction Networks. Genome Res. 2003, 13, 2498–2504. [Google Scholar] [CrossRef]
- Pan, S.; Brentnall, T.A.; Kelly, K.; Chen, R. Tissue proteomics in pancreatic cancer study: Discovery, emerging technologies, and challenges. Proteomics 2013, 13, 710–721. [Google Scholar] [CrossRef] [PubMed]
- Doll, S.; Gnad, F.; Mann, M. The Case for Proteomics and Phospho-Proteomics in Personalized Cancer Medicine. Proteom. Clin. Appl. 2019, 13. [Google Scholar] [CrossRef] [PubMed]
- Lee, S.; Lee, S.; Ouellette, S.; Park, W.-Y.; Lee, E.A.; Park, P.J. NGSCheckMate: Software for validating sample identity in next-generation sequencing studies within and across data types. Nucleic Acids Res. 2017, 45. [Google Scholar] [CrossRef] [PubMed]


| Cancer Subtype | Q | G-CF (%) | G-CS (%) | G-GM (%) | C-CF (%) | C-CS (%) | C-GM (%) |
|---|---|---|---|---|---|---|---|
| Adenoid cystic carcinoma | 1 | 0 (0) | 2 (100) | 0 (0) | 0 (0) | 0 (0) | 0 (0) |
| Breast adenocarcinoma | 10 | 10 (15.4) | 41 (63.1) | 14 (21.5) | 6 (12.8) | 25 (53.2) | 16 (34.0) |
| Carcinoma of unknown primary | 2 | 1 (33.3) | 1 (33.3) | 1 (33.3) | 1 (100) | 0 (0) | 0 (0) |
| Cholangiocarcinoma | 3 | 3 (18.8) | 9 (56.3) | 4 (25.0) | 2 (28.6) | 4 (57.1) | 1 (14.3) |
| Colorectal carcinoma | 29 | 74 (25.1) | 178 (60.3) | 43 (14.6) | 48 (33.3) | 60 (41.7) | 36 (25.0) |
| Cutaneous squamous cell carcinoma | 2 | 3 (18.8) | 11 (68.8) | 2 (12.5) | 4 (36.4) | 6 (54.5) | 1 (9.1) |
| Endometrial carcinoma | 2 | 2 (33.3) | 4 (66.7) | 0 (0) | 0 (0) | 0 (0) | 0 (0) |
| Esophageal adenocarcinoma | 5 | 5 (14.3) | 23 (65.7) | 7 (20.0) | 2 (12.5) | 10 (62.5) | 4 (25.0) |
| Esophageal squamous cell carcinoma | 1 | 0 (0) | 2 (33.3) | 4 (66.7) | 0 (0) | 0 (0) | 0 (0) |
| Gastric adenocarcinoma | 3 | 1 (5.9) | 13 (76.5) | 3 (17.6) | 0 (0) | 6 (54.5) | 5 (45.5) |
| Gastrointestinal stromal tumor | 2 | 0 (0) | 6 (100) | 0 (0) | 1 (25.0) | 3 (75.0) | 0 (0) |
| Glioblastoma multiforme | 1 | 1 (50) | 1 (50) | 0 (0) | 0 (0) | 1 (100) | 0 (0) |
| Head and neck squamous cell carcinoma | 9 | 15 (20.3) | 48 (64.9) | 11 (14.9) | 11 (25.6) | 22 (51.2) | 10 (23.3) |
| Hepatocellular carcinoma | 1 | 2 (18.2) | 5 (45.5) | 4 (36.4) | 1 (14.3) | 4 (57.1) | 2 (28.6) |
| Melanoma | 9 | 10 (16.9) | 43 (72.9) | 6 (10.2) | 6 (25.0) | 13 (54.2) | 5 (20.8) |
| Merkel cell carcinoma | 1 | 0 (0) | 3 (60.0) | 2 (40.0) | 0 (0) | 0 (0) | 0 (0) |
| Neuroendocrine tumor | 2 | 0 (0) | 14 (53.8) | 12 (46.2) | 1 (50.0) | 0 (0) | 1 (50.0) |
| Non-small cell lung cancer | 3 | 2 (9.1) | 16 (72.7) | 4 (18.2) | 0 (0) | 20 (83.3) | 4 (16.7) |
| Ovarian carcinoma | 6 | 4 (12.5) | 17 (53.1) | 11 (34.4) | 2 (13.3) | 9 (60.0) | 4 (26.7) |
| Pancreatic adenocarcinoma | 26 | 16 (15.0) | 70 (65.4) | 21 (19.6) | 23 (21.5) | 58 (54.2) | 26 (24.3) |
| Prostate adenocarcinoma | 11 | 30 (25.6) | 68 (58.1) | 19 (16.2) | 7 (30.4) | 8 (34.8) | 8 (34.8) |
| Renal cell carcinoma | 3 | 1 (7.7) | 9 (69.2) | 3 (23.1) | 0 (0) | 5 (50.0) | 5 (50.0) |
| Sarcoma | 7 | 4 (12.9) | 21 (67.7) | 6 (19.4) | 0 (0) | 3 (60.0) | 2 (40.0) |
| Small cell lung carcinoma | 2 | 1 (6.3) | 9 (56.3) | 6 (37.5) | 0 (0) | 4 (57.1) | 3 (42.9) |
| Transitional cell carcinoma | 4 | 2 (8.7) | 13 (56.5) | 8 (34.8) | 2 (13.3) | 9 (60.0) | 4 (26.7) |
| TOTAL | 145 | 187 (18.6) | 627 (62.4) | 191 (19.0) | 117 (22.3) | 270 (51.5) | 137 (26.1) |
| PT | Diagnosis | GaDCUS | CF (%) | CS (%) | GM (%) |
|---|---|---|---|---|---|
| 5 | Breast adenocarcinoma | HRAS (R41W) | 0 (0) | 1 (100) | 0 (0) |
| 9 | Breast adenocarcinoma | ARID1A (L1841L) | 1 (100) | 0 (0) | 0 (0) |
| 23 | Colorectal carcinoma | ALK (F1480L), FGFR3 (A734T), RAF1 (V21M), TERT (A670V) | 0 (0) | 3 (75) | 1 (25) |
| 26 | Colorectal carcinoma | ARID1A (K1830T) | 1 (100) | 0 (0) | 0 (0) |
| 33 | Colorectal carcinoma | NF1 (R2119T) | 0 (0) | 1 (100) | 0 (0) |
| 44 | Colorectal carcinoma | GATA3 (V338I) | 1 (100) | 0 (0) | 0 (0) |
| 51 | Esophageal adenocarcinoma | AR (P135L) | 1 (100) | 0 (0) | 0 (0) |
| 56 | Gastric adenocarcinoma | RAF1 (R59H) | 0 (0) | 1 (100) | 0 (0) |
| 68 | Head and neck squamous cell carcinoma | ALK (G1473E) | 0 (0) | 1 (100) | 0 (0) |
| 71 | Hepatocellular carcinoma | GATA3 (A319E) | 1 (100) | 0 (0) | 0 (0) |
| 75 | Melanoma | AR (A810T) | 1 (100) | 0 (0) | 0 (0) |
| 79 | Melanoma | NTRK1 (G595E), NTRK1 (Q487), ROS1 (G2031R) | 1 (50) | 1 (50) | 0 (0) |
| 84 | Non-small cell lung carcinoma | RB1 (N690S) | 0 (0) | 1 (100) | 0 (0) |
| 86 | Non-small cell lung carcinoma | ARID1A (L2239P), ARID1A (R2057W), CCNE1 (A53P) | 2 (66.7) | 1 (33.3) | 0 (0) |
| 87 | Ovarian carcinoma | ROS1 (P1941L) | 1 (100) | 0 (0) | 0 (0) |
| 100 | Pancreatic ductal adenocarcinoma | NF1 (R1396H) | 0 (0) | 1 (100) | 0 (0) |
| 102 | Pancreatic ductal adenocarcinoma | CDKN2A (L64P) | 0 (0) | 1 (100) | 0 (0) |
| 127 | Prostate adenocarcinoma | MYC (F22L) | 0 (0) | 1 (100) | 0 (0) |
| 136 | Sarcoma | CDKN2A (A100P) | 0 (0) | 1 (100) | 0 (0) |
| PT | Diagnosis | Age | GDM | CDM | DPT |
|---|---|---|---|---|---|
| 1 | Adenoid cystic carcinoma | 87 | EGFR, PIK3CA | - | 3 |
| 3 | Breast adenocarcinoma | 36 | EGFR, PTEN, TP53 | EGFR, PTEN, TP53 | 11 |
| 4 | Breast adenocarcinoma | 51 | PTEN, FGFR2, FGFR1, KRAS, PIK3CA, TP53, BRCA2 | BRCA2, CDK8, PTEN, TP53 | 1 |
| 11 | Breast adenocarcinoma | 71 | ARID1A, GNAS, TP53 | ATM, BAP1, BRCA2, NOTCH1, TP53 | 1 |
| 12 | Carcinoma of unknown primary | 27 | IDH2, TP53 | IDH2 | 1 |
| 15 | Cholangiocarcinoma | 83 | ATM, BRAF, SMAD4, TP53 | SMAD4, TP53 | 8 |
| 17 | Colorectal carcinoma | 31 | APC (x2), TP53, ARID1A | APC (x2), TP53 | 3 |
| 21 | Colorectal carcinoma | 76 | NF1, ROS1, STK11 | APC, KIT, KRAS, TP53 | 1 |
| 22 | Colorectal carcinoma | 58 | APC, KRAS, TP53 | - | 0 |
| 35 | Colorectal carcinoma | 63 | APC (x2), AR, EGFR, FGFR1, KRAS, PIK3CA | APC, ATM, KRAS, PIK3CA | 13 |
| 42 | Colorectal carcinoma | 56 | APC, KRAS, MET, MYC, RAF1, TP53 | APC, TP53 | 0 |
| 46 | Cutaneous squamous cell carcinoma | 72 | CCND1, EGFR, FGFR2, KRAS, PIK3CA | BRIP1, KRAS, NOTCH1, PIK3CA; FGF3, FGF4, FGFR2, NOTCH1 | 2 |
| 48 | Endometrial carcinoma | 71 | PIK3CA | - | 57 |
| 54 | Esophageal adenocarcinoma | 66 | KIT, TP53 | AKT2, KIT, CDK6, TP53 | 38 |
| 57 | Gastric Adenocarcinoma | 52 | CCNE1 (x2), RAF1 | ATM, BRCA2, Her2/Neu (ERBB2), TP53 | 5 |
| 60 | Gastrointestinal stromal tumor | 70 | KIT | KIT | 0 |
| 61 | Glioblastoma | 63 | CDKN2B, NOTCH1 | EGFR | 9 |
| 63 | Head and neck squamous cell carcinoma | 63 | TP53 | KMT2D | 25 |
| 69 | Head and neck squamous cell carcinoma | 63 | CCND1, CDH1, MET, PDGFRA, PIK3CA, TP53 | CCND1, FGF3, FGF4, KMT2C (x2), TP53 | 5 |
| 71 | Hepatocellular carcinoma | 63 | ALK, AR, BRCA1, GATA3, KIT, PIK3CA, PTEN, TERT (x2), TP53 | ARID2, FGF10, TP53, BRCA2, MCL1, RICTOR | 3 |
| 72 | Melanoma | 36 | BRAF (x2), EGFR, MET (x2), NF1, NRAS, PTEN, TERT (x2) | BRAF, MET, NF1, PTEN | 2 |
| 78 | Melanoma | 68 | GNA11, MYC, NOTCH1 | BAP1, GNA11 | 6 |
| 80 | Melanoma | 70 | ARID1A, NRAS | NRAS, SF3B1 | 4 |
| 81 | Merkel cell carcinoma | 80 | PTEN, TP53 (x2) | - | 0 |
| 82 | Neuroendocrine tumor | 68 | MET, PTPN11 | BRCA2 | 50 |
| 84 | Non-small cell lung carcinoma | 71 | CCNE1, CDKN2A, EGFR, FGFR1, NF1, PIK3CA, RB1, TP53 | EGFR, PIK3R1, TP53 | 1 |
| 88 | Ovarian carcinoma | 57 | BRCA1, TP53 | TP53 | 0 |
| 90 | Ovarian carcinoma | 77 | CCNE1, EGFR, NOTCH1, PIK3CA, PTEN | PTEN, TP53 | 1 |
| 93 | Pancreatic ductal adenocarcinoma | 53 | KRAS, NF1, TP53 | CDKN2A, KRAS | 8 |
| 94 | Pancreatic ductal adenocarcinoma | 72 | CTNNB1, KRAS, TP53 | KRAS, TP53 | 11 |
| 95 | Pancreatic ductal adenocarcinoma | 61 | ARID1A, CDKN2A, KRAS, TP53 | KRAS, RNF43, TP53 | 9 |
| 110 | Pancreatic ductal adenocarcinoma | 67 | CDK6, FBXW7, KRAS | AMER1, KRAS, PALB2, SMAD4 | 1 |
| 116 | Pancreatic ductal adenocarcinoma | 55 | CDKN2A, KRAS, TP53 | CDKN1B, CDKN2A, KRAS, TP53 | 4 |
| 122 | Prostate adenocarcinoma | 51 | AR, BRAF, CDK6, FGFR1, MET, RAF1, TP53 | TP53 | 17 |
| 126 | Prostate adenocarcinoma | 56 | TP53 | - | 1 |
| 129 | Prostate adenocarcinoma | 67 | AR, BRAF, BRCA2, CDK6, MET, MYC, PDGFRA, ROS1, TP53 | TP53 | 0 |
| 131 | Renal cell carcinoma | 52 | BRCA2 (x2), CCND2, TERT, VHL | BRCA2, VHL | 0 |
| 133 | Sarcoma | 38 | - | MET | 7 |
| 137 | Sarcoma | 20 | MTOR, TP53 | TP53 | 6 |
| 139 | Sarcoma | 41 | TP53 | WRN | 0 |
| 141 | Small cell lung carcinoma (SCLC) | 60 | BRCA1, HRAS, RB1, TP53 (x2) | BRCA1, RB1, TP53 | 2 |
| 143 | Transitional cell carcinoma | 63 | PIK3CA, TP53 | MITF, PIK3CA | 20 |
| 144 | Transitional cell carcinoma | 83 | FGFR1, TERT, TP53 | TP53 | 2 |
© 2020 by the authors. Licensee MDPI, Basel, Switzerland. This article is an open access article distributed under the terms and conditions of the Creative Commons Attribution (CC BY) license (http://creativecommons.org/licenses/by/4.0/).
Share and Cite
Larson, K.; Kannaiyan, R.; Pandey, R.; Chen, Y.; Babiker, H.M.; Mahadevan, D. A Comparative Analysis of Tumors and Plasma Circulating Tumor DNA in 145 Advanced Cancer Patients Annotated by 3 Core Cellular Processes. Cancers 2020, 12, 701. https://0-doi-org.brum.beds.ac.uk/10.3390/cancers12030701
Larson K, Kannaiyan R, Pandey R, Chen Y, Babiker HM, Mahadevan D. A Comparative Analysis of Tumors and Plasma Circulating Tumor DNA in 145 Advanced Cancer Patients Annotated by 3 Core Cellular Processes. Cancers. 2020; 12(3):701. https://0-doi-org.brum.beds.ac.uk/10.3390/cancers12030701
Chicago/Turabian StyleLarson, Kristian, Radhamani Kannaiyan, Ritu Pandey, Yuliang Chen, Hani M. Babiker, and Daruka Mahadevan. 2020. "A Comparative Analysis of Tumors and Plasma Circulating Tumor DNA in 145 Advanced Cancer Patients Annotated by 3 Core Cellular Processes" Cancers 12, no. 3: 701. https://0-doi-org.brum.beds.ac.uk/10.3390/cancers12030701