Tetraploidization of Immortalized Myoblasts Induced by Cell Fusion Drives Myogenic Sarcoma Development with DMD Deletion

 and
and 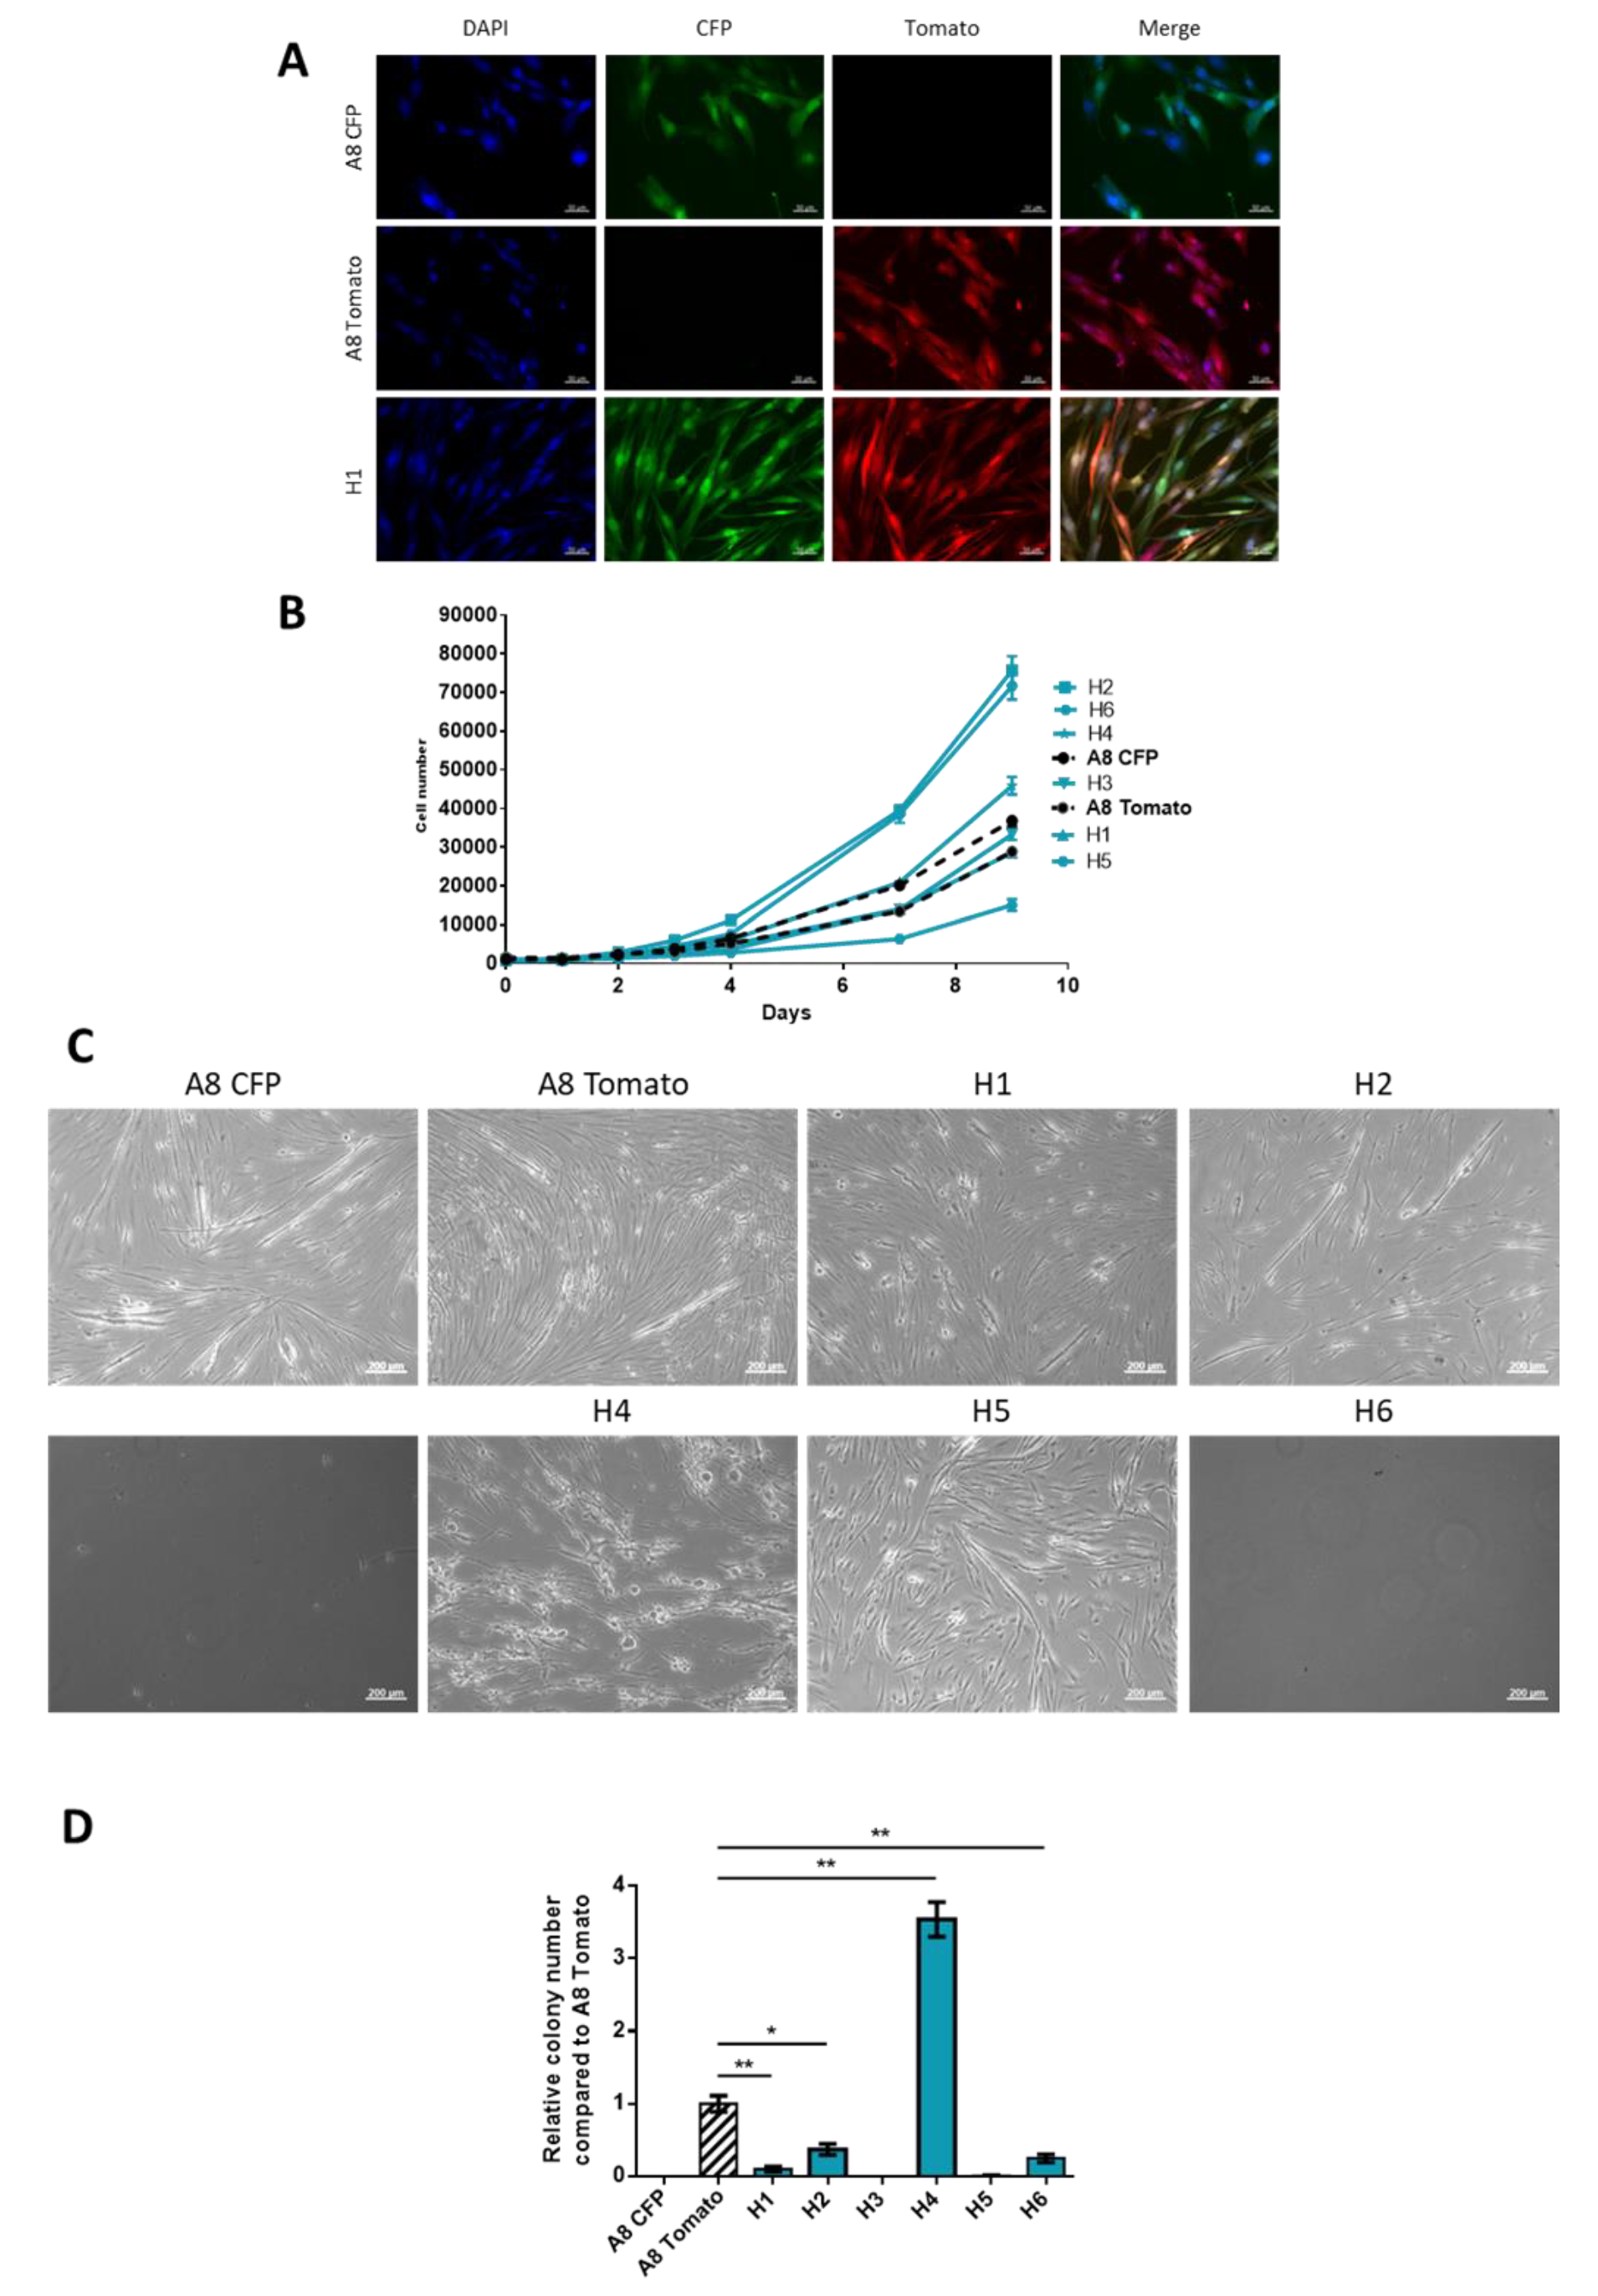
Abstract
:1. Introduction
2. Results
2.1. Generation of Spontaneous Hybrid Cells and Phenotypic Characterization
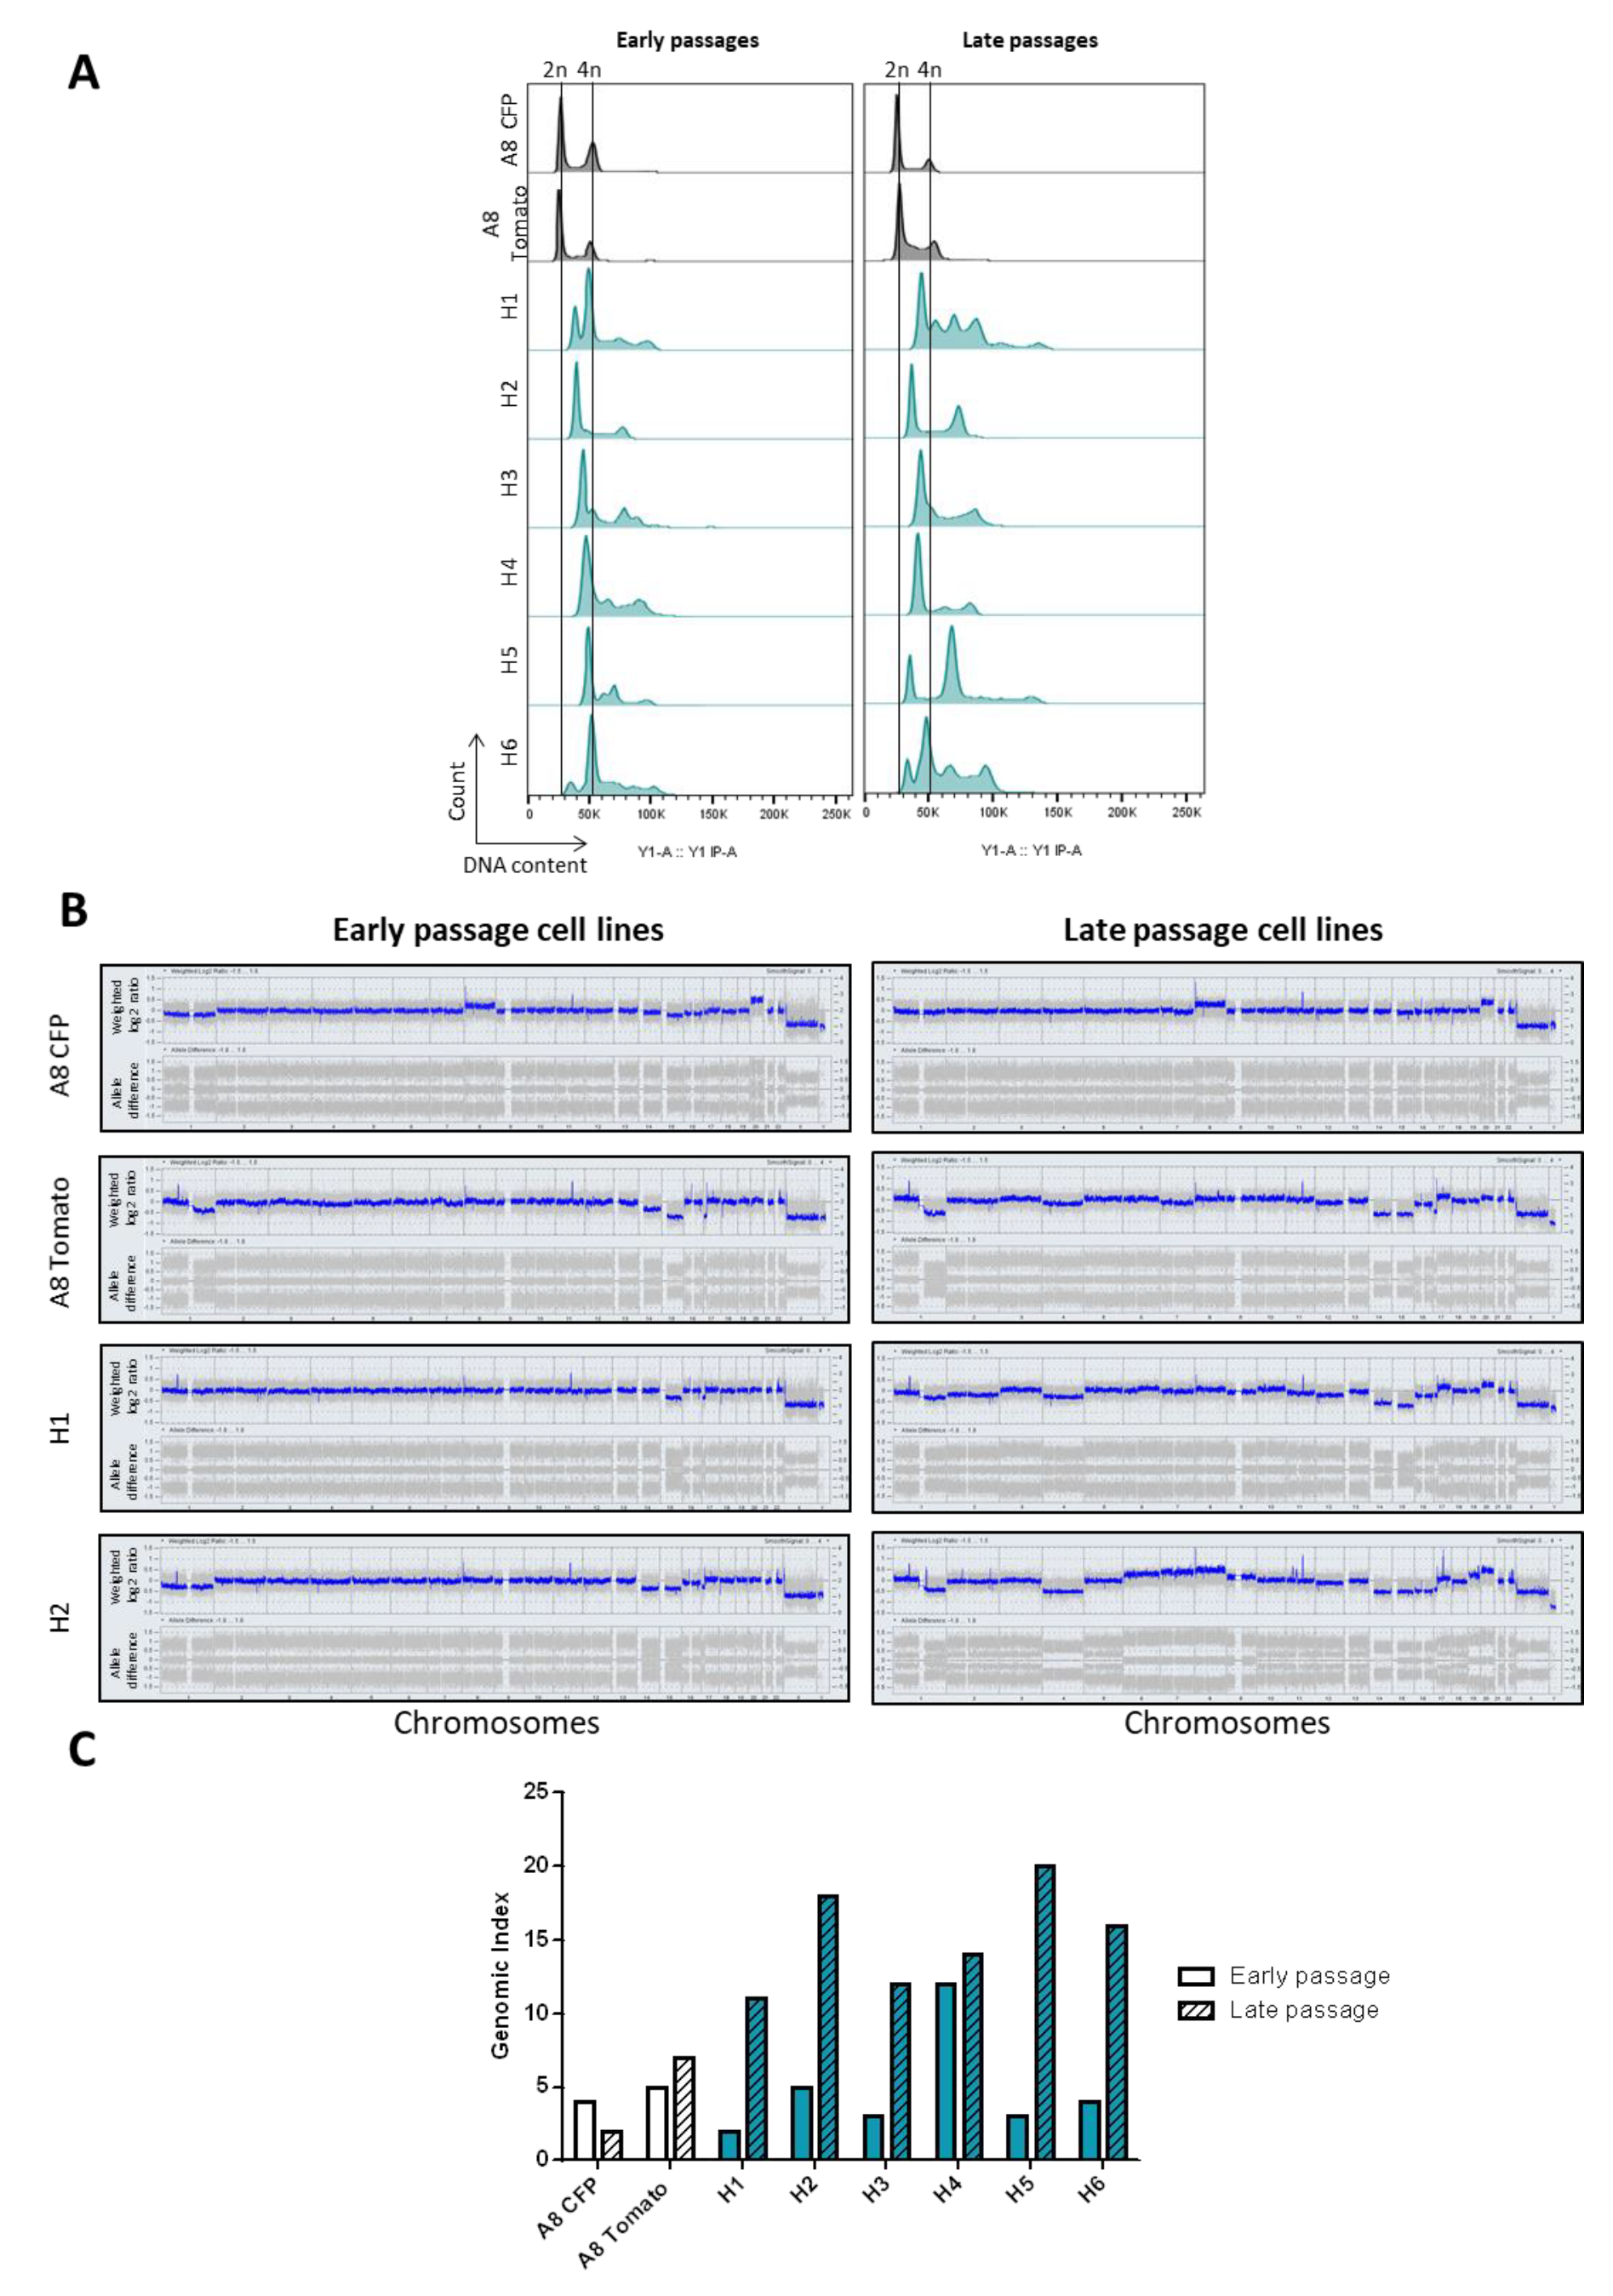
2.2. Hybrid Genomes Become Unstable upon Fusion and Evolves with Passages
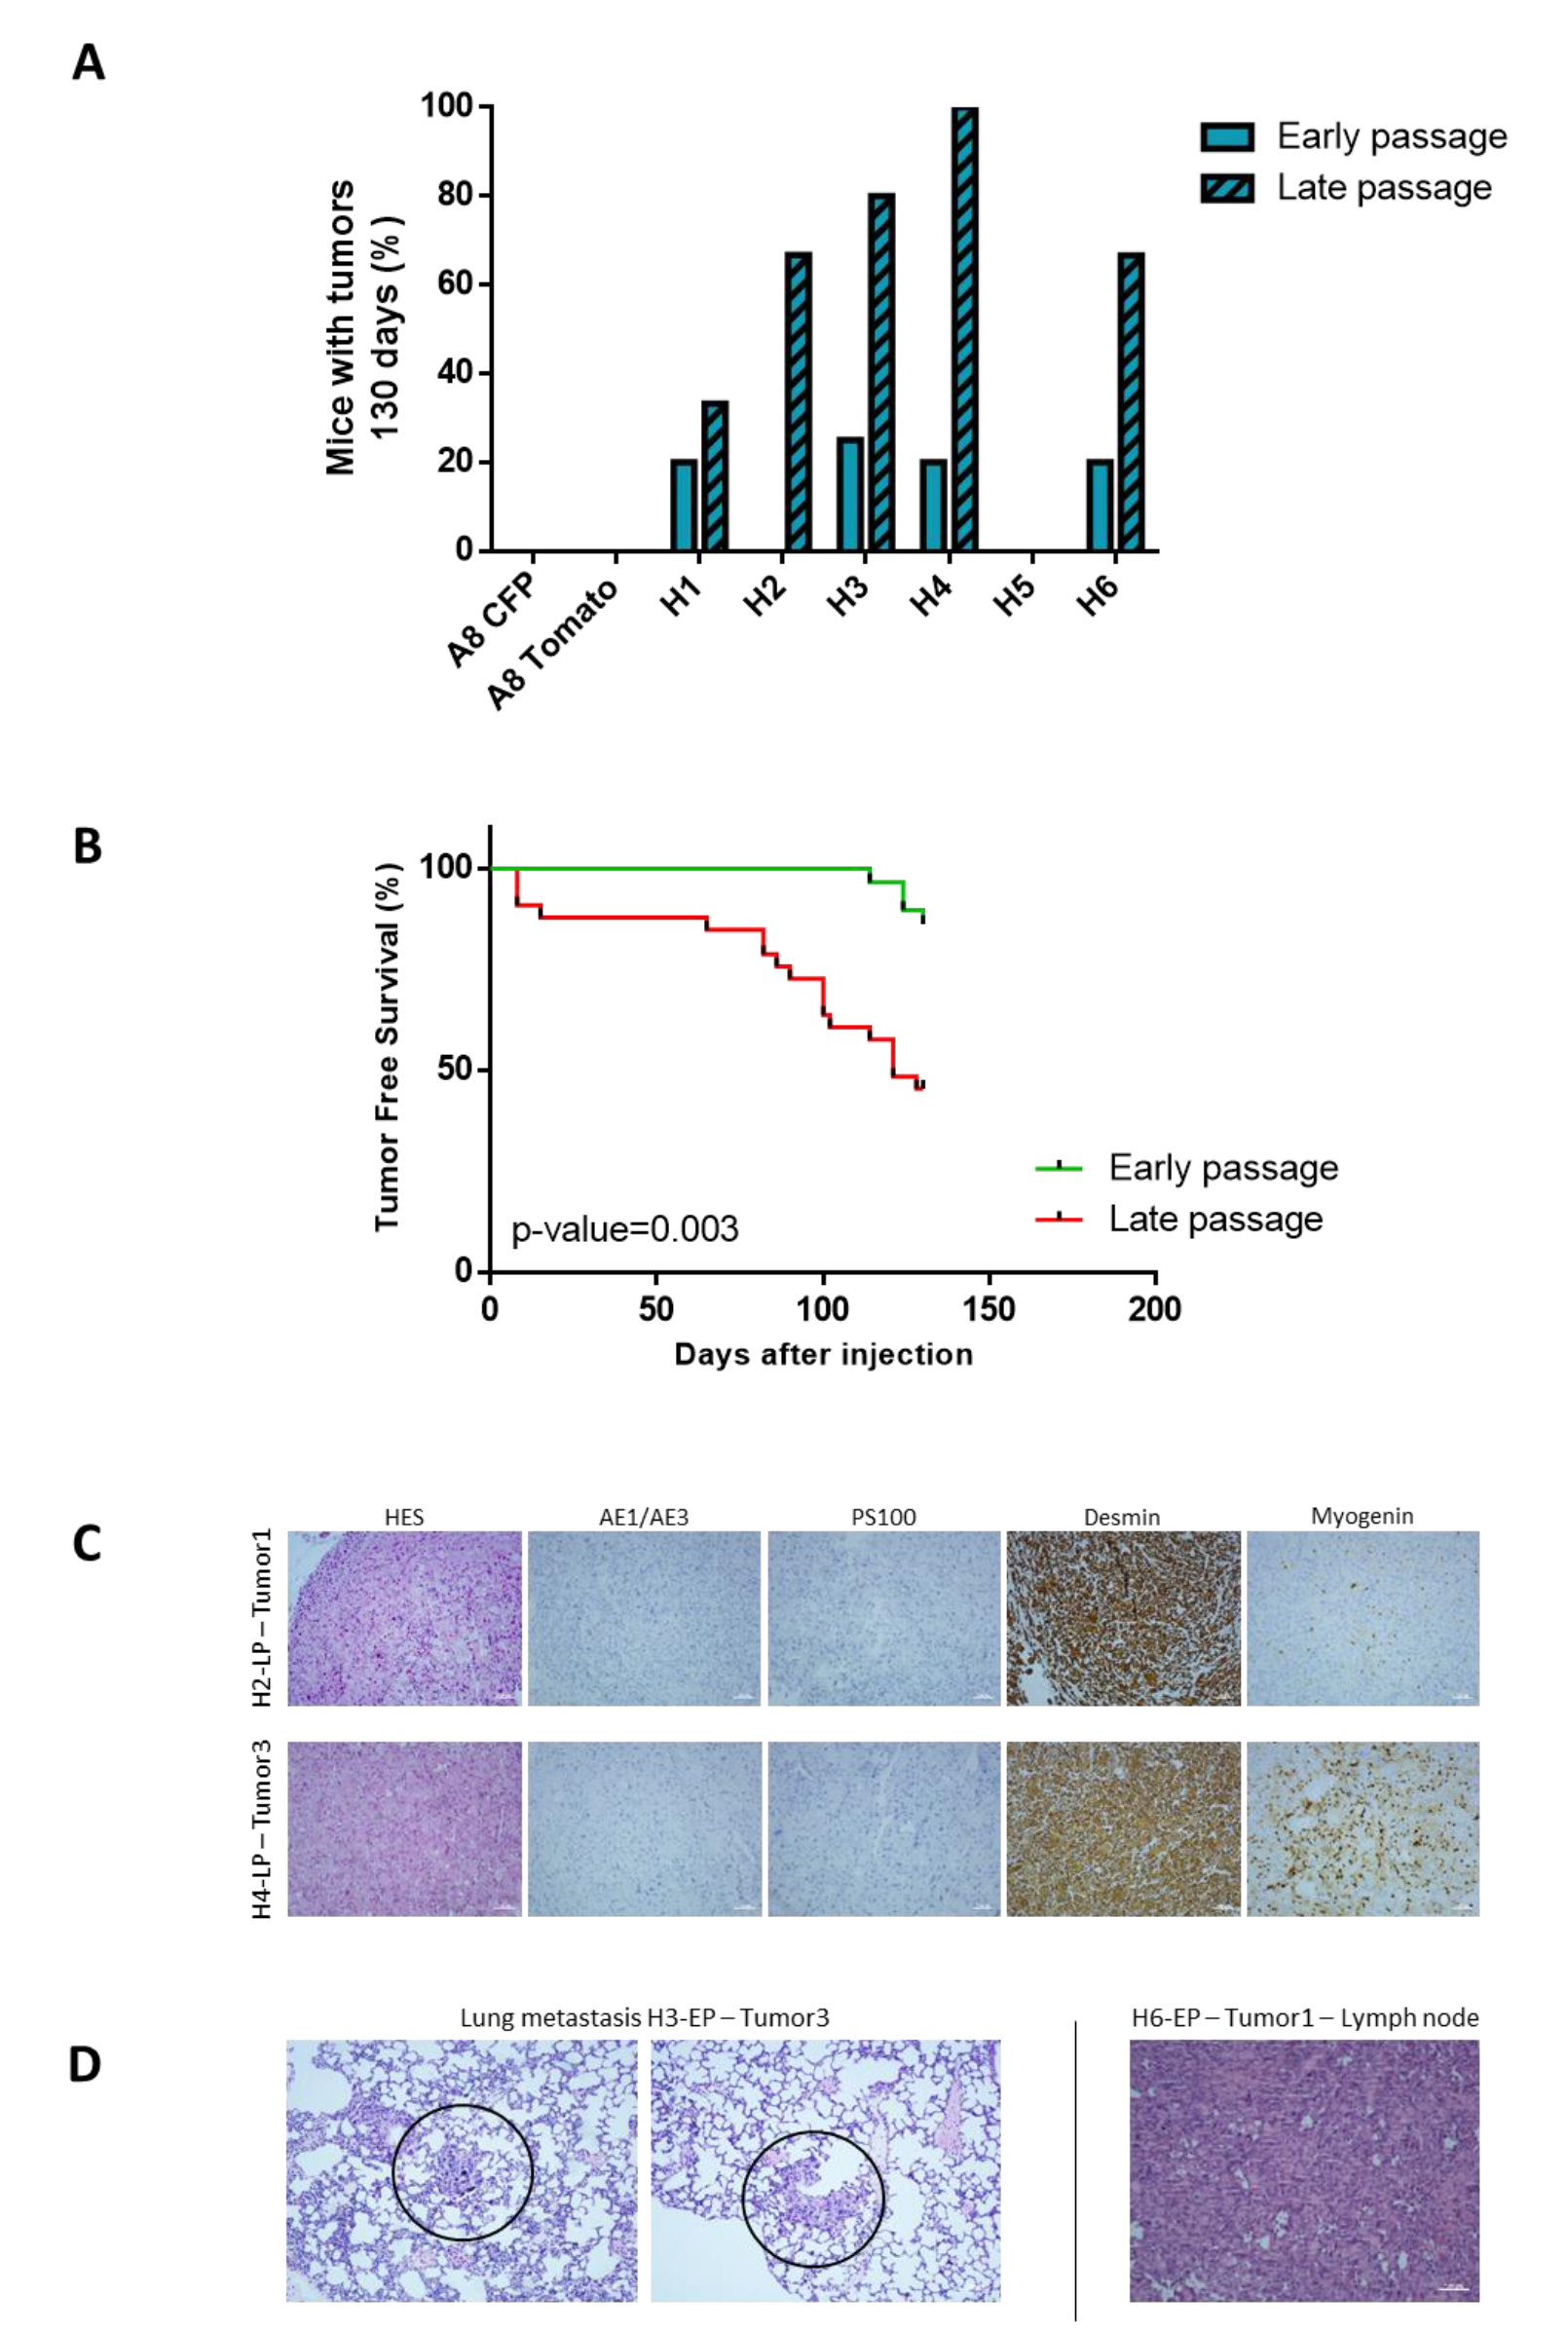
2.3. Tumor Development Occurs Only with Hybrids
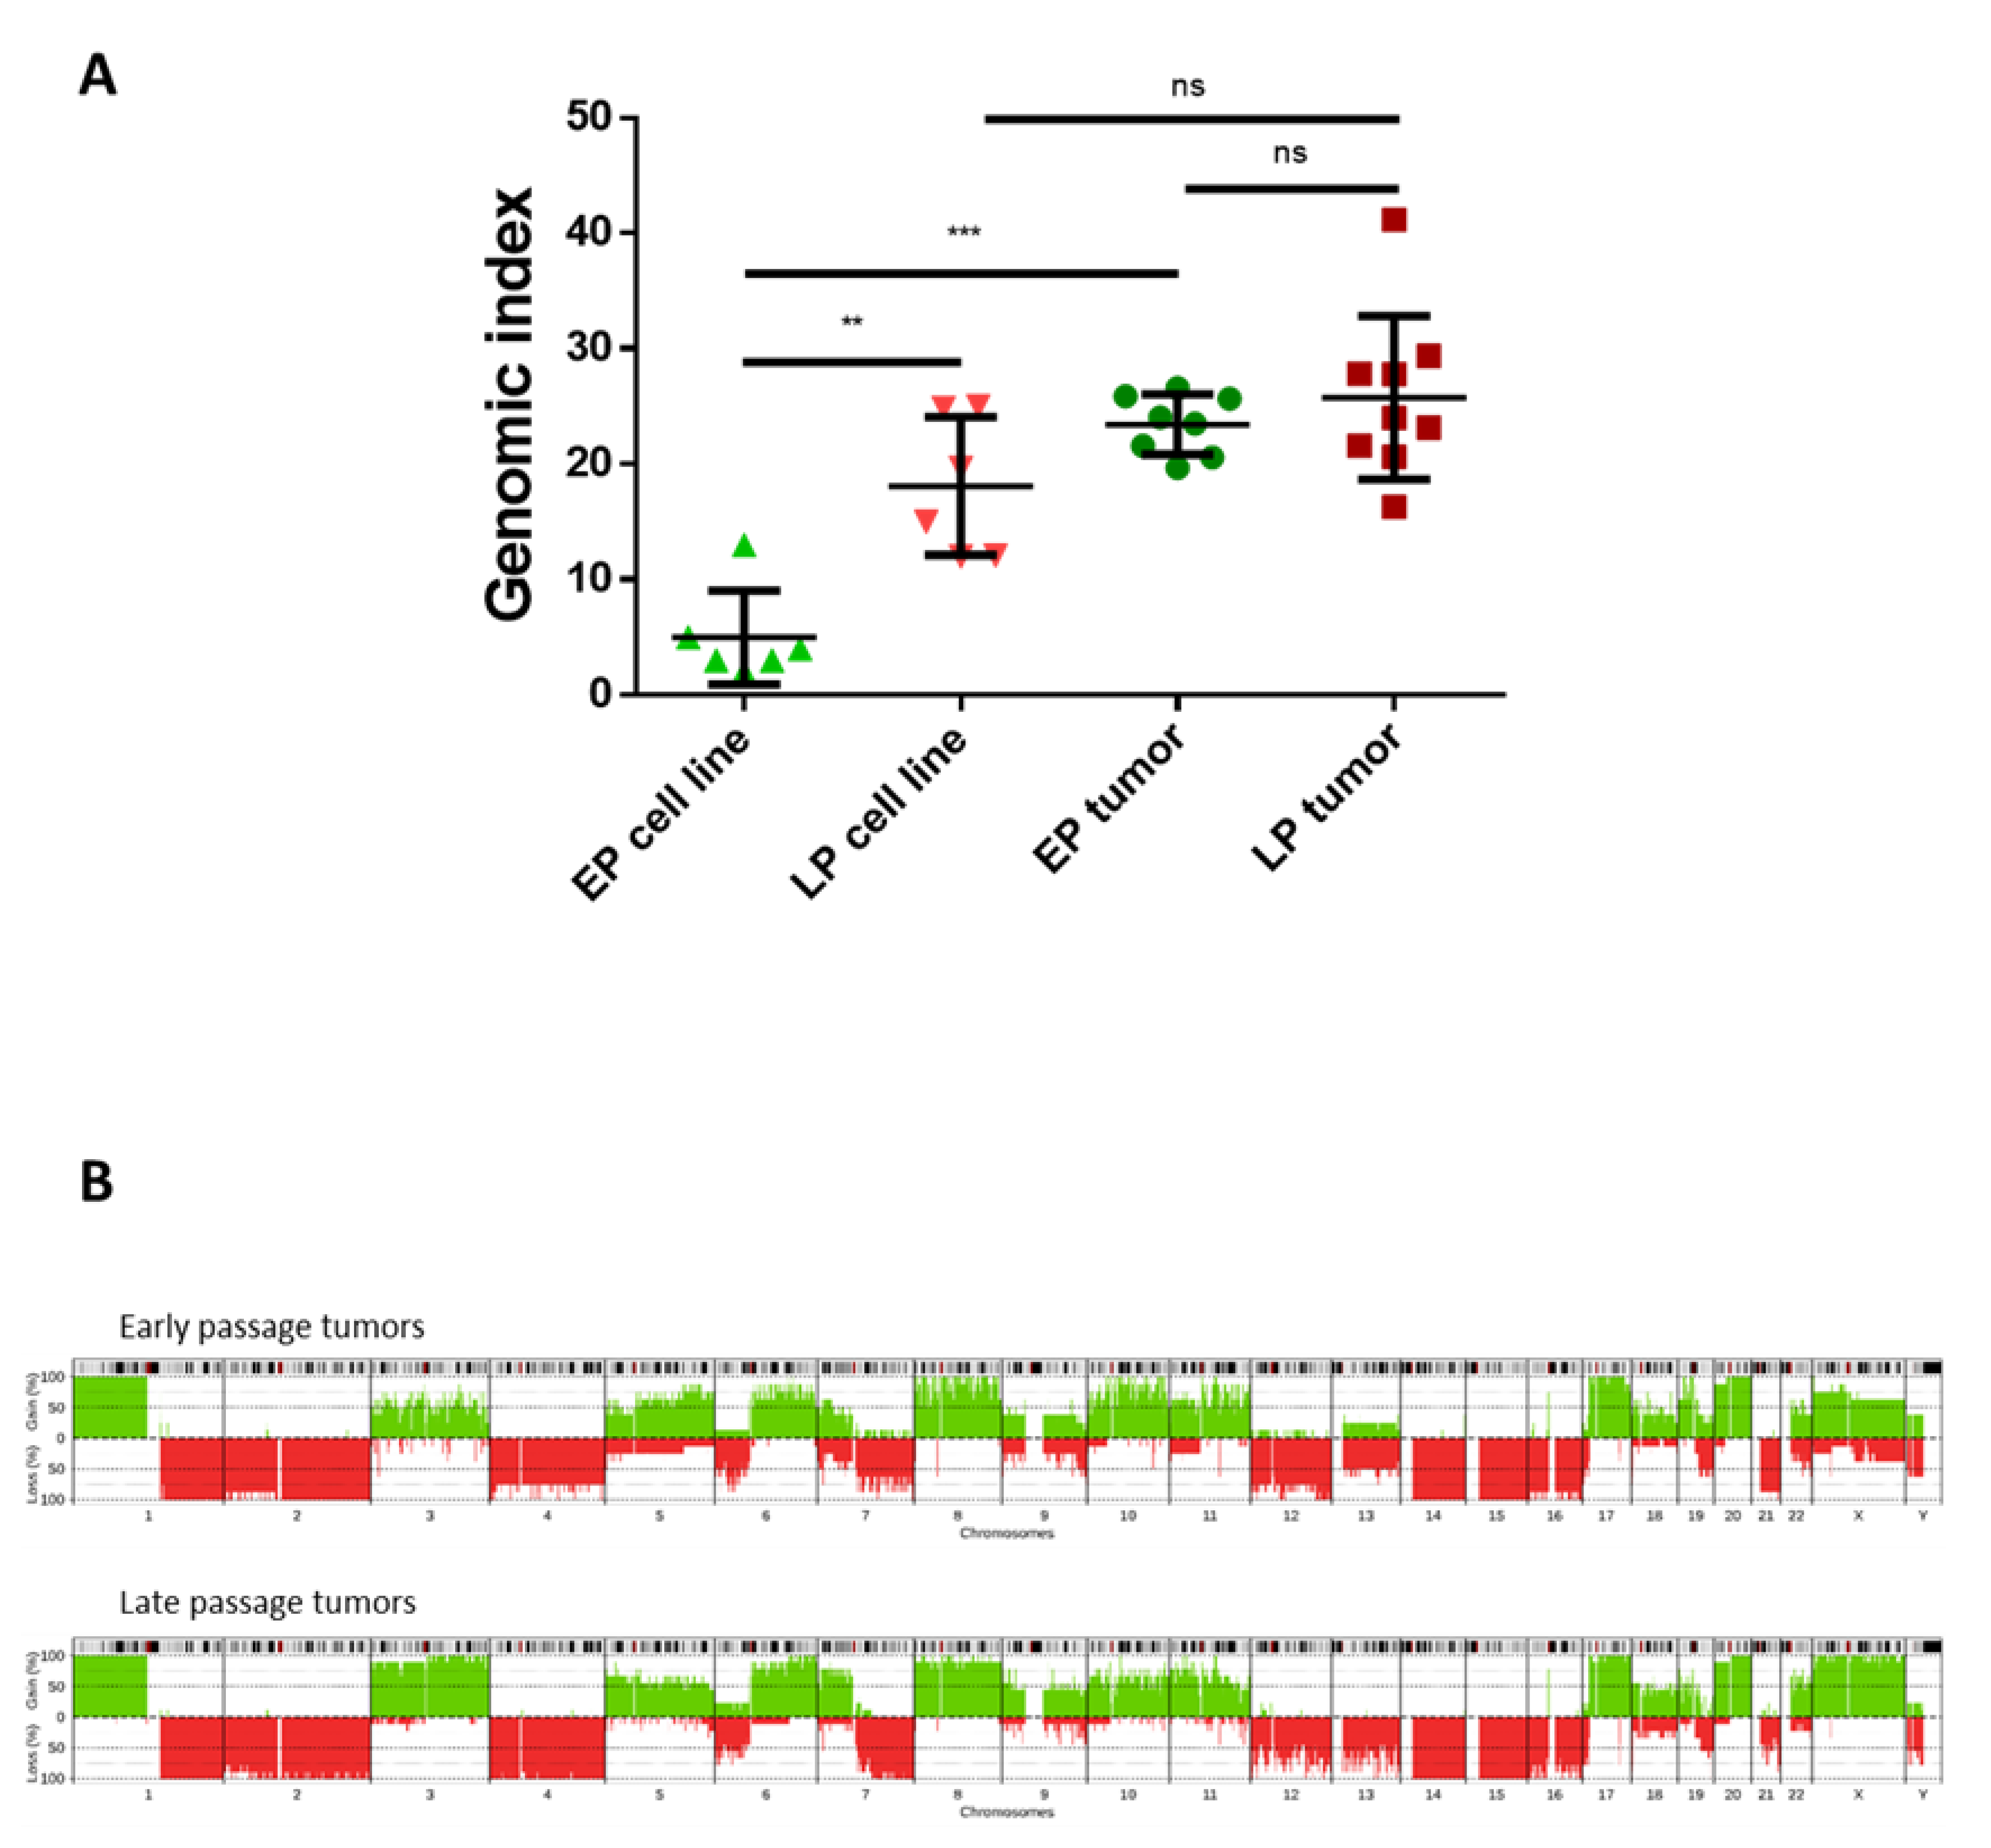
2.4. Hybrid Cell Lines Evolve towards a Genomic and Transcriptomic Pattern Promoting Oncogenesis
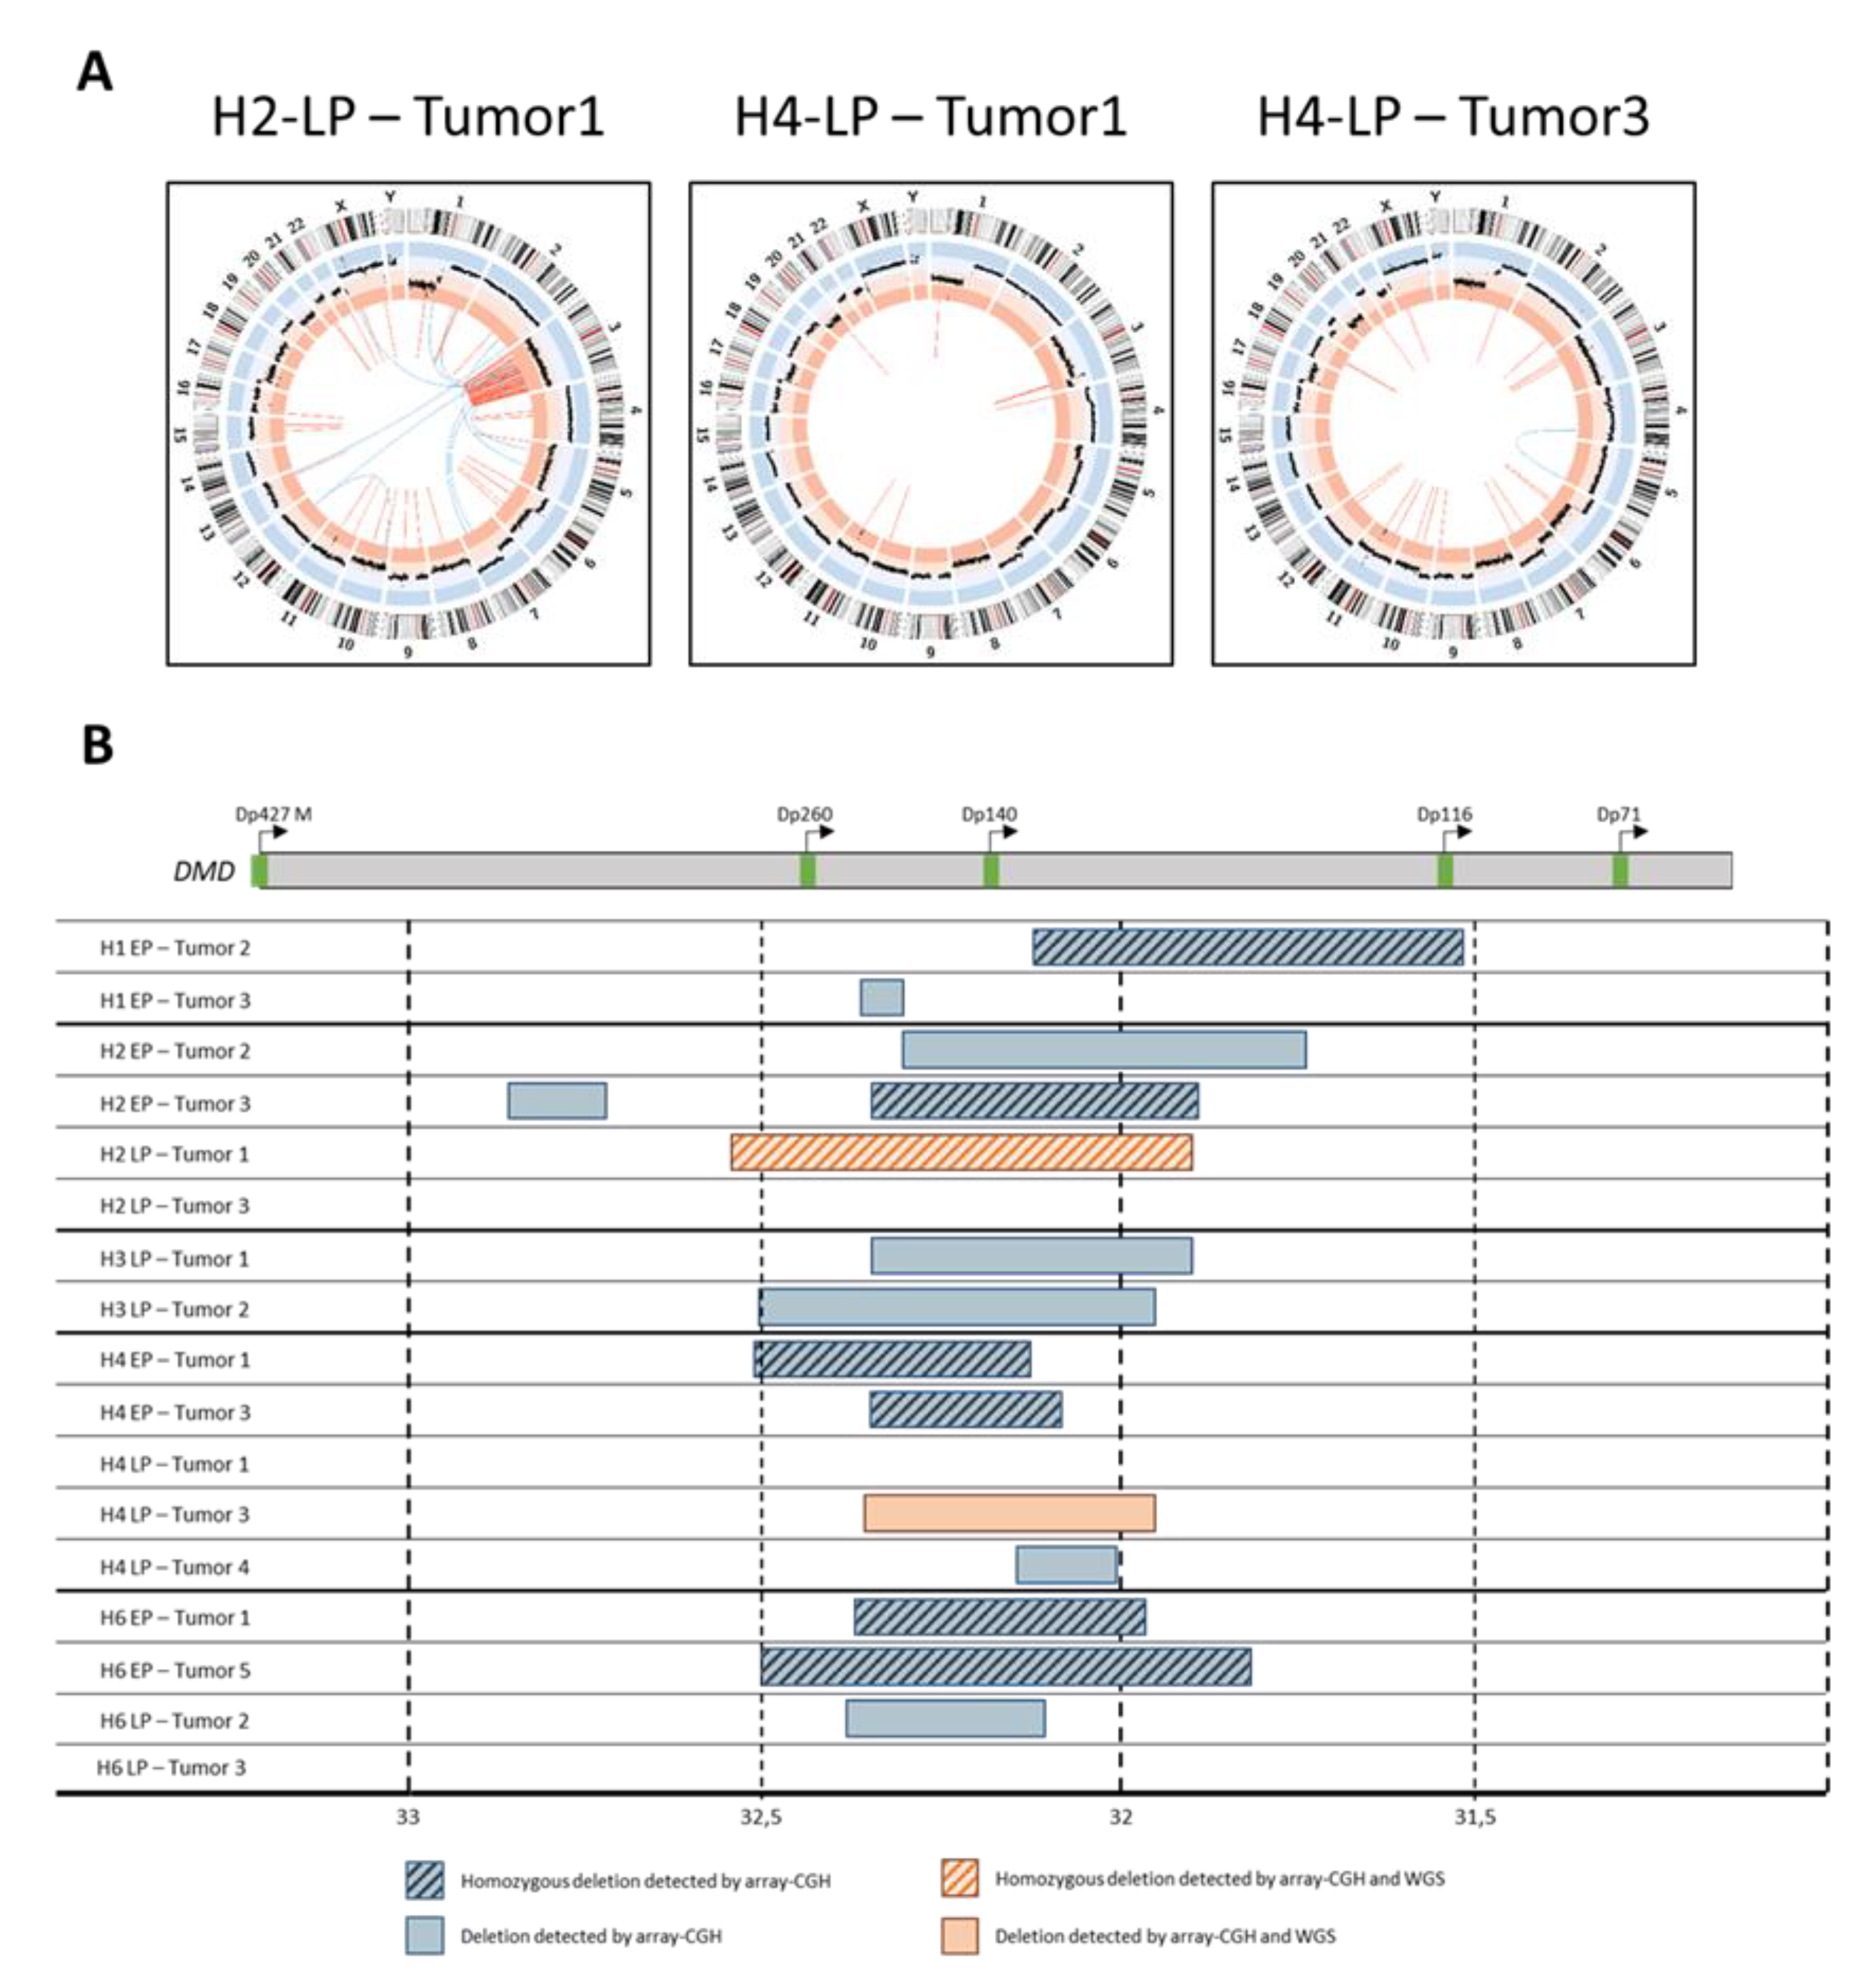
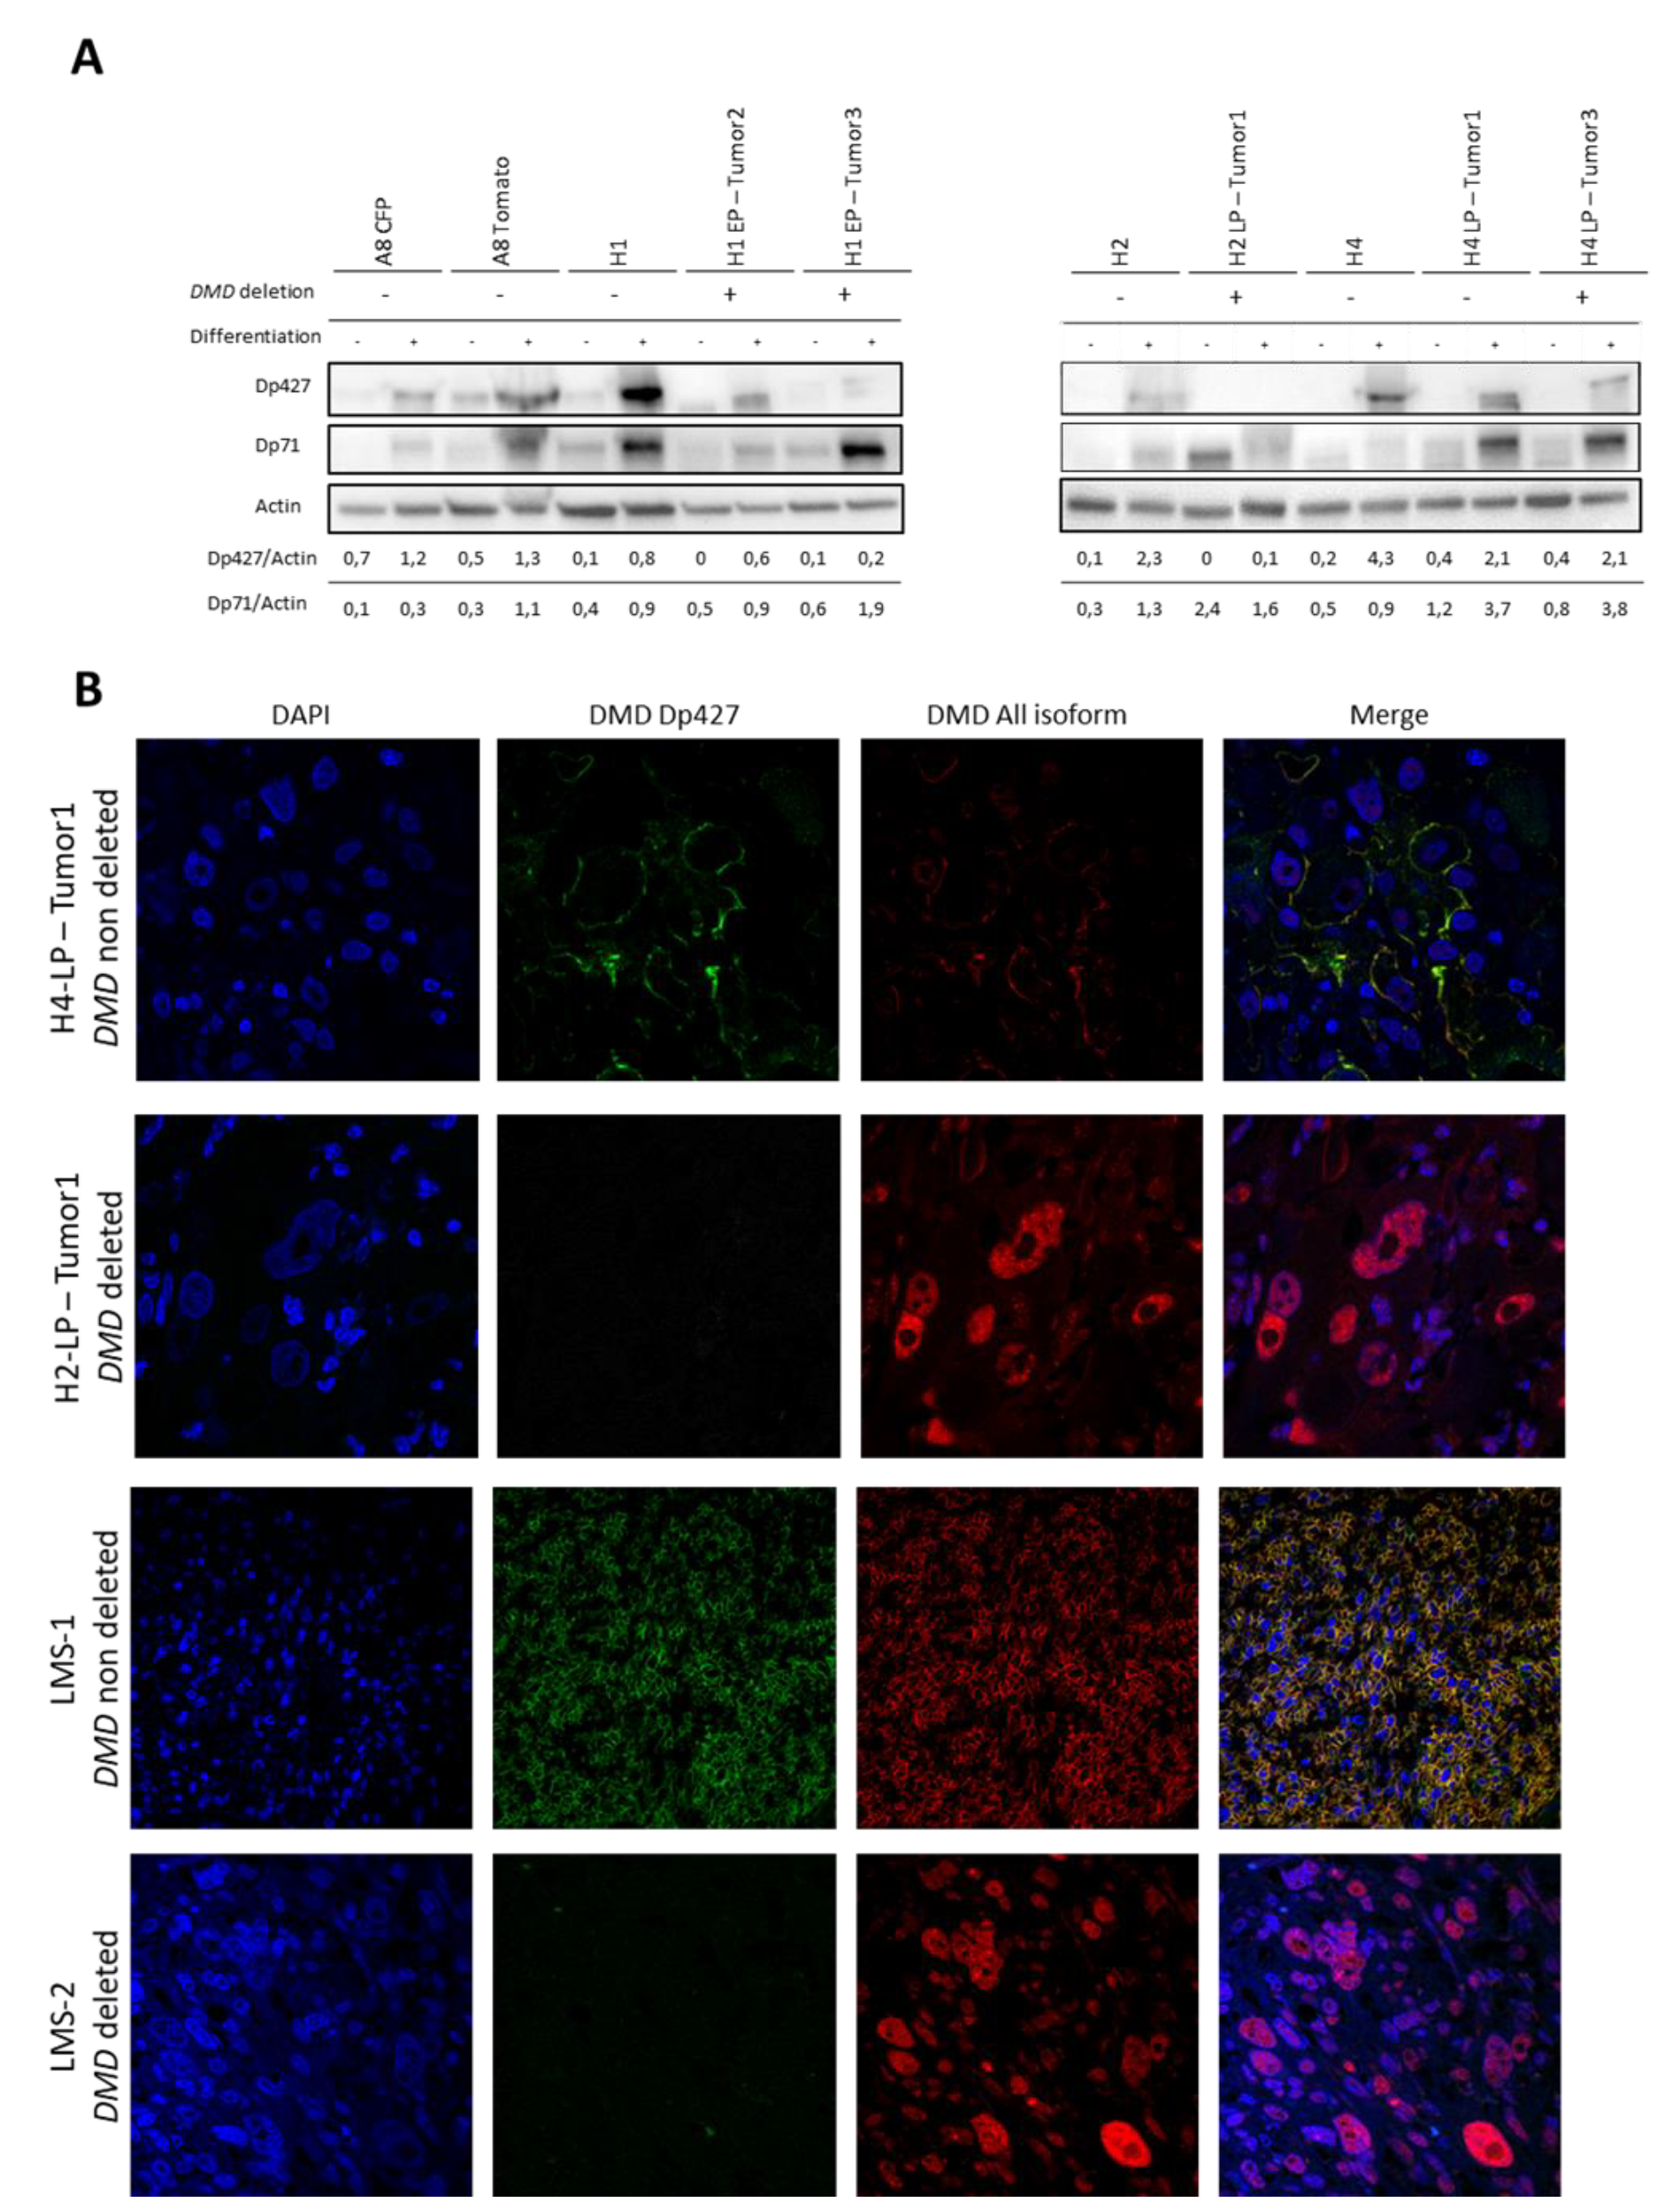
2.5. Tumors Developed by Hybrids Present a DMD Deletion Specific to Myogenic Sarcomas
3. Discussion
4. Material and Methods
4.1. Cell Lines and Culture Conditions
4.2. Generation and Validation of Hybrid Cell Lines
4.3. Ploidy Evaluation by Flow Cytometry
4.4. Proliferation Assay
4.5. Muscular Differentiation Assay
4.6. Soft agar Colony Formation Assay
4.7. In Vivo Experimentations
4.8. HE Staining and Immunohistochemistry
4.9. Tissue Immunofluorescence
4.10. RNA Extraction, Sequencing and Analysis
4.11. Genomic DNA Extraction, Cytoscan HD Array and Genomic Index Calculation
4.12. Whole Genome Sequencing and Structural Variant Analysis
4.13. PCR
4.14. Western Blotting
5. Conclusions
Supplementary Materials
Author Contributions
Funding
Acknowledgments
Conflicts of Interest
References
- Boveri, T. Über mehrpolige Mitosen als Mittel zur Analzyse des Zellkerns. Verhandlungen der physicalisch-medizinischen Gesselschaft zu Würzburg. On Multipolar Mitosis as a Means of Analysis of the Cell Nucleus. Verh. Phys. Med. Ges 1902, 35, 67–90. [Google Scholar]
- Reid, B.; Barrett, M.; Galipeau, P.; Sanchez, C.; Neshat, K.; Cowan, D.; Levine, D. Barrett’s esophagus: Ordering the events that lead to cancer. Eur. J. Cancer Prev. 1996, 5, 57. [Google Scholar] [CrossRef] [PubMed]
- Levine, D.S.; Rabinovitch, P.S.; Haggitt, R.C.; Blount, P.L.; Dean, P.J.; Rubin, C.E.; Reid, B.J. Distribution of aneuploid cell populations in ulcerative colitis with dysplasia or cancer. Gastroenterology 1991, 101, 1198–1210. [Google Scholar] [CrossRef]
- Bielski, C.M.; Zehir, A.; Penson, A.V.; Donoghue, M.T.A.; Chatila, W.; Armenia, J.; Chang, M.T.; Schram, A.M.; Jonsson, P.; Bandlamudi, C.; et al. Genome doubling shapes the evolution and prognosis of advanced cancers. Nat. Genet. 2018, 50, 1189–1195. [Google Scholar] [CrossRef] [PubMed]
- Fujiwara, T.; Bandi, M.; Nitta, M.; Ivanova, E.V.; Bronson, R.T.; Pellman, D. Cytokinesis failure generating tetraploids promotes tumorigenesis in p53-null cells. Nature 2005, 437, 1043–1047. [Google Scholar] [CrossRef]
- Jamal-Hanjani, M.; Wilson, G.A.; McGranahan, N.; Birkbak, N.J.; Watkins, T.B.K.; Veeriah, S.; Shafi, S.; Johnson, D.H.; Mitter, R.; Rosenthal, R.; et al. Tracking the Evolution of Non-Small-Cell Lung Cancer. N. Engl. J. Med. 2017, 376, 2109–2121. [Google Scholar] [CrossRef] [Green Version]
- The Cancer Genome Atlas Research Network. Comprehensive and Integrated Genomic Characterization of Adult Soft Tissue Sarcomas. Cell 2017, 171, 950–965. [Google Scholar] [CrossRef] [Green Version]
- Chudasama, P.; Mughal, S.S.; Sanders, M.A.; Hübschmann, D.; Chung, I.; Deeg, K.I.; Wong, S.-H.; Rabe, S.; Hlevnjak, M.; Zapatka, M.; et al. Integrative genomic and transcriptomic analysis of leiomyosarcoma. Nat. Commun. 2018, 9. [Google Scholar] [CrossRef] [Green Version]
- Steele, C.D.; Tarabichi, M.; Oukrif, D.; Webster, A.P.; Ye, H.; Fittall, M.; Lombard, P.; Martincorena, I.; Tarpey, P.S.; Collord, G.; et al. Undifferentiated Sarcomas Develop through Distinct Evolutionary Pathways. Cancer Cell 2019, 35, 441–456. [Google Scholar] [CrossRef] [Green Version]
- Duelli, D.M.; Padilla-Nash, H.M.; Berman, D.; Murphy, K.M.; Ried, T.; Lazebnik, Y. A virus causes cancer by inducing massive chromosomal instability through cell fusion. Curr. Biol. CB 2007, 17, 431–437. [Google Scholar] [CrossRef] [Green Version]
- Kovacs, G. Premature chromosome condensation: Evidence for in vivo cell fusion in human malignant tumours. Int. J. Cancer 1985, 36, 637–641. [Google Scholar] [CrossRef] [PubMed]
- Zhou, X.; Merchak, K.; Lee, W.; Grande, J.P.; Cascalho, M.; Platt, J.L. Cell Fusion Connects Oncogenesis with Tumor Evolution. Am. J. Pathol. 2015, 185, 2049–2060. [Google Scholar] [CrossRef] [PubMed]
- Edgar, B.A.; Orr-Weaver, T.L. Endoreplication Cell Cycles: More for Less. Cell 2001, 105, 297–306. [Google Scholar] [CrossRef] [Green Version]
- Zimmet, J.; Ravid, K. Polyploidy: Occurrence in nature, mechanisms, and significance for the megakaryocyte-platelet system. Exp. Hematol. 2000, 28, 3–16. [Google Scholar] [CrossRef]
- Eggert, U.S.; Mitchison, T.J.; Field, C.M. Animal Cytokinesis: From Parts List to Mechanisms | Annual Review of Biochemistry. Annu. Rev. Biochem. 2006, 75, 543–566. [Google Scholar] [CrossRef]
- Georgadaki, K.; Khoury, N.; Spandidos, D.A.; Zoumpourlis, V. The molecular basis of fertilization (Review). Int. J. Mol. Med. 2016, 38, 979–986. [Google Scholar] [CrossRef] [Green Version]
- Gibson, A.J.; Karasinski, J.; Relvas, J.; Moss, J.; Sherratt, T.G.; Strong, P.N.; Watt, D.J. Dermal fibroblasts convert to a myogenic lineage in mdx mouse muscle. J. Cell Sci. 1995, 108, 207–214. [Google Scholar]
- Taylor, M.V. Muscle differentiation: How two cells become one. Curr. Biol. 2002, 12, R224–R228. [Google Scholar] [CrossRef] [Green Version]
- Aichel, O. Über Zellverschmelzung mit Qualitativ Abnormer Chromosomenverteilung als Ursache der Geschwulstbildung. Vortr. Aufs. Entwickl. Org. 1911, 115S. (In German) [Google Scholar]
- Lu, X.; Kang, Y. Efficient acquisition of dual metastasis organotropism to bone and lung through stable spontaneous fusion between MDA-MB-231 variants. Proc. Natl. Acad. Sci. USA 2009, 106, 9385–9390. [Google Scholar] [CrossRef] [Green Version]
- Melzer, C.; von der Ohe, J.; Hass, R. Enhanced metastatic capacity of breast cancer cells after interaction and hybrid formation with mesenchymal stroma/stem cells (MSC). Cell Commun. Signal. 2018, 16, 2. [Google Scholar] [CrossRef] [PubMed] [Green Version]
- Xue, J.; Zhu, Y.; Sun, Z.; Ji, R.; Zhang, X.; Xu, W.; Yuan, X.; Zhang, B.; Yan, Y.; Yin, L.; et al. Tumorigenic hybrids between mesenchymal stem cells and gastric cancer cells enhanced cancer proliferation, migration and stemness. BMC Cancer 2015, 15. [Google Scholar] [CrossRef] [PubMed] [Green Version]
- Li, M.; Li, X.; Zhao, L.; Zhou, J.; Cheng, Y.; Xu, B.; Wang, J.; Wei, L. Spontaneous formation of tumorigenic hybrids between human omental adipose-derived stromal cells and endometrial cancer cells increased motility and heterogeneity of cancer cells. Cell Cycle 2019. [Google Scholar] [CrossRef] [PubMed] [Green Version]
- Rappa, G.; Mercapide, J.; Lorico, A. Spontaneous Formation of Tumorigenic Hybrids between Breast Cancer and Multipotent Stromal Cells Is a Source of Tumor Heterogeneity. Am. J. Pathol. 2012, 180, 2504–2515. [Google Scholar] [CrossRef] [PubMed] [Green Version]
- Delespaul, L.; Merle, C.; Lesluyes, T.; Lagarde, P.; Le Guellec, S.; Pérot, G.; Baud, J.; Carlotti, M.; Danet, C.; Fèvre, M.; et al. Fusion-mediated chromosomal instability promotes aneuploidy patterns that resemble human tumors. Oncogene 2019, 38, 6083–6094. [Google Scholar] [CrossRef]
- Gast, C.E.; Silk, A.D.; Zarour, L.; Riegler, L.; Burkhart, J.G.; Gustafson, K.T.; Parappilly, M.S.; Roh-Johnson, M.; Goodman, J.R.; Olson, B.; et al. Cell fusion potentiates tumor heterogeneity and reveals circulating hybrid cells that correlate with stage and survival. Sci. Adv. 2018, 4. [Google Scholar] [CrossRef] [Green Version]
- Powell, A.E.; Anderson, E.C.; Davies, P.S.; Silk, A.D.; Pelz, C.; Impey, S.; Wong, M.H. Fusion between Intestinal Epithelial Cells and Macrophages in a Cancer Context Results in Nuclear Reprogramming. Cancer Res. 2011, 71, 1497–1505. [Google Scholar] [CrossRef] [Green Version]
- Clawson, G.A.; Matters, G.L.; Xin, P.; Imamura-Kawasawa, Y.; Du, Z.; Thiboutot, D.M.; Helm, K.F.; Neves, R.I.; Abraham, T. Macrophage-tumor cell fusions from peripheral blood of melanoma patients. PLoS ONE 2015, 10, e0134320. [Google Scholar] [CrossRef] [Green Version]
- Clawson, G.A.; Matters, G.L.; Xin, P.; McGovern, C.; Wafula, E.; dePamphilis, C.; Meckley, M.; Wong, J.; Stewart, L.; D’Jamoos, C.; et al. “Stealth dissemination” of macrophage-tumor cell fusions cultured from blood of patients with pancreatic ductal adenocarcinoma. PLoS ONE 2017, 12. [Google Scholar] [CrossRef] [Green Version]
- Carvalho, S.D.; Pissaloux, D.; Crombé, A.; Coindre, J.-M.; Le Loarer, F. Pleomorphic Sarcomas: The State of the Art. Surg. Pathol. Clin. 2019, 12, 63–105. [Google Scholar] [CrossRef]
- Mamchaoui, K.; Trollet, C.; Bigot, A.; Negroni, E.; Chaouch, S.; Wolff, A.; Kandalla, P.K.; Marie, S.; Di Santo, J.; St Guily, J.L.; et al. Immortalized pathological human myoblasts: Towards a universal tool for the study of neuromuscular disorders. Skelet. Muscle 2011, 1, 34. [Google Scholar] [CrossRef] [PubMed] [Green Version]
- Fletcher, C.D.M.; Bridge, J.; Hogendoorn, P.; Mertens, F. WHO Classification of Tumours of Soft Tissue and Bone; IACR Press: Lyon, France, 2013. [Google Scholar]
- Mahooti, S.; Porter, K.; Alpaugh, M.L.; Ye, Y.; Xiao, Y.; Jones, S.; Tellez, J.D.; Barsky, S.H. Breast Carcinomatous Tumoral Emboli Can Result from Encircling Lymphovasculogenesis Rather Than Lymphovascular Invasion. Oncotarget 2010, 1. [Google Scholar] [CrossRef]
- Wang, Y.; Marino-Enriquez, A.; Bennett, R.R.; Zhu, M.; Shen, Y.; Eilers, G.; Lee, J.-C.; Henze, J.; Fletcher, B.S.; Gu, Z.; et al. Dystrophin Is a Tumor Suppressor in Human Cancers with Myogenic Programs. Nat. Genet. 2014, 46, 601–606. [Google Scholar] [CrossRef] [PubMed] [Green Version]
- Mauduit, O.; Delcroix, V.; Lesluyes, T.; Pérot, G.; Lagarde, P.; Lartigue, L.; Blay, J.-Y.; Chibon, F. Recurrent DMD Deletions Highlight Specific Role of Dp71 Isoform in Soft-Tissue Sarcomas. Cancers 2019, 11, 922. [Google Scholar] [CrossRef] [Green Version]
- Ganem, N.J.; Godinho, S.A.; Pellman, D. A mechanism linking extra centrosomes to chromosomal instability. Nature 2009, 460, 278–282. [Google Scholar] [CrossRef] [Green Version]
- Davoli, T.; Xu, A.W.; Mengwasser, K.E.; Sack, L.M.; Yoon, J.C.; Park, P.J.; Elledge, S.J. Cumulative haploinsufficiency and triplosensitivity drive aneuploidy patterns and shape the cancer genome. Cell 2013, 155, 948–962. [Google Scholar] [CrossRef] [Green Version]
- Helmrich, A.; Ballarino, M.; Tora, L. Collisions between Replication and Transcription Complexes Cause Common Fragile Site Instability at the Longest Human Genes. Mol. Cell 2011, 44, 966–977. [Google Scholar] [CrossRef] [Green Version]
- Gaillard, H.; García-Muse, T.; Aguilera, A. Replication stress and cancer. Nat. Rev. Cancer 2015, 15, 276–289. [Google Scholar] [CrossRef]
- Turajlic, S.; Xu, H.; Litchfield, K.; Rowan, A.; Chambers, T.; Lopez, J.I.; Nicol, D.; O’Brien, T.; Larkin, J.; Horswell, S.; et al. Tracking Cancer Evolution Reveals Constrained Routes to Metastases: TRACERx Renal. Cell 2018, 173, 581–594. [Google Scholar] [CrossRef]
- Sebire, N.J.; Malone, M. Myogenin and MyoD1 expression in paediatric rhabdomyosarcomas. J. Clin. Pathol. 2003, 56, 412–416. [Google Scholar] [CrossRef]
- Venables, J.P. Aberrant and alternative splicing in cancer. Cancer Res. 2004, 64, 7647–7654. [Google Scholar] [CrossRef] [Green Version]
- Sveen, A.; Kilpinen, S.; Ruusulehto, A.; Lothe, R.A.; Skotheim, R.I. Aberrant RNA splicing in cancer; expression changes and driver mutations of splicing factor genes. Oncogene 2016, 35, 2413–2427. [Google Scholar] [CrossRef]
- Lev, A.A.; Feener, C.C.; Kunkel, L.M.; Brown, R.H. Expression of the Duchenne’s muscular dystrophy gene in cultured muscle cells. J. Biol. Chem. 1987, 262, 15817–15820. [Google Scholar]
- Howard, P.L.; Dally, G.Y.; Ditta, S.D.; Austin, R.C.; Worton, R.G.; Klamut, H.J.; Ray, P.N. Dystrophin isoforms Dp71 and Dp427 have distinct roles in myogenic cells. Muscle Nerve 1999, 22, 16–27. [Google Scholar] [CrossRef]
- Fuentes-Mera, L.; Rodríguez-Muñoz, R.; González-Ramírez, R.; García-Sierra, F.; González, E.; Mornet, D.; Cisneros, B. Characterization of a novel Dp71 dystrophin-associated protein complex (DAPC) present in the nucleus of HeLa cells: Members of the nuclear DAPC associate with the nuclear matrix. Exp. Cell Res. 2006, 312, 3023–3035. [Google Scholar] [CrossRef] [PubMed] [Green Version]
- González-Ramírez, R.; Morales-Lázaro, S.L.; Tapia-Ramírez, V.; Mornet, D.; Cisneros, B. Nuclear and nuclear envelope localization of dystrophin Dp71 and dystrophin-associated proteins (DAPs) in the C2C12 muscle cells: DAPs nuclear localization is modulated during myogenesis. J. Cell. Biochem. 2008, 105, 735–745. [Google Scholar] [CrossRef] [PubMed]
- Lesluyes, T.; Pérot, G.; Largeau, M.R.; Brulard, C.; Lagarde, P.; Dapremont, V.; Lucchesi, C.; Neuville, A.; Terrier, P.; Vince-Ranchère, D.; et al. RNA sequencing validation of the Complexity INdex in SARComas prognostic signature. Eur. J. Cancer Oxf. Engl. 2016, 57, 104–111. [Google Scholar] [CrossRef] [PubMed]
- Li, H.; Durbin, R. Fast and accurate short read alignment with Burrows–Wheeler transform. Bioinformatics 2009, 25, 1754–1760. [Google Scholar] [CrossRef] [PubMed] [Green Version]
- Cameron, D.L.; Schröder, J.; Penington, J.S.; Do, H.; Molania, R.; Dobrovic, A.; Speed, T.P.; Papenfuss, A.T. GRIDSS: Sensitive and specific genomic rearrangement detection using positional de Bruijn graph assembly. Genome Res. 2017, 27, 2050–2060. [Google Scholar] [CrossRef] [Green Version]
- Krzywinski, M.; Schein, J.; Birol, İ.; Connors, J.; Gascoyne, R.; Horsman, D.; Jones, S.J.; Marra, M.A. Circos: An information aesthetic for comparative genomics. Genome Res. 2009, 19, 1639–1645. [Google Scholar] [CrossRef] [PubMed] [Green Version]


© 2020 by the authors. Licensee MDPI, Basel, Switzerland. This article is an open access article distributed under the terms and conditions of the Creative Commons Attribution (CC BY) license (http://creativecommons.org/licenses/by/4.0/).
Share and Cite
Merle, C.; Thébault, N.; LeGuellec, S.; Baud, J.; Pérot, G.; Lesluyes, T.; Delespaul, L.; Lartigue, L.; Chibon, F. Tetraploidization of Immortalized Myoblasts Induced by Cell Fusion Drives Myogenic Sarcoma Development with DMD Deletion. Cancers 2020, 12, 1281. https://0-doi-org.brum.beds.ac.uk/10.3390/cancers12051281
Merle C, Thébault N, LeGuellec S, Baud J, Pérot G, Lesluyes T, Delespaul L, Lartigue L, Chibon F. Tetraploidization of Immortalized Myoblasts Induced by Cell Fusion Drives Myogenic Sarcoma Development with DMD Deletion. Cancers. 2020; 12(5):1281. https://0-doi-org.brum.beds.ac.uk/10.3390/cancers12051281
Chicago/Turabian StyleMerle, Candice, Noémie Thébault, Sophie LeGuellec, Jessica Baud, Gaëlle Pérot, Tom Lesluyes, Lucile Delespaul, Lydia Lartigue, and Frédéric Chibon. 2020. "Tetraploidization of Immortalized Myoblasts Induced by Cell Fusion Drives Myogenic Sarcoma Development with DMD Deletion" Cancers 12, no. 5: 1281. https://0-doi-org.brum.beds.ac.uk/10.3390/cancers12051281