
Epigenetic Dysregulation of the Homeobox A5 (HOXA5) Gene Associates with Subcutaneous Adipocyte Hypertrophy in Human Obesity

 , , , , and
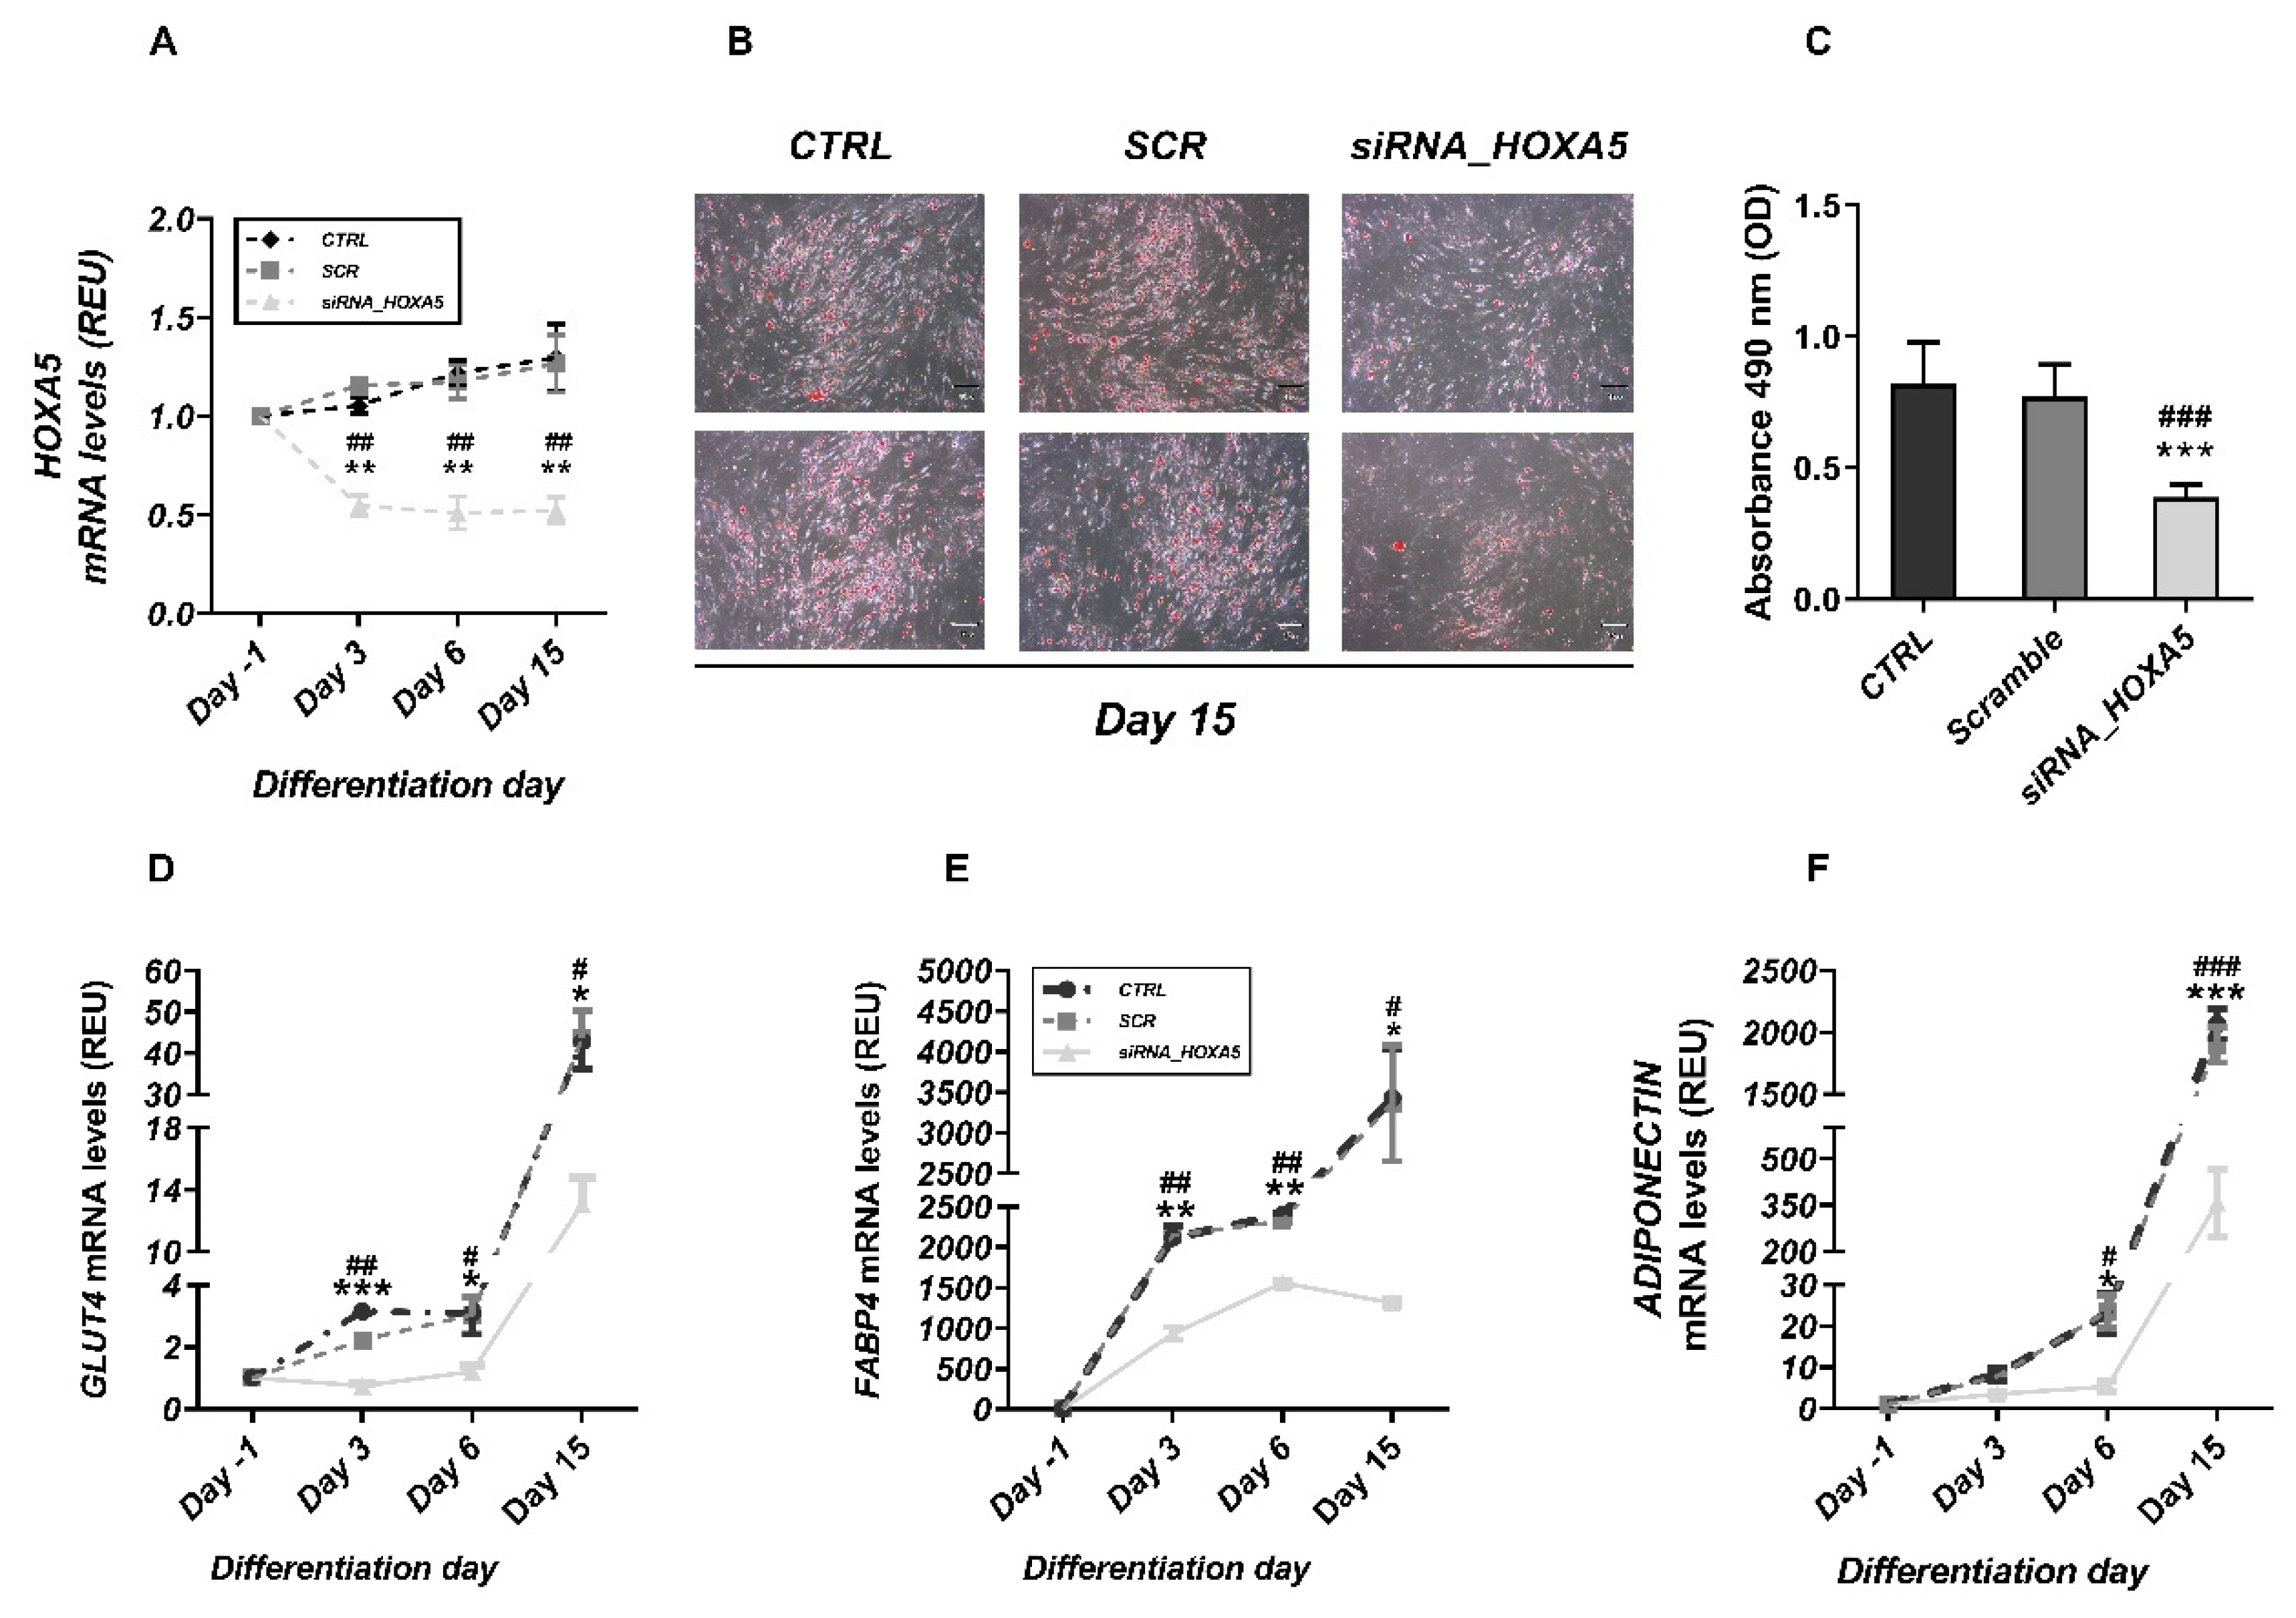
Abstract
:1. Introduction
2. Materials and Methods
2.1. Study Participants
2.1.1. First-Degree Relatives of Type 2 Diabetics
2.1.2. Obese Subjects
2.1.3. Human Preadipocyte Isolation, Culture, and Treatment
2.1.4. Adipogenic Differentiation of Human Preadipocytes
2.1.5. Silencing of HOXA5 in Human Preadipocytes
2.1.6. Total RNA Isolation and Quantitative Real-Time PCR
2.1.7. RT2 Profiler PCR Array
2.1.8. Bisulfite Sequencing
2.1.9. Luciferase Assay
2.1.10. Peripheral Blood Leukocyte Isolation
2.1.11. Western Blot
2.1.12. Statistical Analysis
3. Results
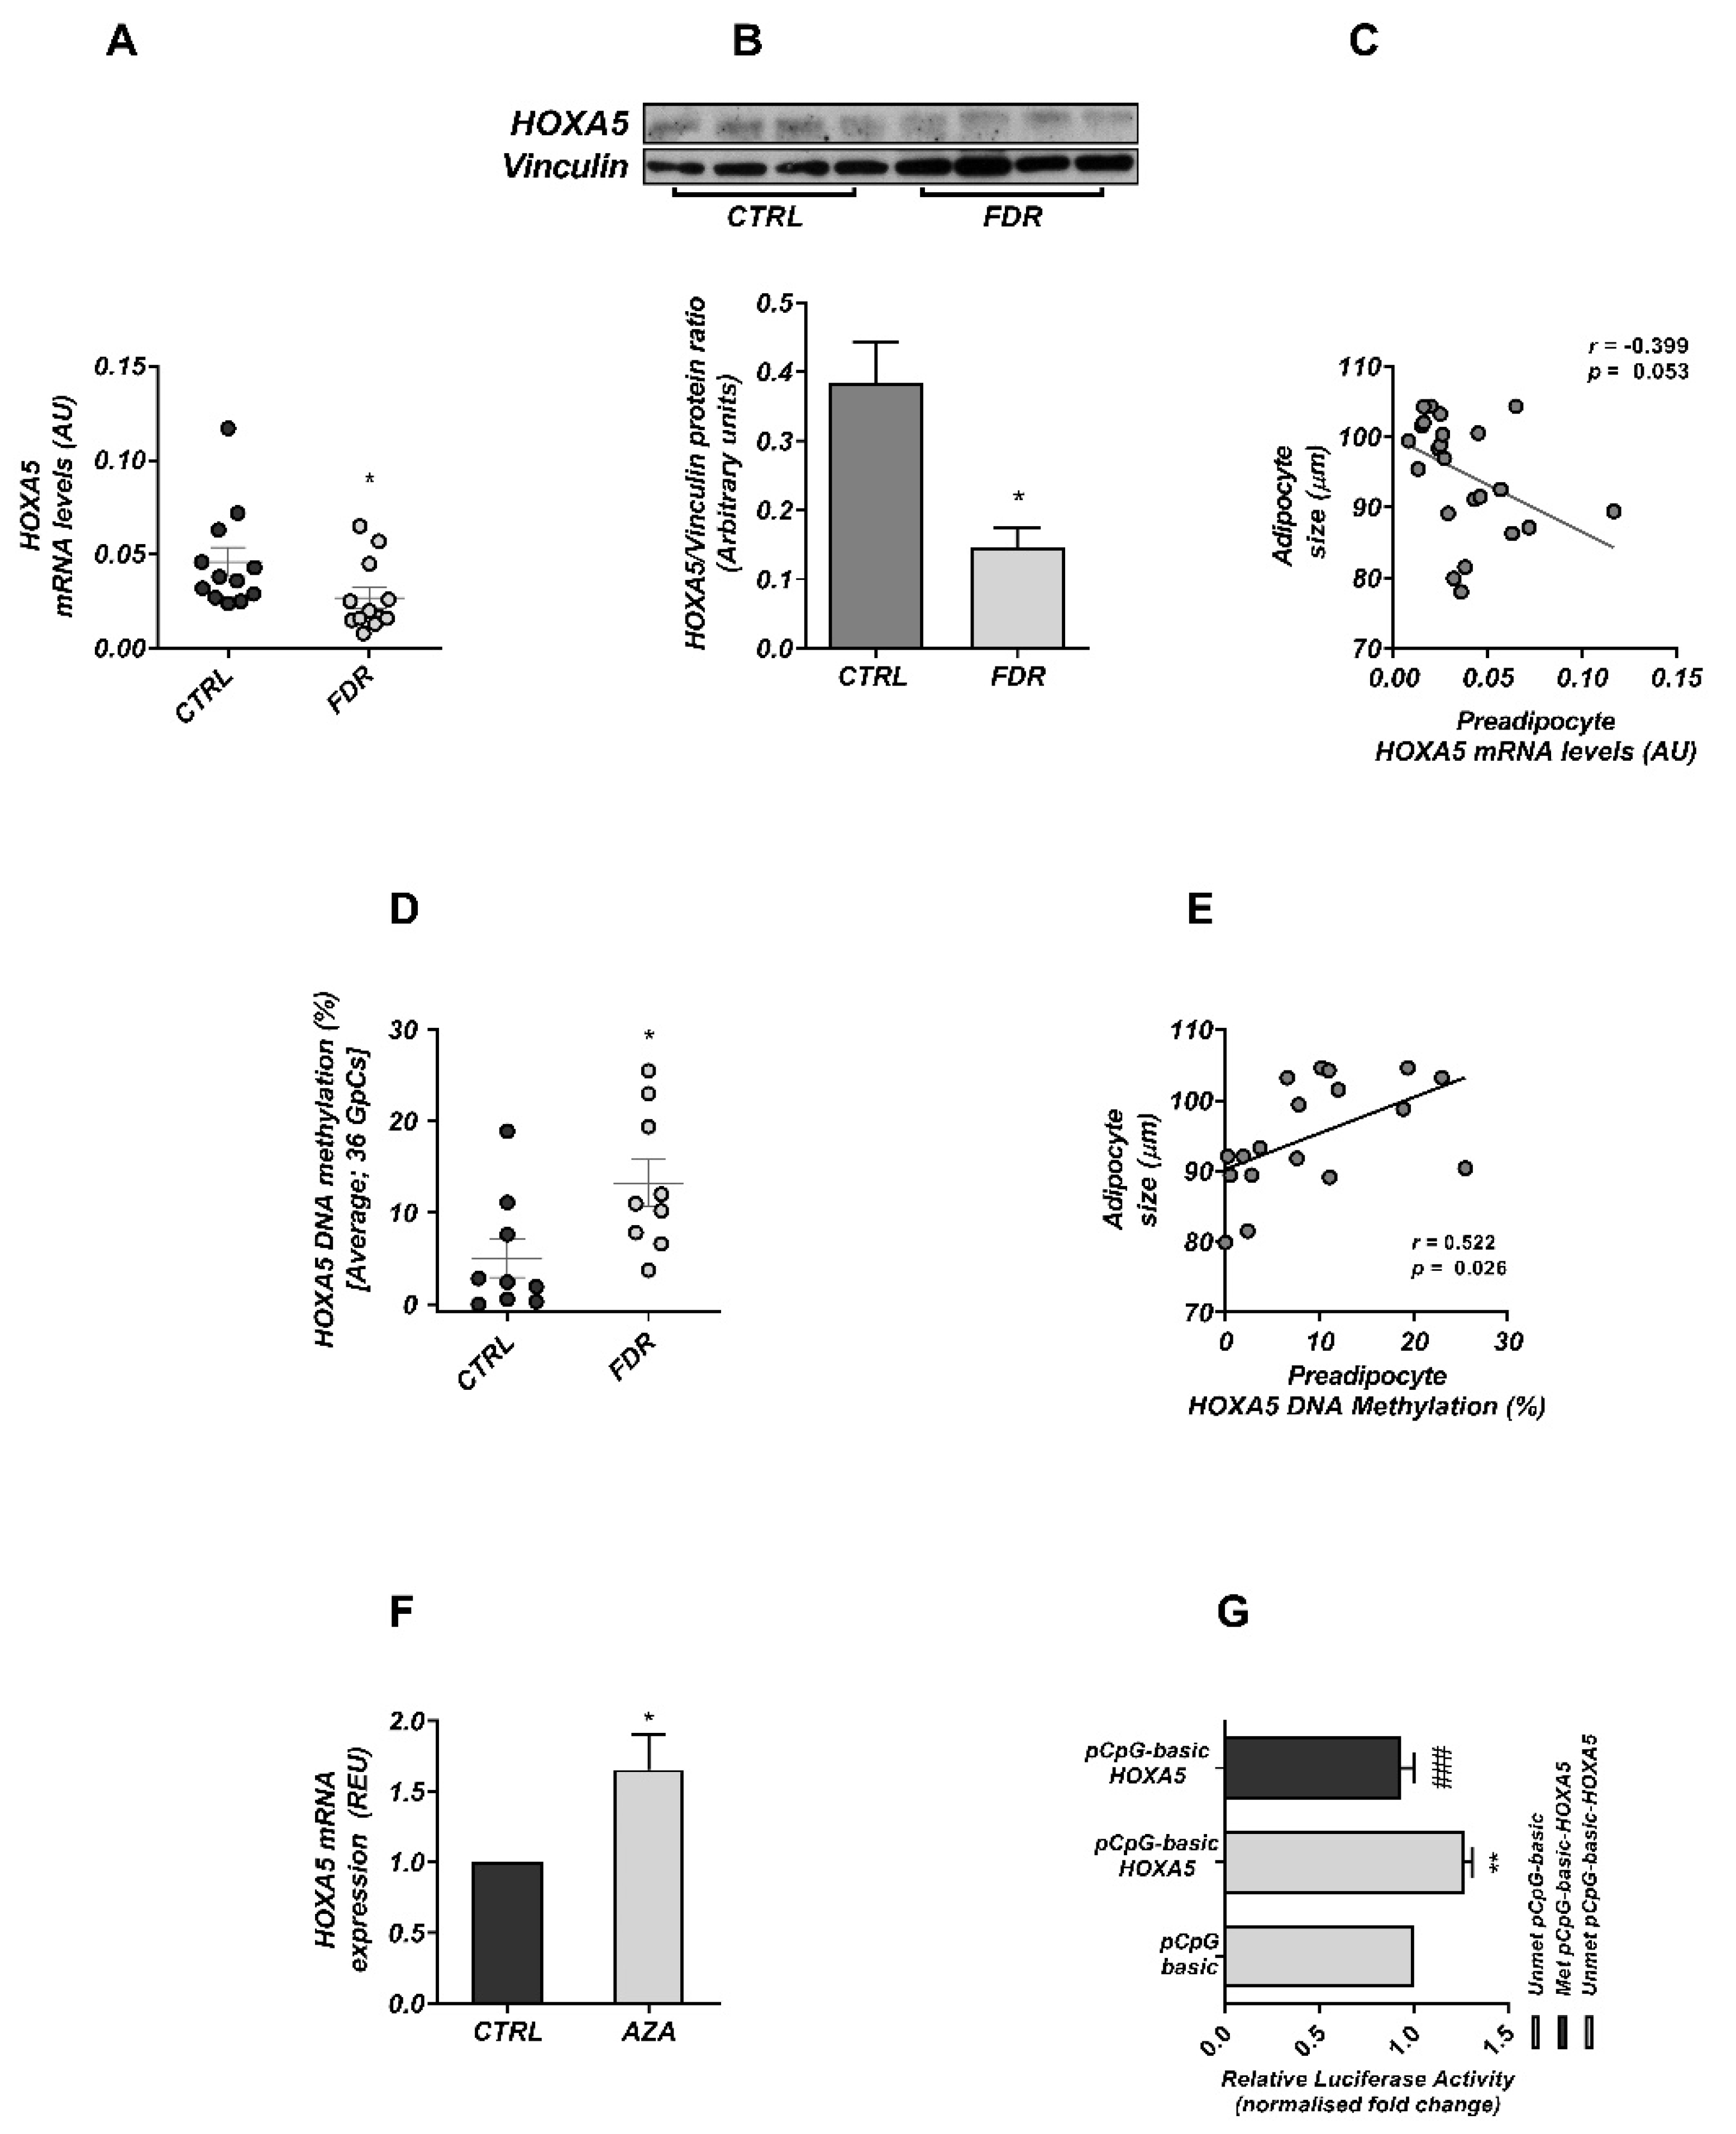
3.1. Altered Epigenetic Regulation of HOXA5 Was Associated with Impaired Adipogenesis in FDR Individuals
3.2. DNA Methylation Modulates HOXA5 Promoter Activity
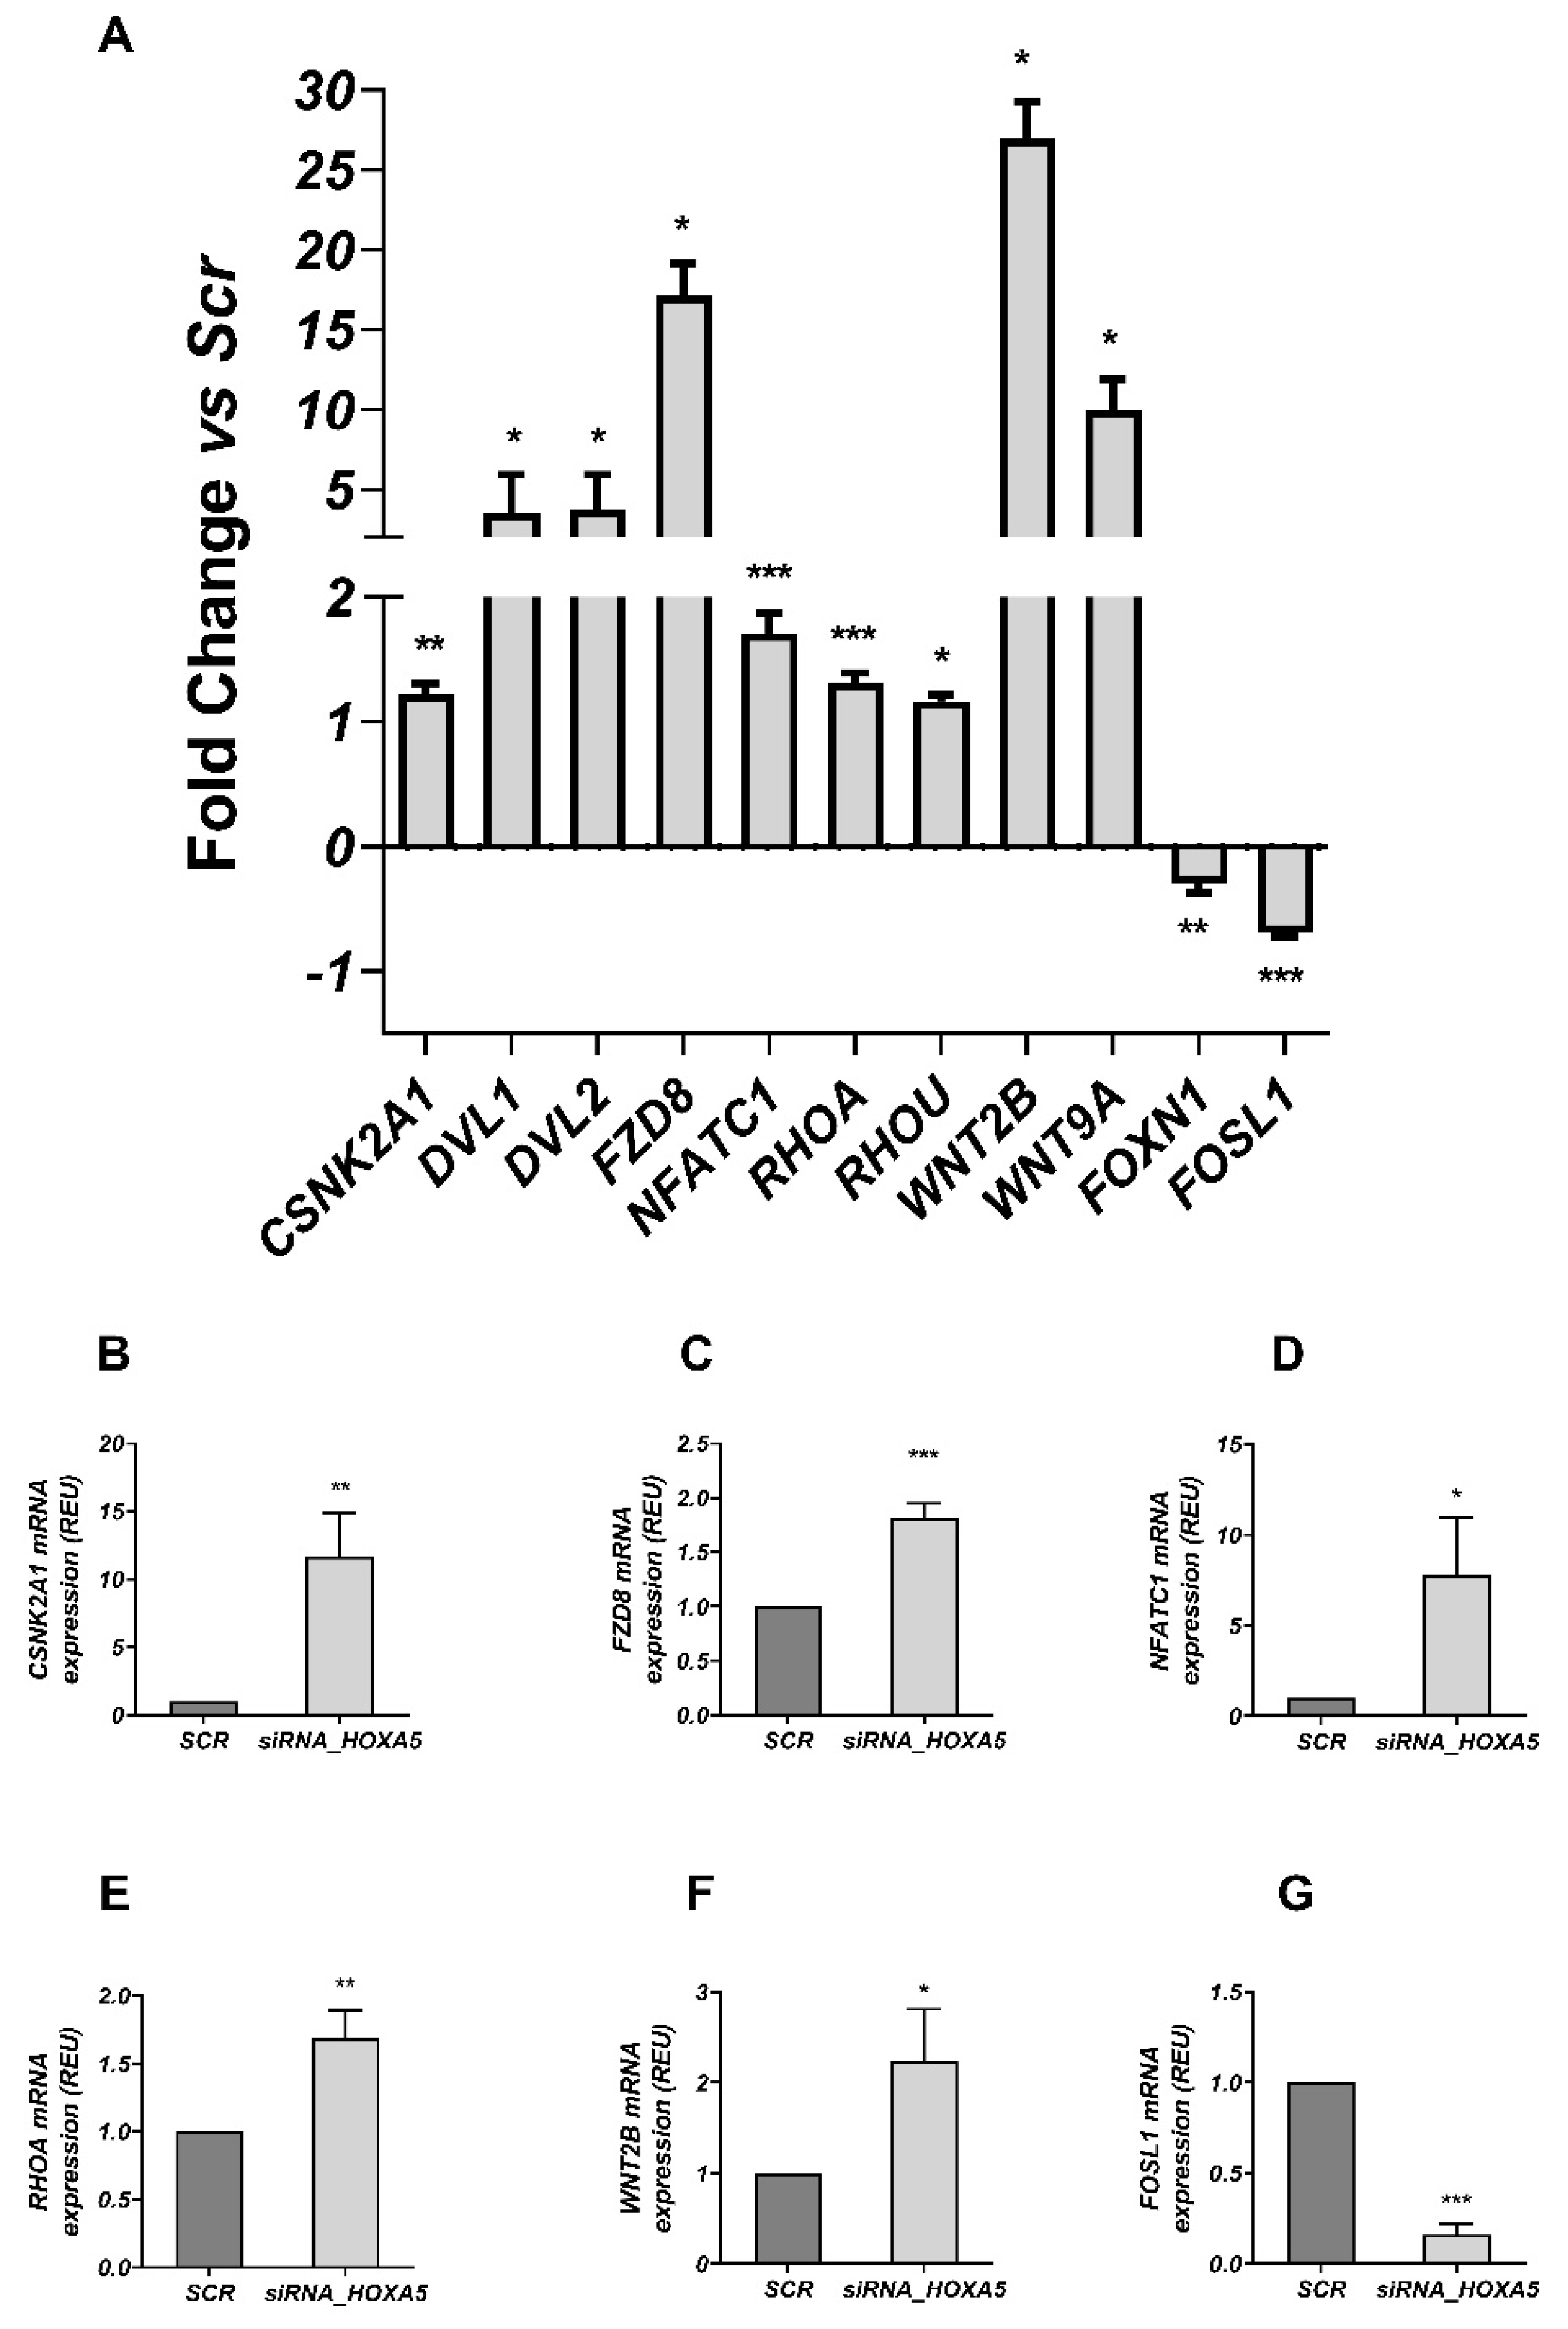
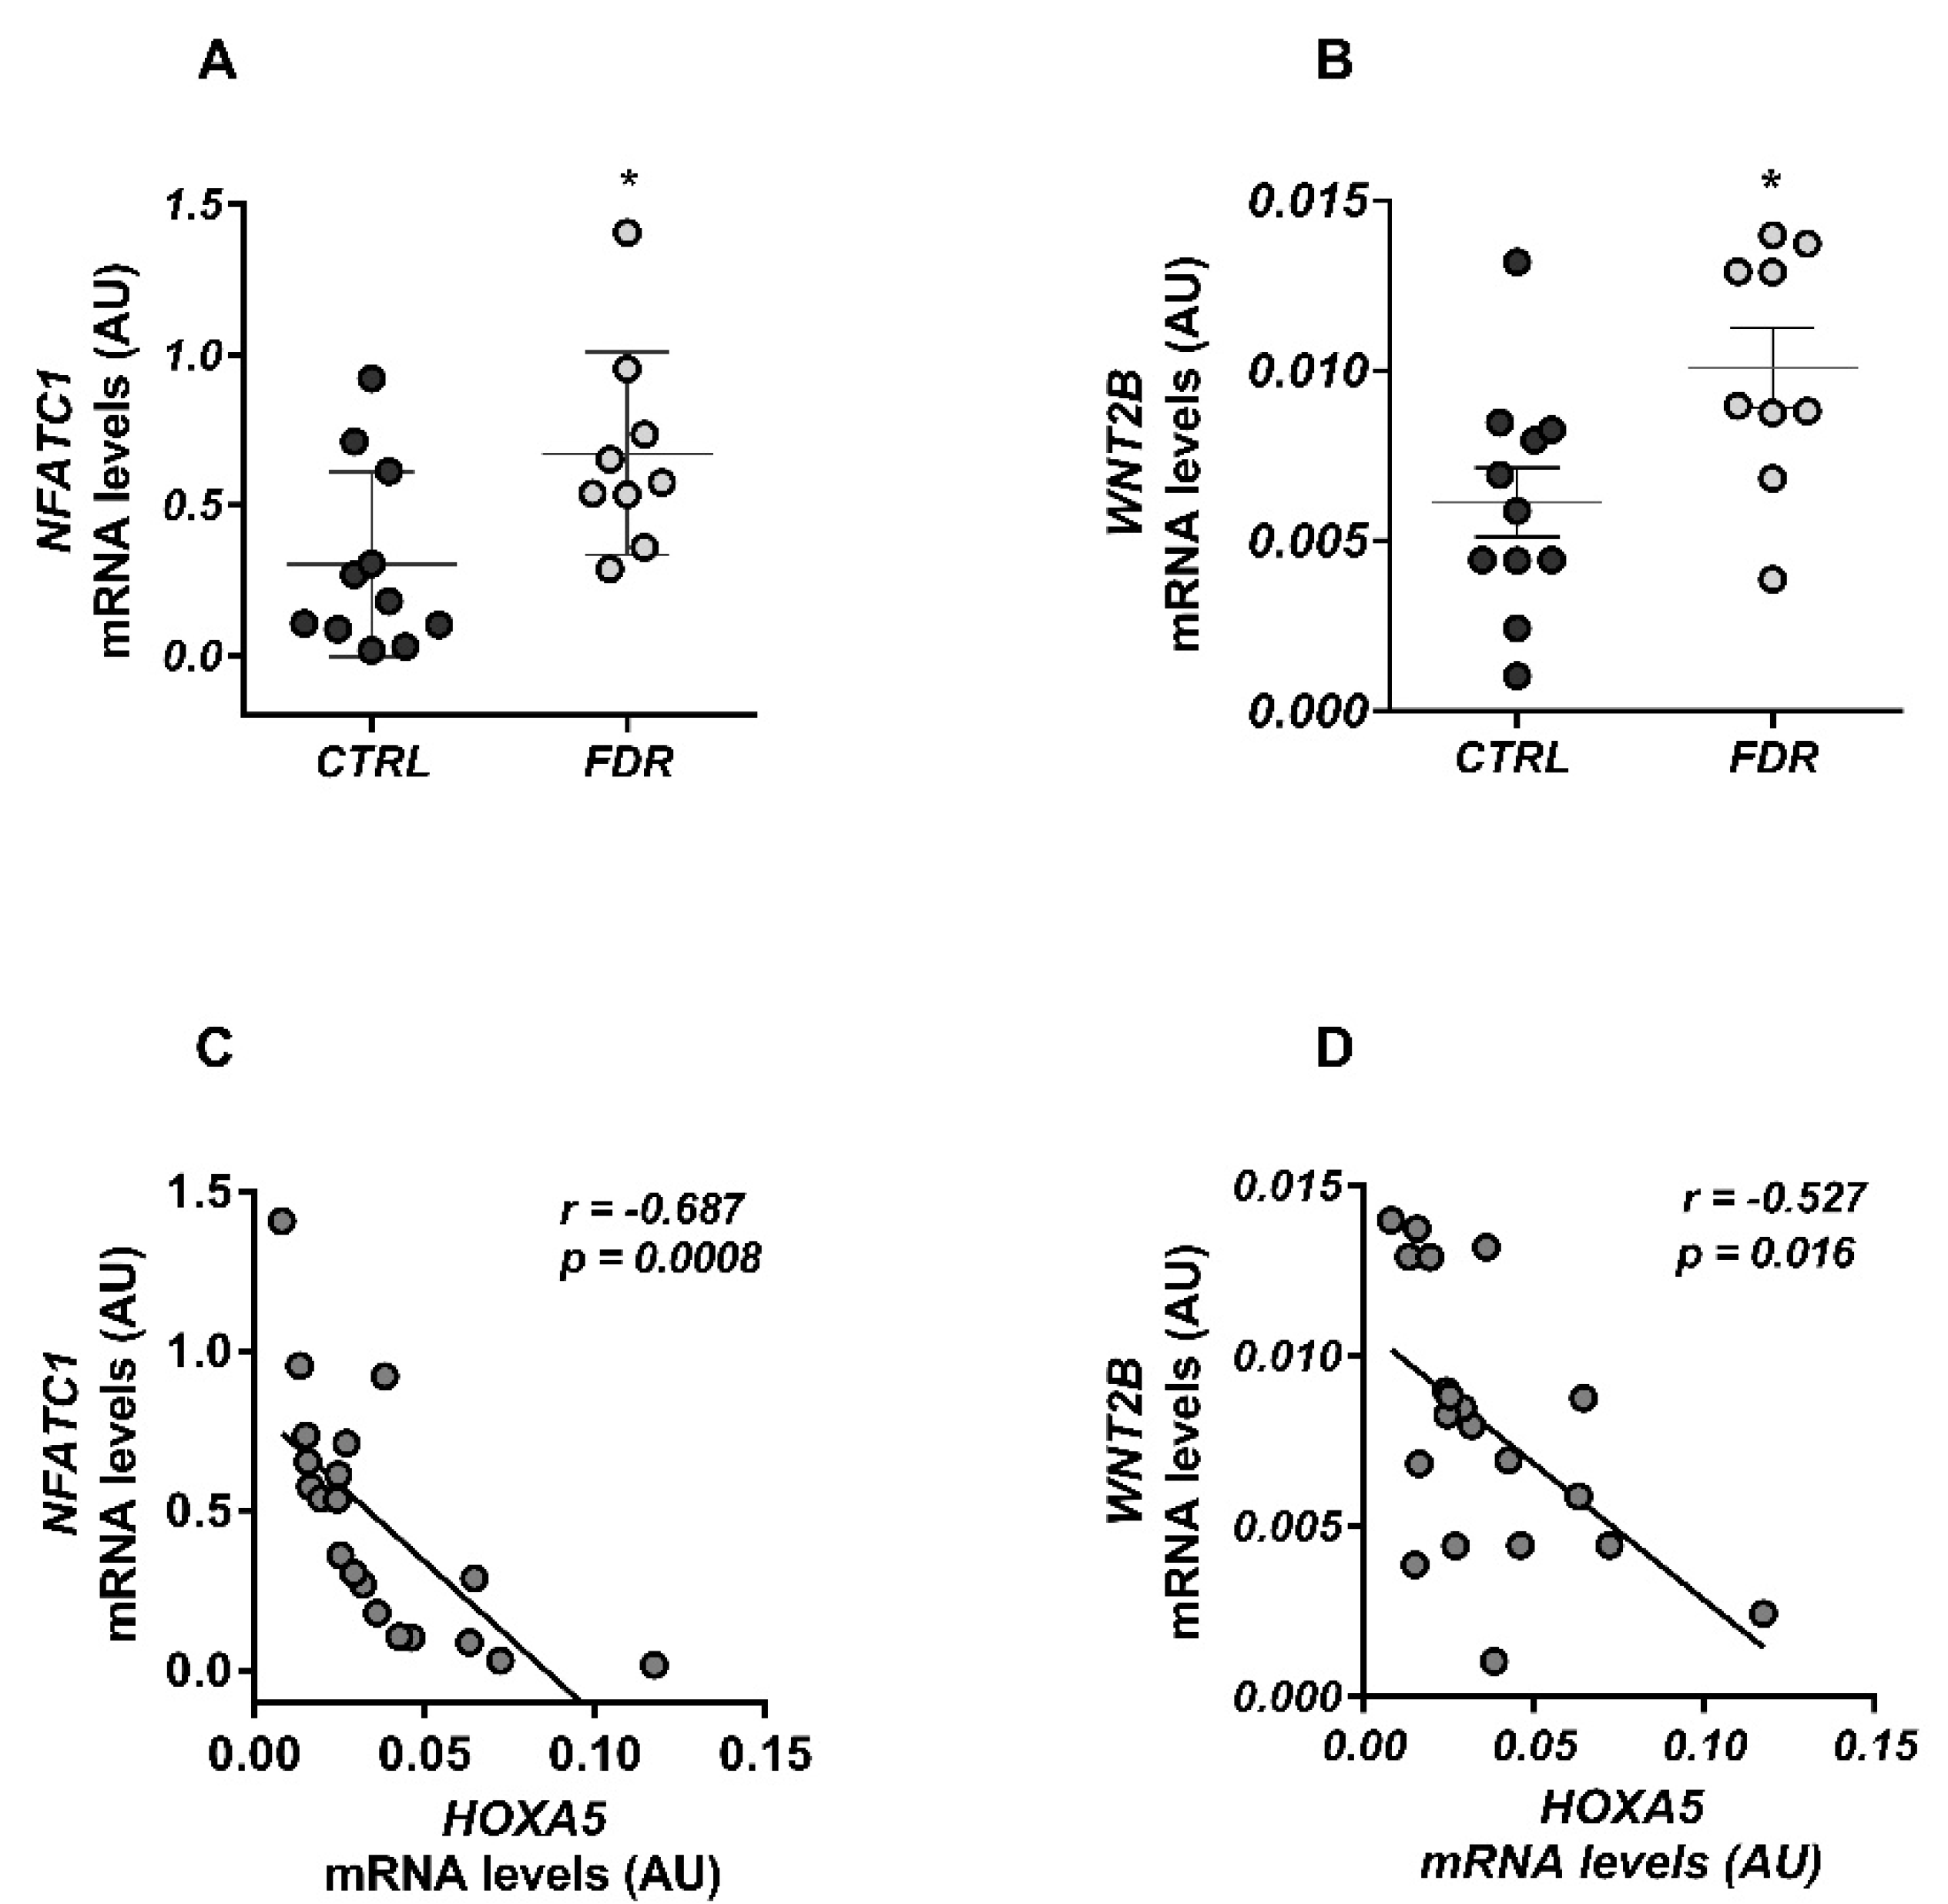
3.3. HOXA5 Promoted Adipocyte Differentiation by Inhibiting the WNT Signaling Pathway
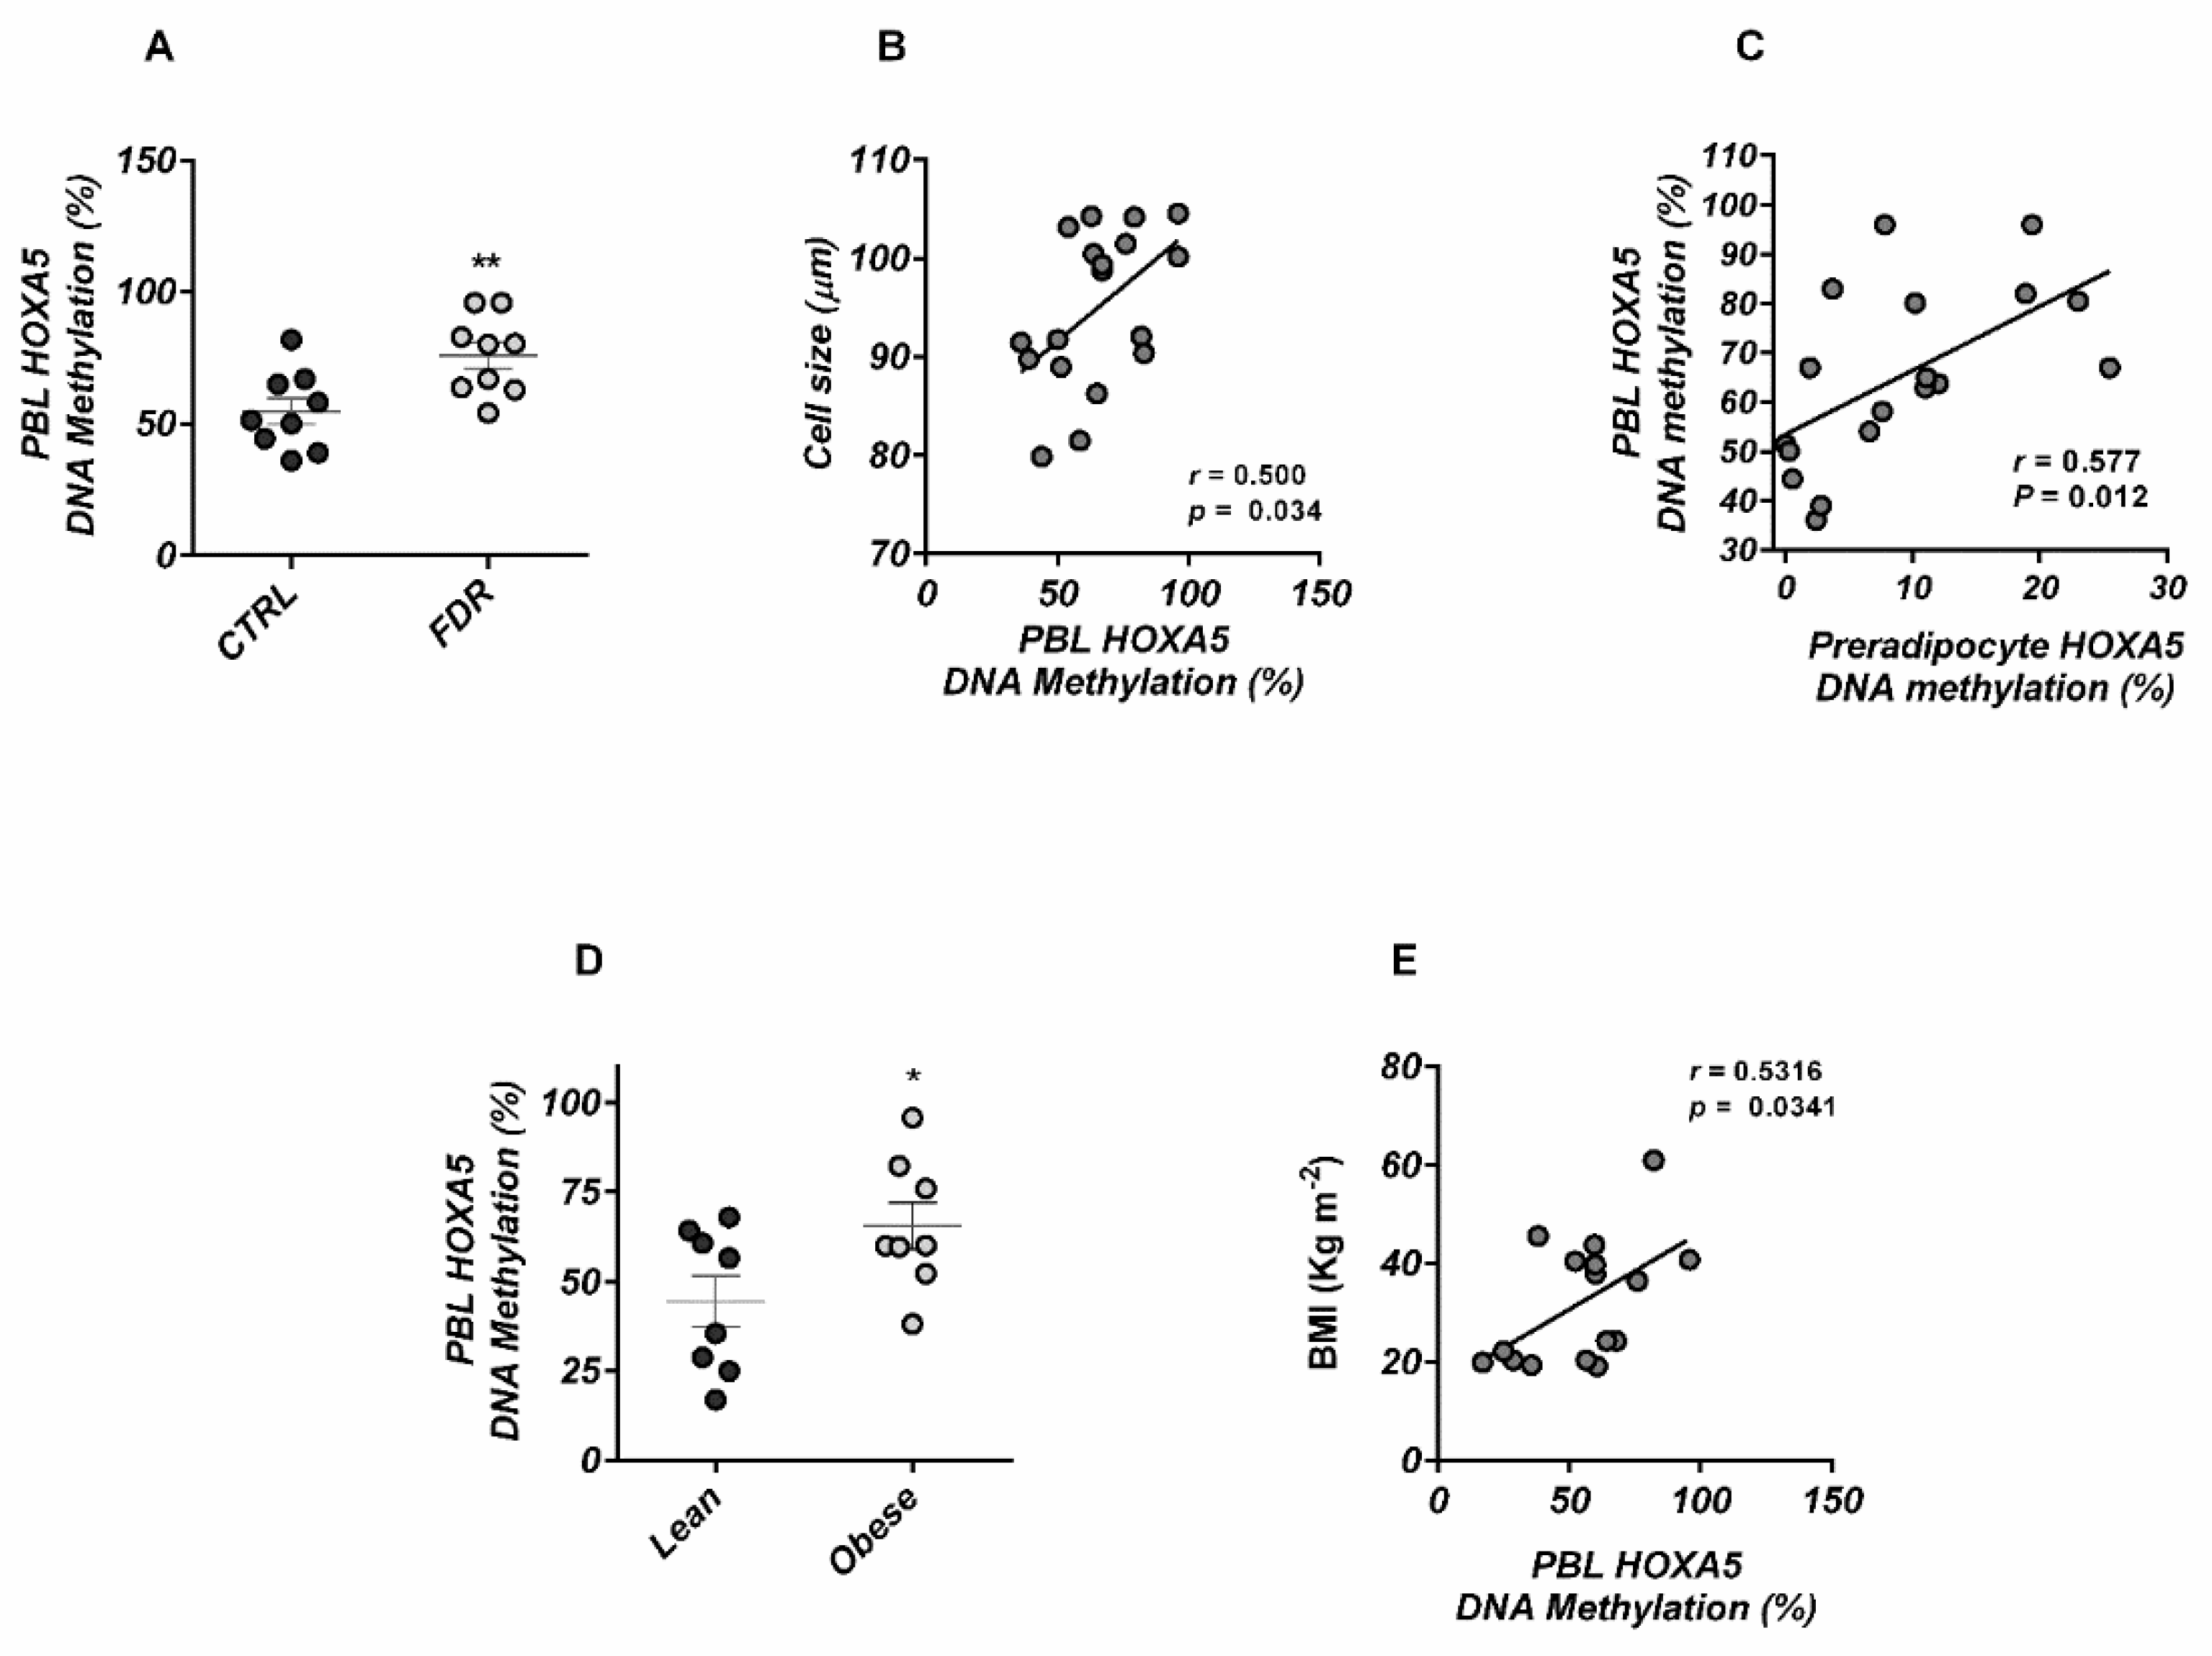
3.4. HOXA5 Methylation Signature in Blood Leukocytes
4. Discussion
Supplementary Materials
Author Contributions
Funding
Institutional Review Board Statement
Informed Consent Statement
Acknowledgments
Conflicts of Interest
References
- Longo, M.; Zatterale, F.; Naderi, J.; Parrillo, L.; Formisano, P.; Raciti, G.A.; Beguinot, F.; Miele, C. Adipose Tissue Dysfunction as Determinant of Obesity-Associated Metabolic Complications. Int. J. Mol. Sci. 2019, 20, 2358. [Google Scholar] [CrossRef] [PubMed] [Green Version]
- Gustafson, B.; Smith, U. Regulation of white adipogenesis and its relation to ectopic fat accumulation and cardiovascular risk. Atherosclerosis 2015, 241, 27–35. [Google Scholar] [CrossRef] [PubMed]
- Arner, P.; Arner, E.; Hammarstedt, A.; Smith, U. Genetic Predisposition for Type 2 Diabetes, but Not for Overweight/Obesity, Is Associated with a Restricted Adipogenesis. PLoS ONE 2011, 6, e18284. [Google Scholar] [CrossRef] [PubMed]
- Mallo, M.; Alonso, C.R. The regulation of Hox gene expression during animal development. Development 2013, 140, 3951–3963. [Google Scholar] [CrossRef] [Green Version]
- Gesta, S.; Blüher, M.; Yamamoto, Y.; Norris, A.; Berndt, J.; Kralisch, S.; Boucher, J.; Lewis, C.; Kahn, C.R. Evidence for a role of developmental genes in the origin of obesity and body fat distribution. Proc. Natl. Acad. Sci. USA 2006, 103, 6676–6681. [Google Scholar] [CrossRef] [Green Version]
- Passaro, A.; Miselli, M.A.; Sanz, J.M.; Nora, E.D.; Morieri, M.L.; Colonna, R.; Pišot, R.; Zuliani, G. Gene expression regional differences in human subcutaneous adipose tissue. BMC Genom. 2017, 18, 202. [Google Scholar] [CrossRef] [Green Version]
- Parrillo, L.; Costa, V.; Raciti, G.A.; Longo, M.; Spinelli, R.; Esposito, R.; Nigro, C.; Vastolo, V.; Desiderio, A.; Zatterale, F.; et al. Hoxa5 undergoes dynamic DNA methylation and transcriptional repression in the adipose tissue of mice exposed to high-fat diet. Int. J. Obes. 2016, 40, 929–937. [Google Scholar] [CrossRef]
- Carless, M.A.; Kulkarni, H.; Kos, M.Z.; Charlesworth, J.; Peralta, J.M.; Göring, H.H.H.; Curran, J.E.; Almasy, L.; Dyer, T.D.; Comuzzie, A.G.; et al. Genetic Effects on DNA Methylation and Its Potential Relevance for Obesity in Mexican Americans. PLoS ONE 2013, 8, e73950. [Google Scholar] [CrossRef] [Green Version]
- Parrillo, L.; Spinelli, R.; Longo, M.; Desiderio, A.; Mirra, P.; Nigro, C.; Fiory, F.; Hedjazifar, S.; Mutarelli, M.; Carissimo, A.; et al. Altered PTPRD DNA methylation associates with restricted adipogenesis in healthy first-degree relatives of Type 2 diabetes subjects. Epigenomics 2020, 12, 873–888. [Google Scholar] [CrossRef]
- Laakso, M.; Zilinskaite, J.; Hansen, T.; Boesgaard, T.W.; Vänttinen, M.; Stančáková, A.; Jansson, P.-A.; Pellmé, F.; Holst, J.J.; Kuulasmaa, T.; et al. Insulin sensitivity, insulin release and glucagon-like peptide-1 levels in persons with impaired fasting glucose and/or impaired glucose tolerance in the EUGENE2 study. Diabetologia 2007, 51, 502–511. [Google Scholar] [CrossRef]
- Desiderio, A.; Longo, M.; Parrillo, L.; Campitelli, M.; Cacace, G.; De Simone, S.; Spinelli, R.; Zatterale, F.; Cabaro, S.; Dolce, P.; et al. Epigenetic silencing of the ANKRD26 gene correlates to the pro-inflammatory profile and increased cardio-metabolic risk factors in human obesity. Clin. Epigenet. 2019, 11, 1–14. [Google Scholar] [CrossRef] [PubMed]
- Spalding, K.L.; Arner, E.; Westermark, P.O.; Bernard, S.; Buchholz, B.A.; Bergmann, O.; Blomqvist, L.; Hoffstedt, J.; Näslund, E.; Britton, T.; et al. Dynamics of fat cell turnover in humans. Nature 2008, 453, 783–787. [Google Scholar] [CrossRef] [PubMed]
- Smith, U.; Sjöström, L.; Björnstorp, P. Comparison of two methods for determining human adipose cell size. J. Lipid Res. 1972, 13, 822–824. [Google Scholar] [CrossRef]
- Isakson, P.; Hammarstedt, A.; Gustafson, B.; Smith, U. Impaired Preadipocyte Differentiation in Human Abdominal Obesity. Diabetes 2009, 58, 1550–1557. [Google Scholar] [CrossRef] [Green Version]
- Mirra, P.; Desiderio, A.; Spinelli, R.; Nigro, C.; Longo, M.; Parrillo, L.; D’Esposito, V.; Carissimo, A.; Hedjazifar, S.; Smith, U.; et al. Adipocyte precursor cells from first degree relatives of type 2 diabetic patients feature changes in hsa-mir-23a-5p, -193a-5p, and -193b-5p and insulin-like growth factor 2 expression. FASEB J. 2021, 35, e21357. [Google Scholar] [CrossRef]
- De Cristofaro, T.; Di Palma, T.; Fichera, I.; Lucci, V.; Parrillo, L.; De Felice, M.; Zannini, M. An Essential Role for Pax8 in the Transcriptional Regulation of Cadherin-16 in Thyroid Cells. Mol. Endocrinol. 2012, 26, 67–78. [Google Scholar] [CrossRef] [Green Version]
- Nigro, C.; Leone, A.; Longo, M.; Prevenzano, I.; Fleming, T.H.; Nicolò, A.; Parrillo, L.; Spinelli, R.; Formisano, P.; Nawroth, P.P.; et al. Methylglyoxal accumulation de-regulates HoxA5 expression, thereby impairing angiogenesis in glyoxalase 1 knock-down mouse aortic endothelial cells. Biochim. Biophys. Acta (BBA) Mol. Basis Dis. 2019, 1865, 73–85. [Google Scholar] [CrossRef]
- Raciti, G.A.; Spinelli, R.; Desiderio, A.; Longo, M.; Parrillo, L.; Nigro, C.; D’Esposito, V.; Mirra, P.; Fiory, F.; Pilone, V.; et al. Specific CpG hyper-methylation leads to Ankrd26 gene down-regulation in white adipose tissue of a mouse model of diet-induced obesity. Sci. Rep. 2017, 7, srep43526. [Google Scholar] [CrossRef]
- Tong, Q.; Dalgin, G.; Xu, H.; Ting, C.-N.; Leiden, J.M.; Hotamisligil, G.S. Function of GATA Transcription Factors in Preadipocyte-Adipocyte Transition. Science 2000, 290, 134–138. [Google Scholar] [CrossRef] [Green Version]
- Strathdee, G.; Sim, A.; Soutar, R.; Holyoake, T.L.; Brown, R. HOXA5 is targeted by cell-type-specific CpG island methylation in normal cells and during the development of acute myeloid leukaemia. Carcinogenesis 2007, 28, 299–309. [Google Scholar] [CrossRef]
- Longo, M.; Raciti, G.A.; Zatterale, F.; Parrillo, L.; Desiderio, A.; Spinelli, R.; Hammarstedt, A.; Hedjazifar, S.; Hoffmann, J.M.; Nigro, C.; et al. Epigenetic modifications of the Zfp/ZNF423 gene control murine adipogenic commitment and are dysregulated in human hypertrophic obesity. Diabetologia 2018, 61, 369–380. [Google Scholar] [CrossRef] [PubMed] [Green Version]
- Ordóñez-Morán, P.; Dafflon, C.; Imajo, M.; Nishida, E.; Huelsken, J. HOXA5 Counteracts Stem Cell Traits by Inhibiting Wnt Signaling in Colorectal Cancer. Cancer Cell 2015, 28, 815–829. [Google Scholar] [CrossRef] [PubMed] [Green Version]
- Ma, H.-M.; Cui, N.; Zheng, P.-S. HOXA5 inhibits the proliferation and neoplasia of cervical cancer cells via downregulating the activity of the Wnt/β-catenin pathway and transactivating TP53. Cell Death Dis. 2020, 11, 420. [Google Scholar] [CrossRef] [PubMed]
- Henninger, A.M.J.; Eliasson, B.; Jenndahl, L.E.; Hammarstedt, A. Adipocyte Hypertrophy, Inflammation and Fibrosis Characterize Subcutaneous Adipose Tissue of Healthy, Non-Obese Subjects Predisposed to Type 2 Diabetes. PLoS ONE 2014, 9, e105262. [Google Scholar] [CrossRef]
- Parrillo, L.; Spinelli, R.; Nicolò, A.; Longo, M.; Mirra, P.; Raciti, G.A.; Miele, C.; Beguinot, F. Nutritional Factors, DNA Methylation, and Risk of Type 2 Diabetes and Obesity: Perspectives and Challenges. Int. J. Mol. Sci. 2019, 20, 2983. [Google Scholar] [CrossRef] [Green Version]
- Laakso, M. Biomarkers for type 2 diabetes. Mol. Metab. 2019, 27, S139–S146. [Google Scholar] [CrossRef]
- Spinelli, R.; Parrillo, L.; Longo, M.; Florese, P.; Desiderio, A.; Zatterale, F.; Miele, C.; Raciti, G.A.; Beguinot, F. Molecular basis of ageing in chronic metabolic diseases. J. Endocrinol. Investig. 2020, 43, 1373–1389. [Google Scholar] [CrossRef]
- Kumar, V.; Sekar, M.; Sarkar, P.; Acharya, K.K.; Thirumurugan, K. Dynamics of HOX gene expression and regulation in adipocyte development. Gene 2021, 768, 145308. [Google Scholar] [CrossRef]
- Gustafson, B.; Nerstedt, A.; Smith, U. Reduced subcutaneous adipogenesis in human hypertrophic obesity is linked to senescent precursor cells. Nat. Commun. 2019, 10, 1–9. [Google Scholar] [CrossRef]
- Raman, V.; Martensen, S.A.; Reisman, D.; Evron, E.; Odenwald, W.F.; Jaffee, E.; Marks, J.R.; Sukumar, S. Compromised HOXA5 function can limit p53 expression in human breast tumours. Nature 2000, 405, 974–978. [Google Scholar] [CrossRef]
- Shiraishi, M.; Sekiguchi, A.; Oates, A.J.; Terry, M.J.; Miyamoto, Y. HOX gene clusters are hotspots of de novo methylation in CpG islands of human lung adenocarcinomas. Oncogene 2002, 21, 3659–3662. [Google Scholar] [CrossRef] [Green Version]
- Hammarstedt, A.; Hedjazifar, S.; Jenndahl, L.; Gogg, S.; Grünberg, J.; Gustafson, B.; Klimcakova, E.; Stich, V.; Langin, D.; Laakso, M.; et al. WISP2 regulates preadipocyte commitment and PPAR activation by BMP4. Proc. Natl. Acad. Sci. USA 2013, 110, 2563–2568. [Google Scholar] [CrossRef] [Green Version]
- Koga, T.; Matsui, Y.; Asagiri, M.; Kodama, T.; De Crombrugghe, B.; Nakashima, K.; Takayanagi, H. NFAT and Osterix cooperatively regulate bone formation. Nat. Med. 2005, 11, 880–885. [Google Scholar] [CrossRef]
- Jia, B.; Wang, Z.; Sun, X.; Chen, J.; Zhao, J.; Qiu, X. Long noncoding RNA LINC00707 sponges miR-370-3p to promote osteogenesis of human bone marrow-derived mesenchymal stem cells through upregulating WNT2B. Stem Cell Res. Ther. 2019, 10, 1–14. [Google Scholar] [CrossRef] [Green Version]
- Han, Y.; Kim, C.Y.; Cheong, H.; Lee, K.Y. Osterix represses adipogenesis by negatively regulating PPARγ transcriptional activity. Sci. Rep. 2016, 6, 35655. [Google Scholar] [CrossRef] [Green Version]
- Zhang, Y.-Y.; Li, X.; Qian, S.-W.; Guo, L.; Huang, H.-Y.; He, Q.; Liu, Y.; Ma, C.-G.; Tang, Q.-Q. Down-Regulation of Type I Runx2 Mediated by Dexamethasone Is Required for 3T3-L1 Adipogenesis. Mol. Endocrinol. 2012, 26, 798–808. [Google Scholar] [CrossRef] [Green Version]
- Raciti, G.A.; Nigro, C.; Longo, M.; Parrillo, L.; Miele, C.; Formisano, P.; Béguinot, F. Personalized medicine and Type 2 diabetes: Lesson from epigenetics. Epigenomics 2014, 6, 229–238. [Google Scholar] [CrossRef]
- Willmer, T.; Johnson, R.; Louw, J.; Pheiffer, C. Blood-Based DNA Methylation Biomarkers for Type 2 Diabetes: Potential for Clinical Applications. Front. Endocrinol. 2018, 9, 744. [Google Scholar] [CrossRef]


Publisher’s Note: MDPI stays neutral with regard to jurisdictional claims in published maps and institutional affiliations. |
© 2022 by the authors. Licensee MDPI, Basel, Switzerland. This article is an open access article distributed under the terms and conditions of the Creative Commons Attribution (CC BY) license (https://creativecommons.org/licenses/by/4.0/).
Share and Cite
Parrillo, L.; Spinelli, R.; Costanzo, M.; Florese, P.; Cabaro, S.; Desiderio, A.; Prevenzano, I.; Raciti, G.A.; Smith, U.; Miele, C.; et al. Epigenetic Dysregulation of the Homeobox A5 (HOXA5) Gene Associates with Subcutaneous Adipocyte Hypertrophy in Human Obesity. Cells 2022, 11, 728. https://0-doi-org.brum.beds.ac.uk/10.3390/cells11040728
Parrillo L, Spinelli R, Costanzo M, Florese P, Cabaro S, Desiderio A, Prevenzano I, Raciti GA, Smith U, Miele C, et al. Epigenetic Dysregulation of the Homeobox A5 (HOXA5) Gene Associates with Subcutaneous Adipocyte Hypertrophy in Human Obesity. Cells. 2022; 11(4):728. https://0-doi-org.brum.beds.ac.uk/10.3390/cells11040728
Chicago/Turabian StyleParrillo, Luca, Rosa Spinelli, Mattia Costanzo, Pasqualina Florese, Serena Cabaro, Antonella Desiderio, Immacolata Prevenzano, Gregory Alexander Raciti, Ulf Smith, Claudia Miele, and et al. 2022. "Epigenetic Dysregulation of the Homeobox A5 (HOXA5) Gene Associates with Subcutaneous Adipocyte Hypertrophy in Human Obesity" Cells 11, no. 4: 728. https://0-doi-org.brum.beds.ac.uk/10.3390/cells11040728