Ethanol eDNA Reveals Unique Community Composition of Aquatic Macroinvertebrates Compared to Bulk Tissue Metabarcoding in a Biomonitoring Sampling Scheme


Abstract
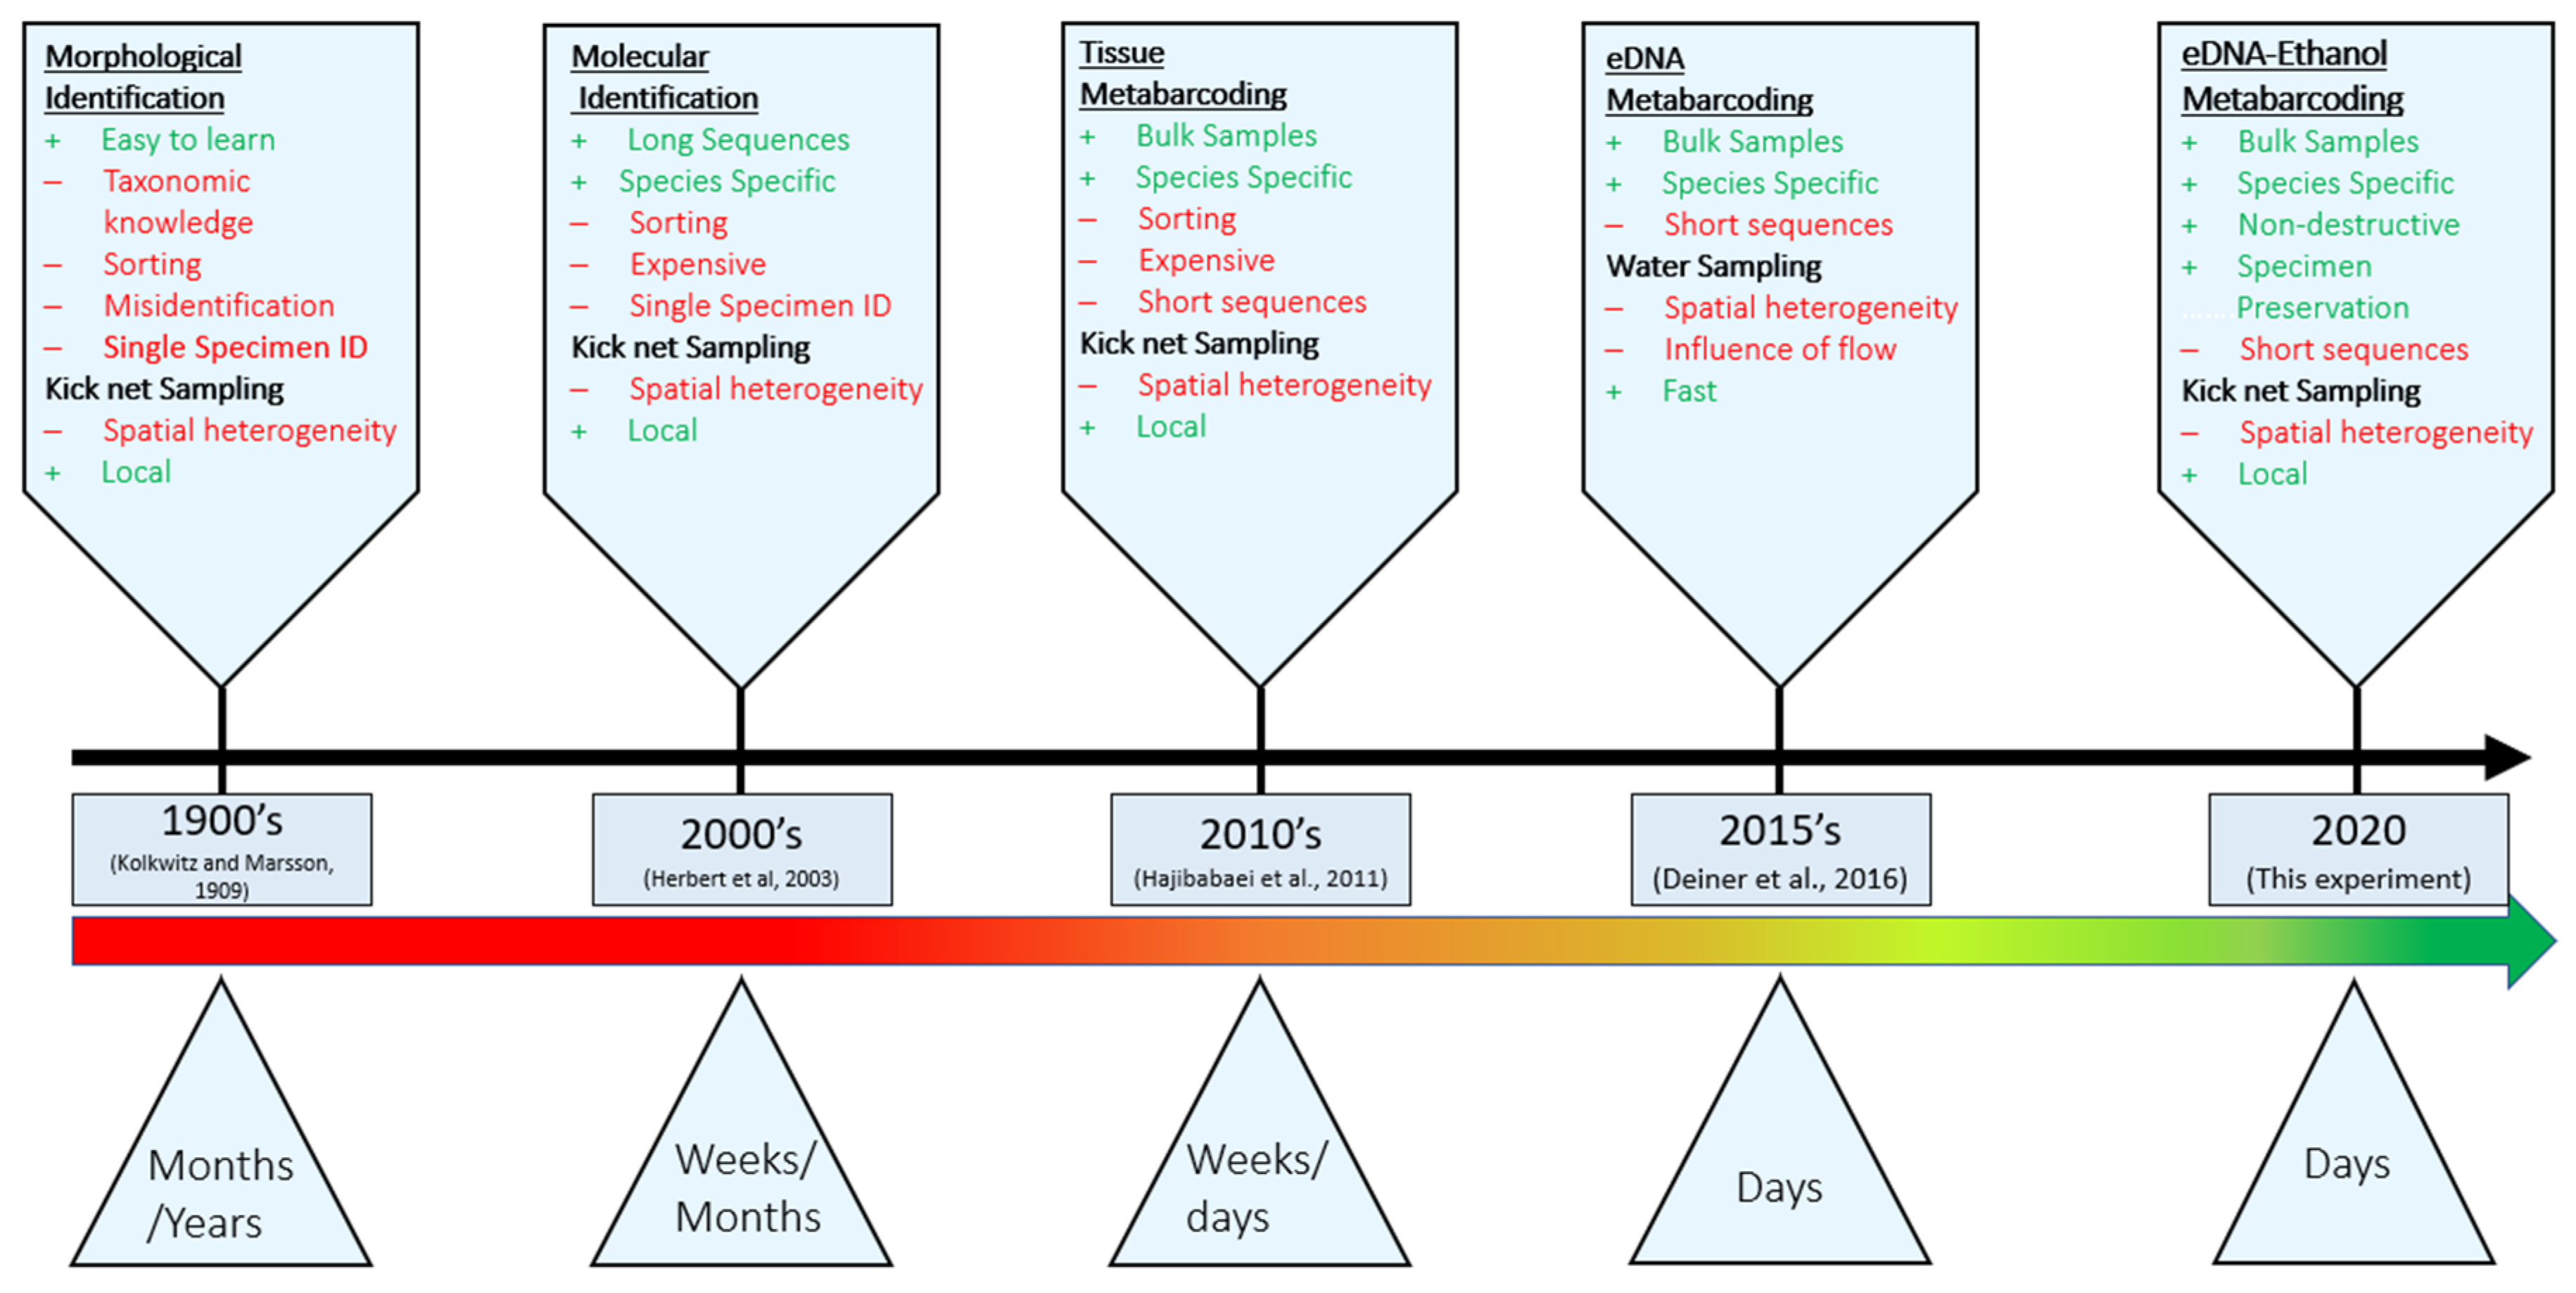
:1. Introduction
2. Materials and Methods
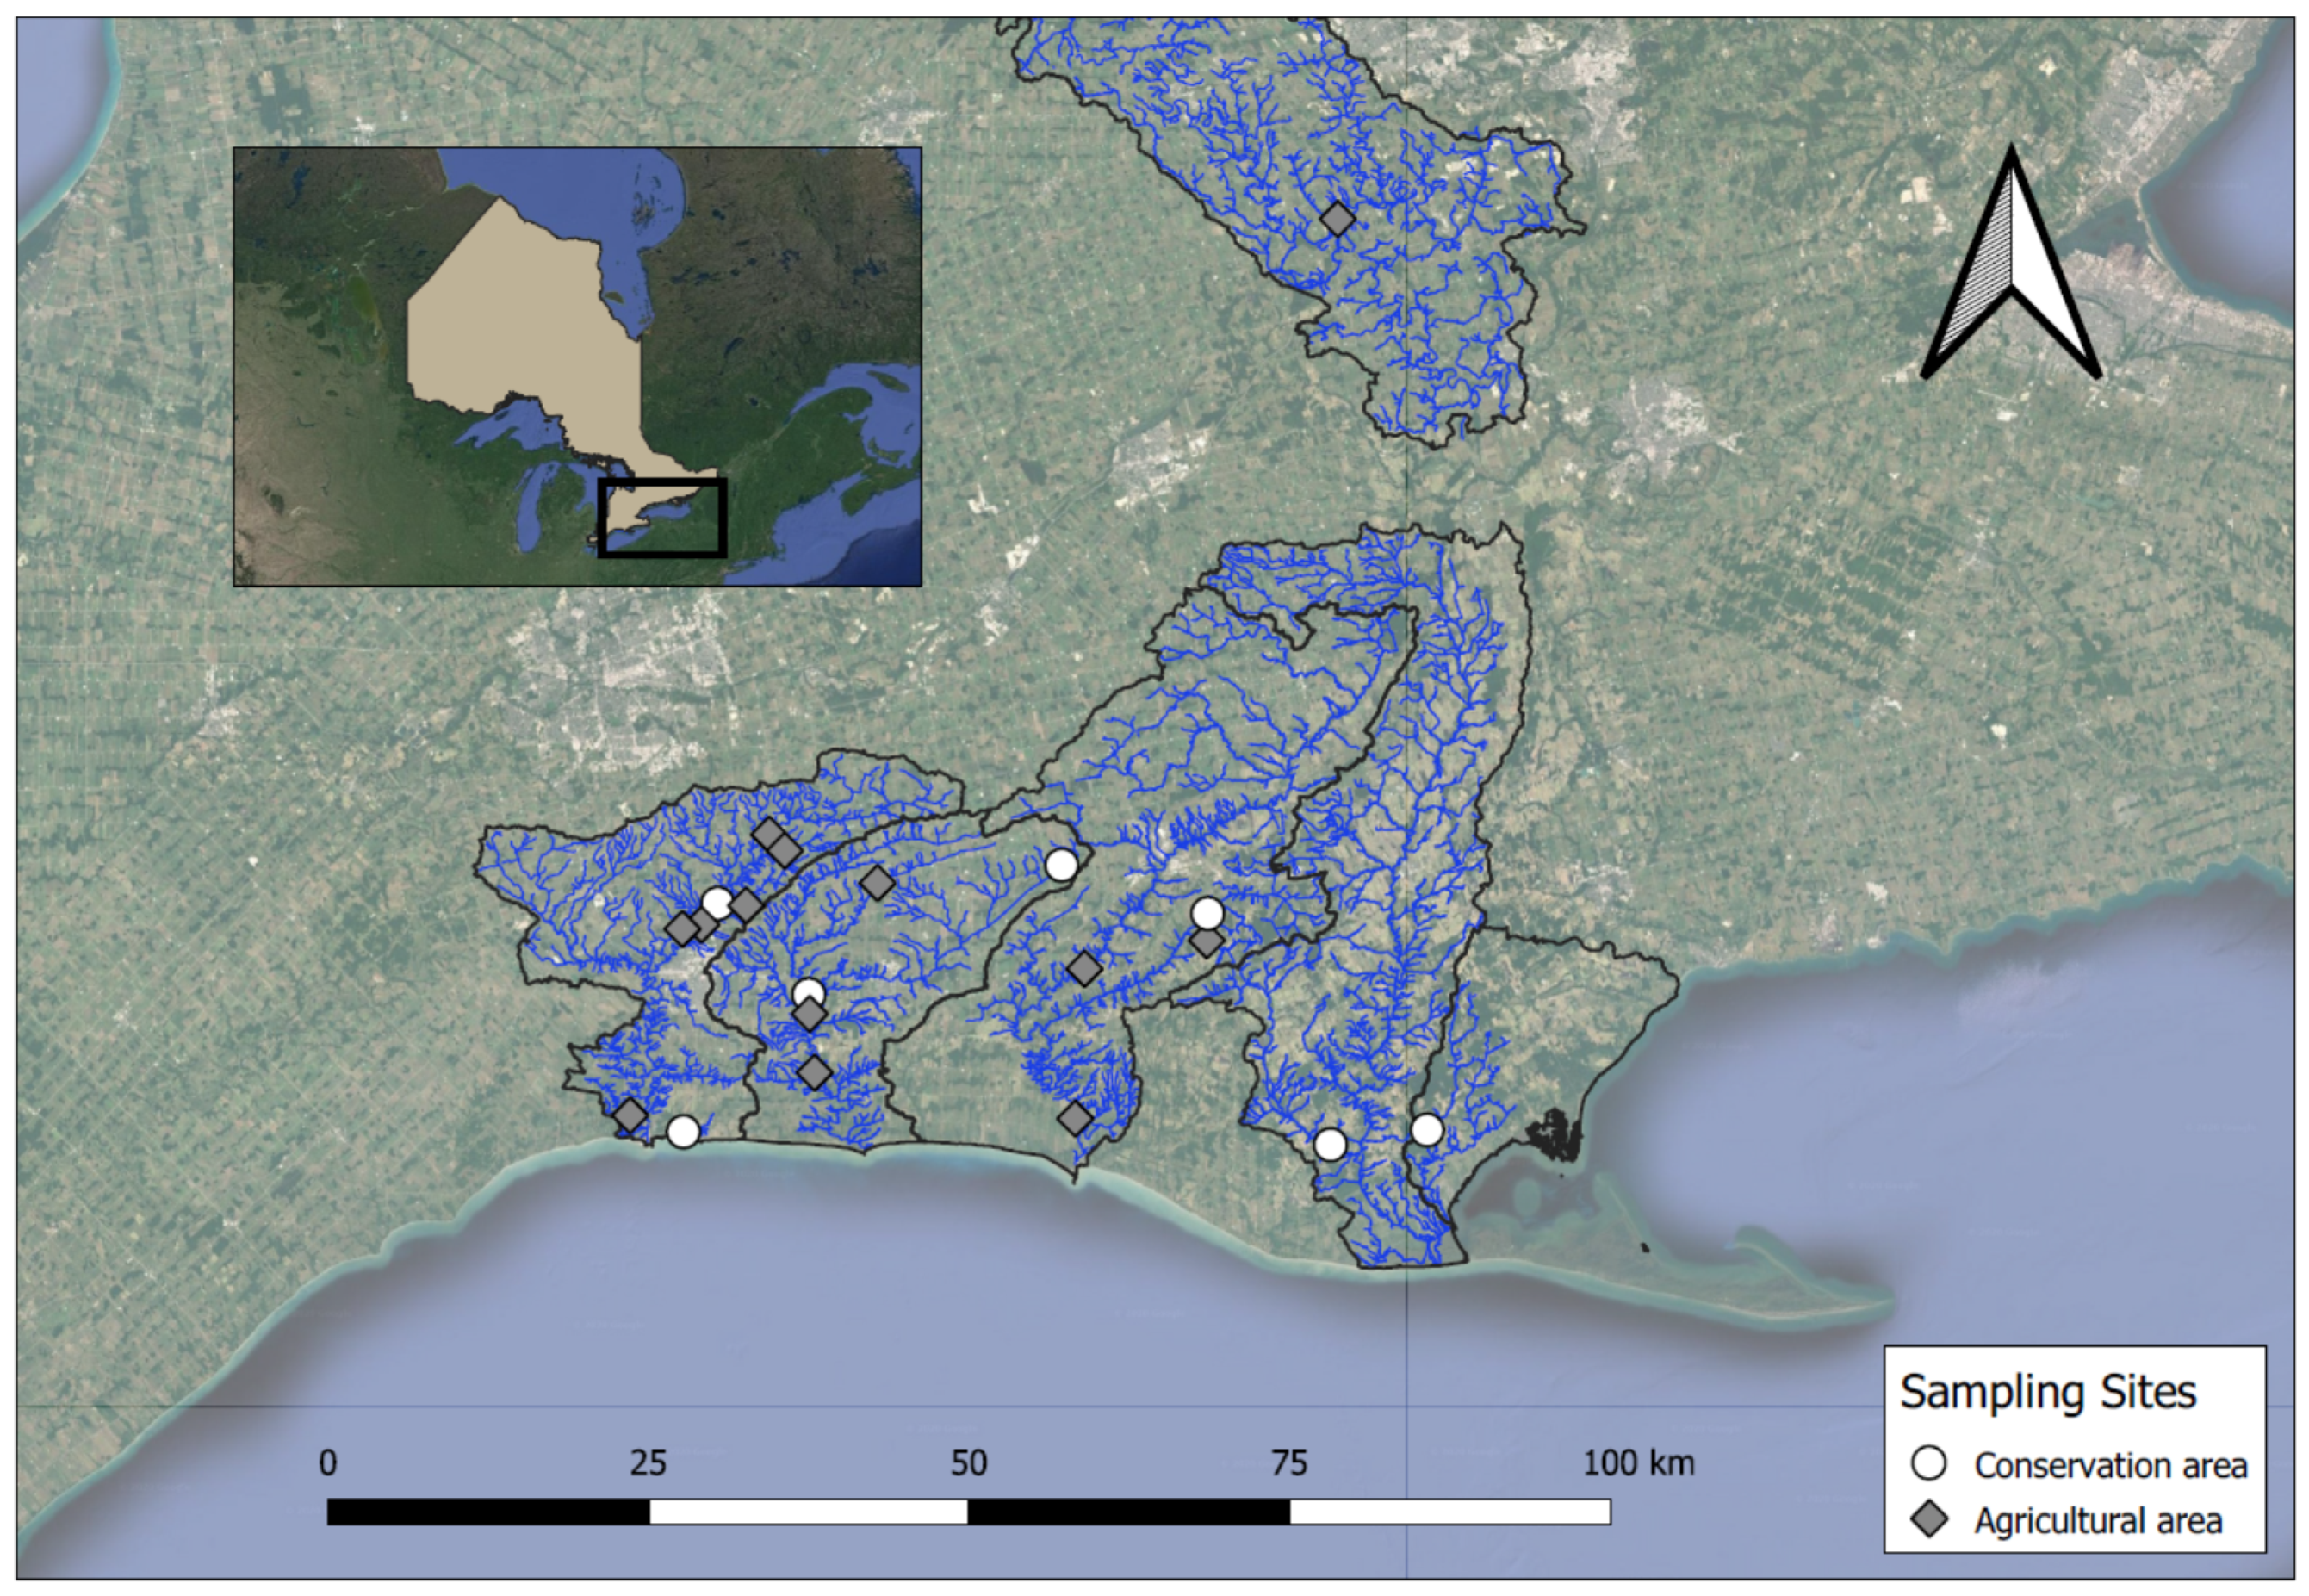
2.1. Stream Sampling
2.2. Benthic Sorting and Bulk Tissue DNA Extraction
2.3. eDNA Filtration and Extraction
2.4. PCR Amplification and Sequencing
2.5. Bioinformatics
2.6. Statistical Analysis
3. Results
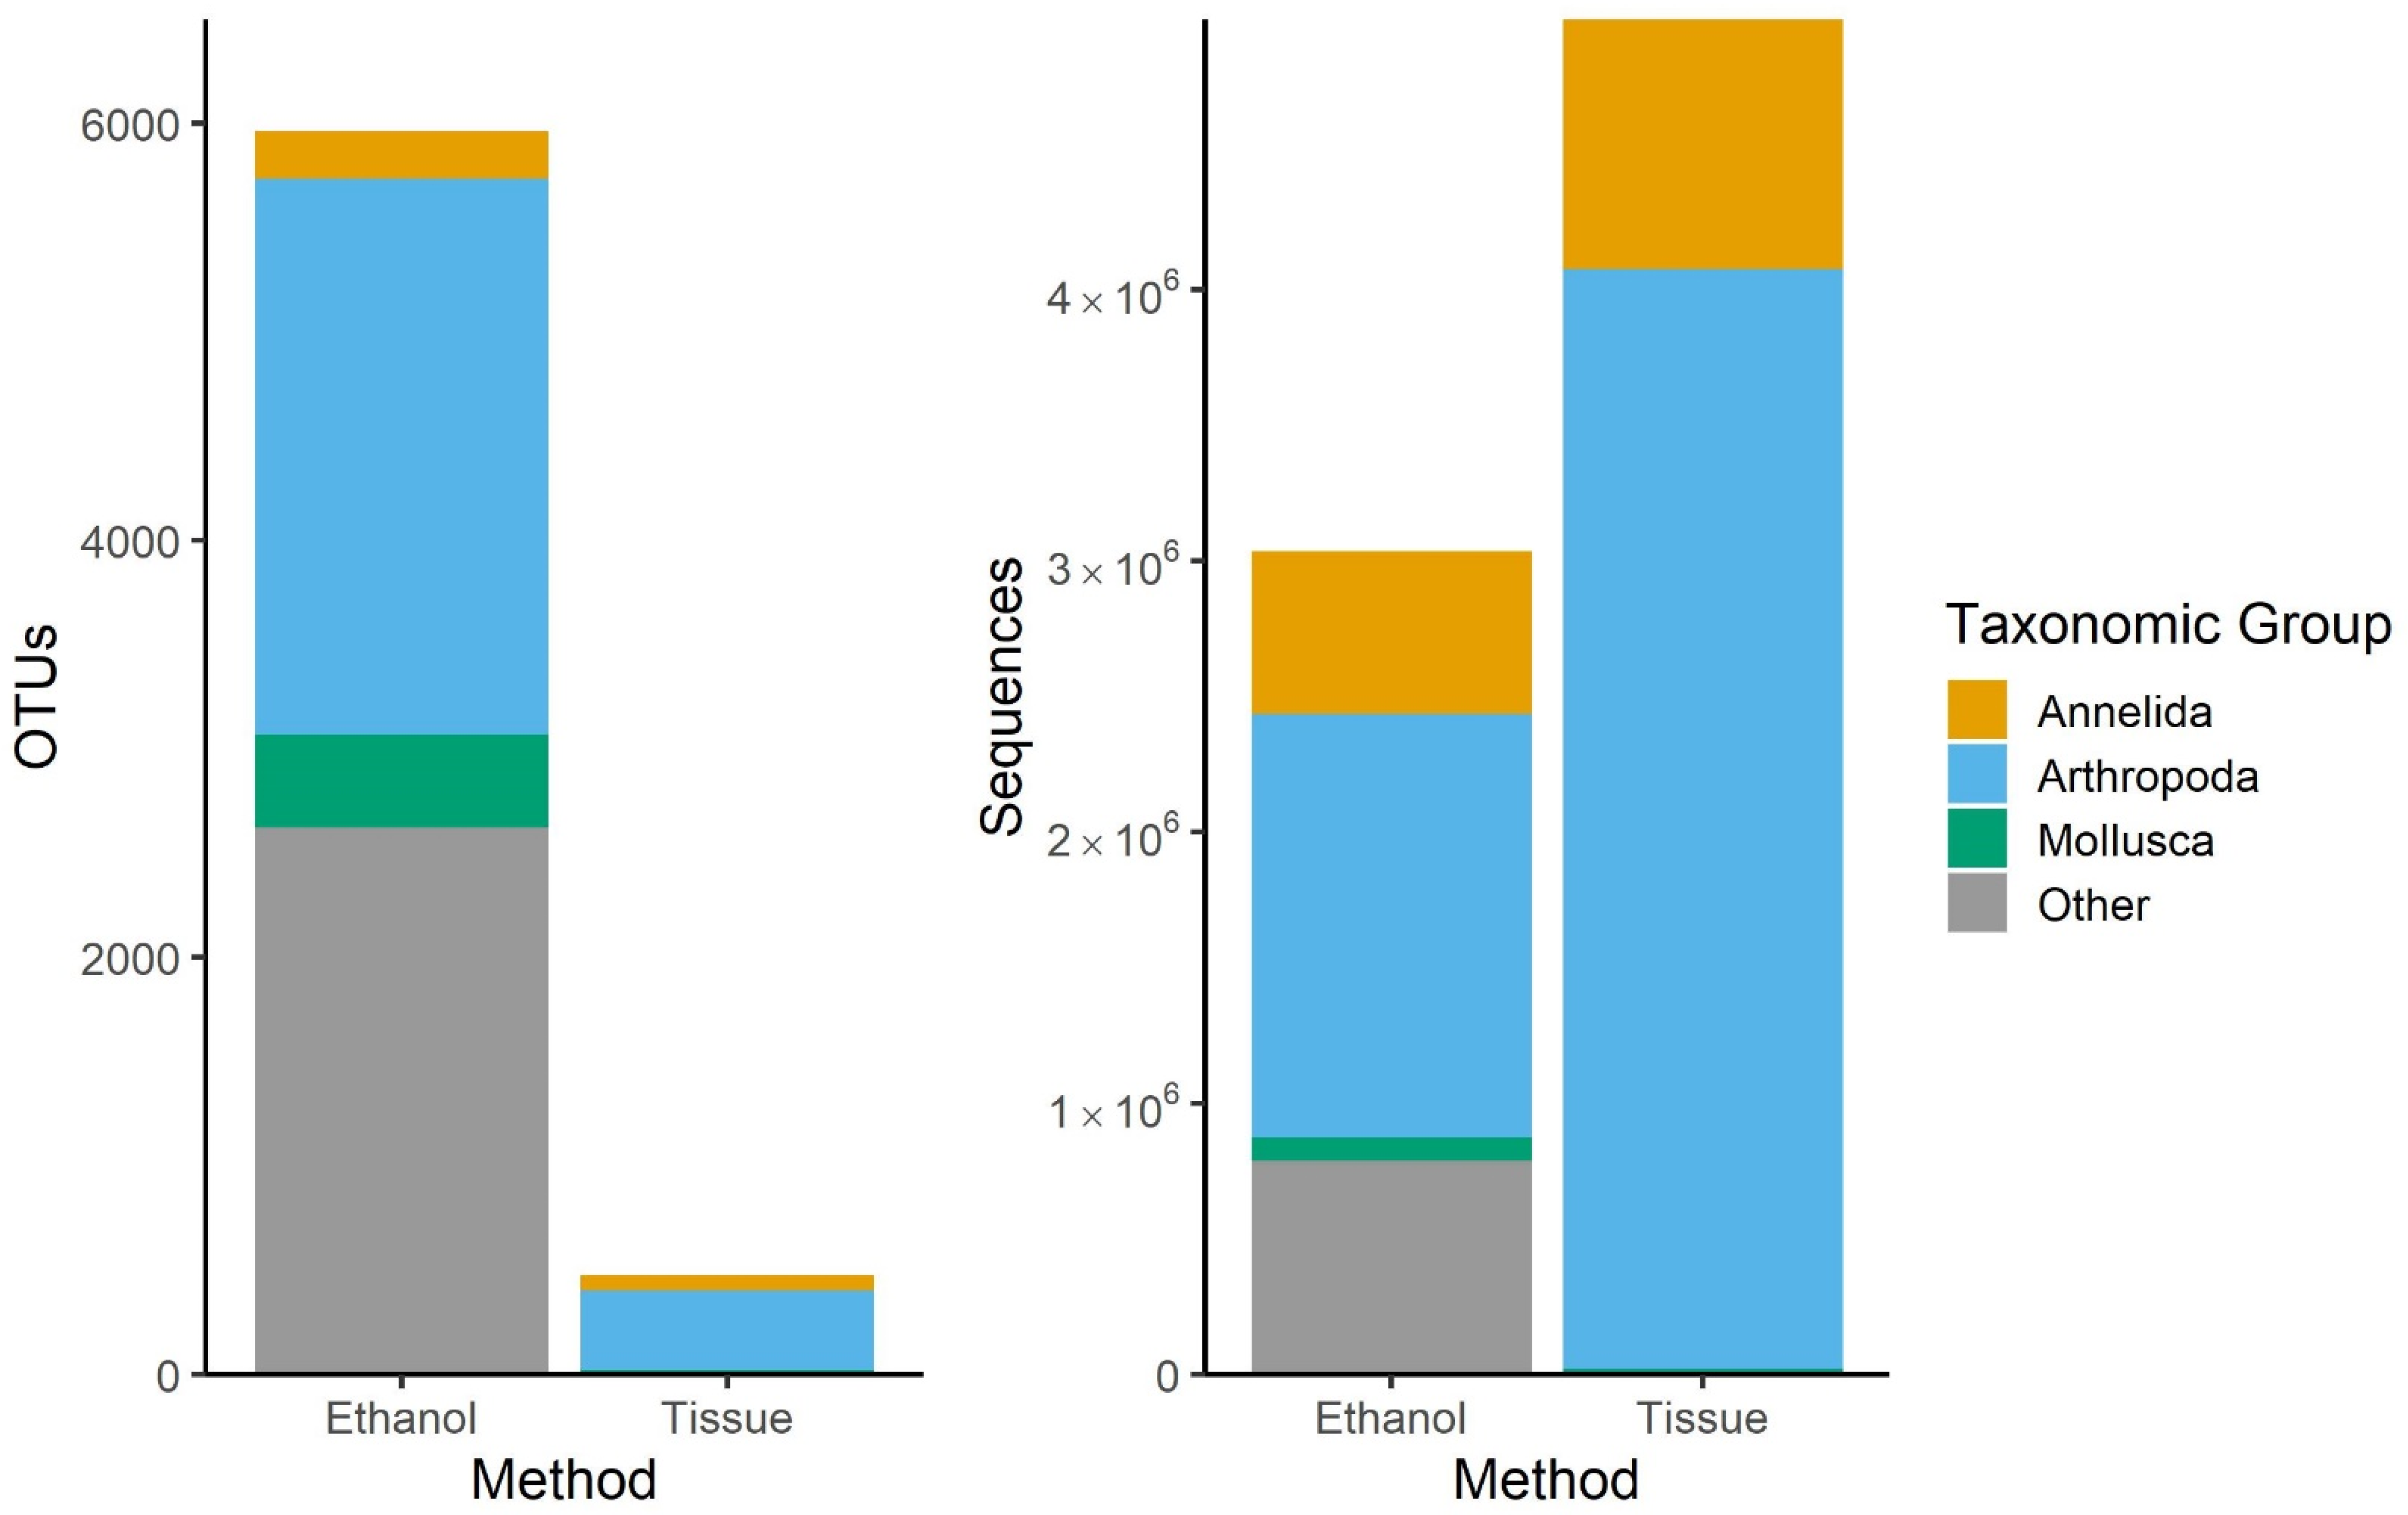
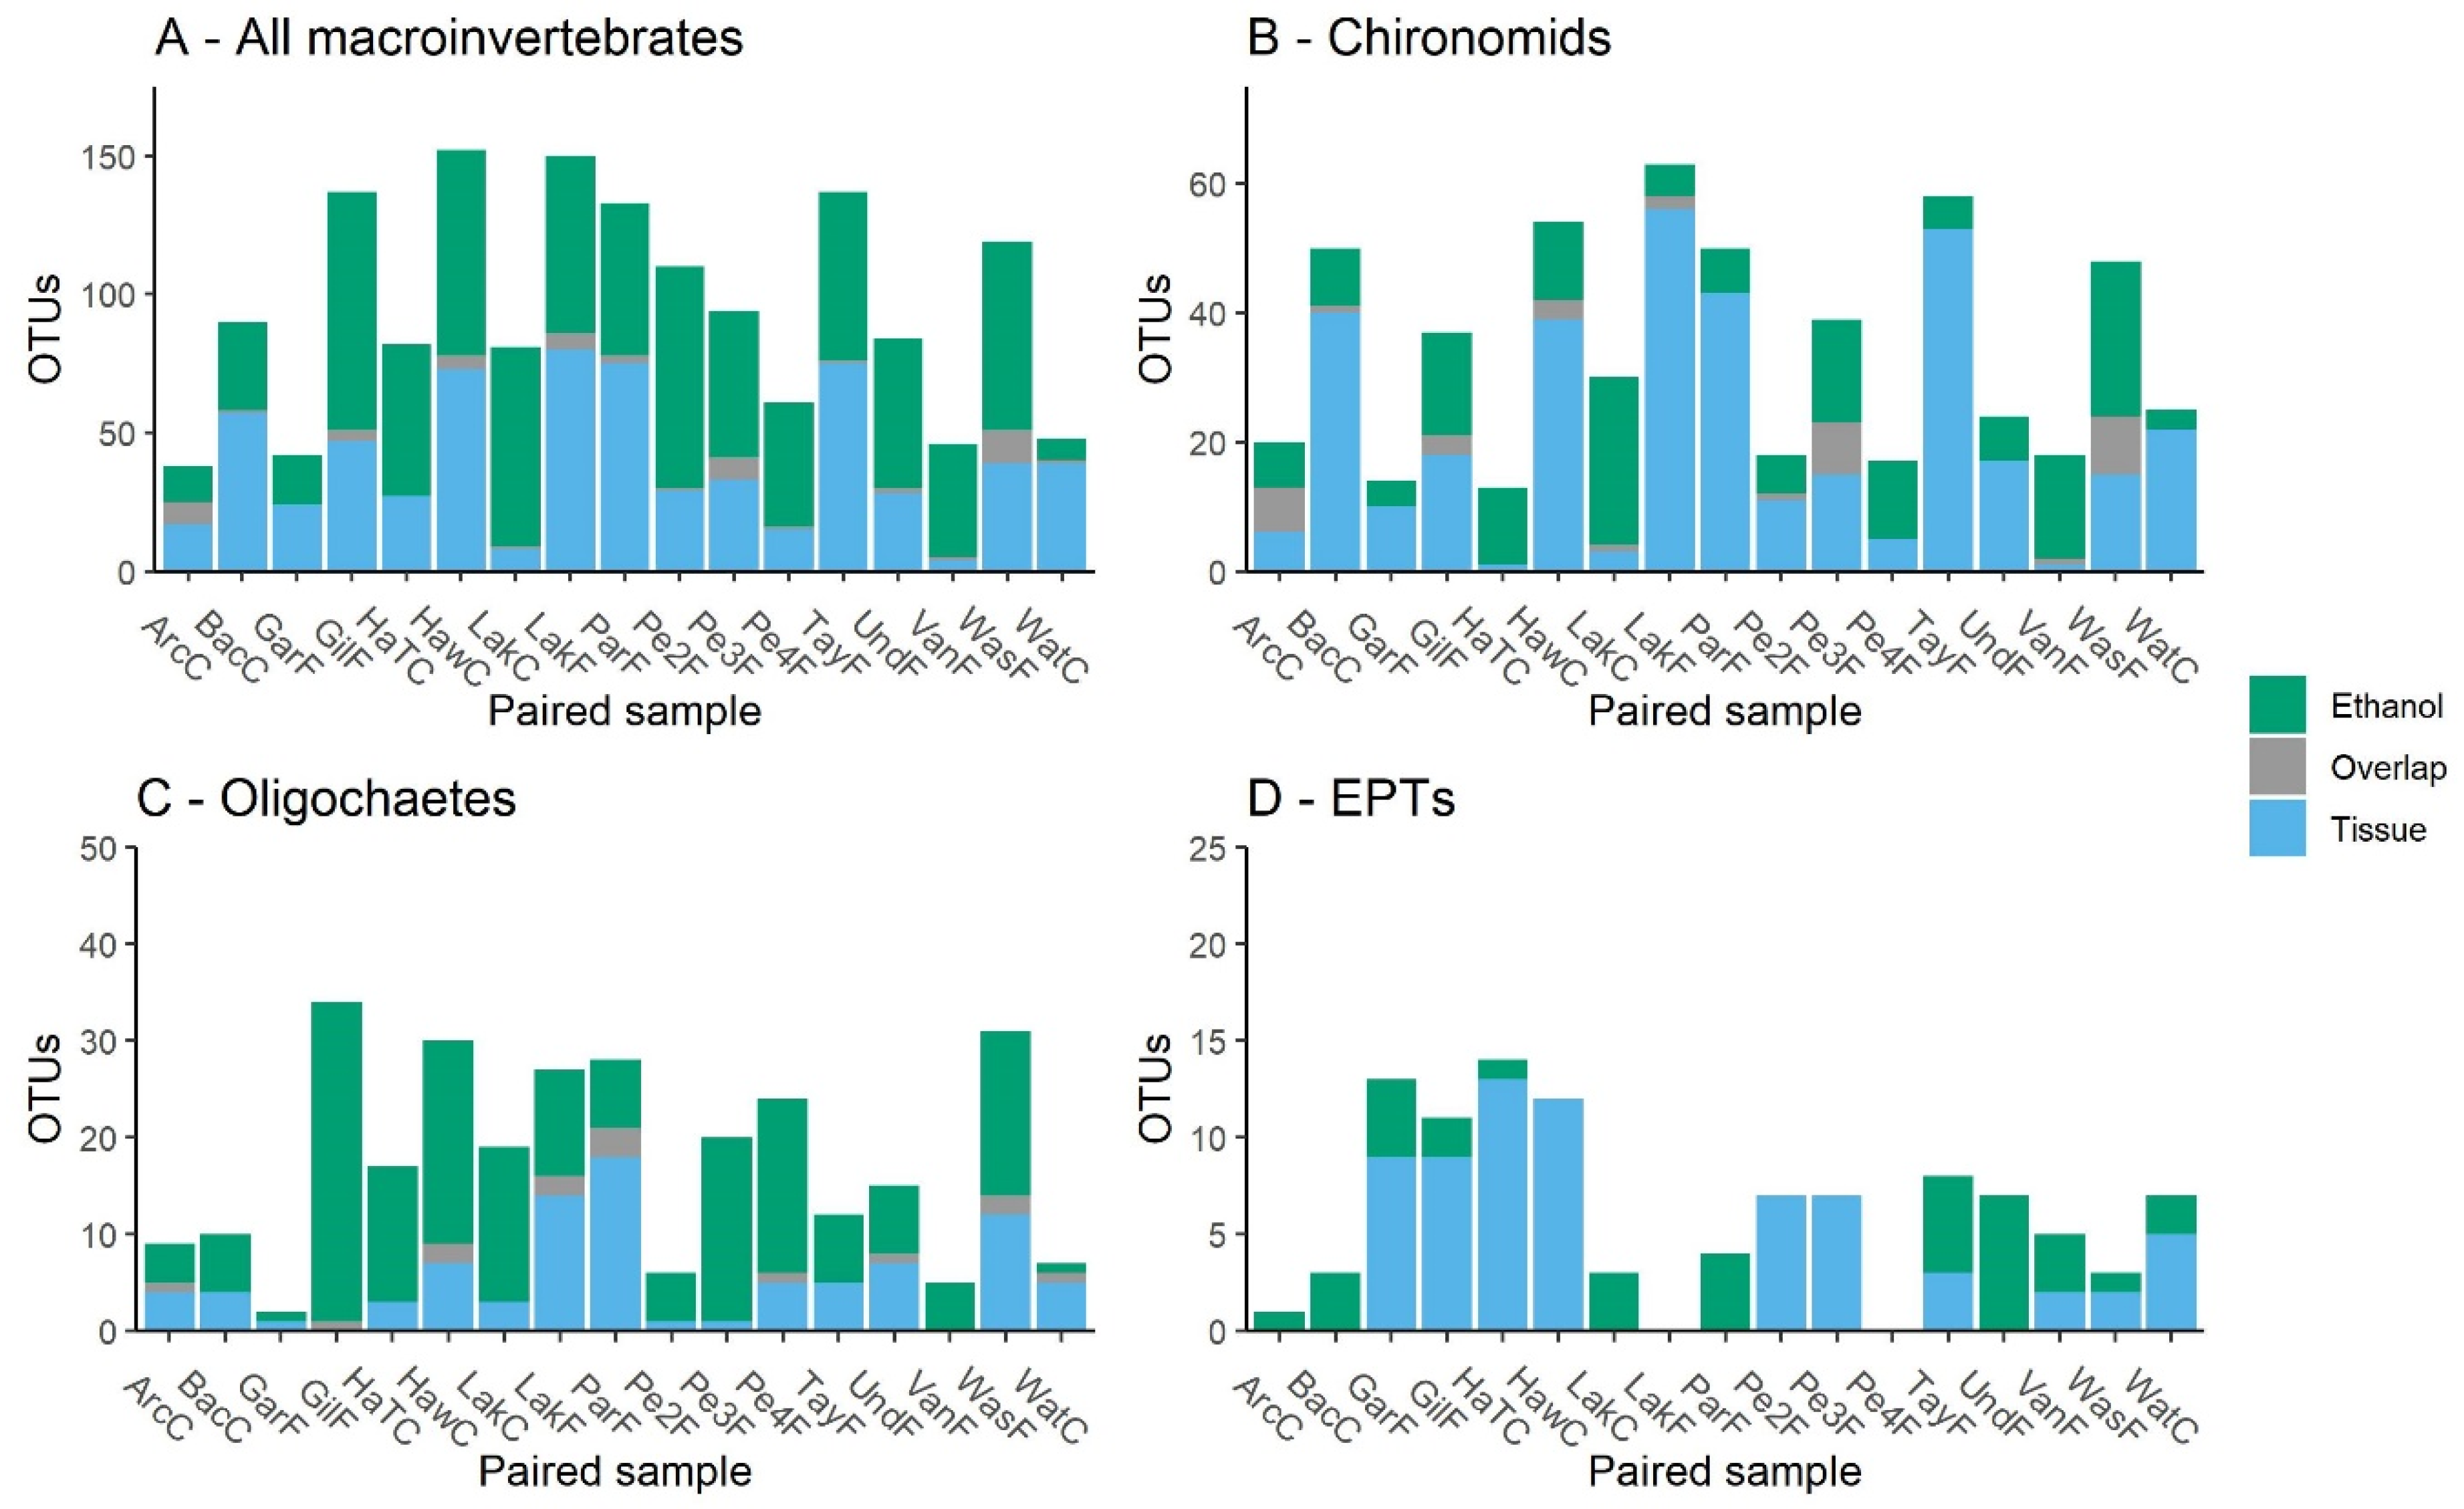
3.1. Comparison of Sampling Methods
3.2. Agricultural Gradient Comparison
3.3. Water Quality and Land Use
4. Discussion
4.1. Ethanol and Bulk Tissue Community Composition
4.2. Influence of Agriculture and Water Quality
5. Conclusions
Supplementary Materials
Author Contributions
Funding
Institutional Review Board Statement
Informed Consent Statement
Data Availability Statement
Acknowledgments
Conflicts of Interest
References
- Bolund, P.; Hunhammar, S. Ecosystem Services in Urban Areas. Renew. Agric. Food Syst. 1999, 29, 293–301. [Google Scholar] [CrossRef]
- Burdon, F.J.; Munz, N.A.; Reyes, M.; Focks, A.; Joss, A.; Räsänen, K.; Altermatt, F.; Eggen, R.I.L.; Stamm, C. Agriculture versus Wastewater Pollution as Drivers of Macroinvertebrate Community Structure in Streams. Sci. Total Environ. 2019, 659, 1256–1265. [Google Scholar] [CrossRef]
- Xu, M.; Wang, Z.; Duan, X.; Pan, B. Effects of Pollution on Macroinvertebrates and Water Quality Bio-Assessment. Hydrobiologia 2014, 729, 247–259. [Google Scholar] [CrossRef]
- Munn, M.D.; Black, R.W.; Gruber, S.J. Response of Benthic Algae to Environmental Gradients in an Agriculturally Dominated Landscape. J. N. Am. Benthol. Soc. 2002, 21, 221–237. [Google Scholar] [CrossRef]
- Wang, H.; Hondzo, M.; Xu, C.; Poole, V.; Spacie, A. Dissolved Oxygen Dynamics of Streams Draining an Urbanized and an Agricultural Catchment. Ecol. Modell. 2003, 160, 145–161. [Google Scholar] [CrossRef]
- Morgan, A.M.; Royer, T.V.; David, M.B.; Gentry, L.E. Relationships among Nutrients, Chlorophyll-a, and Dissolved Oxygen in Agricultural Streams in Illinois. J. Environ. Qual. 2006, 35, 1110–1117. [Google Scholar] [CrossRef] [PubMed] [Green Version]
- Olson, J.R.; Hawkins, C.P. Effects of Total Dissolved Solids on Growth and Mortality Predict Distributions of Stream Macroinvertebrates. Freshw. Biol. 2017, 62, 779–791. [Google Scholar] [CrossRef]
- Mcdonald, B.S.; Mullins, G.W.; Lewis, S. Macroinvertebrates as Indicators of Stream Health. Am. Biol. Teach. 1991, 53, 462–466. [Google Scholar] [CrossRef]
- Johnson, R.K.; Wiederholm, T.; Rosenberg, D.M. Freshwater Biomonitoring Using Individual Organisms, Populations, and Species Assemblages of Benthic Macroinvertebrates; Chapman Hall: New York, NY, USA, 1993; pp. 40–125. [Google Scholar] [CrossRef]
- Lenat, D.R. Water Quality Assessment of Streams Using a Qualitative Collection Method for Benthic Macroinvertebrates. J. N. Am. Benthol. Soc. 1988, 7, 222–233. [Google Scholar] [CrossRef]
- Nicacio, G.; Juen, L. Chironomids as Indicators in Freshwater Ecosystems: An Assessment of the Literature. Insect Conserv. Divers. 2015, 8, 393–403. [Google Scholar] [CrossRef] [Green Version]
- Bista, I.; Carvalho, G.R.; Walsh, K.; Seymour, M.; Hajibabaei, M.; Lallias, D.; Christmas, M.; Creer, S. Annual Time-Series Analysis of Aqueous EDNA Reveals Ecologically Relevant Dynamics of Lake Ecosystem Biodiversity. Nat. Commun. 2017, 8. [Google Scholar] [CrossRef] [PubMed] [Green Version]
- Beermann, A.J.; Zizka, V.M.A.; Elbrecht, V.; Baranov, V.; Leese, F. DNA Metabarcoding Reveals the Complex and Hidden Responses of Chironomids to Multiple Stressors. Environ. Sci. Eur. 2018, 30. [Google Scholar] [CrossRef] [Green Version]
- Vivien, R.; Wyler, S.; Lafont, M.; Pawlowski, J. Molecular Barcoding of Aquatic Oligochaetes: Implications for Biomonitoring. PLoS ONE 2015, 10, 1–15. [Google Scholar] [CrossRef] [PubMed]
- Mächler, E.; Deiner, K.; Steinmann, P.; Altermatt, F. Utility of Environmental DNA for Monitoring Rare and Indicator Macroinvertebrate Species. Freshw. Sci. 2014, 33, 1174–1183. [Google Scholar] [CrossRef]
- Carew, M.E.; Pettigrove, V.J.; Metzeling, L.; Hoffmann, A.A. Environmental Monitoring Using Next Generation Sequencing: Rapid Identification of Macroinvertebrate Bioindicator Species. Front. Zool. 2013, 10. [Google Scholar] [CrossRef] [Green Version]
- Fernández, S.; Rodríguez, S.; Martínez, J.L.; Borrell, Y.J.; Ardura, A.; García-Vázquez, E. Evaluating Freshwater Macroinvertebrates from EDNA Metabarcoding: A River Nalón Case Study. PLoS ONE 2018, 13, 1–17. [Google Scholar] [CrossRef]
- Hebert, P.D.N.; Cywinska, A.; Ball, S.L.; DeWaard, J.R. Biological Identifications through DNA Barcodes. Proc. R. Soc. B Biol. Sci. 2003, 270, 313–321. [Google Scholar] [CrossRef] [Green Version]
- Jackson, J.K.; Battle, J.M.; White, B.P.; Pilgrim, E.M.; Stein, E.D.; Miller, P.E.; Sweeney, B.W. Cryptic Biodiversity in Streams: A Comparison of Macroinvertebrate Communities Based on Morphological and DNA Barcode Identifications. Freshw. Sci. 2014, 33, 312–324. [Google Scholar] [CrossRef]
- Zizka, V.M.A.; Leese, F.; Peinert, B.; Geiger, M.F. DNA Metabarcoding from Sample Fixative as a Quick and Voucher-Preserving Biodiversity Assessment Method. Genome 2019, 62, 122–136. [Google Scholar] [CrossRef] [Green Version]
- Taberlet, P.; Coissac, E.; Hajibabaei, M.; Rieseberg, L.H. Environmental DNA. Mol. Ecol. 2012, 21, 1789–1793. [Google Scholar] [CrossRef]
- Deiner, K.; Fronhofer, E.A.; Mächler, E.; Walser, J.C.; Altermatt, F. Environmental DNA Reveals That Rivers Are Conveyer Belts of Biodiversity Information. Nat. Commun. 2016, 7. [Google Scholar] [CrossRef] [PubMed] [Green Version]
- Barnes, M.A.; Turner, C.R. The Ecology of Environmental DNA and Implications for Conservation Genetics. Conserv. Genet. 2016, 17, 1–17. [Google Scholar] [CrossRef] [Green Version]
- Hajibabaei, M.; Porter, T.M.; Robinson, C.V.; Baird, D.J.; Shokralla, S.; Wright, M.T.G. Watered-down Biodiversity? A Comparison of Metabarcoding Results from DNA Extracted from Matched Water and Bulk Tissue Biomonitoring Samples. PLoS ONE 2019, 14, 1–16. [Google Scholar] [CrossRef] [PubMed] [Green Version]
- Gleason, J.E.; Elbrecht, V.; Braukmann, T.W.A.; Hanner, R.H.; Cottenie, K. Assessment of Stream Macroinvertebrate Communities with EDNA Is Not Congruent with Tissue-Based Metabarcoding. Mol. Ecol. 2020. [Google Scholar] [CrossRef] [PubMed]
- Hajibabaei, M.; Spall, J.L.; Shokralla, S.; van Konynenburg, S. Assessing Biodiversity of a Freshwater Benthic Macroinvertebrate Community through Non-Destructive Environmental Barcoding of DNA from Preservative Ethanol. BMC Ecol. 2012, 12, 1–10. [Google Scholar] [CrossRef] [PubMed] [Green Version]
- Stein, E.D.; White, B.P.; Mazor, R.D.; Miller, P.E.; Pilgrim, E.M. Evaluating Ethanol-Based Sample Preservation to Facilitate Use of DNA Barcoding in Routine Freshwater Biomonitoring Programs Using Benthic Macroinvertebrates. PLoS ONE 2013, 8, 1–7. [Google Scholar] [CrossRef] [Green Version]
- Stanfield, L. Ontario Stream Assessment Protocol, 9.0; Fisheries Policy Section; Ontario Ministry of Natural Resources: Peterborough, ON, Canada, 2017.
- Milián-García, Y.; Young, R.; Madden, M.; Bullas-Appleton, E.; Hanner, R.H. Optimization and Validation of a Cost-Effective Protocol for Biosurveillance of Invasive Alien Species. Ecol. Evol. 2020. [Google Scholar] [CrossRef]
- Elbrecht, V.; Leese, F. Validation and Development of COI Metabarcoding Primers for Freshwater Macroinvertebrate Bioassessment. Front. Environ. Sci. 2017, 5, 1–11. [Google Scholar] [CrossRef] [Green Version]
- Martin, M. Cutadapt Removes Adapter Sequences from High-Throughput Sequencing Reads. EMBnet J. 2011, 17, 10–12. [Google Scholar] [CrossRef]
- Ratnasingham, S.; Hebert, P.D.N. The Barcode of Life Data System. Mol. Ecol. Notes 2007, 7, 355–364. [Google Scholar] [CrossRef] [Green Version]
- R Core Team. R: A Language and Environment for Statistical Computing; R Foundation for Statistical Computing: Vienna, Austria, 2019. [Google Scholar]
- Oksanen, J.; Blanchet, G.; Friendly, M.; Kindt, R.; Legendre, P.; McGlinn, D.; Minchin, P.R.; O’Hara, R.B.; Simpson, G.L.; Solymos, P.; et al. Vegan:Community Ecology Package; 2019; Available online: https://CRAN.R-project.org/package=vegan (accessed on 16 January 2021).
- Macher, J.N.; Vivancos, A.; Piggott, J.J.; Centeno, F.C.; Matthaei, C.D.; Leese, F. Comparison of Environmental DNA and Bulk-Sample Metabarcoding Using Highly Degenerate Cytochrome c Oxidase I Primers. Mol. Ecol. Resour. 2018, 18, 1456–1468. [Google Scholar] [CrossRef] [PubMed]
- Martins, F.M.S.; Galhardo, M.; Filipe, A.F.; Teixeira, A.; Pinheiro, P.; Paupério, J.; Alves, P.C.; Beja, P. Have the Cake and Eat It: Optimizing Nondestructive DNA Metabarcoding of Macroinvertebrate Samples for Freshwater Biomonitoring. Mol. Ecol. Resour. 2019, 19, 863–876. [Google Scholar] [CrossRef] [PubMed]
- Martins, F.M.S.; Porto, M.; Feio, M.J.; Egeter, B.; Bonin, A.; Serra, S.R.Q.; Taberlet, P.; Beja, P. Modelling Technical and Biological Biases in Macroinvertebrate Community Assessment from Bulk Preservative Using Multiple Metabarcoding Markers. Mol. Ecol. 2020, 1–18. [Google Scholar] [CrossRef]
- Erdozain, M.; Thompson, D.G.; Porter, T.M.; Kidd, K.A.; Kreutzweiser, D.P.; Sibley, P.K.; Swystun, T.; Chartrand, D.; Hajibabaei, M. Metabarcoding of Storage Ethanol vs. Conventional Morphometric Identification in Relation to the Use of Stream Macroinvertebrates as Ecological Indicators in Forest Management. Ecol. Indic. 2019, 101, 173–184. [Google Scholar] [CrossRef]
- Shokralla, S.; Singer, G.A.C.; Hajibabaei, M. Direct PCR Amplification and Sequencing of Specimens’ DNA from Preservative Ethanol. Biotechniques 2010, 48, 305–306. [Google Scholar] [CrossRef] [PubMed]
- Majaneva, M.; Diserud, O.H.; Eagle, S.H.C.; Hajibabaei, M.; Ekrem, T. Choice of DNA Extraction Method Affects DNA Metabarcoding of Unsorted Invertebrate Bulk Samples. Metabarcoding Metagenom. 2018, 2, 1–12. [Google Scholar] [CrossRef]
- Ficetola, G.F.; Boyer, F.; Valentini, A.; Bonin, A.; Meyer, A.; Dejean, T.; Gaboriaud, C.; Usseglio-Polatera, P.; Taberlet, P. Comparison of Markers for the Monitoring of Freshwater Benthic Biodiversity through DNA Metabarcoding. Mol. Ecol. 2020, 1–14. [Google Scholar] [CrossRef]
- Leese, F.; Sander, M.; Buchner, D.; Elbrecht, V.; Haase, P.; Zizka, V. Improved Freshwater Macroinvertebrate Detection from EDNA through Minimized Non-Target Amplification. bioRxiv 2020. [Google Scholar] [CrossRef]
- Genito, D.; Gburek, W.J.; Sharpley, A.N. Response of Stream Macroinvertebrates to Agricultural Land Cover in a Small Watershed. J. Freshw. Ecol. 2002, 17, 109–119. [Google Scholar] [CrossRef]
- Hepp, L.U.; Milesi, S.V.; Biasi, C.; Restello, R.M. Effects of Agricultural and Urban Impacts on Macroinvertebrates Assemblages in Streams (Rio Grande Do Sul, Brazil). Zoologia 2010, 27, 106–113. [Google Scholar] [CrossRef]
- Yates, A.G.; Bailey, R.C. Covarying Patterns of Macroinvertebrate and Fish Assemblages along Natural and Human Activity Gradients: Implications for Bioassessment. Hydrobiologia 2010, 637, 87–100. [Google Scholar] [CrossRef]
- Yates, A.G.; Bailey, R.C. Effects of Taxonomic Group, Spatial Scale and Descriptor on the Relationship between Human Activity and Stream Biota. Ecol. Indic. 2011, 11, 759–771. [Google Scholar] [CrossRef]
- Barton, D.R. The Use of Percent Model Affinity to Assess the Effects of Agriculture on Benthic Invertebrate Communities in Headwater Streams of Southern Ontario, Canada. Freshw. Biol. 1996, 36, 397–410. [Google Scholar] [CrossRef]
- McKnight, U.S.; Rasmussen, J.J.; Kronvang, B.; Binning, P.J.; Bjerg, P.L. Sources, Occurrence and Predicted Aquatic Impact of Legacy and Contemporary Pesticides in Streams. Environ. Pollut. 2015, 200, 64–76. [Google Scholar] [CrossRef] [PubMed] [Green Version]


| Overall | Tissue | Ethanol | ||||
|---|---|---|---|---|---|---|
| Sequences | OTUs | Sequences | OTUs | Sequences | OTUs | |
| Raw | 14,369,501 | 7792 | 6,518,181 | 599 | 4,840,919 | 6438 |
| Filtration | 8,033,945 | 6227 | 4,998,042 | 476 | 3,035,903 | 5960 |
| Invertebrates * | 5,534,585 | 841 | 4,628,695 | 421 | 905,890 | 602 |
| Chironomids * | 3,153,709 | 228 | 2,810,963 | 191 | 342,746 | 123 |
| Oligochaetes * | 997,964 | 125 | 582,943 | 56 | 415,021 | 115 |
| EPTs * | 751,336 | 54 | 691,597 | 42 | 59,739 | 27 |
| All Invertebrates | Chironomids | Oligochaetes | EPTs | |||||
|---|---|---|---|---|---|---|---|---|
| Method | S | NS | S | S* | ||||
| Tissue | Ethanol | Tissue | Tissue | Ethanol | Ethanol | Tissue | Ethanol | |
| Site Type | NS | NS | NS | NS | NS | NS | n/a | n/a |
| Land use % | NS | NS | NS | NS | NS | NS | n/a | n/a |
| Water quality | NS | NS | NS | NS | NS | NS | n/a | n/a |
Publisher’s Note: MDPI stays neutral with regard to jurisdictional claims in published maps and institutional affiliations. |
© 2021 by the authors. Licensee MDPI, Basel, Switzerland. This article is an open access article distributed under the terms and conditions of the Creative Commons Attribution (CC BY) license (http://creativecommons.org/licenses/by/4.0/).
Share and Cite
Persaud, S.F.; Cottenie, K.; Gleason, J.E. Ethanol eDNA Reveals Unique Community Composition of Aquatic Macroinvertebrates Compared to Bulk Tissue Metabarcoding in a Biomonitoring Sampling Scheme. Diversity 2021, 13, 34. https://0-doi-org.brum.beds.ac.uk/10.3390/d13010034
Persaud SF, Cottenie K, Gleason JE. Ethanol eDNA Reveals Unique Community Composition of Aquatic Macroinvertebrates Compared to Bulk Tissue Metabarcoding in a Biomonitoring Sampling Scheme. Diversity. 2021; 13(1):34. https://0-doi-org.brum.beds.ac.uk/10.3390/d13010034
Chicago/Turabian StylePersaud, Sadhna Fiona, Karl Cottenie, and Jennifer Erin Gleason. 2021. "Ethanol eDNA Reveals Unique Community Composition of Aquatic Macroinvertebrates Compared to Bulk Tissue Metabarcoding in a Biomonitoring Sampling Scheme" Diversity 13, no. 1: 34. https://0-doi-org.brum.beds.ac.uk/10.3390/d13010034