Article

Building a Plant DNA Barcode Reference Library for a Diverse Tropical Flora: An Example from Queensland, Australia

1
Botany Department, National Museum of Natural History, MRC 166, Smithsonian Institution, PO Box 37012, Washington, DC 20013-7012, USA
2
School of Biological Sciences and the Environment Institute, University of Adelaide, Adelaide 5005, Australia
3
National Herbarium of NSW, Royal Botanic Garden Sydney, Mrs Macquaries Road, Sydney 2000, Australia
4
Department of Biological Sciences, Macquarie University, Sydney 2109, Australia
5
CSIRO Land and Water, Tropical Forest Research Centre, Atherton 4883, Australia
6
Australian Tropical Herbarium, James Cook University, Smithfield 4878, Australia
*
Author to whom correspondence should be addressed.
These authors contributed equally to this work.
Submission received: 19 October 2015 / Revised: 14 February 2016 / Accepted: 24 February 2016 / Published: 29 February 2016
(This article belongs to the Special Issue DNA Barcoding and Biodiversity Research)

Abstract

:
A foundation for a DNA barcode reference library for the tropical plants of Australia is presented here. A total of 1572 DNA barcode sequences are compiled from 848 tropical Queensland species. The dataset represents 35% of the total flora of Queensland’s Wet Tropics Bioregion, 57% of its tree species and 28% of the shrub species. For approximately half of the sampled species, we investigated the occurrence of infraspecific molecular variation in DNA barcode loci rbcLa, matK, and the trnH-psbA intergenic spacer region across previously recognized biogeographic barriers. We found preliminary support for the notion that DNA barcode reference libraries can be used as a tool for inferring biogeographic patterns at regional scales. It is expected that this dataset will find applications in taxonomic, ecological, and applied conservation research.

1. Introduction

Tropical rain forests present unique challenges to identifying plant species. They are characteristically diverse, with an area as small as two hectares potentially containing 300+ vascular woody species of trees, shrubs, and lianas [1]. Many of these species can be extremely rare and/or poorly known [2] and often their most diagnostic characters for identification (e.g., leaves, fruit and flowers) occur high in the canopy out of sight and reach. In many cases fruits and/or flowers are required for accurate identification, which can hinder progress on identification of tropical species in remote localities for years or even decades. This combination of factors renders identification of species in tropical forests to be characteristically slow and dependent on trained experts in taxonomy.
Taxonomy, the scientific discipline of identifying and assigning names to species, may be one of the world’s oldest professions, yet today it is undoubtedly an uncommon trade. Although there has been much recent discussion about the discipline of taxonomy being in a state of decline [3], a recent paper [4] suggested the opposite is true. Between 1864 and 2010, the number of authors describing new species, articles describing new species and total new species described in the zoological record has increased. This may be attributed to the development of new research methods and approaches or the “publication landscape” changing as science publications have become more interdisciplinary in nature. This trend, plus the rise of the international DNA barcoding initiative, are shifting the ways new species are discovered and expanding the traditional horizons of the discipline of taxonomy. The International Barcode of Life Project (iBOL) was established in 2009 and uses standardized portions of a species genome to identify species, with the aim to aid traditional taxonomy and species identification. Now species can be identified from plant leaf fragments and cambium [5], roots [6], herbal medicine preparations bought in stores [7], meat bought at the market [8], fecal remains of animals [9], and even from digested plant tissues inside the guts of insects [10]. These new and innovative methods hold much promise for addressing some of the challenges of identifying plant species in the tropics and are expected to accelerate the discovery of new species.
The primary mission of iBOL is to provide a platform for the construction of a global DNA barcode reference library of species, the Barcode of Life Data Systems (BOLD) [11], and to promote increased geographic and taxonomic coverage of the species currently represented. BOLD is an online resource developed by the Canadian Centre for DNA Barcoding (CCDB), which stores the DNA barcode records, all supporting trace file sequence data as well as the data on the voucher collections for each DNA sample. BOLD also enables global community access to the data with online tools for visualization, species validation, and analysis. It is now a central data repository and informatics hub for DNA barcoding projects worldwide.
This project aims to construct a DNA barcode library for the tropical flora of Australia in collaboration with iBOL and the CCDB. As a starting point we present analyses of 1572 DNA barcodes from 848 species from Queensland. In addition to providing a broad coverage of the species that occur in the region, the project sampled multiple individuals per species for approximately half of the sampled species (473) to investigate the occurrence of infraspecific molecular variation in DNA barcode loci.
The Australian state of Queensland is the world’s sixth largest sub-national political region, spanning more than 1,850,000 km2. Over half of Queensland lies in the southern tropics. Great diversity of landscapes and climates has allowed a large number of plant species to evolve. The 2014 Census of the Queensland Flora [12] lists 14,174 native plant species, making Queensland the most species rich state of Australia, plus it contains three out of the 12 major Australian centres of plant endemism [13]. This project focuses on plants occurring in the tropical northern part of the state, specifically within the Wet Tropics Bioregion and the Iron Range-McIlwraith Range region of Cape York Peninsula. However, it also includes some species with ranges that extend outside this area into Queensland’s western monsoonal, arid regions and the southern subtropical zone (Figure 1).
The global importance of the Wet Tropics Bioregion for biodiversity is well recognized and most of the region is included within the Queensland Wet Tropics World Heritage Area [14]. The region is considered one of the best-preserved living museums, containing assemblages of species representing multiple different eras of the Earth’s evolutionary history including lineages of relict and recently radiated origins. Thus progress towards a complete DNA barcode library for this bioregion may be considered a priority and a valuable asset to Australia and to the world.
The current DNA barcode library consists of three plastid loci: rbcLa, matK, and the trnH-psbA intergenic spacer region and is hosted on the BOLD online database. The research was initiated through a project to generate DNA barcodes for 500 Australian tropical tree species. Additional species were subsequently added through contributions of postgraduates and research collaborations with the Australian Tropical Herbarium. This project lays the foundation for a more complete plant DNA barcode library for Australian tropical flora to be completed over time. It is expected that the compilation of this genetic resource will accelerate both academic research in the region and applied uses of DNA barcode data in fields such as quarantine, forensics, ecological restoration, climate change impacts, and citizen science.

2. Methods

DNA samples were obtained from a combination of fresh dried leaves stored on silica gel and herbarium specimens. For most species, fresh leaf material was obtained from field research plots, biodiversity survey expeditions, and local arboreta. Multiple samples (two to six) of 473 species were collected. For each collection, one leaf was stored on silica gel. For species that could not be located in the field, herbarium specimens from the Australian Tropical Herbarium were destructively sampled. Specimens no more than 20 years of age were selected, with preference given to specimens collected within the last ten years. Leaf tissue fragments were loaded into 96 well plates using sterilized forceps, and sent to the Canadian Center of DNA Barcoding (CCDB) for DNA extraction following their protocols [15]. All DNA samples are vouchered by herbarium specimens held at the Australian Tropical Herbarium (CNS). Voucher specimen data were submitted to BOLD via their standard submission template. We followed the standard data submission protocol from BOLD for specimen data entry [16]. A total of 773 specimens in the dataset include photographs of the voucher specimens. Specimen data were linked to each sequence via the BOLD web platform under the project folder titled Barcoding Australia’s Tropical Flora (BATF). PCR amplifications for the two official DNA barcode loci rbcLa and matK, plus a third, trnH-psbA, which is popular for its high PCR amplification success were conducted jointly between the CCDB and the Australian Tropical Herbarium following the CCDB amplification protocols for plant and fungi [17] and sequencing was conducted at the CCDB following their protocols [18]. DNA samples of all specimens are held at the Australian Tropical Herbarium with aliquots of some species also held at CCDB and the Smithsonian Institution’s National Museum of Natural History. Aliquots are available to the scientific community by request.
Accuracy of DNA barcodes was assessed through the BOLD taxon ID tree function, neighbor joining analyses and BLAST searches via GenBank. Species that displayed molecular variation among samples were further investigated. These included: (A) species that showed discordant results between the DNA sequence derived phylogeny and morphologically recognized species; and (B) species that showed variation within species but no discordance with other closely related species.
For species that fell into category (A), voucher specimens were carefully checked, and the raw sequence data (trace and contig files) re-examined. This process discovered a small number of vouchers that were incorrectly identified, and resolved some instances of incorrect base calls. For species that fell into category (B), the raw sequence data (trace and contig files) were re-examined. Species showing confirmed infraspecific variation were then investigated further to identify any geographic and/or ecological patterns.

3. Results and Discussion

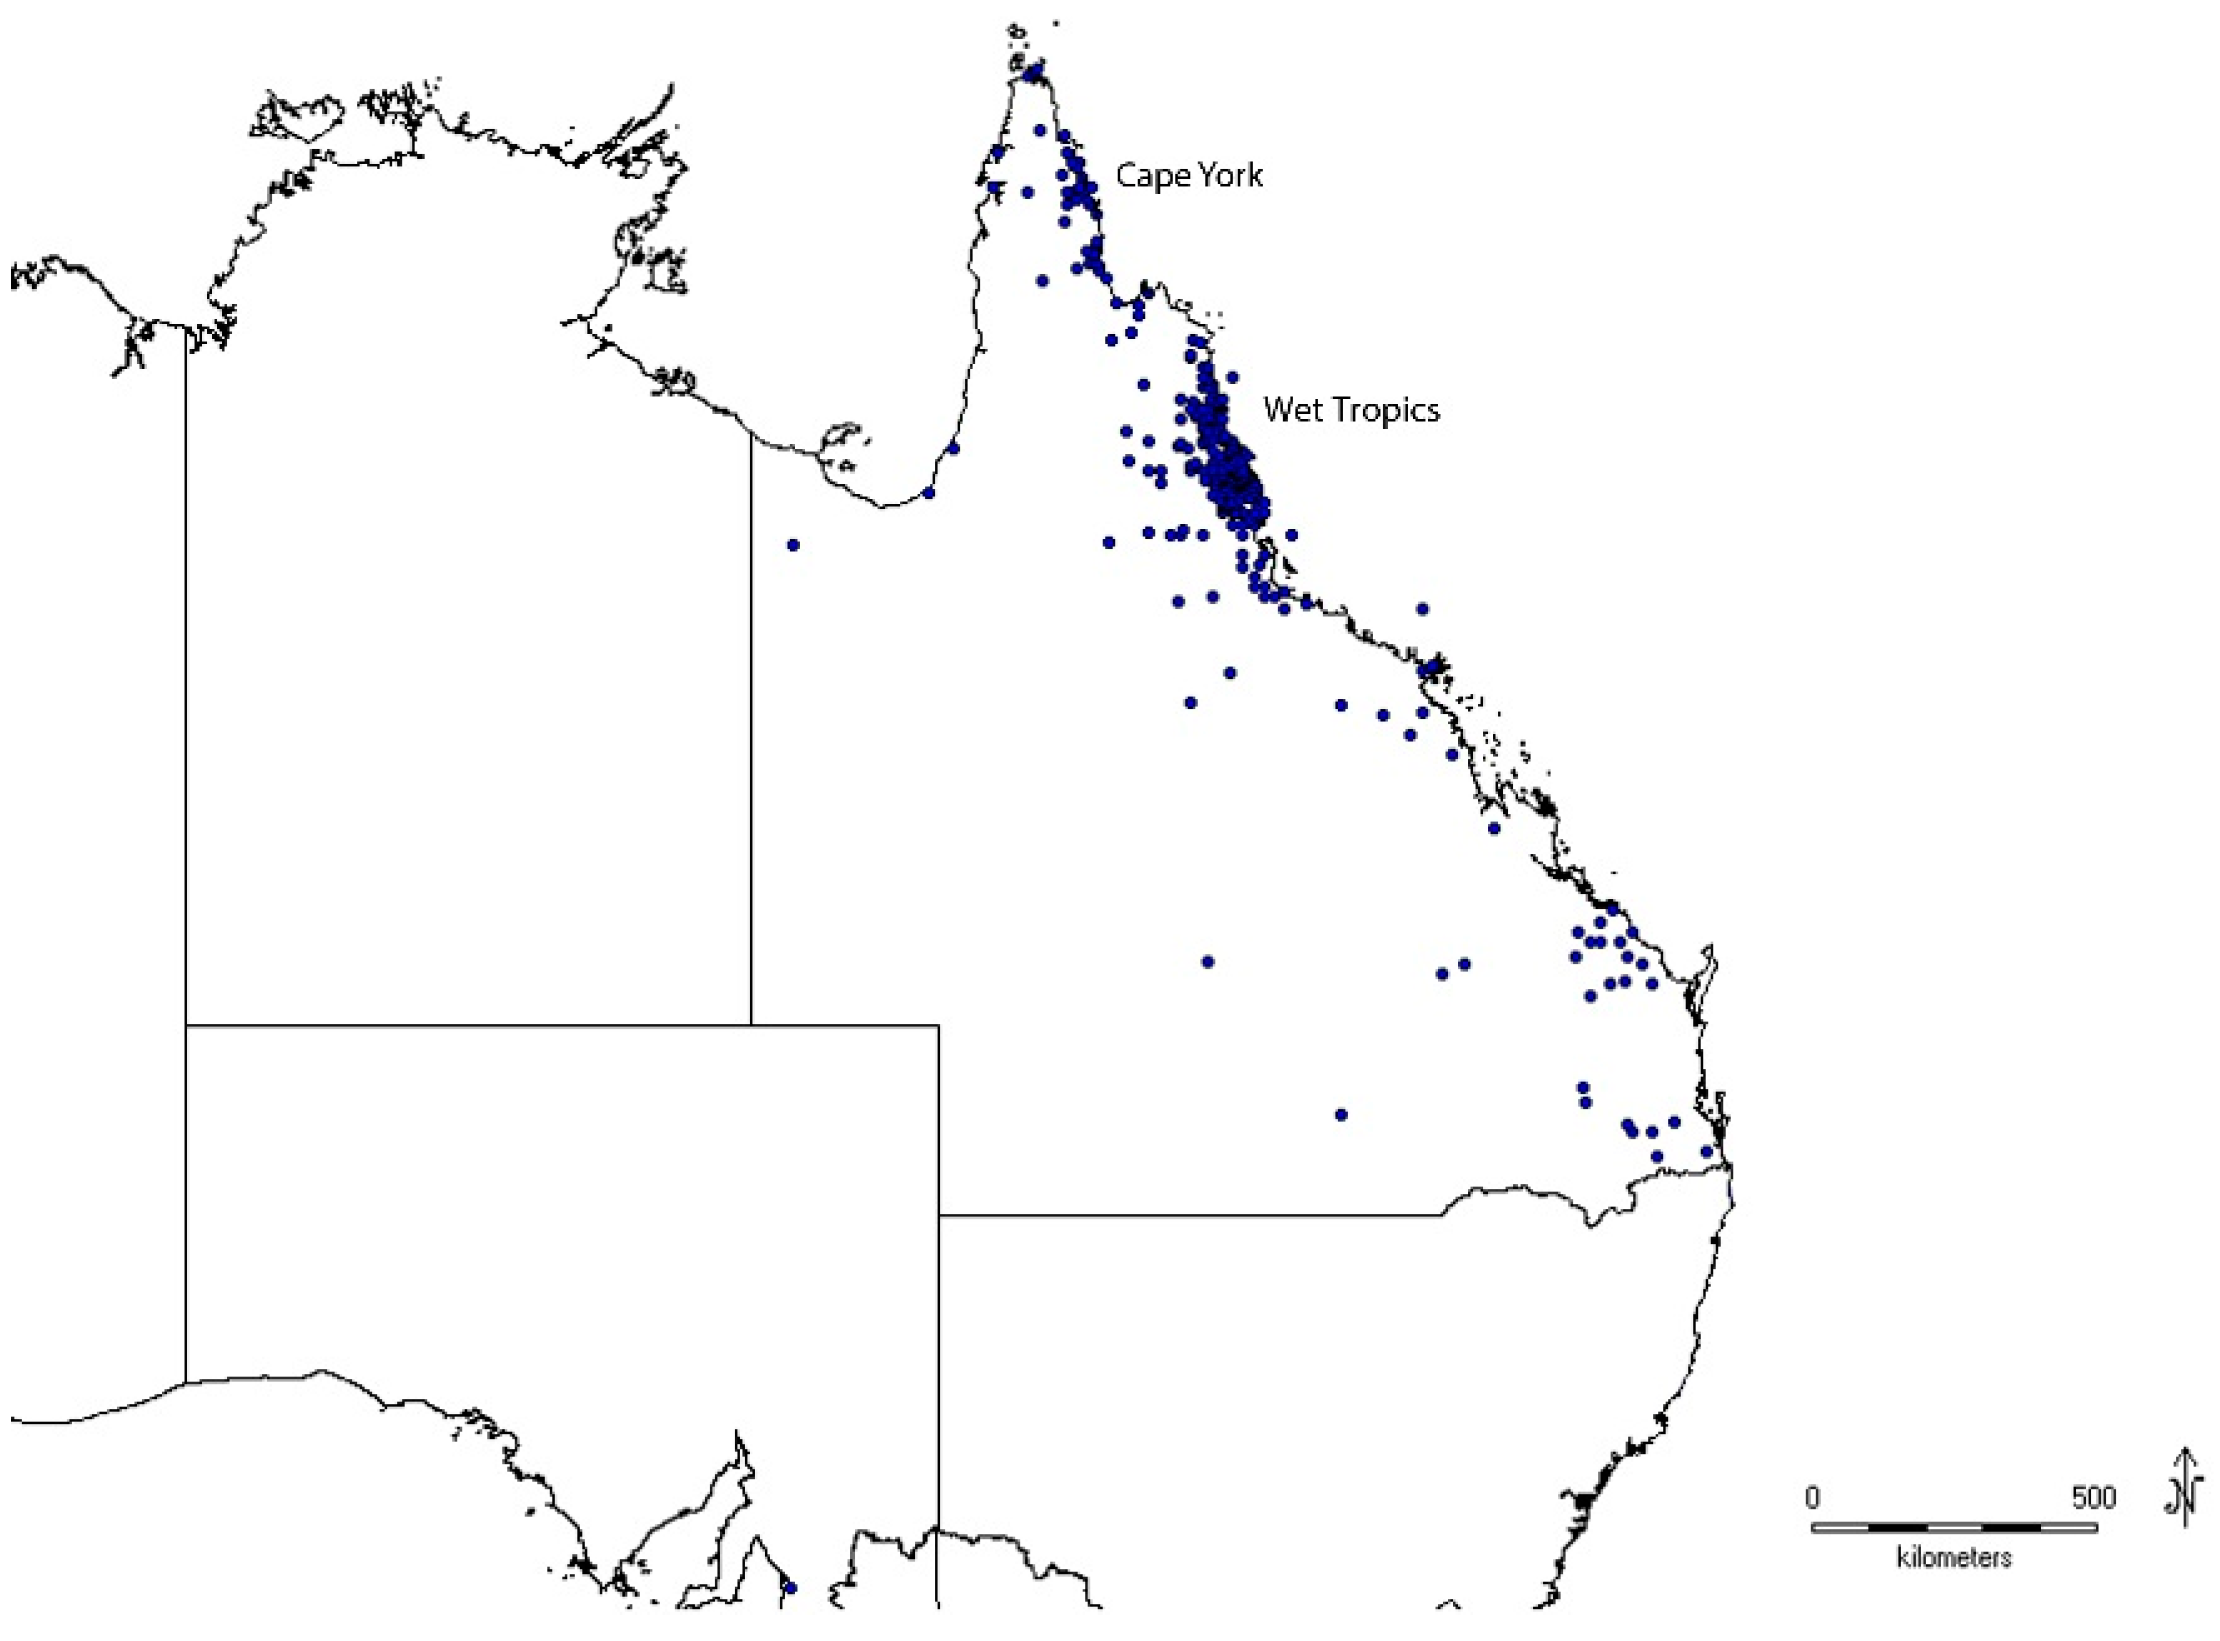
3.1. Taxonomic Coverage

The Barcoding Australia’s Tropical Flora project (BATF) consisted of mostly angiosperms with 857 angiosperm species spanning 43 orders and 113 families (see Table 1). An additional five gymnosperm species and six pteridophyte species were also included. A subset of 473 of these species contained multiple records (two to six) from separate geographic localities in Queensland. The nomenclature used for each species name follows the Australian Plant Name Index [19].

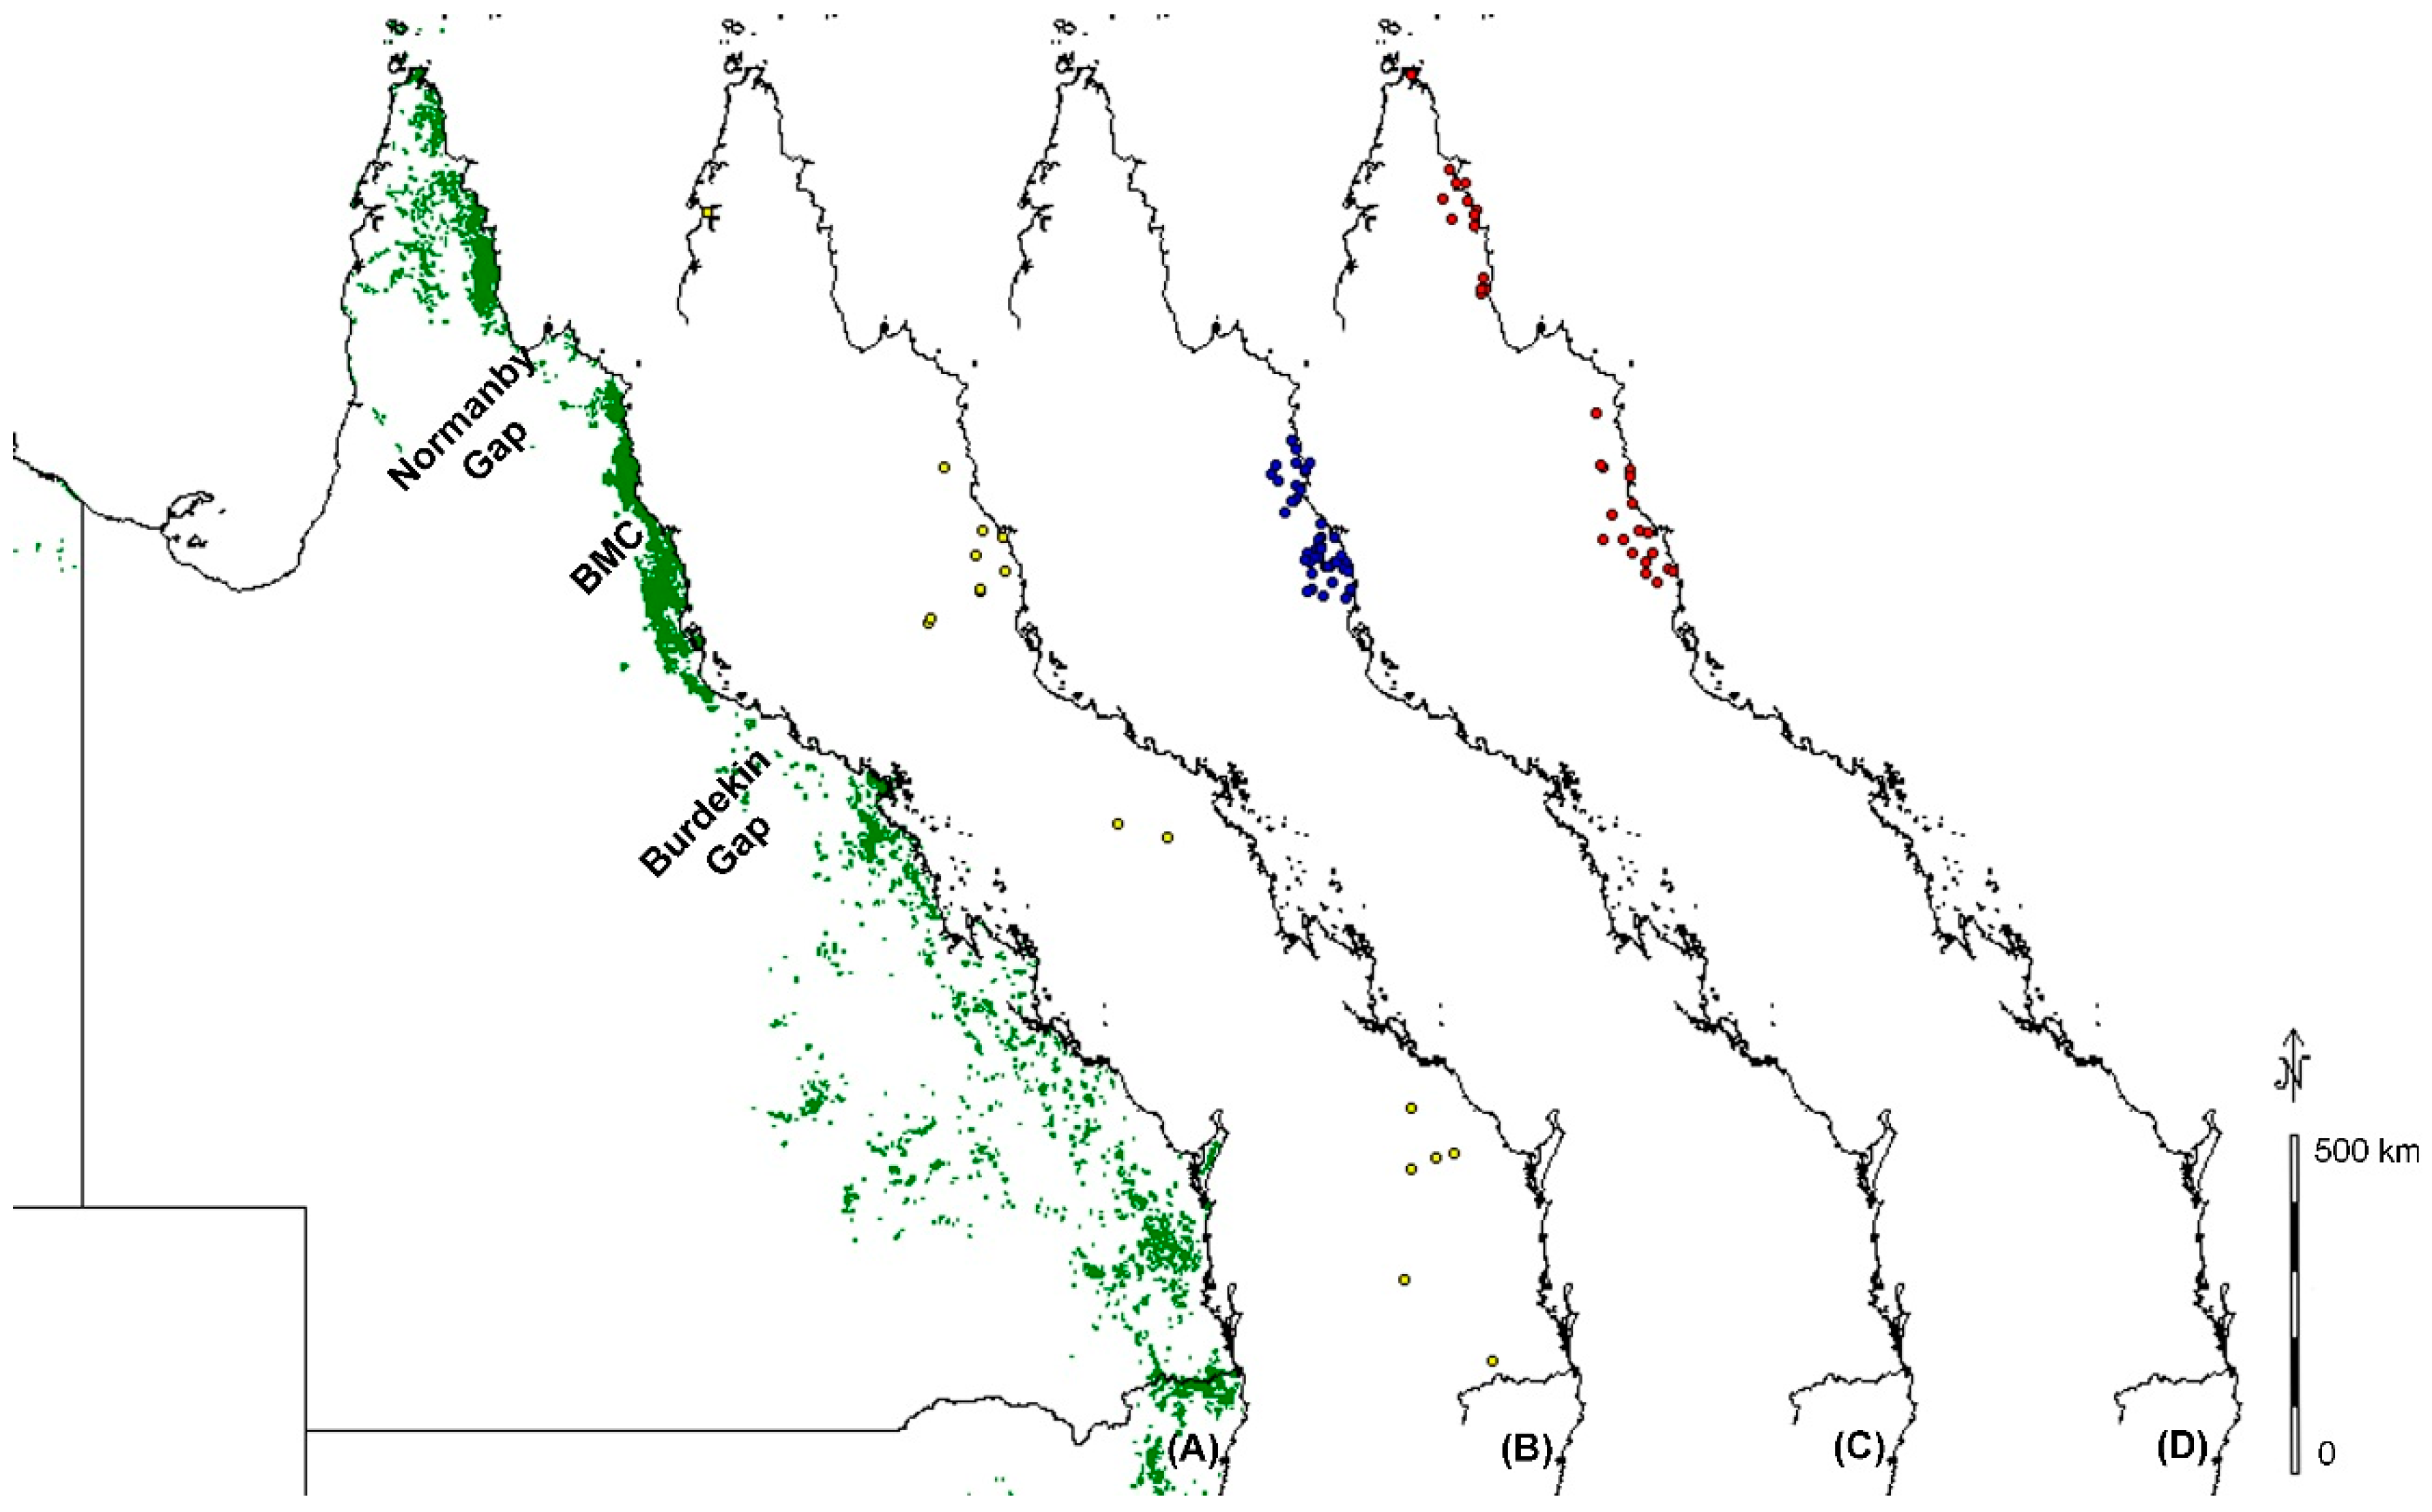
3.2. Variation within Species across Geographic Breaks

There have been many DNA barcode studies to date that have discussed the accuracy and PCR amplification success of different loci, but few studies have assessed the variation within species across their geographical ranges. We were interested to explore the utility of a large DNA barcode dataset of several hundred species sampled across a large geographical area, for addressing landscape scale questions in biogeography, conservation, and ecology.
We sampled 473 species from two to six geographic locations across each species’ range in Queensland, Australia. Of these, 100 (21%) species were found to have infraspecific variation across the species’ range. The variation ranged from one to 18 base pair differences across all three barcode loci per species. The trnH-psbA intergenic spacer region was the most variable locus with on average 3.60 base pair differences within each species, followed by matK with 1.25, then rbcL with 0.31. The mean infraspecific variation per species across all three loci was 5.12.
Although some species seemed to show stochastic variation, with samples variable within a relatively close region without any obvious biogeographic barriers, many showed variation across clear biogeographic barriers. Of particular interest were three recognized biogeographic barriers: the Normanby Gap, the Black Mountain Corridor, and the Burdekin Gap (Figure 2). Figure 2A shows the current distribution of rain forest and vine thickets in Queensland (green). Both the Normanby Gap and Burdekin Gap are large dry zones separating large rain forest blocks. The Black Mountain Corridor is currently rain forest but is recognized to be regenerated rain forest since the last glacial maximum, which reconnected areas to the north and south of it that maintained continuous rain forest refugia during the glacial period [20].
While our sampling was insufficient to discern whether observed genetic variation was continuous (clinal) across species’ ranges or changes abruptly at putative barriers, the following results identify species that would be profitable targets of follow up research into the location and significance of geographical breaks on plant population genetic structure.

3.3. Burdekin Gap

The Burdekin Gap separates the Wet Tropics Bioregion to the north from a corridor of rain forest fragments stretching from the southern-most tropical rain forest patches in Australia into the subtropical zone through New South Wales. This biogeographic break is named after the Burdekin River and is recognized to have dated geographic breaks from the Pliocene for open forest frogs, rainforest lizards and open forest lizards, the Pleistocene for rainforest birds, and an older Miocene divergence has been estimated for freshwater fish [21,22]. Differentiation across this biogeographic barrier has not been previously reported in plant species. Our dataset included 19 species sampled across the Burdekin Gap, of which five showed variation between north and south of the Burdekin Gap (See Figure 2B) with variation ranging from 1 to 4 base pairs and an average of 1.83 per species (Table 2).

3.4. Black Mountain Corridor

The Black Mountain Corridor separates the northern and southern parts of the Wet Tropics Bioregion. The emergence and disappearance of this barrier could be as early as the mid Miocene based on several faunal genetic divergences across it including skinks [23], vertebrates and insects [22], snails [24], and some plants [25]. Rossetto et al. [25] found that within the family Elaeocarpaceae, the Black Mountain Corridor acted as a geographic barrier for three out of 11 species, and that the barrier was less important for species with smaller fruits than for large fruited species. Our dataset included 110 plant species with samples north and south of the Black Mountain Corridor. A total of 36 (33%) of these species showed variation across the corridor (See Figure 2C) with infraspecific-variation ranging from 1 to 15 base pairs and an average of 3.5 base pairs per species (Table 3).

3.5. Normanby Gap

The Normanby Gap, also recognized as the Laura Gap [22], separates the Iron Range-McIlwraith Range rain forest area of Cape York from the Wet Tropics Bioregion to the south. The area is named after the Normanby River, which is Australia’s third largest river. Although the region surrounding the river basin is seasonally flooded during the wet season, the pronounced dry season prevents the development of rain forest. The region is unsuitable for cropping and much of it is utilized for cattle grazing. Our dataset included 53 species spanning the Normanby Gap. Out of these 53, 15 species showed infraspecific variation across the Normanby Gap (See Figure 2D) with variation ranging from 1 to 9 base pairs and an average of 3.81 per species (Table 4).

4. Conclusions

4.1. DNA Barcodes as a Tool for Studying Biogeography

These results should be regarded as preliminary due to the small numbers of individuals sampled per species (two to six). Follow-up studies are required to test the congruence between the patterns of infraspecific molecular variation and putative biogeographical barriers observed in some species through more comprehensive sampling across the entire range of each species. Our study shows that the potential value of publicly available DNA barcode libraries such as BATT for rapid assessment of landscape level and species level patterns will only be fully realised when sampling is sufficiently comprehensive to reveal underlying geographical patterns in molecular variation. In the meantime such databases have value as tools to identify taxa and areas for further study with higher resolution markers and more comprehensive sampling. Lastly it is important to highlight that the value of this work lies not only in the DNA barcode database, but the curated tissue and voucher samples (available upon request), which can enable future researchers to save a substantial amount of time and money instead of re-collecting them.

4.2. Data Resources

Data set name: BATF. Download form [26].
The plant DNA barcode reference library for tropical Queensland dataset is accessible through the public data portal BOLD [27]. All data including taxonomic information, geographic records, voucher specimen details, sequence data in the form of fasta files, and trace files (ab1 files) can be easily downloaded through the BOLD graphic user interphase. BOLD account holders can additionally access the data through the BOLD workbench platform. All voucher specimens are stored at the Australian Tropical Herbarium (CNS) and all DNA samples are jointly stored at the Australian Tropical Herbarium, the Canadian Centre for DNA Barcoding (CCDB), and The National Museum of Natural History, Smithsonian Institution (NMNH).

Acknowledgments

We thank the following for funding and support: Australian Department of the Environment through the Commonwealth Environment Research Facilities (CERF) and National Environmental Research Program (NERP); Australian Tropical Herbarium, James Cook University; and University of Adelaide. We also thank Melissa Harrison and Hugh Cross for technical support in the laboratory, and the many people who contributed botanical collections to the Australian Tropical Herbarium that made this work possible especially Gary Sankowsky, Bruce Gray, Paul Forster, and Stephanie Stuart.

Author Contributions

Craig M. Costion is a postdoctoral fellow at the Smithsonian Institution’s National Musuem of Natural History. His research is focused on plant biodiversity patterns and conservation in the Australasia and Pacific region. Craig M. Costion, Darren M. Crayn, and Andrew J. Lowe conceived the study. Craig M. Costion collected the data. Craig M. Costion, Martin F. Breed, Maurizio Rossetto, and Robert M. Kooyman analyzed the data. Craig M. Costion lead the writing and Darren M. Crayn, Andrew J. Lowe, Martin F. Breed, Maurizio Rossetto, Robert M. Kooyman and Andrew Ford helped write the paper.

Conflicts of Interest

The authors declare no conflict of interest.

References

  1. Corlett, R.T. Flora and reproductive phenology of the rain-forest at Bukit-Timah, Singapore. J. Trop. Ecol. 1990, 6, 55–63. [Google Scholar] [CrossRef]
  2. Costion, C.M.; Liston, J.; Kitalong, A.H.; Iida, A.; Lowe, A.J. Using the ancient past for establishing current threat in poorly inventoried regions. Biol. Conserv. 2012, 147, 153–162. [Google Scholar] [CrossRef]
  3. Pearson, D.L.; Hamilton, A.L.; Erwin, T.L. Recovery Plan for the Endangered Taxonomy Profession. Bioscience 2011, 61, 58–63. [Google Scholar] [CrossRef]
  4. Tancoigne, E.; Dubois, A. Taxonomy: No Decline, but inertia. Cladistics 2013, 29, 567–570. [Google Scholar] [CrossRef]
  5. Costion, C.; Ford, A.; Cross, H.; Crayn, D.; Harrington, M.; Lowe, A. Plant DNA Barcodes Can Accurately Estimate Species Richness in Poorly Known Floras. PLoS ONE 2011, 6, e26841. [Google Scholar] [CrossRef] [PubMed]
  6. Kesanakurti, P.R.; Fazekas, A.J.; Burgess, K.S.; Percy, D.M.; Newmaster, S.G.; Graham, S.W.; Barrett, S.C.H.; Hajibabaei, M.; Husband, B.C. Spatial patterns of plant diversity below-ground as revealed by DNA barcoding. Mol. Ecol. 2011, 20, 1289–1302. [Google Scholar] [CrossRef] [PubMed]
  7. Mahadani, P.; Gosh, S.K. DNA Barcoding: A Tool for Species Identification from Herbal Juices. DNA Barcodes 2013, 1, 35–38. [Google Scholar] [CrossRef]
  8. Sin, W.M.; Tam, Y.K.; Tsui, S.; Ng, C.; Mok, C.; Ha, W. An integrated and validated DNA-based protocol developed to fight against commercial frauds: A Case of Fraudulent Substitutions for Deer Products. DNA Barcodes 2013, 1, 27–34. [Google Scholar] [CrossRef]
  9. Vesterinen, E.J.; Lilley, T.; Laine, V.N.; Wahlberg, N. Next Generation Sequencing of Fecal DNA Reveals the Dietary Diversity of the Widespread Insectivorous Predator Daubenton’s Bat (Myotis daubentonii) in Southwestern Finland. PLoS ONE 2013, 8, e82168. [Google Scholar] [CrossRef] [PubMed]
  10. Garcia-Robledo, C.; Erickson, D.L.; Staines, C.L.; Erwin, T.L.; Kress, W.J. Tropical Plant-Herbivore Networks: Reconstructing Species Interactions Using DNA Barcodes. PLoS ONE 2013. [Google Scholar] [CrossRef] [PubMed]
  11. Ratnasingham, S.; Hebert, P.D.N. BOLD: The Barcode of Life Data System (www.barcodinglife.org). Mol. Ecol. Notes 2007, 7, 355–364. [Google Scholar] [CrossRef] [PubMed]
  12. Census of the Queensland Flora. Available online: http://www.qld.gov.au/environment/plants-animals/plants/herbarium/flora-census/index.html (accessed on 15 August 2015).
  13. Crisp, M.D.; Laffan, S.; Linder, H.P.; Monro, A. Endemism in the Australian flora. J. Biogeogr. 2001, 28, 183–198. [Google Scholar] [CrossRef]
  14. Wet Tropics Management Authority. State of the Wet Tropics Report 2013–2014. Wet Tropics Management Authority, Cairns, QLD, 2014. Available online: http://www.wettropics.gov.au/site/user-assets/docs/b5-wtma-report-2013-2014.pdf (accessed on 24 February 2016).
  15. CCDB Protocols, DNA Extraction. Available online: http://ccdb.ca/docs/CCDB_DNA_Extraction-Plants.pdf (accessed on 15 August 2015).
  16. BOLD Specimen Data Submission Protocol. Available online: http://www.boldsystems.org/index.php/resources/handbookchapter=3_submissions.html&section=data_submissions (accessed on 15 August 2015).
  17. CCDB Protocols, PCR Amplification. Available online: http://ccdb.ca/docs/CCDB_Amplification-Plants.pdf (accessed on 15 August 2015).
  18. CCDB Protocols, Sequencing. Available online: http://ccdb.ca/docs/CCDB_Sequencing.pdf (accessed on 15 August 2015).
  19. Australian Plant Name Index. Available online: https://www.anbg.gov.au/apni/ (accessed on 15 August 2015).
  20. Hilbert, D.W.; Graham, A.; Hopkins, M.S. Glacial and interglacial refugia within a long-term rainforest refugium: The Wet Tropics Bioregion of NE Queensland, Australia. Palaeogeography. Palaeoclimatol. Palaeoecol. 2007, 251, 104–118. [Google Scholar] [CrossRef]
  21. Chapple, D.G.; Hoskin, C.J.; Chapple, S.N.J.; Thompson, M.B. Phylogeographic divergence in the widespread delicate skink (Lampropholis delicata) corresponds to dry habitat barriers in eastern Australia. Bmc. Evol. Biol. 2011. [Google Scholar] [CrossRef] [PubMed]
  22. Moritz, C.; Hoskin, C.; Graham, C.H.; Hugall, A.; Moussalli, A. Historical biogeography, diversity and conservation of Australia’s tropical rainforest herpetofauna. Conserv. Biol. Ser. (Cambridge) 2005, 10, 243–264. [Google Scholar]
  23. Schneider, C.; Moritz, C. Rainforest refugia and evolution in Australia’s Wet Tropics. Proc. Natl. Acad. Sci. USA 1999, 266, 191–196. [Google Scholar]
  24. Hugall, A.; Moritz, C.; Moussalli, A.; Stanisic, J. Reconciling paleodistribution models and comparative phylogeography in the Wet Tropics rainforest land snail Gnarosophia bellendenkerensis (Brazier 1875). Proc. Natl. Acad. Sci. USA 2002, 99, 6112–6117. [Google Scholar] [CrossRef] [PubMed]
  25. Rossetto, M.; Crayn, D.; Ford, A.; Mellick, R.; Sommerville, K. The influence of environment and life-history traits on the distribution of genes and individuals: A Comparative Study of 11 Rainforest Trees. Mol. Ecol. 2009, 18, 1422–1438. [Google Scholar] [CrossRef] [PubMed]
  26. BOLD Systems. Public Data Portal—Record List. BATF Download URL: http://www.boldsystems.org/index.php/Public_BINSearch?searchtype=records (accessed on 24 February 2016).
  27. BOLD Systems. Data Portal. Available online: http://www.boldsystems.org (accessed on 24 February 2016).
Figure 1. Distribution of BATF DNA barcode records across the state of Queensland, Australia.
Diversity 08 00005 g001
Figure 2. Extent of rain forest and vine thicket in Queensland shown in green (A); distribution of samples of variable species spanning the Burdekin Gap in yellow (B); the Black Mountain Corridor (BMC) in blue (C); and the Normanby Gap in red (D).
Diversity 08 00005 g002
Table 1. Taxonomic distribution of angiosperm species in the BATF library listed alphabetically by order with total number of families, genera, species, and samples. Taxonomy follows APG III.
OrderFamiliesGeneraSpeciesSamples
Alismatales1555
Apiales4101326
Aquifoliales2445
Arecales19918
Asparagales3353641
Asterales3669
Austrobaileyales1113
Boraginales1447
Brassicales1112
Canellales1113
Caryophyllales3445
Celastrales18922
Commelinales2445
Cucurbitales25610
Dilleniales1234
Dioscoreales1111
Ericales61853112
Escalloniales1145
Fabales2283866
Gentianales44469134
Huerteales1113
Lamiales6232545
Laurales41354131
Liliales3446
Magnoliales3142575
Malpighiales154468129
Malvales3152461
Myrtales42767141
Oxalidales3112038
Pandanales1111
Paracryphiales1223
Piperales1136
Poales2262829
Proteales1182040
Ranunculales1889
Rosales6213665
Santalales49914
Sapindales651101237
Saxifragales1224
Solanales281017
Vitales1568
Zingiberales2666
Total1134968571572
Table 2. List of species showing infraspecific variation across the Burdekin Gap. Infraspecific variation (column 3) tallied by total number of base pair (bp) differences within each species across all three barcode loci.
FamilySpeciesInfra-Variation (bp)
EuphorbiaceaeCroton acronychioides F. Muell.2
MalvaceaeBrachychiton australis (Schott & Endl.) A. Terracc.1
MonimiaceaeWilkiea macrophylla (A.Cunn.) A. DC.1
PodocarpaceaePodocarpus grayae de Laub.1
RubiaceaeEveristia vacciniifolia (F. Muell.) S. T. Reynolds & R. J. F. Hend.4
Table 3. List of species showing infraspecific variation across the Black Mountain Corridor. Infraspecific variation (column 3) tallied by total number of base pair (bp) differences within each species across all three barcode loci.
FamilySpeciesInfra-Variation (bp)
AnnonaceaeGoniothalamus australis Jessup1
ApocynaceaeTabernaemontana pandacaqui Lam.4
CelastraceaeHippocratea barbata F. Muell.2
EupomatiaceaeEupomatia laurina R. Br.1
FabaceaeArchidendron ramiflorum (F. Muell.) Kosterm.1
FabaceaeAcacia celsa Tindale2
FabaceaeCastanospermum australe A. Cunn. ex Mudie8
FabaceaeEntada phaseoloides (L.) Merr.13
IcacinaceaeApodytes brachystylis F. Muell.2
LauraceaeCryptocarya lividula B. Hyland1
LauraceaeEndiandra impressicosta C. K. Allen1
LauraceaeEndiandra leptodendron B. Hyland1
LauraceaeCryptocarya bellendenkerana B. Hyland2
LauraceaeCryptocarya densiflora Blume5
LauraceaeEndiandra insignis (F. M. Bailey) F. M. Bailey5
LauraceaeEndiandra longipedicellata C. T. White & W. D. Francis5
LauraceaeBeilschmiedia bancroftii (F. M. Bailey) C. T. White15
MalvaceaeArgyrodendron peralatum (F. M. Bailey) Edlin ex J. H. Boas1
MonimiaceaeSteganthera laxiflora (Benth.) Whiffin & Foreman4
MoraceaeStreblus glaber (Merr.) Corner1
MyristicaceaeMyristica globosa Warb.1
MyrtaceaeSyzygium johnsonii (F. Muell.) B. Hyland1
MyrtaceaeSyzygium kuranda (F. M. Bailey) B. Hyland1
MyrtaceaeLeptospermum wooroonooran F. M. Bailey2
MyrtaceaeSphaerantia discolor Peter G. Wilson & B. Hyland4
MyrtaceaeRhodamnia sessiliflora Benth.9
PhyllanthaceaeGlochidion sessiliflorum var. pedicellatum Airy Shaw7
RhamnaceaeEmmenosperma cunninghamii Benth.1
RubiaceaeAtractocarpus fitzalanii (F. Muell.) Puttock2
RubiaceaeAtractocarpus hirtus (F. Muell.) Puttock2
RutaceaeMelicope stipitata C. T. White & W. D. Francis2
SapindaceaeHarpullia rhyticarpa C. T. White & W. D. Francis2
SapindaceaeDiploglottis harpullioides S. T. Reynolds3
SapindaceaeSarcotoechia cuneata Radlk.3
SapindaceaeDiploglottis smithii S. T. Reynolds5
SapindaceaeRhysotoechia robertsonii (F. Muell.) Radlk.6
SymplocaceaeSymplocos ampulliformis C. T. White5
Table 4. List of species showing infraspecific variation across the Normanby Gap. Infraspecific variation (column 3) tallied by total number of base pairs (bp) differences within each species across all three barcode loci.
FamilySpeciesInfra-Variation (bp)
AnnonaceaeMiliusa traceyi Jessup2
LauraceaeEndiandra longipedicellata C. T. White & W. D. Francis5
MalvaceaeArgyrodendron polyandrum L. S. Sm.1
MoraceaeFicus variegata Blume2
MyrtaceaeGossia retusa N. Snow & Guymer4
MyrtaceaeRhodomyrtus macrocarpa Benth.4
MyrtaceaeSyzygium fibrosum (F. M. Bailey) T. G. Hartley & L. M. Perry1
PhyllanthaceaeBreynia cernua (Poir.) Mull. Arg.3
ProteaceaeHelicia australasica F. Muell.3
RhamnaceaeEmmenosperma cunninghamii Benth.1
RubiaceaeIxora timorensis Decne.3
RutaceaeBosistoa brassii T. G. Hartley9
RutaceaeMedicosma sessiliflora (C. T. White) T. G. Hartley9

