Communication

EEG-Based Person Authentication Using a Fuzzy Entropy-Related Approach with Two Electrodes

The Center of Collaboration and Innovation, Jiangxi University of Technology, Nanchang 330098, China
*
Author to whom correspondence should be addressed.
Submission received: 6 October 2016 / Revised: 26 November 2016 / Accepted: 29 November 2016 / Published: 2 December 2016

Abstract

:
Person authentication, based on electroencephalography (EEG) signals, is one of the directions possible in the study of EEG signals. In this paper, a method for the selection of EEG electrodes and features in a discriminative manner is proposed. Given that EEG signals are unstable and non-linear, a non-linear analysis method, i.e., fuzzy entropy, is more appropriate. In this paper, unlike other methods using different signal sources and patterns, such as rest state and motor imagery, a novel paradigm using the stimuli of self-photos and non-self-photos is introduced. Ten subjects are selected to take part in this experiment, and fuzzy entropy is used as a feature to select the minimum number of electrodes that identifies individuals. The experimental results show that the proposed method can make use of two electrodes (FP1 and FP2) in the frontal area, while the classification accuracy is greater than 87.3%. The proposed biometric system, based on EEG signals, can provide each subject with a unique key and is capable of human recognition.

1. Introduction

With the development of technology, the need for biometric systems has increased, and biometrics has been widely used to improve personal authentication. In order to achieve a better performance for biometrics, many studies have used more and more biological information, such as the face [1], fingerprints [2], hand geometry [3], iris [4], voice [5], and so on, as tools for identity recognition. Electroencephalogram (EEG) activities in the brain have been considered as an external representation of the human mind. Every person possesses EEG signals in their brains, EEG characteristics vary from person to person, and EEG characteristics can be maintained, as they are relatively robust in certain situations. Therefore, EEG signals serve as a highly safe identifier with respect to personal authentication [6,7]. Numerous brain and psychological studies have used EEGs in order to study the neural activity underlying different emotional and psychological phenomena [8,9].
Our previous research introduced EEG signals into personal authentication based on a multi-feature fusion classification [10]. Paranjape et al. studied autoregressive (AR) modeling of EEG, in combination with a discriminant analysis for the different EEG signals of “eyes-open” and “eyes-closed”, and achieved a classification accuracy ranging between 49% and 85% [11]. Marcel et al. developed Gaussian mixture models based on motor imagery EEG signals in order to identify a person, and achieved a classification accuracy of 80.7% [12]. EEG signals caused by visual stimuli have been widely used in the field of biomedicine due to their simple operation and relatively stable features [13,14,15]. Does a visually evoked EEG signal differ from person to person? Does this difference reflect the identity characteristics of subjects? Due to these questions, thus, there are many researchers who use EEG signals, triggered by visual stimuli, for biometrics research [16]. Abo-Zahhad et al. compared the EEG signals of blinking [17]. Liew et al. proposed a biometrics system based on visually evoked EEG signals [18]. Yeom et al. proposed a new biometric system based on the neurophysiological features of face-specific visual self-representation in the human brain [19].
Recently, entropy has been broadly applied in analyses of EEG signals. Entropy is a non-linear index that reflects the degree of disorder in a given system, enabling it to be employed for studies of the chaotic behavior of the brain [20]. Furthermore, the concept of entropy has expanded into several different fields, and is used by many different researchers. For example, Liu et al. used approximate entropy and Kolmogorov complexity to characterize the complexity and irregularity of EEG data under different states of mental fatigue [21,22]. Song et al. proposed an optimized sample entropy algorithm for automatic monitoring of people with epilepsy [23]. Takahashi et al. examined multiscale entropy in EEG activity in drug-naïve schizophrenic subjects [24]. In addition, different types of entropy are also used often. For example, Kar’s study presented five types of entropies (Shannon’s entropy, two types of Rényi entropy, wavelet entropy, and Generalized Escort–Tsallis entropy) to consider the possible indicators of fatigue. All of these types of entropy have been used to detect EEG signals in normal and fatigued states [25,26,27]. These studies demonstrate that entropic analysis of the brain may have a promising role in the field of EEG-based evaluations.
It is clear that it is feasible to identify a person based on EEG signals, especially EEG signals evoked by visual stimulation. However, there are presently two major drawbacks for biometrics based on EEG signals: (i) The classification accuracy needs to be improved, for instance, in a biometric system using visual stimulation, accuracy rates vary between 70%–85%. The main reason is that the EEG noise is too great, and it is difficult to improve recognition rates. (ii) Data acquisition may be uncomfortable for the user when putting a considerable number of electrodes on a person’s head is required. In this case, is it necessary to put all of these electrodes on person’s head? Further, is it possible to place a smaller number of electrodes and still have better recognition?
These problems motivate our work and we aim to propose the idea of a feature extracted method and a feature selection method, in which the accuracy of the latter is used to guide the search for an optimal solution. Fuzzy entropy is highly sensitive to the information of randomness and is insensitive to noise [28], while sample entropy is very sensitive to the threshold value. Fuzzy entropy, extracted from EEG signals, is used for the automatic diagnosis of epilepsy [29]. Xiang et al. found that fuzzy entropy–based methods were superior to the sample entropy–based methods in the classification of seizures [30]. Recently, a few studies have reported on the detection of fatigued states using fuzzy entropy. Fuzzy entropy can be used for a better feature extraction with different classifiers [31]. Considering that the entropies of different electrodes play different roles in the dynamic changes of brain signals when people receive different stimuli, the Fisher distance is often used as the separable criterion for feature selection [32].
In this paper, a novel experimental paradigm, a feature extracted method based on fuzzy entropy and a feature selection method based on Fisher distance, is proposed. The use of the Fisher distance for EEG channel selection is due to the simple solutions in solving optimization problems.

2. Materials and Methods

2.1. Subjects

In order to present the effectiveness and feasibility of the proposed method, EEG data from 10 healthy Chinese subjects, between 19 and 40 years of age (mean 30.5, males), were collected. All subjects have normal or corrected-to-normal visual acuity. No subjects had neurological diseases or substance abuse. In the experiments, after understanding the experimental procedures and purpose, each subject made appropriate responses according to the test criteria and the indications on a computer screen, in a quiet room that was shielded from sound. The experiment was authorized by the Academic Ethics Committee of the Jiangxi University of Technology.

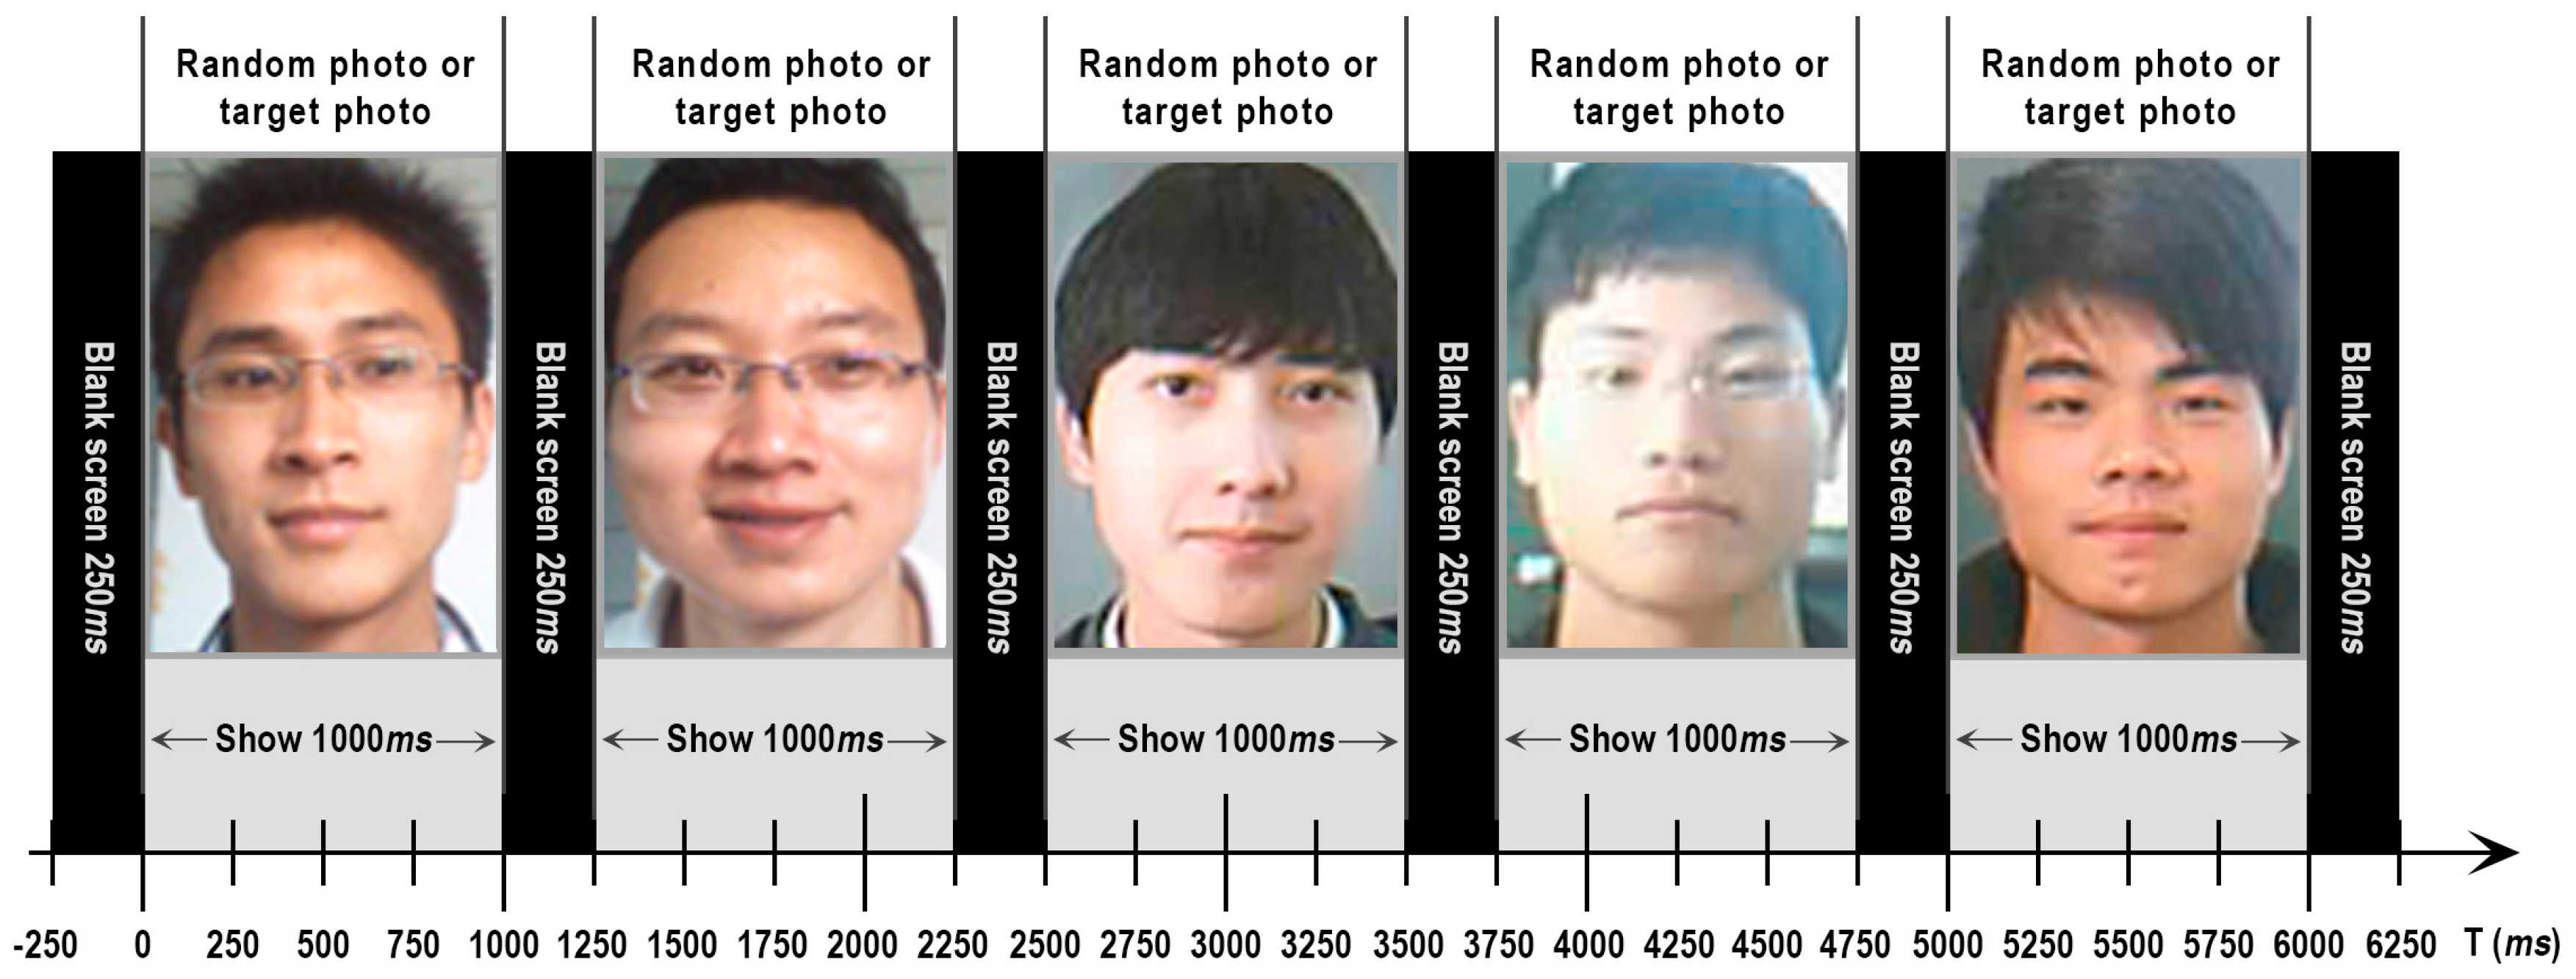
2.2. Experimental Paradigm

The experimental paradigm is shown in Figure 1, and is similar to examples in the literature [19]. In this paper, self-photo and non-self-photo are used as visual stimulation. A self-photo denotes a target subject’s own photo, while the non-self-photo includes other familiar or unfamiliar photos. Once an experiment starts, a blank, black screen is shown for 250 ms in order to inform the subject that the experiment will start. Each photo is randomly displayed on the screen for 1000 ms, followed by a black screen for 250 ms; in total, taking 1250 ms. A random sequence, including self-photo and non-self-photo stimuli, is given to the subject in order to prevent the subject from predicting the next stimulus. Throughout the experiment, the subject was required to fix his attention on the screen, and to classify the stimuli into either “self” or “non-self” as accurately as possible. Different photos were displayed on a computer screen using a stimulation program. The five photos were displayed a total of 370 times in each experiment, and each picture was shown the same number of times.
The photos presented to subjects as stimuli were acquired with the same illumination conditions for all subjects. The subjects were asked to make a neutral facial expression. All photos were scaled to 400 × 400 pixels. Figure 2 shows 18 examples of the 50 photos used in our experiments, and four non-self-photos and one self-photo were randomly selected from the photo gallery.

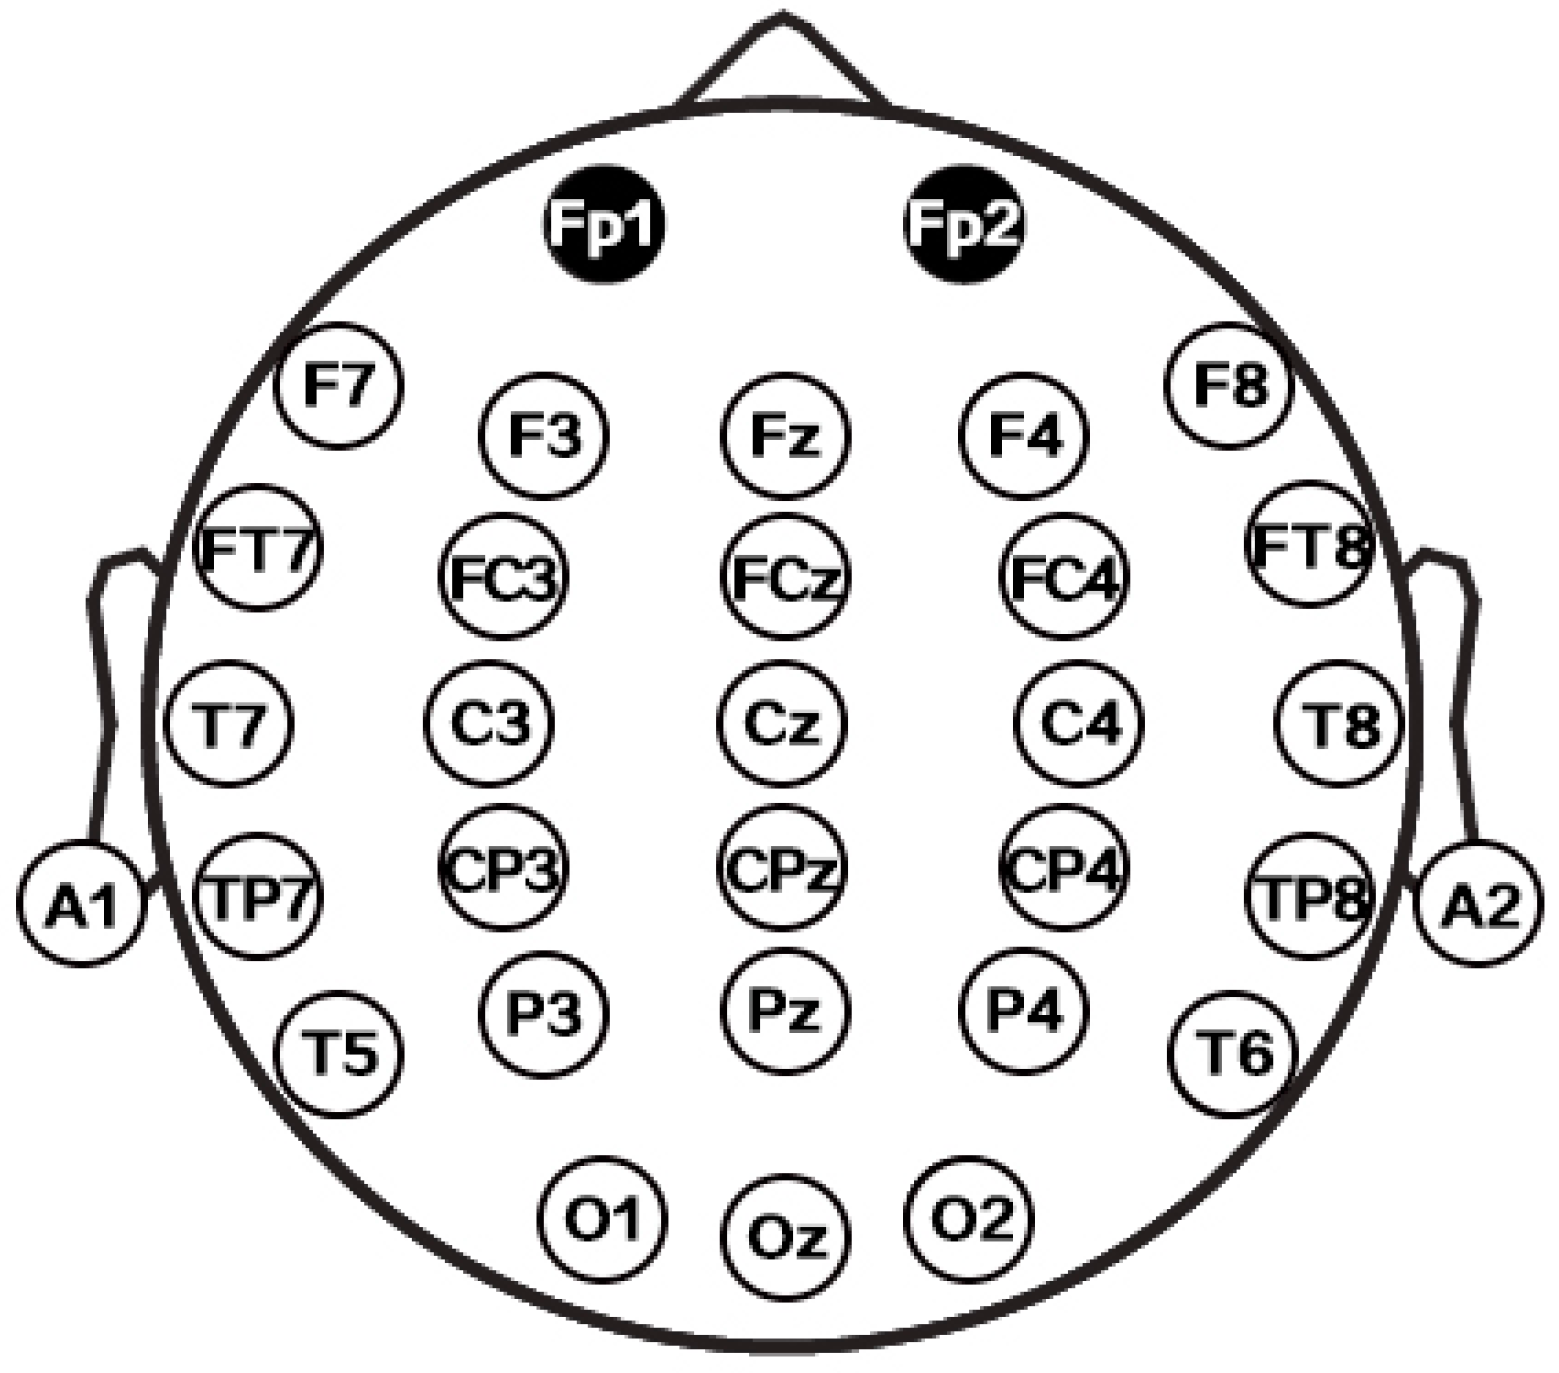
2.3. Data Acquisition

EEG data acquisition was performed using a Nuamps (Neuroscan) 40-channel EEG amplifier, and recorded using Scan 4.3 software; a reference electrode was placed on the right mastoid. The electrode labels are assigned using the International 10–20 System. The sampling rate was set at 1000 Hz. Band acquisition used was 200 Hz low-pass, 0.05 Hz high-pass, and 50 Hz notch filters.

2.4. Data Preprocessing

The purpose of data preprocessing is to obtain the data set of segmented EEG signals, including the removal of EOG (Electro-Oculogram) [33,34,35,36], epoch, filtering, etc. In this paper, data preprocessing is realized using Scan 4.3 software (Neuroscan). In this study, the continuous EEG signal had an intercept set at [–100, 899] ms according to the time of the photo being displayed. There are two datasets, the self-photo dataset and non-self-photo dataset.

2.5. Feature Extraction

Feature extraction mainly includes the establishment of different types of data sets, calculation of fuzzy entropy, feature analysis, calculation of Fisher distance, etc. Two types of EEG data set were analyzed, responses to self-photo and non-self-photos. In order to realize personal authentication, the fuzzy entropy of the EEG signal is calculated. The calculation of fuzzy entropy is described as follows [30]:
If there is a time series set of EEG, { a ( i ) :   i [ 1 , , N ] } , where N is the sampling frequency and we used 1000 Hz of the sampling rate, this set can be reconstructed to the m-dimensional vector as follows:
U i m = { u ( i ) , u ( i + 1 ) , , u ( i + m 1 ) } = { a ( i ) , a ( i + 1 ) , , a ( i + m 1 ) } a 0 ( i )    ( i = 1 , , N m + 1 )
where { u ( i ) , u ( i + 1 ) , , u ( i + m 1 ) } , { a ( i ) , a ( i + 1 ) , , a ( i + m 1 ) } represents m consecutive values from the i-th point, and a 0 ( i ) represents the average of the m values. The reconstruction vector can produce a maximum distance, which can be defined as follows:
d i j m = d [ U i m , U j m ] = max { | u ( i + k ) u ( j + k ) | } k ( 0 , m 1 ) ,   i j
then, the similarity degree, D i j m , of U i m , U j m can be defined as follow:
D i j m = μ ( d i j m , n , r ) = exp ( ( d i j m ) n / r )
where n and r are the gradient and width of the exponential function, respectively. The larger the width, the more information may be missed. However, if it is underestimated, the sensitivity to noise will be increased significantly [37,38]. In this paper, n = 2 and r = 0.3 × SD (where SD is standard deviation of the time series) as can be found in the literature [37,38]. Thus, the function is defined as follows:
φ m ( n , r ) = 1 N m i = 1 N m ( 1 N m 1 j = 1 j i N m D i j m )
repeating the above-mentioned method, and obtaining a set of m + 1 dimensional vectors. Finally, according to the above-mentioned functions, the definition of fuzzy entropy is as follows [30]:
FuzzyEn ( m , n , r ) = lim N [ ln φ m ( n , r ) ln φ m + 1 ( n , r ) ]
when N is limited, the fuzzy entropy for the time series with a sequence length of N can be defined as:
FuzzyEn = [ ln φ m ( n , r ) ln φ m + 1 ( n , r ) ]
For that the brain signal sample of each subject given is a 30 × 1000 matrix (30 electrodes and 1000 Hz of sampling rate), the numerical values of the 30-D vectors for person authentication investigated in the current identification system are obtained after the above methods of calculating the fuzzy entropy for each electrode.
In order to analyze the features of EEG signals of different electrodes, the Fisher distance method is applied. Fisher distance, which is often applied in classification research to represent the dissimilarity between classes, is used in this study. Fisher distance is proportional to the dissimilarity between classes; the greater the dissimilarity, the greater the Fisher distance, and vice versa. The calculation of Fisher distance is as follows [39]:
F = ( μ 1 μ 2 ) 2 σ 1 2 + σ 2 2
where F is Fisher distance, μ and σ are mean and variance, respectively, and the subscripts, 1 and 2, represent two types, respectively. In this study, for a n × m entropy feature matrix can be obtained (n labeled as the electrode and m labeled as the sample), the fisher distance can be calculated on each row of the same electrode in this matrix based on the subjects responded to self- and non-self photos.

2.6. Classification

After feature extraction, a back propagation (BP) neural network was used as the classification algorithm. The BP neural network is designed with three layers: Input, intermediate, and output. The input layer are the extracted features, based on fuzzy entropy, and the output layer is the result of the input vector, which is calculated with an output of 1 representing the target subject, and 0 representing the non-target subject. The BP function was arctan and the approximation limit was 10–6. In addition, the original dataset was randomly divided into two groups, one group (80%) was the training dataset and the other (20%) as the testing dataset, and are used to train and test the BP neural network classifier, respectively.
For input parameters, the 30-D vectors of each sample can be obtained by calculating the fuzzy entropy feature of each channel. For output parameters in the training data, 1 represents the target subject, and 0 represents the non-target subject. And for the testing data, the output parameter defined as x, when (|1 − x|/|x|) < 1, the output is 1 otherwise 0.

2.7. Performance Metrics

To provide a more intuitive and easier-to-understand method to measure the prediction quality, the following equation set is used in the literature for examining performance quality:
{ F R R = F N T P + F N F A R = F P F P + T N
where TP (true positive) represents the number of self-photo EEG signals identified as such; TN (true negative), the number of non-self-photo EEG signals classified as such; FP (false positive), the number of non-self-photo EEG signals recognized as such; FN (false negative), the number of self-photo EEG signals distinguished as non-self-photo EEG signals; FRR, the false reject rate; and FAR, the false accept rate.

3. Results

Biometric research, based on differences in EEG signals evoked by stimuli of self- and non-self-photos, is a new research direction. The purpose of this paper is to analyze the EEG signals triggered by the two different stimuli, to compare their fuzzy entropy features, and to perform personal authentication through the use of a BP neural network. The results of this study follow.

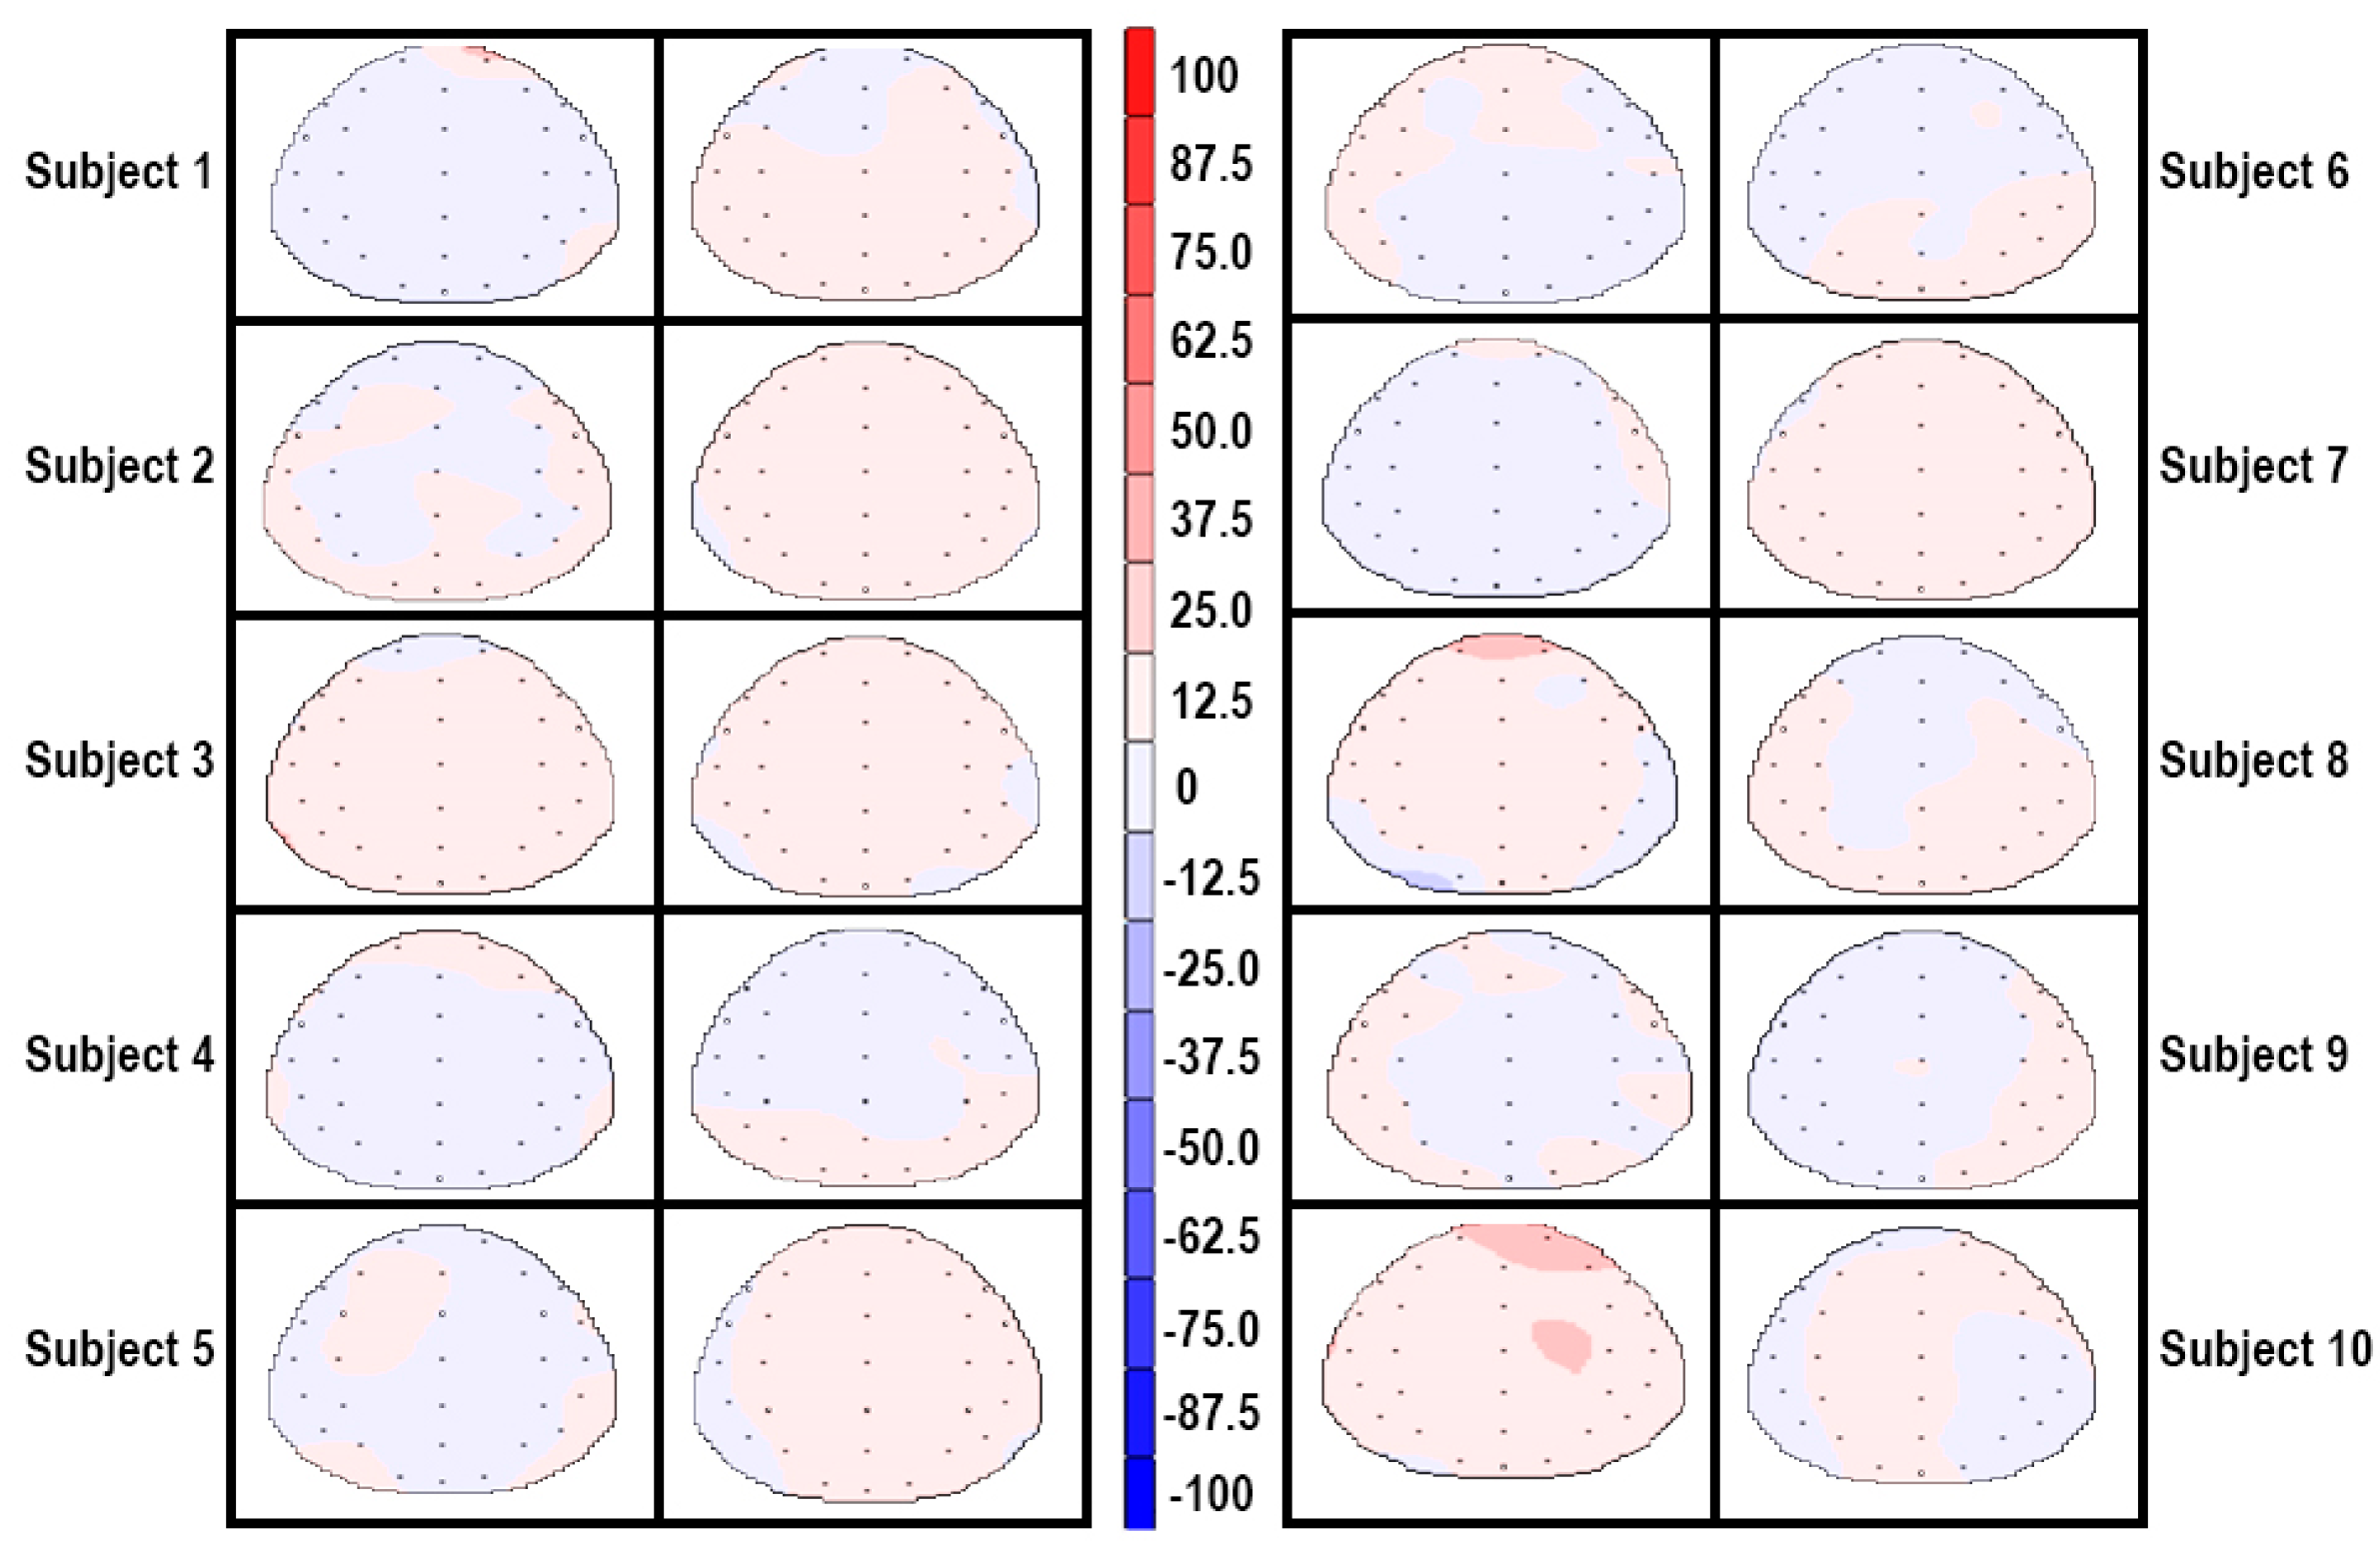
3.1. Brain Topographic Map

Using Scan 4.3 software, an overlay of the brain area of subjects’ EEG signals was analyzed based on a theoretical analysis of event-related potentials. In this paper, two types of photos were used as stimuli, while two types of EEG signals corresponding with the two stimuli were superimposed in the time domain. Figure 3 shows the brain topography maps of 10 subjects with duration of 300 ms from the onset of the stimulus. Two brain topography maps correspond to each subject, where the left is the response to the self-photo, and the right is the response to the non-self-photo. Figure 4 describes the locations of the electrodes on the surface of the head (International 10–20 System).

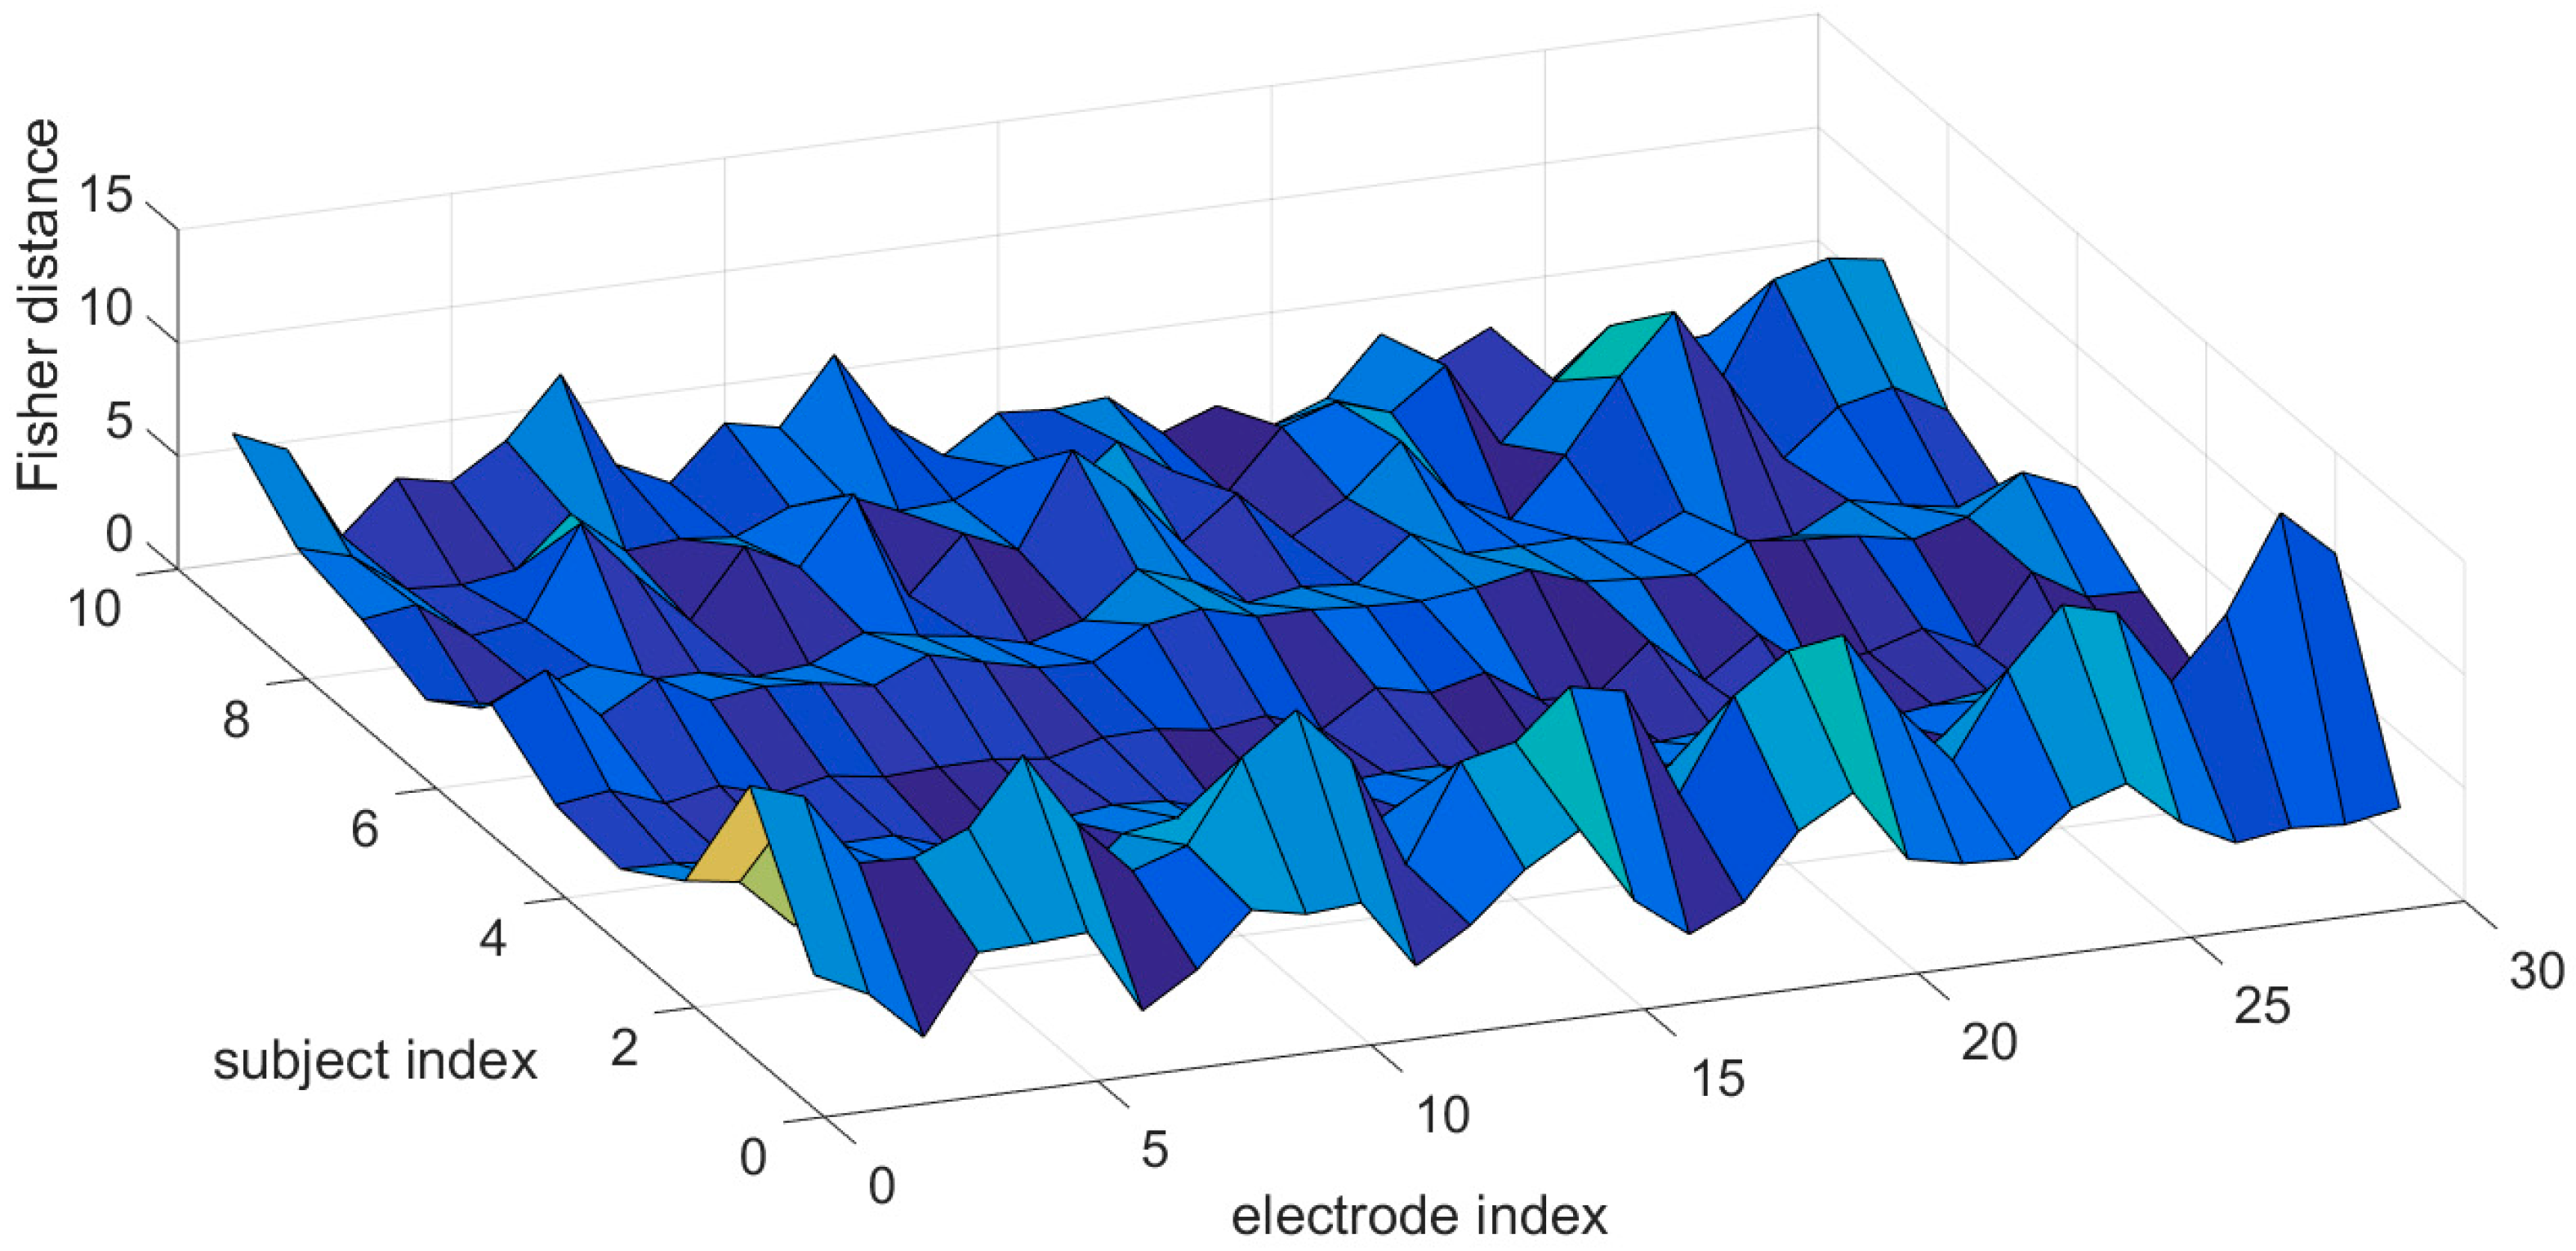
3.2. Feature Selection

The Fisher distance can be used to describe the discrimination between two types of features. In this paper, the fuzzy entropy features of different electrodes were analyzed. The electrode distribution is shown in Figure 4, along with the EEG signals from 30 electrodes that were collected in each experiment. Figure 5 shows a comparison of the Fisher distance of the fuzzy entropy features of different subjects and different electrodes, where the x axis and y axis represent the subject index and electrode index, respectively. The z axis is the value of the Fisher distance. Electrode indexes 1–30 represents FP1, FP2, F7, F3, F2, F4, F8, FT7, FC3, FCZ, FC4, FT8, T3, C3, CZ, C4, T4, TP7, CP3, CPZ, CP4, TP8, T5, P3, PZ, P4, T6, O1, O2, and O3, respectively.

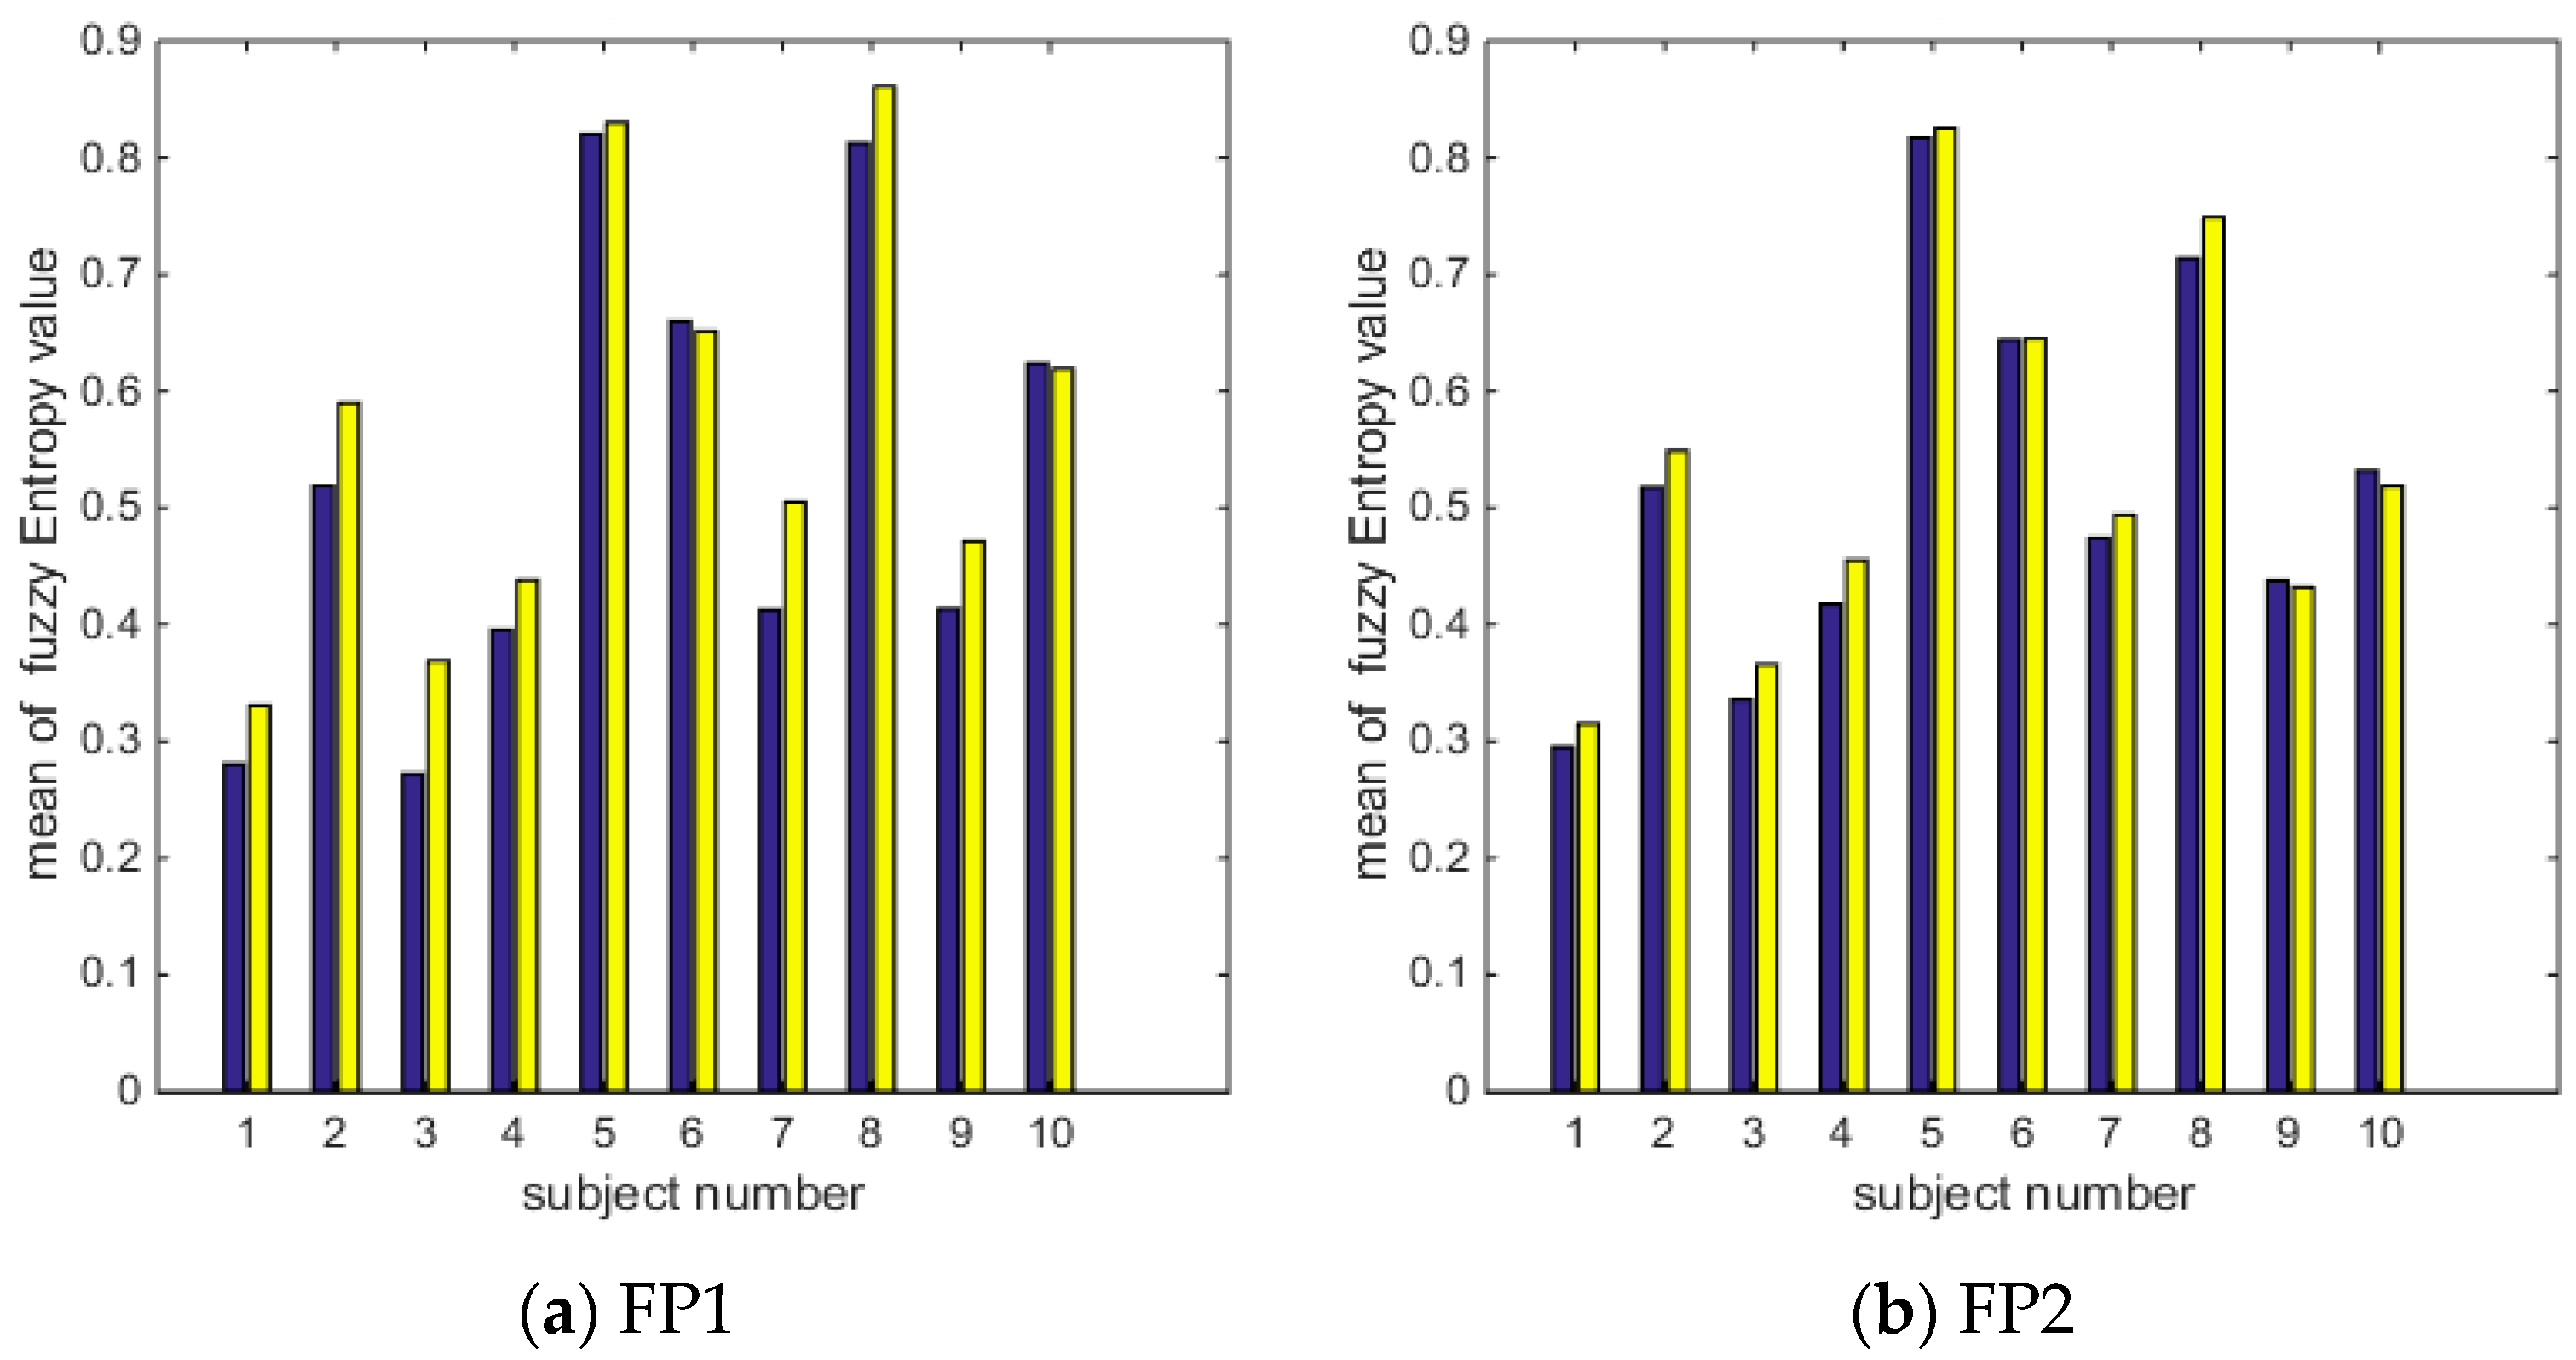
3.3. Feature Analysis

From the degree of difficulty of data collection, electrodes FP1 and FP2 are relatively appropriate as there is an absence of thick hair covering this region, unlike other brain regions. EEG acquisition in FP1 and FP2 can be collected directly without the help of an ionosphere layer. Therefore, EEG signals in the frontal area can easily be collected by mobile or household EEG acquisition devices available on the market. Figure 6 shows the comparison of the fuzzy entropy values of 10 subjects relative to the self-photo and non-self-photo, where Figure 6a,b show a comparison of the mean value of the fuzzy entropy in electrodes FP1 and FP2, respectively. The x axis and the y axis represent the subject index and mean value of the fuzzy entropy. Each subject corresponds to two bars, the blue bar related to the self-photo dataset and a yellow bar for the non-self-photo dataset.

3.4. Classification Results

How to properly examine prediction quality is a key for developing a new paradigm and estimating its potential value in applications. The jackknife test has been widely recognized and increasingly adopted by research to examine the quality of various methods [40,41]. The success rates obtained by the jackknife test in identifying self-photo EEG data signals or non-self-photo EEG data signals are given in Table 1, where we can see that the average success rate of the EEG data signals using our proposed personal authentication method, based on fuzzy entropy, in electrodes FP1 and FP2 was about 87.3%. Among the 10 subjects, the highest classification accuracy was 92%, and the lowest was 84%, with a low false reject rate (FRR) of 5.6%, and a slightly low false accept rate (FAR) of 5.5%. In contrast, the corresponding success rates obtained by other researchers, shown in Table 2, are no more than 87.3%, including a success rate of less than 80% achieved by Miyamoto [42]. Furthermore, its corresponding FAR and FRR are all significantly higher than 6%, which implies that our proposed method possess better stability. It is feasible to use fuzzy entropy to identify person authentication based on the electrodes FP1 and FP2 because of the remarkably improved success rates. It is anticipated that this research will become a useful method for both basic research and personal identification in relevant areas, or, at the very least, it will play a complementary role to existing methods.

4. Discussion

Overlay analysis of the original signal is an important analysis method for visual event–triggered EEG signals, and intuitive changes of brain signals can be shown in brain topography maps. Figure 3 shows a topographic comparison of the brains of 10 subjects with two different stimuli. As can be seen from Figure 3, some subjects, such as subjects 1, 3, 4, 6, 7, 8, and 10, have certain differences in electrical activity produced in the frontal area of the brain. Additionally, the brain signal energy of the prefrontal area was obviously strong when the subject responded to self-photos, but it did not change much when the subject responded to non-self photos. These differences also exist in the Fisher distance map shown in Figure 5. In electrodes FP1 and FP2, the Fisher distance between the two classes is larger, so the use of electrical brain signal characteristics from the frontal region to authenticate a person is feasible.
Due to the fact that different brain areas have different functions, it may affect the classification accuracy as there are redundant features created by partial brain electrode areas for person authentication in this study. Table 2 shows the success rates of the whole brain area for each subject, the best success rates based on the best combination of electrodes for each subject and the success rates based on the FP1 and FP2 electrodes. It can be observed that the whole brain electrode areas were used to extract features, but could not obtain the best success rates. For the average accuracy, the best accuracy of 92.9% is higher than that of the FP1 and FP2 electrodes and also higher than that of the whole brain electrode areas. Therefore, it found that each subject have their own priority electrodes to hit the best classification accuracy for identifying person authentication. However, considering the robustness of this classification method about each subject, it may have potential applications of just using the prefrontal region electrode FP1 and FP2.
In recent years, more and more teams have worked on this problem, and using EEG brain signals to study personal authentication has yielded a great deal of research results. Related classification performances adopted in previous studies are listed in Table 3. As we can see, the average accuracy, based on all the electrodes, is 82.35%, including a 64-channel EEG data result. Meanwhile, Yeom [19] only used five electrodes, based on dynamic features, to identify personal authentication and obtained an accuracy of 86.3%. However, the corresponding FAR and FRR are all significantly higher than 10%, which implies that they contain high false positives and negatives of the reported inaccuracies. Meanwhile, the average accuracy of the different data sets collected from FP1 and FP2 in this paper is higher than 86.3%, and has a lower FRR of 5.6% and a slightly lower FAR of 5.5%, which implies that it possess better stability. For the above-mentioned methods, FuzzyEn-based classification greatly enhanced the detection performance. Considering the convenience of data acquisition, the present results imply that FP1 and FP2 electrode data, with analysis using FuzzyEn-based classification, are suitable for research in the identification of personal authentication.
One important point concerns the electrodes selected by the Fisher distance. This process achieved similar recognition rates while requiring fewer electrodes. It is important to highlight that one process might obtain better recognition rates using a smaller number of electrodes; thus, the main goal of this work is to evaluate the Fisher distance in the context of electrode selection, as well as to show the importance of selecting electrodes in order to make such an approach more convenient and cheaper. The problem of channel selection in EEG-based biometric personal authentication was addressed.

5. Conclusions

The experimental results showed that a feature extraction method, based on fuzzy entropy, and a feature selection method, based on Fisher distance, can obtain higher classification rates using fewer electrodes located in the frontal region. This is an interesting observation which means that we can select electrodes close to the frontal region, where there is no hair, which are easy to place and have better recognition rates. It is important to emphasize that reducing the number of EEG electrodes while keeping higher classification rates is crucial for the effective use of EEG in biometric applications. In addition, the selected electrodes, FP1 and FP2, were placed in the frontal region. Our future work will involve combining different entropies to perform feature extraction and electrode selection in order to improve the overall authentication performance while selecting fewer electrodes, and will focus on analyzing the efficiency and convenience for each person for a number of times for identifying person authentication.

Acknowledgments

This work was supported by the Project of Department of Science and Technology, Jiangxi Province (No. 20151BBE50079 and No. 20142BAB207008), and the Project of Department of Education, Jiangxi Province (No. GJJ151146).

Author Contributions

Jianfeng Hu conceived and designed the experiments; Zhendong Mu and Jianliang Min performed the experiments and analyzed the data; all authors wrote the paper. All the authors have read and approved the final manuscript.

Conflicts of Interest

The authors declare no conflict of interest.

References

  1. Duc, B.; Fischer, S.; Bigun, J. Face authentication with Gabor information on deformable graphs. IEEE Trans. Image Process. 1999, 8, 504–516. [Google Scholar] [CrossRef] [PubMed]
  2. Karu, K.; Jain, A.K. Fingerprint classification. Pattern Recognit. 1996, 29, 389–404. [Google Scholar] [CrossRef]
  3. Covavisaruch, N.; Prateepamornkul, P.; Ruchikachorn, P.; Taksaphan, P. Personal verification and identification using hand geometry. ECTI Trans. Comput. Inf. Technol. 2005, 1, 457–464. [Google Scholar]
  4. Kumar, A.; Passi, A. Comparison and combination of iris matchers for reliable personal authentication. Pattern Recognit. 2010, 43, 1016–1026. [Google Scholar] [CrossRef]
  5. Frischholz, R.W.; Dieckmann, U. BiolD: A multimodal biometric identification system. Computer 2000, 33, 64–68. [Google Scholar] [CrossRef]
  6. Pham, T.; Ma, W.; Tran, D.; Nguyen, P.; Phung, D. A study on the feasibility of using EEG signals for authentication purpose. In Neural Information Processing; Springer: Berlin/Heidelberg, Germany, 2013. [Google Scholar]
  7. La Rocca, D.; Campisi, P.; Scarano, G. EEG biometrics for individual recognition in resting state with closed eyes. In Proceedings of the International Conference of the Biometrics Special Interest Group, Darmstadt, Germany, 6–7 September 2012.
  8. Aboalayon, K.A.I.; Faezipour, M.; Almuhammadi, W.S.; Moslehpour, S. Sleep Stage Classification Using EEG Signal Analysis: A Comprehensive Survey and New Investigation. Entropy 2016, 18, 272. [Google Scholar] [CrossRef]
  9. García-Martínez, B.; Martínez-Rodrigo, A.; Cantabrana, R.Z.; García, J.M.P.; Alcaraz, R. Application of Entropy-Based Metrics to Identify Emotional Distress from Electroencephalographic Recordings. Entropy 2016, 18, 221. [Google Scholar] [CrossRef]
  10. Hu, J.F.; Mu, Z.D.; Wang, P. Multi-feature authentication system based on event evoked electroencephalogram. J. Med. Imaging Health Inf. 2015, 5, 862–870. [Google Scholar]
  11. Paranjape, R.B.; Mahovsky, J.; Benedicenti, L.; Koles, Z. The electroencephalogram as a biometric. In Proceedings of the 2011 Canadian Conference on Electrical and Computer Engineering, Toronto, ON, Canada, 13–16 May 2001.
  12. Marcel, S.; Millán, J.R. Person authentication using brainwaves (EEG) and maximum a posteriori model adaptation. IEEE Trans. Pattern Anal. Mach. Intell. 2007, 29, 743–752. [Google Scholar] [CrossRef] [PubMed]
  13. Phothisonothai, M. An investigation of using SSVEP for EEG-based user authentication system. In Proceedings of the 2015 Asia-Pacific Signal and Information Processing Association Annual Summit and Conference, Hong Kong, China, 16–19 December 2015; pp. 923–926.
  14. Kumari, P.; Kumar, S.; Vaish, A. Feature extraction using emprical mode decomposition for biometric system. In Proceedings of the 2014 International Conference on Signal Propagation and Computer Technology, Ajmer, India, 12–13 July 2014; pp. 283–287.
  15. Das, R.; Maiorana, E.; La Rocca, D.; Campisi, P. EEG biometrics for user recognition using visually evoked potentials. In Proceedings of the 2015 International Conference of the Biometrics Special Interest Group, Darmstadt, Germany, 9–11 September 2015.
  16. Barbosa, I.B.; Vilhelmsen, K.; van der Meer, A.; van der Weel, R.; Theoharis, T. EEG Biometrics: On the Use of Occipital Cortex Based Features from Visual Evoked Potentials. Available online: http://ojs.bibsys.no/index.php/NIK/article/view/243/206 (accessed on 30 November 2016).
  17. Abo-Zahhad, M.; Ahmed, S.M.; Abbas, S.N. A new multi-level approach to EEG based human authentication using eye blinking. Pattern Recognit. Lett. 2016, 82, 216–225. [Google Scholar] [CrossRef]
  18. Liew, S.H.; Choo, Y.H.; Low, Y.F.; Yusoh, Z.I.M. Identifying Visual Evoked Potential (VEP) Electrodes Setting for Person Authentication. Int. J. Adv. Soft Comput. Appl. 2015, 7, 85–99. [Google Scholar]
  19. Yeom, S.K.; Suk, H.I.; Lee, S.W. Person authentication from neural activity of face-specific visual self-representation. Pattern Recognit. 2013, 46, 1159–1169. [Google Scholar] [CrossRef]
  20. Sharma, R.; Pachori, R.B.; Acharya, U.R. Application of Entropy Measures on Intrinsic Mode Functions for the Automated Identification of Focal Electroencephalogram Signals. Entropy 2015, 17, 669–691. [Google Scholar] [CrossRef]
  21. Liu, J.; Zhang, C.; Zheng, C. EEG-based estimation of mental fatigue by using KPCA–HMM and complexity parameters. Biomed. Signal Process. Control 2010, 5, 124–130. [Google Scholar] [CrossRef]
  22. Chai, R.; Tran, Y.; Naik, G.R.; Nguyen, T.N.; Ling, S.H.; Craig, A.; Nguyen, H.T. Classification of EEG based-mental fatigue using principal component analysis and Bayesian neural network. In Proceedings of the 38th Annual International Conference of Engineering in Medicine and Biology Society, Orlando, FL, USA, 16–20 August 2016; pp. 4654–4657.
  23. Song, Y.; Crowcroft, J.; Zhang, J. Automatic epileptic seizure detection in EEGs based on optimized sample entropy and extreme learning machine. J. Neurosci. Method 2012, 210, 132–146. [Google Scholar] [CrossRef] [PubMed]
  24. Takahashi, T.; Cho, R.Y.; Mizuno, T.; Kikuchi, M.; Murata, T.; Takahashi, K.; Wada, Y. Antipsychotics reverse abnormal EEG complexity in drug-naïve schizophrenia: A multiscale entropy analysis. Neuroimage 2010, 51, 173–182. [Google Scholar] [CrossRef] [PubMed]
  25. Kar, S.; Bhagat, M.; Routray, A. EEG signal analysis for the assessment and quantification of driver’s fatigue. Transp. Res. F 2010, 13, 297–306. [Google Scholar] [CrossRef]
  26. Chai, R.; Naik, G.; Nguyen, T.N.; Ling, S.; Tran, Y.; Craig, A.; Nguyen, H. Driver fatigue classification with independent component by entropy rate bound minimization analysis in an EEG-based system. IEEE J. Biomed. Health Inf. 2016. [Google Scholar] [CrossRef] [PubMed]
  27. Chai, R.; Naik, G.R.; Tran, Y.; Ling, S.H.; Craig, A.; Nguyen, H.T. Classification of driver fatigue in an electroencephalography-based countermeasure system with source separation module. In Proceedings of the 37th Annual International Conference of the IEEE Engineering in Medicine and Biology Society, Milano, Italy, 25–29 August 2015; pp. 514–517.
  28. Chakraborty, B.; Bhattacharyya, S.; Dutta, P. An Unsupervised Video Shot Boundary Detection Technique Using Fuzzy Entropy Estimation of Video Content. In Handbook on Soft Computing for Video Surveillance; CRC Press: Boca Raton, FL, USA, 2012; pp. 237–253. [Google Scholar]
  29. Acharya, U.R.; Fujita, H.; Sudarshan, V.K.; Bhat, S.; Koh, J.E.W. Application of entropies for automated diagnosis of epilepsy using EEG signals: A review. Knowl. Based Syst. 2015, 88, 85–96. [Google Scholar] [CrossRef]
  30. Xiang, J.; Li, C.; Li, H.; Cao, R.; Wang, B.; Han, X.; Chen, J. The detection of epileptic seizure signals based on fuzzy entropy. J. Neurosci. Methods 2015, 243, 18–25. [Google Scholar] [CrossRef] [PubMed]
  31. Luukka, P. Feature selection using fuzzy entropy measures with similarity classifier. Expert Syst. Appl. 2011, 38, 4600–4607. [Google Scholar] [CrossRef]
  32. Yang, B.; Li, H.; Wang, Q.; Zhang, Y. Subject-based feature extraction by using fisher WPD-CSP in brain–computer interfaces. Comput. Methods Programs Biomed. 2016, 129, 21–28. [Google Scholar] [CrossRef] [PubMed]
  33. Bhardwaj, S.; Jadhav, P.; Adapa, B.; Acharyya, A.; Naik, G.R. Online and automated reliable system design to remove blink and muscle artefact in EEG. In Proceedings of the 37th Annual International Conference of the IEEE Engineering in Medicine and Biology Society, Milano, Italy, 25–29 August 2015; pp. 6784–6787.
  34. Kwon, Y.; Kim, K.I.; Tompkin, J.; Kim, J.H.; Theobalt, C. Efficient learning of image super-resolution and compression artifact removal with semi-local Gaussian processes. IEEE Trans. Pattern Anal. Mach. Intell. 2015, 37, 1792–1805. [Google Scholar] [CrossRef] [PubMed]
  35. Feis, R.A.; Smith, S.M.; Filippini, N.; Douaud, G.; Dopper, E.G.; Heise, V.; Trachtenberg, A.J.; van Swieten, J.C.; van Buchem, M.A.; Rombouts, S.A. ICA-based artifact removal diminishes scan site differences in multi-center resting-state fMRI. Front. Neurosci. 2015, 9, 395. [Google Scholar] [CrossRef] [PubMed]
  36. Jadhav, P.; Shanamugan, D.; Chourasia, A.; Ghole, A.; Acharyya, A.; Naik, G. Automated detection and correction of eye blink and muscular artefacts in EEG signal for analysis of Autism Spectrum Disorder. In Proceedings of the 36th Annual International Conference of the Engineering in Medicine and Biology Society, Chicago, IL, USA, 26–30 August 2014; pp. 1881–1884.
  37. Bao, X.C.; Wang, J.L.; Hu, J.F. Method of individual identification based on electroencephalogram analysis. In Proceedings of the 2009 International Conference on New Trends in Information and Service Science, Beijing, China, 30 June–2 July 2009; pp. 390–393.
  38. Yentes, J.M.; Hunt, N.; Schmid, K.K.; Kaipust, J.P.; McGrath, D.; Stergiou, N. The appropriate use of approximate entropy and sample entropy with short data sets. Ann. Biomed. Eng. 2013, 41, 349–365. [Google Scholar] [CrossRef] [PubMed]
  39. Chen, W.; Wang, Z.; Xie, H.; Yu, W. Characterization of surface EMG signal based on fuzzy entropy. IEEE Trans. Neural Syst. Rehabil. Eng. 2007, 15, 266–272. [Google Scholar] [CrossRef] [PubMed]
  40. Ince, N.F.; Arica, S.; Tewfik, A. Classification of single trial motor imagery EEG recordings with subject adapted non-dyadic arbitrary time–frequency tilings. J. Neural Eng. 2006, 3, 235–239. [Google Scholar] [CrossRef] [PubMed]
  41. Hosseinifard, B.; Moradi, M.H.; Rostami, R. Classifying depression patients and normal subjects using machine learning techniques and nonlinear features from EEG signal. Comput. Methods Programs Biomed. 2013, 109, 339–345. [Google Scholar] [CrossRef] [PubMed]
  42. Miyamoto, C.; Baba, S.; Nakanishi, I. Biometric person authentication using new spectral features of electroencephalogram (EEG). In Proceedings of the 2008 International Symposium on Intelligent Signal Processing and Communications Systems, Bangkok, Thailand, 8–11 February 2009.
Figure 1. A schematic diagram of the proposed experimental paradigm.
Entropy 18 00432 g001
Figure 2. Photo gallery used in the experiment.
Entropy 18 00432 g002
Figure 3. Brain topography map.
Entropy 18 00432 g003
Figure 4. Position of electrodes according to International 10–20 System standards.
Entropy 18 00432 g004
Figure 5. Fisher distance map.
Entropy 18 00432 g005
Figure 6. Comparison of fuzzy entropy value related to self-photo and non-self-photo: (a) an entropy-based comparison of each subject relative to the self-photo and non-self-photo in electrodes FP1; (b) an entropy-based comparison of each subject relative to the self-photo and non-self-photo in electrodes FP2.
Entropy 18 00432 g006
Table 1. Performance of the proposed person authentication method.
SubjectsAccuracy (%)FAR (%)FRR (%)
185.48.06.4
292.13.14.6
384.06.89.0
483.97.18.9
590.06.63.3
684.63.85.7
786.55.77.6
888.24.55.2
987.36.23.1
1090.73.62.4
Mean (Std)87.3 (2.9)5.5 (1.7)5.6 (2.4)
Mean is the average; Std is the standard deviation.
Table 2. Performance of different brain areas.
SubjectsAccuracy of the Whole BrainThe Best AccuracyAccuracy of FP1 and FP2FAR (%)FRR (%)
189.891.385.48.06.4
296.597.192.13.14.6
384.590.084.06.89.0
493.194.683.97.18.9
588.592.290.06.63.3
692.794.584.63.85.7
785.588.586.55.77.6
891.493.488.24.55.2
990.392.387.36.23.1
1092.795.190.73.62.4
Mean (Std)90.5 (3.6)92.9 (2.5)87.3 (2.9)5.5 (1.7)5.6 (2.4)
Mean is the average; Std is the standard deviation.
Table 3. Performance comparison of the previous works.
AuthorMethodStimulus TypeElectrodesAccuracy (%)FAR (%)FRR (%)
Yeom [19]Dynamic featureVisual stimuli (self and non-self faces)Selected five electrodes86.313.913.9
Liew [18]Fuzzy-Rough Nearest NeighborPictures6485.2NANA
Abo-Zahhad [17]Multi-levelrelaxation, visual stimulation, and eye blinkingAll84.5NANA
Miyamoto [42]Alpha rhythmRest (with closed eyes)All79.021.021.0
Marcel [12]Gaussian mixture modelsMotor imageryAll80.714.424.3
This paperFuzzy EntropyVisual Stimuli (self-photos and non-self-photos)Two electrodes (FP1 + FP2)87.35.55.6

