Article

Identification and Expression of NAC Transcription Factors of Vaccinium corymbosum L. in Response to Drought Stress

Key Laboratory of Forest Silviculture and Conservation of the Ministry of Education, The College of Forestry, Beijing Forestry University, 35 Qinghua East Road, Beijing 100083, China
*
Author to whom correspondence should be addressed.
Submission received: 23 October 2019 / Revised: 25 November 2019 / Accepted: 26 November 2019 / Published: 1 December 2019
(This article belongs to the Special Issue Forest Genetics and Tree Improvement)

Abstract

:
Research Highlights: Phenotypic changes and expression profiles, phylogeny, conserved motifs, and expression correlations of NAC (NAM, ATAF1, ATAF2 and CUC2) transcription factors (TFs) in blueberry genome were detected under drought stress, and the expression patterns and functions of 12 NACs were analyzed. Background and Objectives: Blueberry is an important shrub species with a high level of flavonoids in fruit, which are implicated in a broad range of health benefits. However, the molecular mechanism of this shrub species in response to drought stress still remains elusive. NAC TFs widely participate in stress tolerance in many plant species. The characterization and expression profiles of NAC TFs were analyzed on the basis of genome data in blueberry when subjected to drought stress. Materials and Methods: Combined with the analysis of chlorophyll a fluorescence and endogenous phytohormones, the phenotypic changes of blueberry under drought stress were observed. The phylogenetic tree, conserved motifs, differently expressed genes, and expression correlation were determined by means of multiple bioinformatics analysis. The expression profiles of NACs in different organs were examined and compared through RNA-seq and qRT-PCR assay. Results: The chlorophyll a fluorescence parameters φPo, φEo, φRo, and PIabs of leaves were significantly inhibited under drought stress. ABA (abscisic acid) content noticeably increased over the duration of drought, whereas GA3 (gibberellic acid) and IAA (indole acetic acid) content decreased continuously. A total of 158 NACs were identified in blueberry genome and 62 NACs were differently expressed in leaf and root of blueberry under drought stress. Among them, 14 NACs were significantly correlated with the expression of other NAC genes. Conclusions: Our results revealed the phenotypic changes of this shrub under drought stress and linked them with NAC TFs, which are potentially involved in the process of response to drought stress.

1. Introduction

Blueberry (Vaccinium corymbosum L.) is a perennial shrub within the genus Vaccinium of the family Ericaceae that has attracted a lot of attention due to its rich nutrients, especially anthocyanins [1]. Anthocyanins have been demonstrated to not only affect the color formation of fruit, but also can improve the antioxidant capacity and prevent a variety of diseases such as cancer [2]. Therefore, to date, most studies on blueberries have focused on the research of anthocyanin formation and regulation mechanism [3,4]. However, in recent years, with global warming and frequency of adversity [5], the survival of blueberry tree is often threatened by drought stress, and the output is further affected. Therefore, it is necessary to reveal the drought tolerance mechanism of blueberry, as this would contribute to the selective breeding of resistant variety in the shrub species.
Plants are usually confronted with many adverse environments during growth and development. In order to cope with various biotic or abiotic stresses, plants have evolved a set of elaborate and complicated self-regulation mechanisms in which transcription factors (TFs) exert vital function [6,7]. TFs could promote or inhibit the expression of target genes by binding to specific cis-acting elements on the promoter of the target genes, thus participating in many life processes of plants [8]. With the development of bioinformatics, more and more TFs have been predicted in many different plant species. For example, in Populus, the number of potential TFs is about 4287, which accounts for about 10% of its total number of genes [9].
The plant-specific NAC (NAM, ATAF1, ATAF2 and CUC2) proteins initiated from a large family of TFs, which contain a conserved NAM (no apical meristem) domain at the N-terminal and a variable transcriptional activation domain at the C-terminal [10]. The conserved NAM domain could be divided into five subdomains (A–E): subdomain A is probably involved in the formation of dimerization; subdomain C and D are relatively conserved, which may be related to DNA binding; whereas subdomain B and E are more variable, and determine the function of different NAC proteins. The highly diverse transcription regulatory region at the C-terminal of NAC proteins confers transcriptional activation diversity of different NAC TFs [11,12]. NAC TFs have been reported to participate in various biological processes in plants, such as formation of second cell wall, programmed cell death and flowering period of plant [13,14,15]. In addition, accumulating evidence has indicated that NAC TFs widely play crucial roles in plants’ response to abiotic stresses, such as drought, salinity, and cold stress. For example, in thellungiella(Thellungiella salsuginea), overexpression of TsNAC1 promotes the expression of TsVP1, thus significantly improving drought tolerance ability of the plant [16]. In soybean (Glycine max (L.) Merr.), NAC TF GmSIN1 participates in the process of plants response to salt stress by promoting the accumulation of ABA (abscisic acid)and reactive oxygen species (ROS); meanwhile, it could also activate the development of plant root [17]. In rice (Oryza sativa L.), the ONAC066 overexpression plants showed an increased drought tolerance compared with wild-type (WT), whereas the drought-tolerance ability of plants was significantly inhibited by RNA interference [18]. Furthermore, many studies have demonstrated that plants respond to abiotic stresses by altering the levels of endogenous hormones, such as ABA and GA (gibberellin acid) [19,20]. Actually, NAC TFs are widely reported to participate in the signaling pathway of these hormones. For example, in rice, overexpression of OsNAC2 could improve the expression of ABA-related genes such as OsNCED3 and OsLEA3, thus elevating the accumulation of ABA, and the drought-tolerance ability of transgenic plants was significantly improved [21]. In Arabidopsis, when plants were subjected to drought stress, NAC TF JUB1 could repress the expression of GA3ox1, which is a GA biosynthesis gene, leading to a reduction in the level of GAs, and thus improving the drought tolerance of plants [22].
Despite the universal investigation of NAC TFs in model plants such as Arabidopsis and rice in response to abiotic stresses [18,23], little is known about the characterization and molecular mechanism of NAC TFs in blueberry tree when subjected to drought stress. In the present study, the chlorophyll a fluorescence parameters of leaf (φPo, φEo, φRo, and PIabs) and several phytohormones were measured under drought stress. Moreover, 158 NAC TFs were identified on the basis of genome-wide level in blueberry, and a comprehensive analysis including phylogeny, gene structure, conserved motifs, expression correlation, and expression profiling of NAC TFs under drought stress was performed. This study provided a new basis for the important candidate NAC genes, which are drought stress-responsive in blueberry.

2. Materials and Methods

2.1. Plant Materials and Drought Conditions

The blueberry variety ‘Bluecrop’ seedling with a height of about 20 cm was chosen for these studies. The plants were cultivated under a 16 h photoperiod in the greenhouse of Beijing Forestry University, and the ratio of nutritive soil and vermiculite was 1:1 (volume), the pH of water was 5.2–5.5, and the temperature was 25 °C. The seedlings of all the groups were planted under optimal growth conditions as described above, whereas the moderate drought stress group (MD) seedlings and severe drought stress group (SD) seedlings were treated without water for 20 and 40 days, respectively. The duration of drought treatment was determined according to soil water content (SWC), which was measured by the gravimetric method [24]. Every pot was weighed at 15:00 Beijing Standard Time with six pots per treatment. The SWC of MD and SD were 55.8% and 30%, respectively (Figure S1a). In order to enhance the reliability of the experiment, we also measured the relative water content (RWC) of leaves on the basis of the method described in the previous study [25,26,27]. The leaves of plants were weighed at 16:00 Beijing Standard Time for the fresh weight (FW), and then placed in the distilled water for 24 h at the room temperature to obtain the turgid weight (TW). The turgid leaves were oven-dried at 80 °C for 48 h to determine the drought weight (DW). The RWC of leaves in different treatment groups was shown in Figure S1b. The RWC was calculated as follows:
RWC = (FW − DW)/(TW − DW) × 100,

2.2. Determination of Leaf Chlorophyll Fluorescence Parameters

The chlorophyll a fluorescence parameters of blueberry leaves under drought stress were measured by Handy PEA (Plant Efficiency Analyser) portable fluorometer (Hansatech Instruments, Norfolk, United Kingdom) [28]. Leaves were collected from the plants in CK (control check) group, MD group, and SD group, respectively. Each treatment chose 3 plants, and 10 leaves per plant were collected for measurement. Every measurement was repeated three times. All leaves were dark adapted before measurements. Chlorophyll a fluorescence parameters were calculated as follows:
(1)
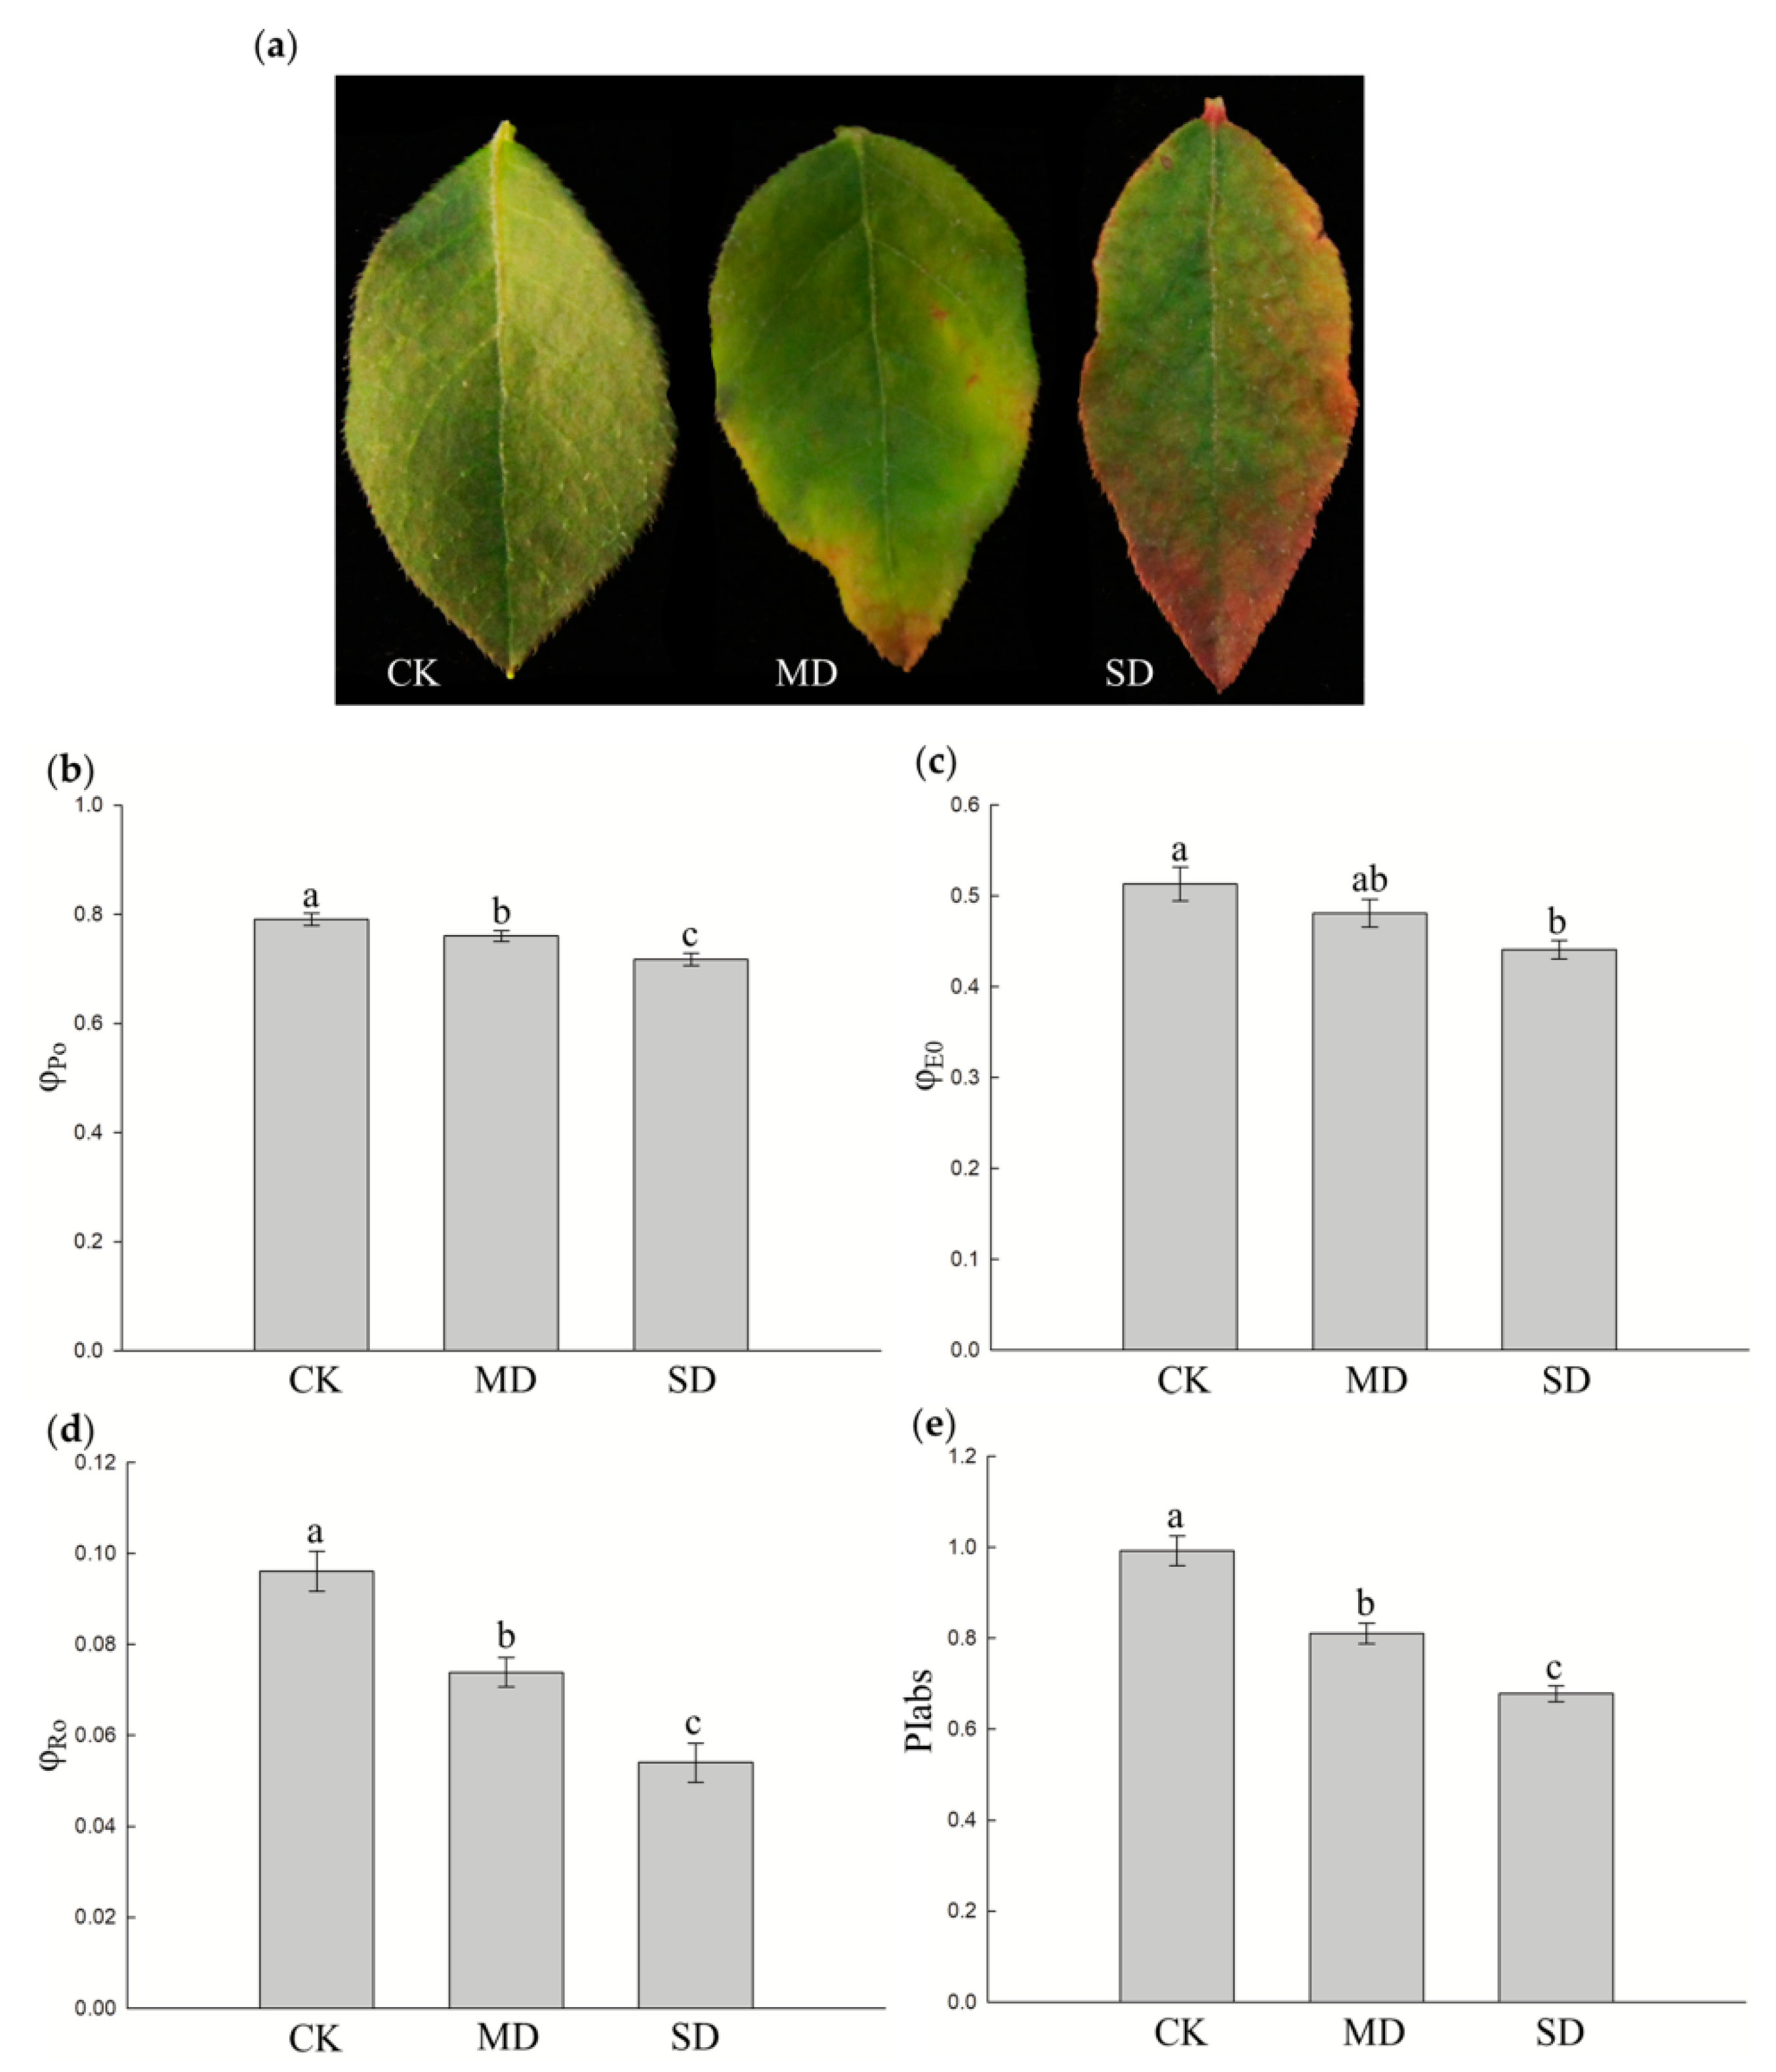
The maximum quantum yield for primary photochemistry, φPo = Fv/Fm = (Fm − Fo)/Fm. Fm and Fo indicate maximal recorded fluorescence intensity and minimal recorded fluorescence intensity, respectively.
(2)
The quantum yield for electron transport, φEo = (Fv/Fm) × (1 − Vj). Vj is the relative variable fluorescence intensity at the J-step.
(3)
The reduction of end electron acceptors at the PSI (photosystem I) acceptor side, φRo = TRo/ABS × (1 − Vi). TRo indicates trapped energy by PSII (at t = 0), ABS indicates absorption flux of PSII (at t =0), Vi is the relative variable fluorescence intensity at the I-step.
(4)
The performance index on absorption basis, PIabs = (RC/ABS) × φPo/(1 − φPo) × (1 − Vj)/(1 + Vj).

2.3. Measurement of Phytohormones

The endogenous hormones such as abscisic acid (ABA), gibberellin acid (GA3), indol-acetic acid (IAA), and Zeatin (ZT) were determined by high performance liquid chromatography (HPLC) according to a previous study with slight modification [29,30]. Briefly, the extraction methods were as follows: 0.5 g of fresh tissue was grinded to powder in a precooled mortar, and precooled 8 mL 80% methanol was added, then the samples were stored at 4 °C for 15–21 h. After extraction, the samples were centrifuged at 12,000 rpm for 10 min at 4 °C, and the supernatant was acquired. A drop of ammonia was added, pressure was reduced, and rotated evaporation to the aqueous phase occurred at 35–40 °C, followed by the addition of 0.1 g PVPP (Poly Vinyl Pyrrolidone Pvp) and shaking for 15–30 min at 37 °C. The samples were centrifuged at 12,000 rpm for 10 min at 4 °C, and, after obtaining the supernatant, the pH was adjusted to 2.5–3.0 with hydrochloric acid. Equal volume ethyl acetate was added and extracted three times, then the samples were combined with supernatant. Pressure was reduced, and the samples were condensed to dry at 35–40 °C. Finally, the residue was resuspended in 0.5 mL mobile phase and filtered through 0.45 μm filter. The conditions of HPLC were as follows: agilent high performance liquid chromatograph Agilent1100, including vacuum stripping air machine, low pressure pump, diode array detector (DAD), and automatic sampler. Column: agilent sb-c18 column, 250 × 4.60 mm, 5 μm. Mobile phase: gradient elution, starting with 0.1 mol/L acetic acid solution and volume fraction 3% chromatography methanol (volume ratio of 97:3), after 40 min changed to 0.1 mol/L aqueous acetic acid solution with a volume fraction of 3% methanol (volume ratio 32.3:67.7); Column temperature was 30 °C; flow rate was 1.0 mL/min; detection wavelength of ABA, GA3, and IAA was 254 nm; detection wavelength of ZT was 270 nm; and injection volume was 10 μL. All experiments were performed for three biological replicates and three technical replicates.

2.4. RNA Extraction and qRT-PCR Analysis of Gene Expression

Total RNA was isolated from leaves and roots of drought-treated or control group blueberry seedlings using RNA Kit (Aidlab, Beijing, China) according to the instructions of the manufacturer. The first-strand cDNA was synthesized by the FastQuant cDNA First-Strand Synthesis Kit (Tiangen Biotechnology, Beijing, China). qRT-PCR assays were performed on a StepOnePlus Real-Time PCR System (ABI, Vernon, CA, USA) by Fluorescence Quantification PCR Kit (Tiangen Biotechnology, Beijing, China) following the adjustment of the cDNA template concentrations. The primer sequences of 12 differently expressed genes (DEGs) are shown in Table S4, and UBC28 was used as the reference gene for analysis of expression data [31]. All qRT-PCR experiments were performed for three biological replicates and three technical replicates.

2.5. Expression Characterization of NAC TFs Using RNA-seq

Total RNA of each sample was sent to Majorbio Company (www.majorbio.com) for library construction and sequenced by means of Illumina HiSeq 4000 system. The data were analyzed on the free online platform of Majorbio Cloud Platform, and the proteins that contain NAM domain were identified by HMMER and NCBI (National Center for Biotechnology Information). Afterwards, the homologues of VcNAC proteins in Arabidopsis were identified by BLAST (Basic Local Alignment Search Tool) program of NCBI. Fragments per kb (kilo-base) per million fragments (FPKM) were determined to quantify expression level of genes, and the RNA data were displayed by log10 (FPKM + 1).

2.6. Phylogenetic Analysis of VcNAC Proteins

The sequences of VcNAC proteins were analyzed and obtained from platform of Majorbio Cloud Platform, and the sequences of AtNAC proteins were downloaded from the Arabidopsis genome TAIR (https://www.arabidopsis.org/). Multiple sequence alignments of full-length NAC amino acid sequences were performed using Clustal X 1.83. MEGA-X program was employed to construct the phylogenetic tree between VcNAC and AtNAC proteins using neighbor-joining method with 1000 bootstrap value [32]. The phylogenetic tree was decorated by iTOL (https://itol.embl.de/).

2.7. Identification and Analysis of Differently Expressed Genes

The differently expressed genes (DEGs) were defined with the p-value ≤ 0.001 and fold-change ≥2. Venn diagrams of DEGs were analyzed by Majorbio Cloud Platform. Heatmap was generated on the basis of the log10 fold-change values at MD_L (leaf of moderate drought stress treatment group)/SD_L (leaf of severe drought stress treatment group)/MD_R (root of moderate drought stress treatment group)/SD_R (root of severe drought stress treatment group) when compared with CK_L (leaf of control group) and CK_R (root of control group) [11]. The phylogenetic analysis of DEGs was the same as above. The conserved motifs of DEGs were analyzed by MEME (Motif Elicitation) program and the number of motifs was 10 [33]. All DEGs were characterized by GO (gene ontology) classification as follows: biological processes, cellular components, and molecular functions [34]. The expression correlation analysis of DEGs was calculated on the basis of Spearman correlation algorithm with the correlation coefficient for 0.5 and significant differences at q < 0.05. Finally, the network was constructed by Majorbio Cloud Platform.

2.8. Statistical Analyses of Data

The SPSS software version 18.0 (SPSS Corp., Chicago, IL, USA) was used for statistical analysis. The statistical difference analysis was performed by Dunnett’s test with p < 0.05 designated as significant difference.

3. Results

3.1. Effect of Drought Stress on Chlorophyll a Fluorescence Parameters of Blueberry Leaves

We observed the phenotype and measured four key chlorophyll a fluorescence parameters of blueberry leaves under moderate and severe drought stresses, and control groups, independently, thus determining the ideal time point for RNA-seq sampling. Under moderate drought stress, the leaves of blueberry turned slightly yellow and wilted, then began to dry and completely withered after severe drought stress treatment (Figure 1a). Changes in morphology of leaves usually tend to indicate the changes in chlorophyll a fluorescence, therefore, we further examined the changes of φPo, φEo, φRo, and PIabs values of leaves. The decreases in φPo, φEo, φRo, and PIabs indicated that the maximum quantum yield for primary photochemistry, the quantum yield for electron transport, the reduction of end electron acceptors at the PSI acceptor side, and the performance index on absorption basis in blueberry leaves were all adversely affected by drought treatment, and the harmful effect increased as the duration of drought stress progressed (Figure 1b–e).

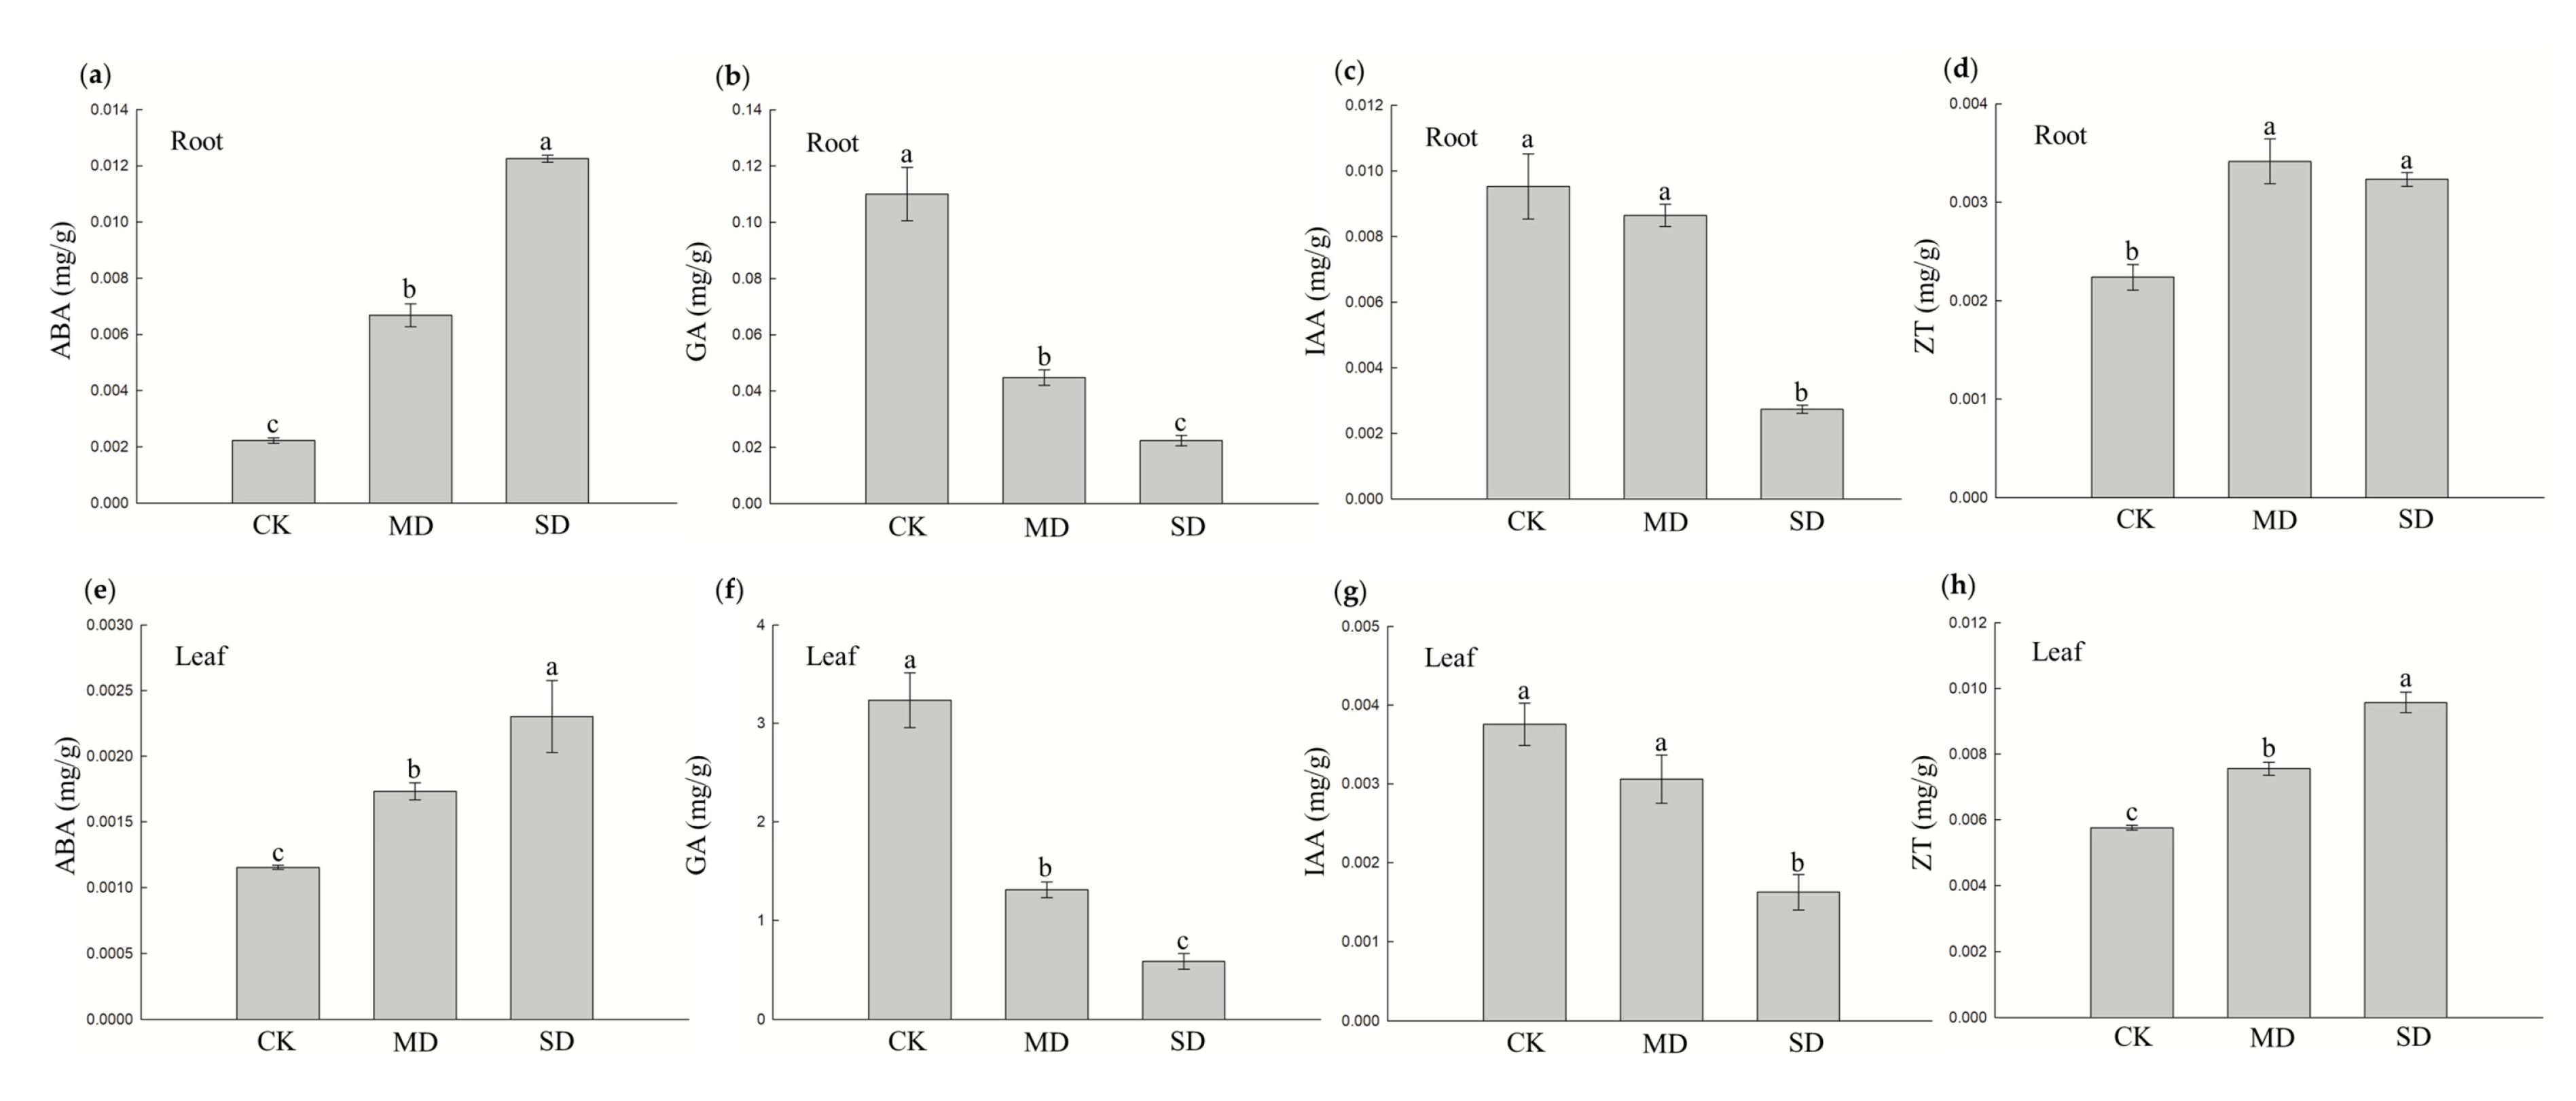
3.2. Hormonal Changes in Blueberry Response to Drought Stress

Phytohormones have a wide range of roles in plant growth and development and response to various stresses. Here, we examined the change of phytohormone content in leaf and root under drought stress treatment. Under moderate drought stress, ABA content increased significantly both in leaf and root, especially in root, reaching the value threefold higher than that in the control group (Figure 2a,e), whereas, on the contrary, GA3 content decreased by more than half in both leaf or root compared with the control group (Figure 2b,f). IAA content was not obviously altered under moderate drought stress, and ZT content increased about 1.5-fold higher than control group in both root or leaf organ (Figure 2c,d,g,h). Under severe drought stress, ABA content increased further in both leaf or root, which was, respectively, about twofold and 1.4-fold higher than that under the moderate drought stress group (Figure 2a,e). GA3 content continued to decrease by half in leaf or root, compared with that in the moderate drought stress group (Figure 2b,f). Notably, IAA concentration was significantly fourfold lower in root and twofold lower in leaf than that of the moderate drought group (Figure 2c,g). Different from that in root, in which the content of ZT showed no significant difference between the moderate drought group and severe drought group (Figure 2d), the content of ZT in leaf increased with aggravating drought degree and reached a level 1.3-fold higher than the moderate drought group (Figure 2h).

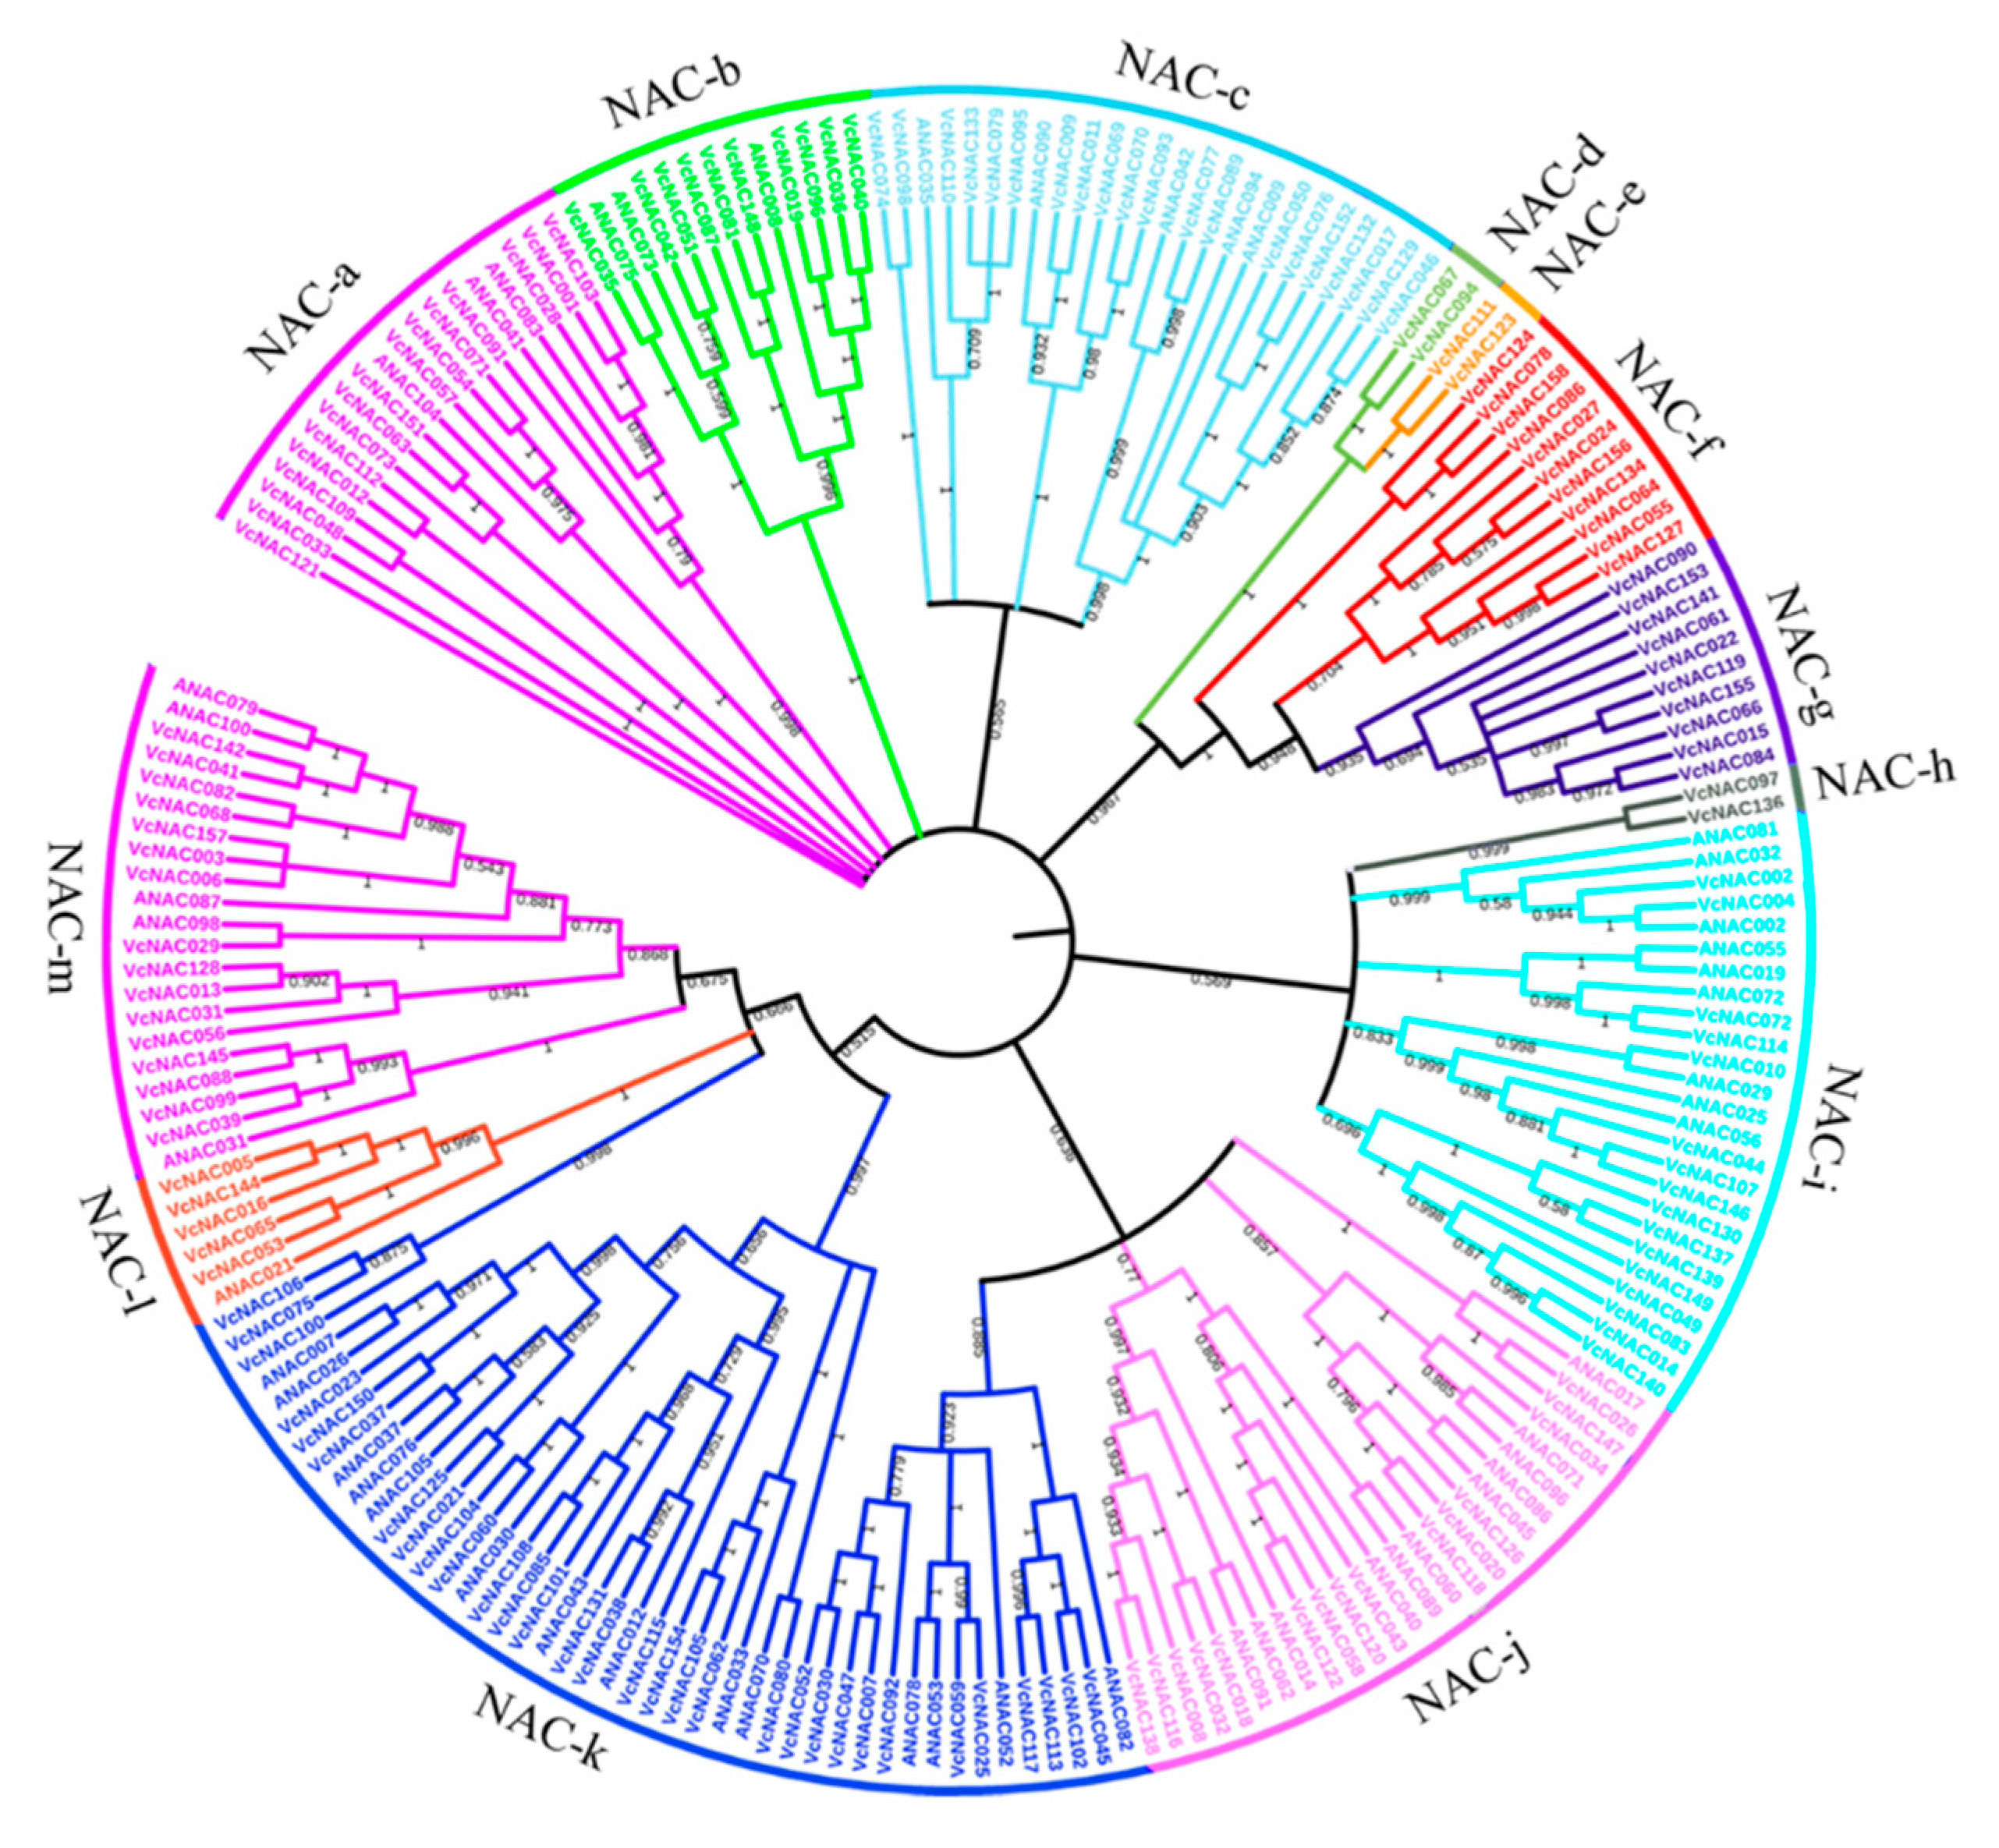
3.3. Identification and Phylogenetic Analysis of NAC TFs in Blueberry

We identified NAC TFs by searching NAM domain in blueberry genome and analyzed these candidate genes using Plant TFDB (plant transcription factor database) and HMM (hidden Markov model)after eliminating the repeats. A total of 158 NAC genes were identified and designated as VcNAC001 to VcNAC158 for the further analysis. The NAM domains of these 158 NAC TFs were determined by NCBI BLAST (Basic Local Alignment Search Tool ) program, and protein lengths, protein sequence, isoelectric point, and molecular weights are shown in Table S1. The molecular weights of these NAC TFs were from 8512.7 to 105,997.46 Da, and the isoelectric point varied from 4.22 to 9.97. Among them, VcNAC143 encoded 943 amino acids and VcNAC075 encoded only 76 amino acids. Moreover, the homologous NAC genes in Arabidopsis corresponding to each NAC gene of blueberry were analyzed, and the detailed information is shown in Table S2. To examine the phylogenetic relationship among VcNAC proteins, an unrooted phylogenetic tree was constructed with alignments of 158 VcNACs and 51 AtNACs. According to the structural similarity and conserved motifs, all of the NAC proteins were divided into 14 subgroups [11,35]. We found that subgroup NAC-k had the largest number of NAC proteins with 45; the lowest number of NAC proteins were included in subgroups such as NAC-d, NAC-e, and NAC-h with only 2 members in each. In addition, none of the AtNACs belonged to the subgroups NAC-d, NAC-e, NAC-f, NAC-g, and NAC-h (Figure 3).

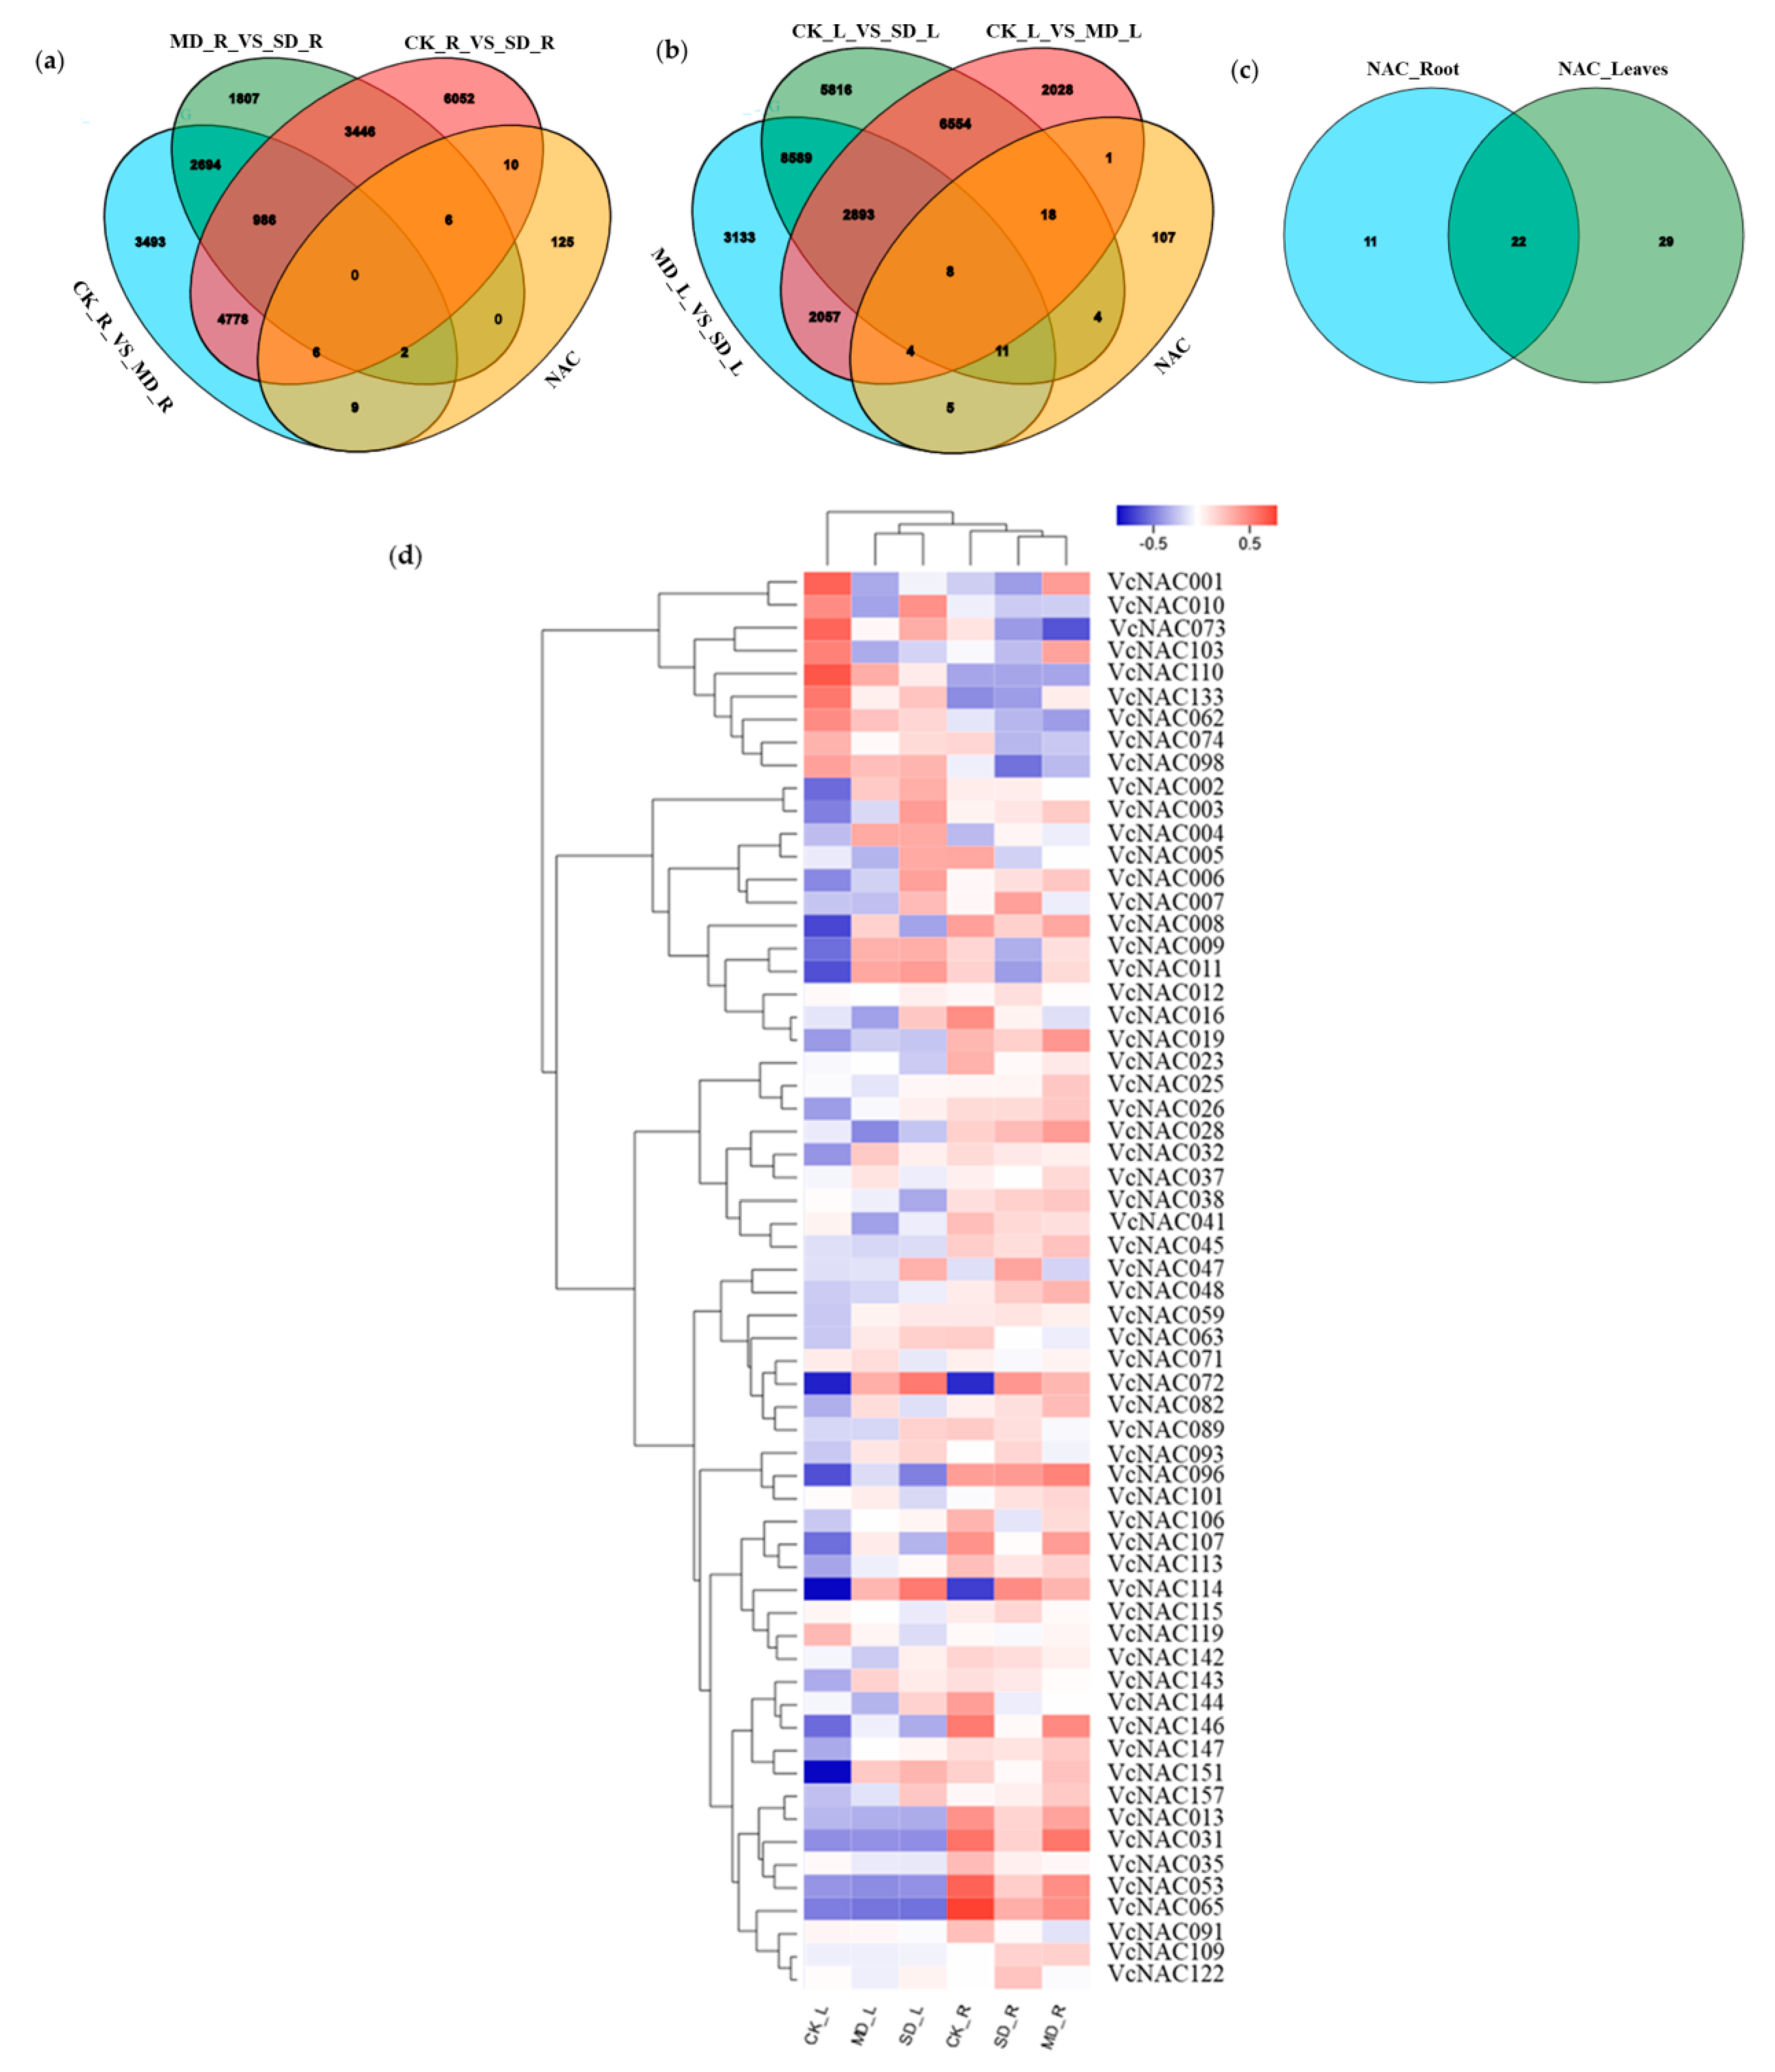
3.4. Identification and Cluster Analysis of Differently Expressed NAC Genes under Drought Stress

The differently expressed genes (DEGs) were defined with the p-value ≤ 0.001 and fold-change ≥2 [36,37]. We analyzed DEGs of NACs in the organs of root and leaf in blueberry under drought stress and identified 33 DEGs in root and 51 DEGs in leaf (Figure 4a,b). The number of up-regulated genes was 13 in root and 35 in leaf, whereas the down-regulated genes in root and leaf were 19 and 16, respectively.
Among these DEGs, there were 22 DEGs co-expressed both in root and leaf (Figure 4c); thus, a total of 62 DEGs were identified. To facilitate the visualization, a heatmap was shown on the basis of log10TPM (Transcripts Per Million) (Figure 4d). In addition, 12 DEGs, including VcNAC001-VcNAC011 and VcNAC072, with fold change ≥5 were selected for further qRT-PCR analysis under drought stress.

3.5. Conserved Motifs and Phylogenetic Analysis of DEGs

An unrooted phylogenetic tree was constructed with alignments of these 62 NAC DEGs. Moreover, conserved motifs of DEGs were predicted using MEME program and 10 motifs, named motif 1–10 (Figure S2) were defined in these 62 NAC proteins (Figure 5a). As expected, all of the conserved motifs were located at the N-terminal of the NAC protein, which is consistent with the highly conserved DNA-binding domain of the N-terminal of NAC protein, as described previously [11,38]. In contrast to N-terminal, there was no conserved motif in the C-terminal of NAC protein, which is a variable transcriptional regulation region. Among these conserved motifs, motif 2/8, motif 4, motif 1/6, motif 3/5, and motif 7 corresponded to the conserved subdomains A, B, C, D, and E, respectively (Figure 5b). In addition, NAC proteins composed of similar motifs were observed within the same subgroups. For example, VcNAC019, VcNAC035, and VcNAC096 belong to subgroup NAC-b and contain similar conserved motifs, whereas only the members of subgroup NAC-l comprise motif 9. These results further support the reliability of subgroup classification for NAC protein family in plants.

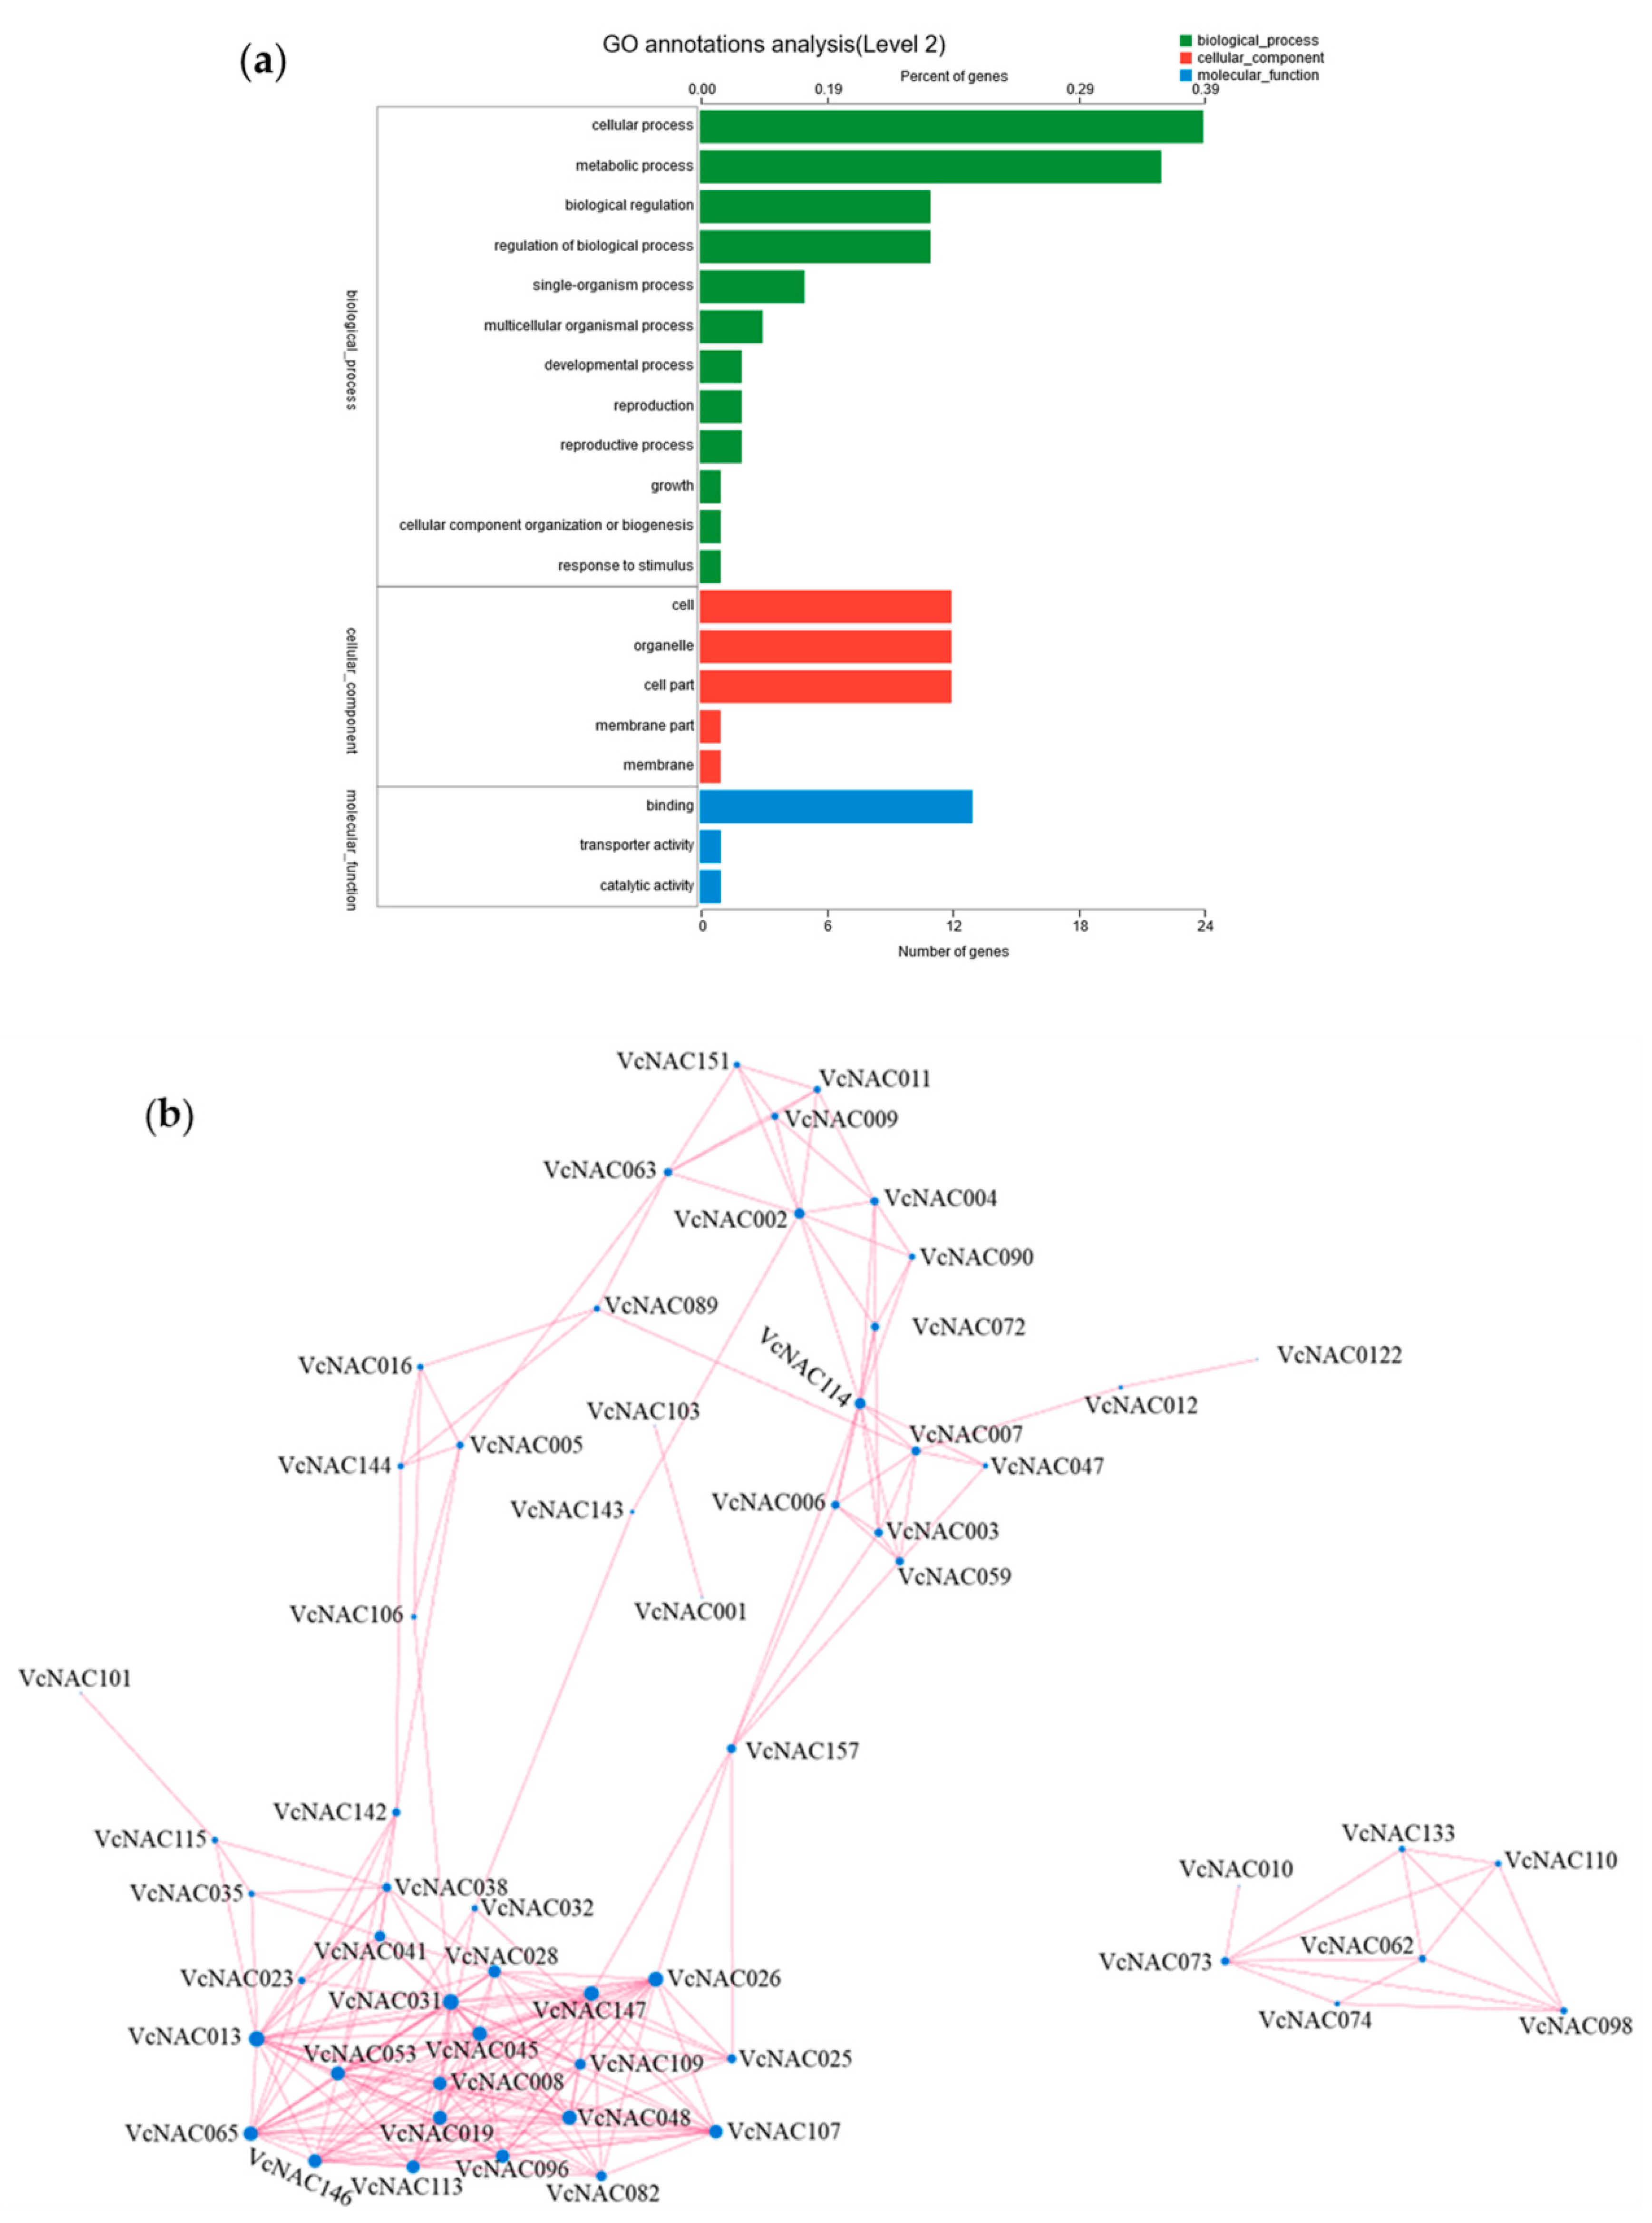
3.6. GO Annotation and Correlation Analysis of DEGs

To elucidate the potential function of DEGs in VcNACs, biological process, cellular component, and molecular function of DEGs were performed by GO annotation. The results showed that 62 DEGs participated in a variety of biological processes (Figure 6a). Most NACs were predicted to participate in cellular process (24) and metabolic process (22). Only VcNAC062 was categorized into responding to stimulus. According to the prediction of cellular component, VcNACs were mainly located in the organelle and cell part. In addition, the results of molecular function indicated that 13 NACs were annotated as binding, whereas only VcNAC062 was annotated as transporter and catalytic activity. The detailed information for GO annotation of DEGs is shown in Table S3.
The correlation of expression level of genes usually reflects the possible co-expression relationship between genes. Therefore, we constructed an expression correlation network of these 62 DEGs on the basis of Spearman correlation algorithm. The results showed that 14 NACs, including VcNAC13, VcNAC31, VcNAC28, VcNAC45, VcNAC113, VcNAC53, VcNAC65, VcNAC19, VcNAC48, VcNAC96, VcNAC147, VcNAC146, VcNAC008, and VcNAC107 were significantly correlated with the expression of other NAC genes (Figure 6b).

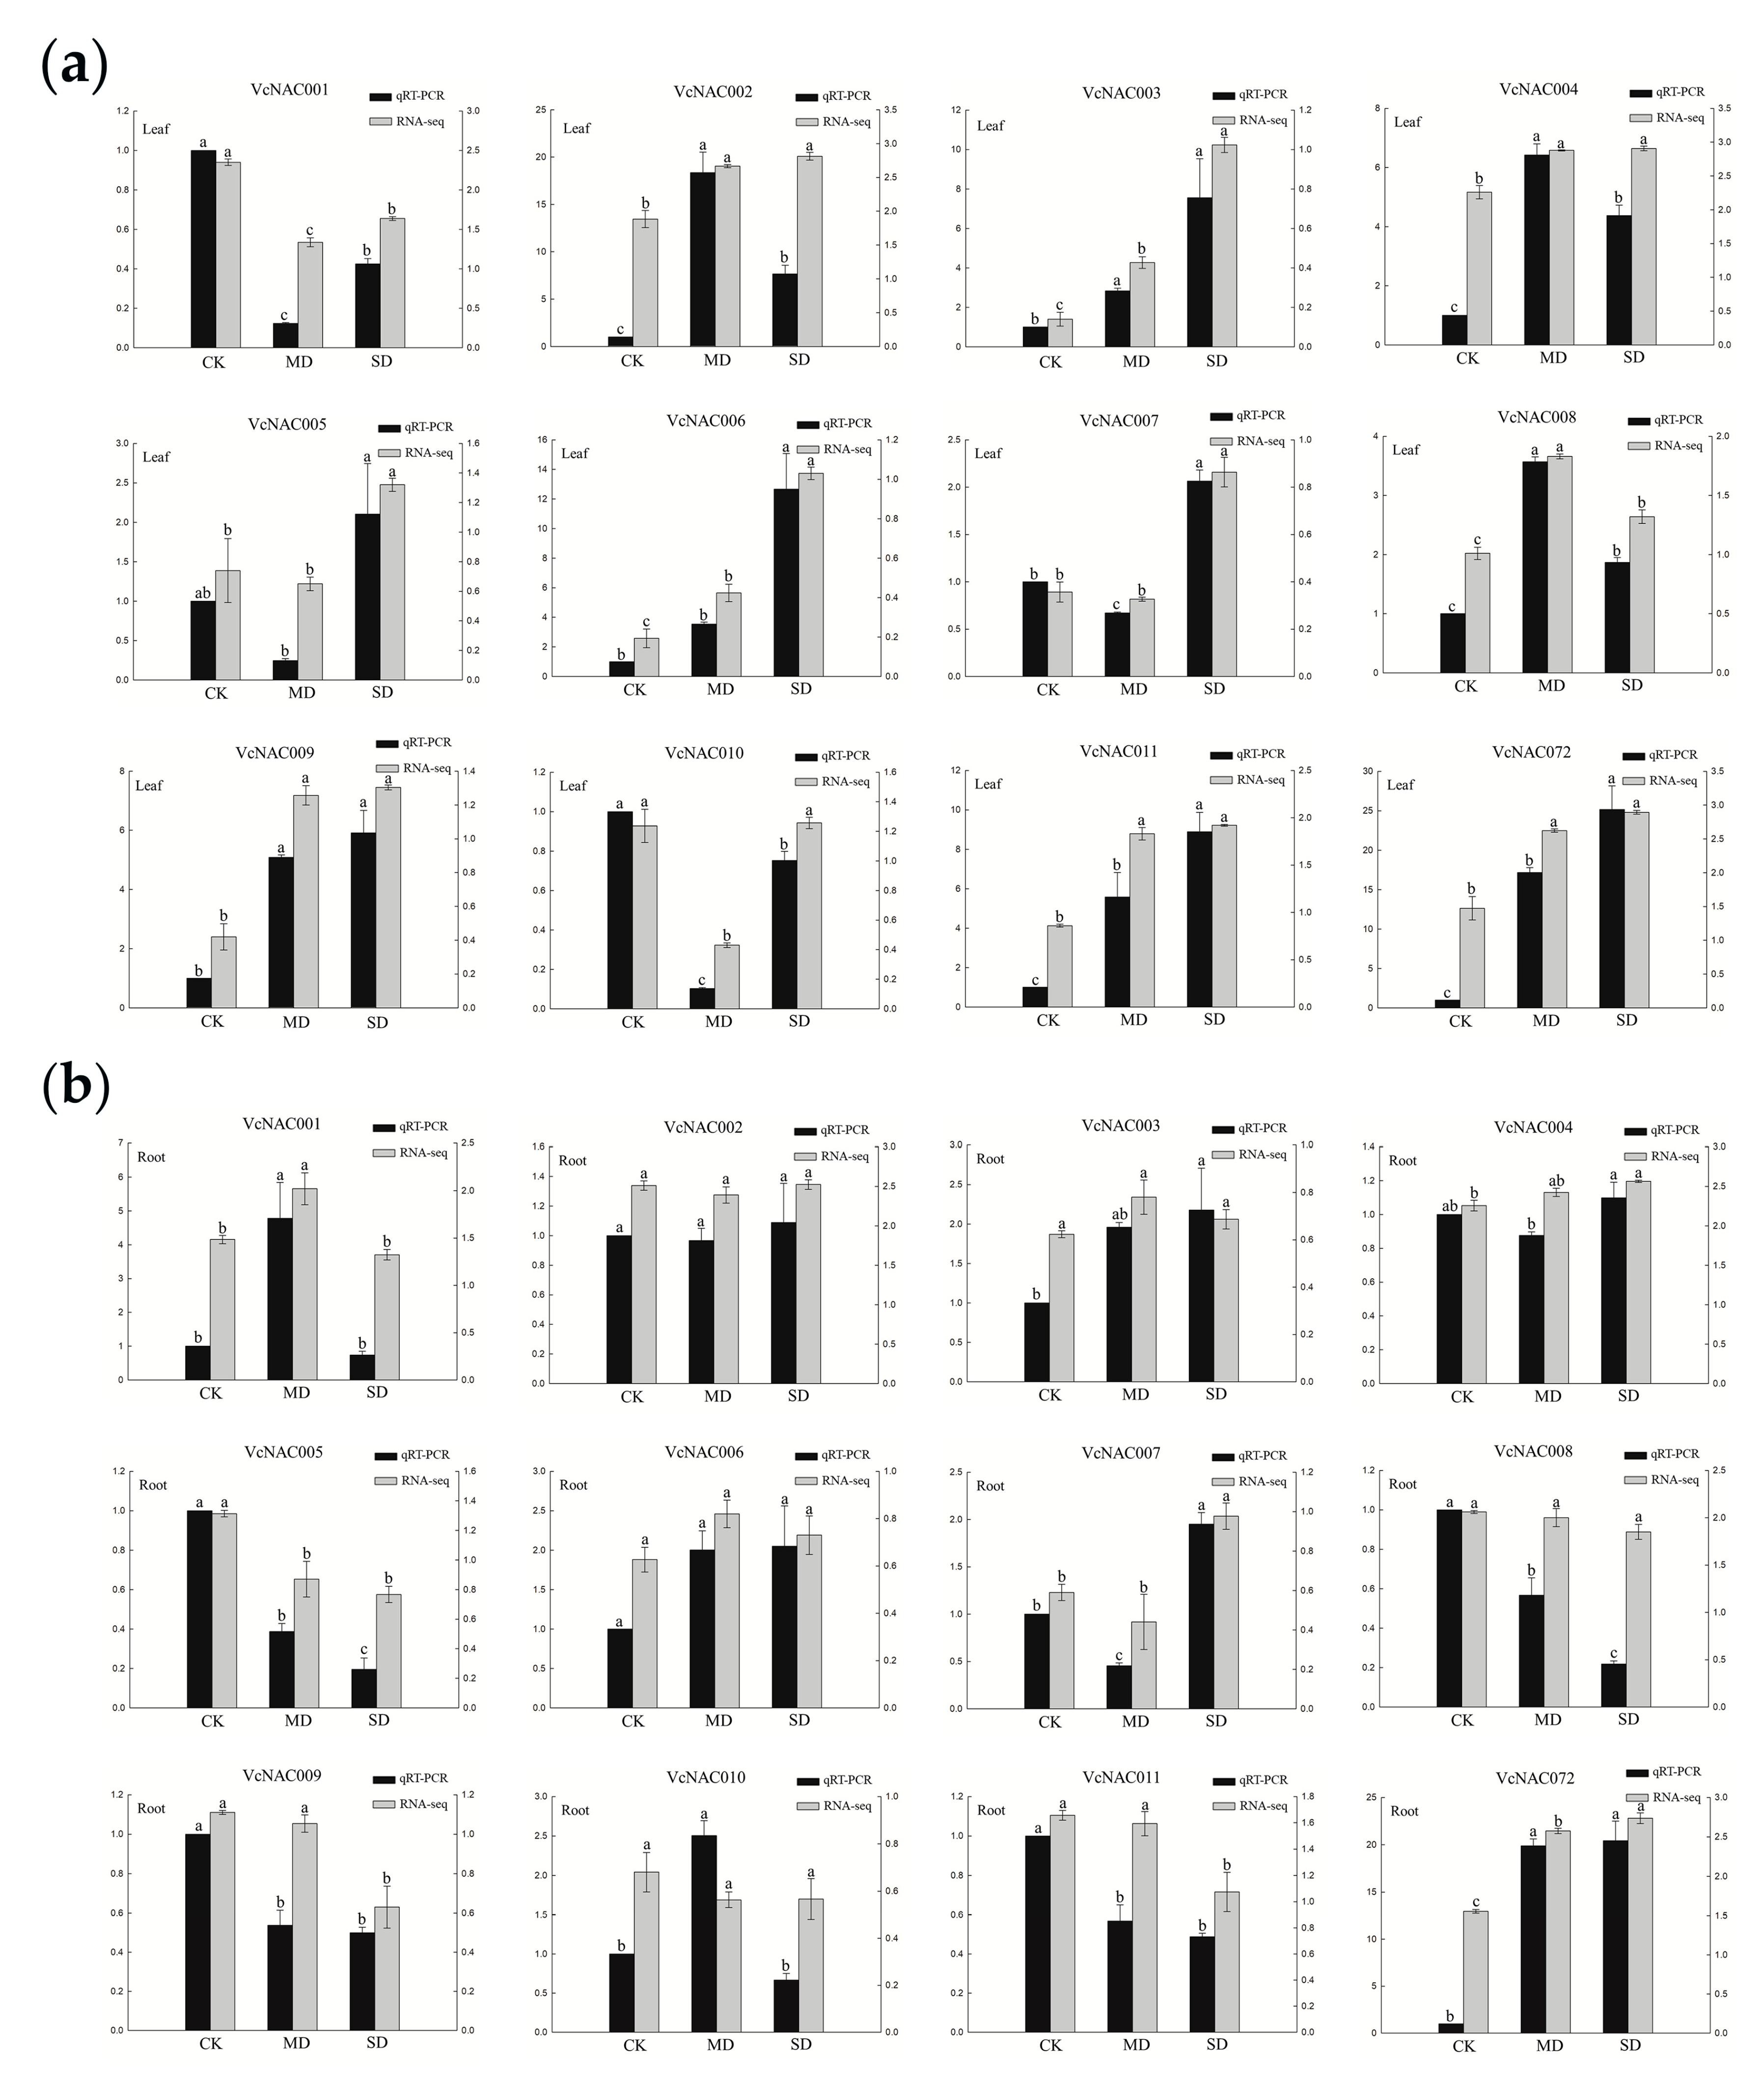
3.7. Validation of RNA-seq Data by Quantitative Real Time (qRT)-PCR

To verify the accuracy of DEGs produced by RNA-seq data, DEGs with fold change ≥5 were selected for further analysis by qRT-PCR. Considering the organ-specific expression of genes, we examined the expression profile of 12 DEGs in leaf and root of blueberry, independently. We found that the results of qRT-PCR analysis were well in accordance with the RNA-seq data, except for the expression of VcNAC004 and VcNAC010 showing slightly different patterns in root on the basis of the two approaches (Figure 7b). Because transcriptome data is the result of high-throughput sequencing, which aims at the global gene expression patterns, whereas qRT-PCR analysis is directed to the individual gene on the basis of the specific gene primers, the slight difference for individual gene on the basis of the two methods is reasonable. The different expression profiles shown by these two approaches usually occur [39], and the results of qRT-PCR should be more accurate. Overall, these results indicated that our RNA-seq data were reliable and the error was also within the reasonable range.

4. Discussion

Blueberries are widely grown in many parts of the world, owing to their high level of in vitro antioxidant capacities [40,41]. However, most of blueberry species are characterized by weak root and shallow disperse in soil, which makes them susceptible to drought stress. With global warming and environmental deterioration, drought has become a primary factor limiting the growth and development of plants [42]. Therefore, there is great significance in excavating the stress-resistant genes in blueberry and elucidating the resistant mechanism for blueberry production. However, despite the scattered reports regarding the cold acclimation and stress tolerance in blueberry [43], little information is known about the molecular mechanism of drought tolerance.
In the present study, we found that the leaves of blueberry turned yellow under drought stress (Figure 1a), indicating that drought stress might damage photosynthetic pigment and cause light bleaching of the plant [44]. It has been reported that photosystem II (PSII) is one of the key steps in the process of light energy conversion [45,46]. The inhibition of the efficiency of light energy conversion in photosynthesis will result in more excess excitation energy, which can lead to the generation of reactive oxygen species (ROS) when this excess excitation energy cannot be safely dissipated [47,48]. In the present study, we found that the efficiency of light energy conversion through chlorophyll a fluorescence parameters such as φPo, φEo, φRo, and PIabs in blueberry seedling leaves constantly decreased with the drought degree aggravated, suggesting that drought stress decreased the capacity of photosynthetic energy utilization in blueberry seedling leaves, which led to an imbalance between photosynthetic light absorption and energy utilization. In fact, a similar phenomenon has also been illuminated in other species. For instance, drought stress damages PSII activities and decreases the efficiency of electron transfer in maize (Zea mays L.) and Medicago leaves [49,50].
Plants usually adapt to the environment and abiotic stress by regulating the level of endogenous hormones, especially through the ABA pathway [51,52]. Under drought stress, ABA content in plants increases and stomatal aperture and transpiration decreases, thus improving the drought tolerance of plants. In addition, many studies have proven that the function of transcription factors relies on the ABA pathway [17]. For example, in Miscanthus, NAC transcription factor MlNAC10 overexpression confers ABA hypersensitivity, and in the transgenetic lines, the expression of four ABA-responsive genes (DREB2A, ERD11, RAB18, and RD29B) was significantly up-regulated [51]. In Arabidopsis, NAC transcription factor VNI2 integrates ABA-mediated abiotic stress signals into leaf senescence by regulating the expression of COR and RD genes [53]. Furthermore, previous studies have suggested that there is an intensive dynamic balance between ABA and other endogenous hormones, such as GA, IAA, and ZT [54]; for instance, in mango (Mangifera indica L.), drought stress decreased the content of GA and IAA, whereas it increased the content of ABA [55]. In cucumber (Cucumis sativus L.), the concentration of ABA improved significantly when plants were subjected to drought stress, whereas the content of ZT decreased noticeably [56]. Our results found that ABA was greatly induced under drought stress and the content increased significantly in both leaf and root, especially in root. Meanwhile, the growth hormones such as GA3 and IAA showed the opposite change trend, and the content decreased greatly by more than half in both leaf or root compared with the control group. These results suggest that blueberry seedling responded to drought condition by altering the level of several endogenous hormones, increased the content of ABA, and combined with decreased concentration of GA3 and IAA to maintain a balance of growth and resilience in blueberries. Actually, a similar phenomenon has also been reported in other species. In maize (Zea mays), ABA content increased significantly under water deficit, whereas IAA content noticeably decreased [57]. In adonis (Adonis amurensis), ABA content increased continuously as the duration of drought stress advanced, whereas the content of GA decreased in plants [26]. In addition, we found that compared to IAA, GA3 showed more sensitivity to drought stress and decreased under moderate stress, whereas IAA showed a cumulative effect on the drought stress.
Various plants have evolved specific tolerance mechanism in response to adverse environment; therefore, it is crucial to reveal the resistance mechanism and explore key regulating genes in specific species during this process. NAC TFs, one of the largest families of TFs in plants, play a vital role in plant resistance to abiotic stresses, such as drought and salinity [58,59]. In the present study, we identified 158 NAC genes in blueberry and analyzed the potential function and expression characteristics of DEGs for NAC TFs on the basis of the transcriptome data under drought stress. The phylogenetic tree constructed on the basis of the alignments of 158 VcNACs and 51 AtNACs showed that all of the NAC proteins were classified into 14 subgroups. Two or more VcNAC genes of blueberry were hit with one homologous gene in Arabidopsis, which is consistent with the findings of other species [9,60]. For example, in Populus, a total of 289 NAC TFs have been identified, and in most cases, two or more PtNACs correspond to the same homologous genes in Arabidopsis [9], suggesting the gene amplification and functional redundancy of NAC TFs in woody plants. Generally, the N-terminal of NAC proteins is highly conserved, and C-terminal is variable [61,62]. The conserved motifs of these DEGs by MEME program in blueberry is consistent with the characteristics of NAC TFs. Combined with previous reports, these results indicate that the NAM domain located at the N-terminal of NAC protein plays a primary role for the structure and function of NAC TFs in plants, and the diversity of the C-terminal may result in the difference of transcriptional activation activity of NAC TFs. In addition, we found that NAC TFs usually share the same or similar components of conserved motifs within the same subgroup. For example, VcNAC005, VcNAC016, and VcNAC144 belong to subgroup NAC-l and contain conserved motif 9 and motif 10. These results further demonstrated the reliability of our subgroup classification.
A total of 62 DEGs among 158 VcNACs we identified were noticeably responsive to drought stress on the basis of transcriptome data. Because NAC TFs within the same subgroup tend to share a similar function [63,64], the classification would further help us better understand and predict the potential function of VcNACs. Notably, the subgroup NAC-i includes a number of important NAC genes of Arabidopsis such as AtNAC032 [65], AtNAC019, and AtNAC072 [66,67], which are widely involved in the process of plants’ response to abiotic stress, and the formation of anthocyanin. Therefore, we speculated that these VcNAC genes, such as VcNAC002, VcNAC004, VcNAC010, and VcNAC072, which are distributed on subgroup NAC-I, are likely to be involved in blueberry response to drought stress. The qRT-PCR analysis further confirmed that these genes are significantly induced by drought stress. Regarding the extensive roles of NAC TF family, both in plant development and in response to stress in previous reports, we cannot exclude the fact that these VcNAC genes simultaneously play a role in the development and regulation of fruit in blueberry.
It was also reported that NAC TFs can function by forming heterodimers with other NAC TFs [68,69]. For instance, in rice, ONAC020 and ONAC023 could interact with ONAC026 in the nucleus, and, accordingly, the three NAC TFs have similar expression patterns during the development of seed [70]. We further constructed an expression correlation network for the 62 DEGs and found that several NAC TFs such as VcNAC008, VcNAC013, VcNAC031, and VcNAC028 significantly correlated with other NAC TFs, suggesting that these NAC genes are liable to form heterodimers with other NAC genes to function in plant development and stress response. qRT-PCR analysis in different organs showed that there is an expression correlation between VcNAC004 and VcNAC002, and between VcNAC009 and VcNAC011, which have a similar expression pattern both in leaf and root of blueberry during resistance to drought stress. These results suggest that these NAC TFs are likely to function through the formation of dimerization. Nevertheless, the accurate regulation mechanism needs to be further explored in future research.
In the present study, we analyzed the expression profile of NAC genes in leaf and root under drought stress, and selected 12 NACs for qRT-PCR analysis. The results indicated that the expression patterns of NAC genes in root and leaf were different under drought treatment. For example, the expression level of VcNAC009 in leaf was significantly increased under drought stress, whereas it was decreased in root; the expression level of VcNAC010 increased first and then decreased in leaf, whereas it decreased first and then increased in root over the duration of drought stress. These results suggest that the expression profile of the individual gene was different in diverse organs when plants were subjected to abiotic stress, which provides a new insight for further exploration of gene function. In addition, it was noteworthy that the expression level of VcNAC006 and VcNAC072 significantly increased both in root and leaf during the process of blueberry in response to drought stress, and that there was an expression correlation between the two NACs. Therefore, in future research, it is worth the effort of verifying the function and potential association of VcNAC006 and VcNAC072.

5. Conclusions

In conclusion, our results indicated that under drought stress, the chlorophyll a fluorescence parameters such as φPo, φEo, φRo, and PIabs in blueberry leaves were significantly inhibited, and that blueberry seedling responded to drought stress by regulating the level and equilibrium of endogenous hormones such as ABA, GA3, and IAA. A total of 158 NAC TFs in blueberry genome were divided into 14 subgroups with their homologous proteins in Arabidopsis. A total of 62 NACs obviously responded to drought stress, and 12 NACs were greatly induced by drought stress. Expression correlation network assay showed that VcNAC008 was significantly correlated with the expression of other NAC genes. In addition, there was an expression correlation between VcNAC004 and VcNAC002, and between VcNAC009 and VcNAC011, which had a similar expression pattern both in leaf and root of blueberry during the process of drought stress. These findings provide new insights into the stress-related NAC TFs in blueberry seedling and support for the future verification of gene function.

Supplementary Materials

The following are available online at https://0-www-mdpi-com.brum.beds.ac.uk/1999-4907/10/12/1088/s1: Figure S1: Soil water content and relative water content of leaves after drought stress, Figure S2: Conserved motifs of VcNAC proteins, Table S1: Primer sequences used in the qRT-PCR experiment, Table S2: The protein length, protein sequence, NAM domain, isoelectric point, and molecular weight of 158 VcNAC proteins, Table S3: The homologues of VcNACs in Arabidopsis, Table S4: GO annotation of DEGs.

Author Contributions

Conceptualization, K.L. and L.Z.; methodology, K.L. and A.W.; software, K.L. and A.W.; validation, K.L., A.W., and L.Z.; formal analysis, K.L. and A.W.; investigation, K.L., M.Y., and A.W.; resources, L.Z.; data curation, K.L. and Y.S.; writing—original draft preparation, K.L.; writing—review and editing, L.Z.; visualization, K.L.; supervision, L.Z.; project administration, L.Z.; funding acquisition, L.Z.

Funding

This research was funded by the grant from the Natural Science Foundation of Beijing, grant number 6172026, and Agricultural Ministry of China, grant number 2016ZX08009-003 to Lingyun Zhang.

Acknowledgments

We thank Majorbio Company (www.majorbio.com) for the RNA-seq and other anonymous help with this manuscript.

Conflicts of Interest

The authors declare no conflict of interest.

References

  1. Zhao, M.R.; Li, J.; Zhu, L.; Chang, P.; Li, L.L.; Zhang, L.Y. Identification and Characterization of MYB-bHLH-WD40 Regulatory Complex Members Controlling Anthocyanidin Biosynthesis in Blueberry Fruits Development. Genes Basel 2019, 10, 496. [Google Scholar] [CrossRef] [PubMed]
  2. Link, A.; Balaguer, F.; Goel, A. Cancer chemoprevention by dietary polyphenols: Promising role for epigenetics. Biochem. Pharmacol. 2010, 80, 1771–1792. [Google Scholar] [CrossRef] [PubMed]
  3. Yang, J.F.; Li, B.B.; Shi, W.J.; Gong, Z.Z.; Chen, L.; Hou, Z.X. Transcriptional Activation of Anthocyanin Biosynthesis in Developing Fruit of Blueberries (Vaccinium corymbosum L.) by Preharvest and Postharvest UV Irradiation. J. Agric. Food Chem. 2018, 66, 10931–10942. [Google Scholar] [CrossRef] [PubMed]
  4. Plunkett, B.J.; Espley, R.V.; Dare, A.P.; Warren, B.W.; Grierson, E.R.P.; Cordiner, S.; Turner, J.L.; Allan, A.C.; Albert, N.W.; Davies, K.M.; et al. MYBA From Blueberry (Vaccinium Section Cyanococcus) Is a Subgroup 6 Type R2R3MYB Transcription Factor That Activates Anthocyanin Production. Front. Plant Sci. 2018, 9. [Google Scholar] [CrossRef] [PubMed]
  5. Root, T.L.; Price, J.T.; Hall, K.R.; Schneider, S.H.; Rosenzweig, C.; Pounds, J.A. Fingerprints of global warming on wild animals and plants. Nature 2003, 421, 57–60. [Google Scholar] [CrossRef] [PubMed]
  6. Guo, X.Y.; Wang, Y.; Zhao, P.X.; Xu, P.; Yu, G.H.; Zhang, L.Y.; Xiong, Y.; Xiang, C.B. AtEDT1/HDG11 regulates stomatal density and water-use efficiency via ERECTA and E2Fa. New Phytol. 2019, 223, 1478–1488. [Google Scholar] [CrossRef]
  7. Li, M.; Lin, L.; Zhang, Y.H.; Sui, N. ZmMYB31, a R2R3-MYB transcription factor in maize, positively regulates the expression of CBF genes and enhances resistance to chilling and oxidative stress. Mol. Biol. Rep. 2019, 46, 3937–3944. [Google Scholar] [CrossRef]
  8. Xie, Z.L.; Nolan, R.O.R.; Jiang, H.; Tang, B.Y.; Zhang, M.C.; Li, Z.H.; Yin, Y.H. The AP2/ERF Transcription Factor TINY Modulates Brassinosteroid-Regulated Plant Growth and Drought Responses in Arabidopsis. Plant Cell 2019, 31, 1788–1806. [Google Scholar] [CrossRef]
  9. Wang, S.J.; Huang, J.J.; Wang, X.D.; Dang, H.; Jiang, T.B.; Han, Y.Z. Expression Analysis of the NAC Transcription Factor Family of Populus in Response to Salt Stress. Forests 2019, 10, 688. [Google Scholar] [CrossRef]
  10. Ooka, H.; Satoh, K.; Doi, K.; Nagata, T.; Otomo, Y.; Murakami, K.; Matsubara, K.; Osato, N.; Kawai, J.; Carninci, P.; et al. Comprehensive analysis of NAC family genes in Oryza sativa and Arabidopsis thaliana. DNA Res. 2003, 10, 239–247. [Google Scholar] [CrossRef]
  11. Li, W.; Li, X.X.; Chao, J.T.; Zhang, Z.L.; Wang, W.F.; Guo, Y.F. NAC Family Transcription Factors in Tobacco and Their Potential Role in Regulating Leaf Senescence. Front. Plant Sci. 2018, 9. [Google Scholar] [CrossRef] [PubMed]
  12. Wang, Y.X.; Liu, Z.W.; Wu, Z.J.; Li, H.; Zhuang, J. Transcriptome-Wide Identification and Expression Analysis of the NAC Gene Family in Tea Plant [Camellia sinensis (L.) O. Kuntze]. PLoS ONE 2016, 11, e166727. [Google Scholar] [CrossRef] [PubMed]
  13. Mitsuda, N.; Iwase, A.; Yamamoto, H.; Yoshida, M.; Seki, M.; Shinozaki, K.; Ohme-Takagi, M. NAC transcription factors, NST1 and NST3, are key regulators of the formation of secondary walls in woody tissues of Arabidopsis. Plant Cell 2007, 19, 270–280. [Google Scholar] [CrossRef] [PubMed]
  14. Zhao, C.S.; Avci, U.; Grant, E.H.; Haigler, C.H.; Beers, E.P. XND1, a member of the NAC domain family in Arabidopsis thaliana, negatively regulates lignocellulose synthesis and programmed cell death in xylem. Plant J. 2008, 53, 425–436. [Google Scholar] [CrossRef]
  15. Zhang, H.H.; Cui, X.Y.; Guo, Y.X.; Luo, C.B.; Zhang, L.Y. Picea wilsonii transcription factor NAC2 enhanced plant tolerance to abiotic stress and participated in RFCP1-regulated flowering time. Plant Mol. Biol. 2018, 98, 471–493. [Google Scholar] [CrossRef]
  16. Liu, C.; Wang, B.M.; Li, Z.X.; Peng, Z.H.; Zhang, J.R. TsNAC1 Is a Key Transcription Factor in Abiotic Stress Resistance and Growth. Plant Physiol. 2018, 176, 742–756. [Google Scholar] [CrossRef]
  17. Li, S.; Wang, N.; Ji, D.D.; Zhang, W.X.; Wang, Y.; Yu, Y.C.; Zhao, S.Z.; Lyu, M.H.; You, J.J.; Zhang, Y.Y.; et al. A GmSIN1/GmNCED3s/GmRbohBs Feed-Forward Loop Acts as a Signal Amplifier That Regulates Root Growth in Soybean Exposed to Salt Stress. Plant Cell 2019, 31, 2107–2130. [Google Scholar] [CrossRef]
  18. Yuan, X.; Wang, H.; Cai, J.T.; Bi, Y.; Li, D.Y.; Song, F.M. Rice NAC transcription factor ONAC066 functions as a positive regulator of drought and oxidative stress response. BMC Plant Biol. 2019, 19, 278. [Google Scholar] [CrossRef]
  19. Kowitcharoen, L.; Wongs-Aree, C.; Setha, S.; Komkhuntod, R.; Srilaong, V.; Kondo, S. Changes in abscisic acid and antioxidant activity in sugar apples under drought conditions. Sci. Hortic. Amst. 2015, 193, 1–6. [Google Scholar] [CrossRef]
  20. Zhang, S.H.; Xu, X.F.; Sun, Y.M.; Zhang, J.L.; Li, C.Z. Influence of drought hardening on the resistance physiology of potato seedlings under drought stress. J. Integr. Agric. 2018, 17, 336–347. [Google Scholar] [CrossRef]
  21. Jiang, D.G.; Zhou, L.Y.; Chen, W.T.; Ye, N.H.; Xia, J.X.; Zhuang, C.X. Overexpression of a microRNA-targeted NAC transcription factor improves drought and salt tolerance in Rice via ABA-mediated pathways. Rice 2019, 12, 76. [Google Scholar] [CrossRef] [PubMed]
  22. Shahnejat-Bushehri, S.; Tarkowska, D.; Sakuraba, Y.; Balazadeh, S. Arabidopsis NAC transcription factor JUB1 regulates GA/BR metabolism and signalling. Nat. Plants 2016, 2. [Google Scholar] [CrossRef] [PubMed]
  23. Jensen, M.K.; Kjaersgaard, T.; Nielsen, M.M.; Galberg, P.; Petersen, K.; O’Shea, C.; Skriver, K. The Arabidopsis thaliana NAC transcription factor family: Structure-function relationships and determinants of ANAC019 stress signalling. Biochem. J. 2010, 426, 183–196. [Google Scholar] [CrossRef] [PubMed]
  24. Luo, Y.Z.; Liu, H.; Yan, G.J.; Li, G.; Turner, N.C. Roots of Lucerne Seedlings are More Resilient to a Water Deficit than Leaves or Stems. Agron. Basel 2019, 9, 123. [Google Scholar] [CrossRef]
  25. Zaman, N.K.; Abdullah, M.Y.; Othman, S.; Zaman, N.K. Growth and Physiological Performance of Aerobic and Lowland Rice as Affected by Water Stress at Selected Growth Stages. Rice Sci. 2018, 25, 82–93. [Google Scholar] [CrossRef]
  26. Gao, S.S.; Wang, Y.L.; Yu, S.; Huang, Y.Q.; Liu, H.C.; Chen, W.; He, X.Y. Effects of drought stress on growth, physiology and secondary metabolites of Two Adonis species in Northeast China. Sci Hortic. Amst. 2020, 259, 108795. [Google Scholar] [CrossRef]
  27. Bankaji, I.; Sleimi, N.; Vives-Peris, V.; Gomez-Cadenas, A.; Perez-Clemente, R.M. Identification and expression of the Cucurbita WRKY transcription factors in response to water deficit and salt stress. Sci. Hortic. Amst. 2019, 256, 562. [Google Scholar] [CrossRef]
  28. Strauss, A.J.; Kruger, G.H.J.; Strasser, R.J.; Van Heerden, P.D.R. Ranking of dark chilling tolerance in soybean genotypes probed by the chlorophyll a fluorescence transient O-J-I-P. Environ. Exp. Bot. 2006, 56, 147–157. [Google Scholar] [CrossRef]
  29. Durgbanshi, A.; Arbona, V.; Pozo, O.; Miersch, O.; Sancho, J.V.; Gomez-Cadenas, A. Simultaneous determination of multiple phytohormones in plant extracts by liquid chromatography-electrospray tandem mass spectrometry. J. Agric. Food Chem. 2005, 53, 8437–8442. [Google Scholar] [CrossRef]
  30. Wen, Y.; Su, S.C.; Ma, L.Y.; Wang, X.N. Effects of gibberellic acid on photosynthesis and endogenous hormones of Camellia oleifera Abel. in 1st and 6th leaves. J. For. Res. Jpn. 2018, 23, 309–317. [Google Scholar] [CrossRef]
  31. Vashisth, T.; Johnson, L.K.; Malladi, A. An efficient RNA isolation procedure and identification of reference genes for normalization of gene expression in blueberry. Plant Cell Rep. 2011, 30, 2167–2176. [Google Scholar] [CrossRef] [PubMed]
  32. Tamura, K.; Stecher, G.; Peterson, D.; Filipski, A.; Kumar, S. MEGA6: Molecular Evolutionary Genetics Analysis Version 6.0. Mol. Biol. Evol. 2013, 30, 2725–2729. [Google Scholar] [CrossRef] [PubMed] [Green Version]
  33. Bailey, T.L.; Johnson, J.; Grant, C.E.; Noble, W.S. The MEME Suite. Nucleic Acids Res. 2015, 43, W39–W49. [Google Scholar] [CrossRef] [PubMed] [Green Version]
  34. Lin, Y.; Wang, Y.H.; Li, B.; Tan, H.; Li, D.N.; Li, L.; Liu, X.; Han, J.C.; Meng, X.J. Comparative transcriptome analysis of genes involved in anthocyanin synthesis in blueberry. Plant Physiol. Biochem. 2018, 127, 561–572. [Google Scholar] [CrossRef] [PubMed]
  35. Chen, S.; Lin, X.; Zhang, D.; Li, Q.; Zhao, X.; Chen, S. Genome-Wide Analysis of NAC Gene Family in Betula pendula. Forests 2019, 10, 741. [Google Scholar] [CrossRef] [Green Version]
  36. Dong, H.Y.; Xu, B.; Ji, K.S. Comparative transcriptome analysis of genes involved in response to thermal stress and leaf colour change of Acer palmatum. Sci. Hortic. Amst. 2019, 255, 77–85. [Google Scholar] [CrossRef]
  37. Wang, L.K.; Feng, Z.X.; Wang, X.; Wang, X.W.; Zhang, X.G. DEGseq: An R package for identifying differentially expressed genes from RNA-seq data. Bioinformatics 2010, 26, 136–138. [Google Scholar] [CrossRef]
  38. Singh, A.K.; Sharma, V.; Pal, A.K.; Acharya, V.; Ahuja, P.S. Genome-Wide Organization and Expression Profiling of the NAC Transcription Factor Family in Potato (Solanum tuberosum L.). DNA Res. 2013, 20, 403–423. [Google Scholar] [CrossRef] [Green Version]
  39. Zhu, C.C.; Shi, F.H.; Chen, Y.; Wang, M.; Zhao, Y.Q.; Geng, G.M. Transcriptome Analysis of Chinese Chestnut (Castanea mollissima Blume) in Response to Dryocosmus kuriphilus Yasumatsu Infestation. Int. J. Mol. Sci. 2019, 20, 855. [Google Scholar] [CrossRef] [Green Version]
  40. Battino, M.; Beekwilder, J.; Denoyes-Rothan, B.; Laimer, M.; McDougall, G.J.; Mezzetti, B. Bioactive compounds in berries relevant to human health. Nutr. Rev. 2009, 67 (Suppl. 1), S145–S150. [Google Scholar] [CrossRef]
  41. Dixon, R.A.; Xie, D.Y.; Sharma, S.B. Proanthocyanidins—A final frontier in flavonoid research? New Phytol. 2005, 165, 9–28. [Google Scholar] [CrossRef] [PubMed] [Green Version]
  42. Yang, X.F.; Kim, M.Y.; Ha, J.; Lee, S.H. Overexpression of the Soybean NAC Gene GmNAC109 Increases Lateral Root Formation and Abiotic Stress Tolerance in Transgenic Arabidopsis Plants. Front. Plant Sci. 2019, 10. [Google Scholar] [CrossRef] [PubMed] [Green Version]
  43. Walworth, A.; Song, G.Q. The Cold-Regulated Genes of Blueberry and Their Response to Overexpression of VcDDF1 in Several Tissues. Int. J. Mol. Sci. 2018, 19, 1553. [Google Scholar] [CrossRef] [PubMed] [Green Version]
  44. Miller, G.; Suzuki, N.; Ciftci-Yilmaz, S.; Mittler, R. Reactive oxygen species homeostasis and signalling during drought and salinity stresses. Plant Cell Environ. 2010, 33, 453–467. [Google Scholar] [CrossRef] [PubMed]
  45. Allakhverdiev, S.I. Recent progress in the studies of structure and function of photosystem II. J. Photochem. Photobiol. B 2011, 104, 1–8. [Google Scholar] [CrossRef] [PubMed]
  46. Sun, Y.J.; Geng, Q.W.; Du, Y.P.; Yang, X.H.; Zhai, H. Induction of cyclic electron flow around photosystem I during heat stress in grape leaves. Plant Sci. 2017, 256, 65–71. [Google Scholar] [CrossRef]
  47. Sun, Y.J.; Liu, X.H.; Zhai, H.; Gao, H.Y.; Yao, Y.X.; Du, Y.P. Responses of photosystem II photochemistry and the alternative oxidase pathway to heat stress in grape leaves. Acta Physiol. Plant 2016, 38, 232. [Google Scholar] [CrossRef]
  48. Ruban, A.V. Nonphotochemical Chlorophyll Fluorescence Quenching: Mechanism and Effectiveness in Protecting Plants from Photodamage. Plant Physiol. 2016, 170, 1903–1916. [Google Scholar] [CrossRef] [Green Version]
  49. Zhou, R.H.; Kan, X.; Chen, J.J.; Hua, H.L.; Li, Y.; Ren, J.J.; Feng, K.; Liu, H.H.; Deng, D.X.; Yin, Z.T. Drought-induced changes in photosynthetic electron transport in maize probed by prompt fluorescence, delayed fluorescence, P700 and cyclic electron flow signals. Environ. Exp. Bot. 2019, 158, 51–62. [Google Scholar] [CrossRef]
  50. Zhang, H.H.; Xu, N.; Sui, X.; Zhong, H.X.; Yin, Z.P.; Li, X.; Sun, G.Y. Photosystem II Function Response to Drought Stress in Leaves of Two Alfalfa (Medicago sativa) Varieties. Int. J. Agric. Biol. 2018, 20, 1012–1020. [Google Scholar] [CrossRef]
  51. He, K.; Zhao, X.; Chi, X.Y.; Wang, Y.P.; Jia, C.L.; Zhang, H.P.; Zhou, G.K.; Hu, R.B. A novel Miscanthus NAC transcription factor MlNAC10 enhances drought and salinity tolerance in transgenic Arabidopsis. J. Plant Physiol. 2019, 233, 84–93. [Google Scholar] [CrossRef] [PubMed]
  52. Yang, X.W.; He, K.; Chi, X.Y.; Chai, G.H.; Wang, Y.P.; Jia, C.L.; Zhang, H.P.; Zhou, G.K.; Hu, R.B. Miscanthus NAC transcription factor MlNAC12 positively mediates abiotic stress tolerance in transgenic Arabidopsis. Plant Sci 2018, 277, 229–241. [Google Scholar] [CrossRef] [PubMed]
  53. Yang, S.D.; Seo, P.J.; Yoon, H.K.; Park, C.M. The Arabidopsis NAC Transcription Factor VNI2 Integrates Abscisic Acid Signals into Leaf Senescence via the COR/RD Genes. Plant Cell 2011, 23, 2155–2168. [Google Scholar] [CrossRef] [PubMed] [Green Version]
  54. Ha, S.; Vankova, R.; Yamaguchi-Shinozaki, K.; Shinozaki, K.; Tran, L.S.P. Cytokinins: Metabolism and function in plant adaptation to environmental stresses. Trends Plant Sci 2012, 17, 172–179. [Google Scholar] [CrossRef]
  55. Helaly, M.N.; El-Hoseiny, H.; El-Sheery, N.I.; Rastogi, A.; Kalaji, H.M. Regulation and physiological role of silicon in alleviating drought stress of mango. Plant Physiol. Biochem. 2017, 118, 31–44. [Google Scholar] [CrossRef]
  56. Huang, H.J.; Yang, Z.Q.; Zhang, M.Y.; Li, Y.X.; Zhang, J.H.; Hou, M.Y. Effects of Water Stress on Growth, Photosynthesis, Root Activity and Endogenous Hormones of Cucumis sativus. Int. J. Agric. Biol. 2018, 20, 2579–2589. [Google Scholar] [CrossRef]
  57. Yang, H.; Gu, X.T.; Ding, M.Q.; Lu, W.P.; Lu, D.L. Activities of starch synthetic enzymes and contents of endogenous hormones in waxy maize grains subjected to post-silking water deficit. Sci. Rep. UK 2019, 9, 7059. [Google Scholar] [CrossRef] [Green Version]
  58. Alshareef, N.O.; Wang, J.Y.; Ali, S.; Al-Babili, S.; Tester, M.; Schmockel, S.M. Overexpression of the NAC transcription factor JUNGBRUNNEN1 (JUB1) increases salinity tolerance in tomato. Plant Physiol. Biochem. 2019, 140, 113–121. [Google Scholar] [CrossRef]
  59. Zhao, Q.; Zhong, M.; He, L.; Wang, B.; Liu, Q.L.; Pan, Y.Z.; Jiang, B.B.; Zhang, L. Overexpression of a chrysanthemum transcription factor gene DgNAC1 improves drought tolerance in chrysanthemum. Plant Cell Tiss. Org. 2018, 135, 119–132. [Google Scholar] [CrossRef]
  60. Hu, R.B.; Qi, G.A.; Kong, Y.Z.; Kong, D.J.; Gao, Q.A.; Zhou, G.K. Comprehensive Analysis of NAC Domain Transcription Factor Gene Family in Populus trichocarpa. BMC Plant Biol. 2010, 10, 145. [Google Scholar] [CrossRef] [Green Version]
  61. Yang, X.W.; Wang, X.Y.; Ji, L.; Yi, Z.L.; Fu, C.X.; Ran, J.C.; Hu, R.B.; Zhou, G.K. Overexpression of a Miscanthus lutarioriparius NAC gene MlNAC5 confers enhanced drought and cold tolerance in Arabidopsis. Plant Cell Rep. 2015, 34, 943–958. [Google Scholar] [CrossRef] [PubMed]
  62. Shim, J.S.; Oh, N.; Chung, P.J.; Kim, Y.S.; Do Choi, Y.; Kim, J.K. Overexpression of OsNAC14 Improves Drought Tolerance in Rice. Front. Plant Sci. 2018, 9, 310. [Google Scholar] [CrossRef] [PubMed]
  63. Fang, Y.J.; You, J.; Xie, K.B.; Xie, W.B.; Xiong, L.Z. Systematic sequence analysis and identification of tissue-specific or stress-responsive genes of NAC transcription factor family in rice. Mol. Genet. Genom. 2008, 280, 547–563. [Google Scholar] [CrossRef] [PubMed]
  64. Wei, S.; Gao, L.; Zhang, Y.; Zhang, F.; Yang, X.; Huang, D. Genome-wide investigation of the NAC transcription factor familyin melon (Cucumis melo L.) and their expression analysis under salt stress. Plant Cell Rep. 2016, 35, 1827–1839. [Google Scholar] [CrossRef]
  65. Mahmood, K.; Xu, Z.H.; El-Kereamy, A.; Casaretto, J.A.; Rothstein, S.J. The Arabidopsis Transcription Factor ANAC032 Represses Anthocyanin Biosynthesis in Response to High Sucrose and Oxidative and Abiotic Stresses. Front. Plant Sci. 2016, 7. [Google Scholar] [CrossRef]
  66. Tran, L.S.P.; Nakashima, K.; Sakuma, Y.; Simpson, S.D.; Fujita, Y.; Maruyama, K.; Fujita, M.; Seki, M.; Shinozaki, K.; Yamaguchi-Shinozaki, K. Isolation and functional analysis of Arabidopsis stress-inducible NAC transcription factors that bind to a drought-responsive cis-element in the early responsive to dehydration stress 1 promoter. Plant Cell 2004, 16, 2481–2498. [Google Scholar] [CrossRef] [Green Version]
  67. Li, S.; Gao, J.; Yao, L.Y.; Ren, G.D.; Zhu, X.Y.; Gao, S.; Qiu, K.; Zhou, X.; Kuai, B.K. The role of ANAC072 in the regulation of chlorophyll degradation during age- and dark-induced leaf senescence. Plant Cell Rep. 2016, 35, 1729–1741. [Google Scholar] [CrossRef]
  68. Jeong, J.S.; Park, Y.T.; Jung, H.; Park, S.H.; Kim, J.K. Rice NAC proteins act as homodimers and heterodimers. Plant Biotechnol. Rep. 2009, 3, 127–134. [Google Scholar] [CrossRef]
  69. Wang, X.; Culver, J.N. DNA binding specificity of ATAF2, a NAC domain transcription factor targeted for degradation by Tobacco mosaic virus. BMC Plant Biol. 2012, 12, 157. [Google Scholar] [CrossRef] [Green Version]
  70. Mathew, I.E.; Das, S.; Mahto, A.; Agarwal, P. Three Rice NAC Transcription Factors Heteromerize and Are Associated with Seed Size. Front. Plant Sci. 2016, 7, 1638. [Google Scholar] [CrossRef] [Green Version]
Figure 1. Morphological and chlorophyll a fluorescence parameter changes of blueberry under drought stress. (a) Morphological changes of blueberry under drought stress; (b) φPo value; (c) φEo value; (d) φRo value; (e) PIabs value. CK: control check group; MD: moderate drought stress group; SD: severe drought stress group. Each value is represented as the mean value ± standard error of three independent determinations. Different letters indicate significant differences at p < 0.05 by Duncan’s multiple range test. MD: moderate drought, SD: severe drought.
Forests 10 01088 g001
Figure 2. Hormonal content in blueberry under drought stress. (a) Abscisic acid (ABA) content in root; (b) gibberellin (GA3) content in root; (c) indol-acetic acid (IAA) content in root; (d) zeatin (ZT) content in root; (e) ABA content in leaf; (f) GA3 content in leaf; (g) IAA content in leaf; (h) ZT content in leaf. Each value is represented as the mean value ± standard error of three independent determinations, and different letters indicated significant differences at p < 0.05 by Duncan’s multiple range test.
Forests 10 01088 g002
Figure 3. The phylogenetic tree of VcNACs and AtNACs. The phylogenetic tree was constructed with alignments of 158 VcNACs and 51 AtNACs by Clustal X 1.83 and MEGA-X with the NJ (neighbor-joining) method on the basis of 1000 replications. Each subgroup was marked with a specific color.
Forests 10 01088 g003
Figure 4. Identification of differently expressed genes (DEGs) in blueberry under drought stress. (a) Venn diagram analysis of DEGs in root of blueberry under drought stress. (b) Venn diagram analysis of DEGs in leaf of blueberry under drought stress. (c) Venn diagram depicting the degree of overlap between DEGs in root and DEGs in leaf. (d) Heatmap representation and hierarchical cluster of DEGs (red box represents up-regulated genes, blue box represents down-regulated genes). CK_L, leaf of control group; CK_R, root of control goup; MD_L, leaf of moderate drought stress treatment group; MD_R, root of moderate drought stress treatment group; SD_L, leaf of severe drought stress treatment group; SD_R, root of severe drought stress treatment group; NAC_Root, DEGs in root of blueberry under drought stress; NAC_Leaves, DEGs in leaves of blueberry under drought stress.
Forests 10 01088 g004
Figure 5. Conserved motifs and phylogenetic analysis of DEGs. (a) The phylogenetic tree of DEGs and conserved motifs of NAC (NAM, ATAF1, ATAF2 and CUC2) proteins. (b) The subdomains and conserved motifs shown as different color boxes. The sequences of DEGs were aligned by Clustal X 1.83, the phylogenetic tree was constructed using MEGA-X with the NJ (neighbor-joining) method based on 1000 replications. Conserved motifs were defined by MEME.
Forests 10 01088 g005
Figure 6. Characteristics and correlation of DEGs. (a) Functional annotation of DEGs on the basis of gene ontology (GO) categorization. (b) Expression correlation analysis of DEGs on the basis of Spearman correlation algorithm. The correlation coefficient is 0.5 and significant differences at q < 0.05. Each node represents a NAC gene and the connection between nodes represents the expression correlation of genes. Large nodes indicate that a large number of other genes have expression correlation with this gene.
Forests 10 01088 g006
Figure 7. The validation of RNA-seq data by qRT-PCR. (a) Expression of 12 DEGs in leaf. (b) Expression of 12 DEGs in root. The y-axis on the left is relative expression level of qRT-PCR analysis and the y-axis on the right is log10 (FPKM + 1) of RNA-seq. Each value is represented as the mean value ± standard error of three independent determinations, and different letters indicate significant differences at p < 0.05 by Duncan’s multiple range test.
Forests 10 01088 g007

