Article

Transcriptomic Analysis of Seasonal Gene Expression and Regulation during Xylem Development in “Shanxin” Hybrid Poplar (Populus davidiana × Populus bolleana)

1
State Key Laboratory of Tree Genetics and Breeding, Northeast Forestry University, Harbin 150040, China
2
Forestry College, Northeast Forestry University, Harbin 150040, China
*
Authors to whom correspondence should be addressed.
Submission received: 18 February 2021 / Revised: 29 March 2021 / Accepted: 1 April 2021 / Published: 9 April 2021
(This article belongs to the Section Genetics and Molecular Biology)

Abstract

:
Xylem development is a key process for wood formation in woody plants. To study the molecular regulatory mechanisms related to xylem development in hybrid poplar P. davidiana × P. bolleana, transcriptome analyses were conducted on developing xylem at six different growth stages within a single growing season. Xylem development and differentially expressed genes in the six time points were selected for a regulatory analysis. Xylem development was observed in stem sections at different growth stages, which showed that xylem development extended from the middle of April to early August and included cell expansion and secondary cell wall biosynthesis. An RNA-seq analysis of six samples with three replicates was performed. After transcriptome assembly and annotation, the differentially expressed genes (DEGs) were identified, and a Gene Ontology (GO) enrichment analysis, Kyoto Encyclopedia of Genes and Genomes (KEGG) pathway analysis and expression analysis of the DEGs were performed on each sample. On average, we obtained >20 million clean reads per sample, which were assembled into 84,733 nonredundant transcripts, of which there were 17,603 unigenes with lengths >1 kb. There were 14,890 genes that were differentially expressed among the six stages. The upregulated DEGs were enriched in GO terms related to cell wall biosynthesis between S1 vs. S2 or S3 vs. S4 and, in GO terms, related to phytohormones in the S1 vs. S2 or S4 vs. S5 comparisons. The downregulated DEGs were enriched in GO terms related to cell wall biosynthesis between S4 vs. S5 or S5 vs. S6 and, in GO terms, related to hormones between S1 vs. S2 or S2 vs. S3. The KEGG pathways in the DEGs related to “phenylpropanoid biosynthesis”, “plant hormone signal transduction” and “starch and sucrose metabolism” were significantly enriched among the different stages. The DEGs related to cell expansion, polysaccharide metabolism and synthesis, lignin synthesis, transcription factors and hormones were identified. The identification of genes involved in the regulation of xylem development will increase our understanding of the molecular regulation of wood formation in trees and, also, offers potential targets for genetic manipulation to improve the properties of wood.

1. Introduction

Due to the short growth period, rapid growth, strong adaptability and strong shading ability, species of Populus are widely planted all over the world. Poplars have a small genome and strong asexual reproduction ability, making it a model plant for genetic improvement of forest tree breeding. P. davidiana × P. bolleana is an interspecific hybrid of two species in Populus sect Populus. P. davidiana, the female parent, was collected from the Gaofeng Forest Farm in Nenjiang County, and the male parent Xinjiang poplar (P. bolleana) was from Urumqi [1]. The hybrid was named “Shanxin” poplar. After 20 years of field testing, the hybrid’s performance was considered to be good, and the traits were found to be stable. “Shanxin” poplar has the characteristics of rapid growth, a straight and full trunk, white and delicate material, smooth green bark, graceful posture, a narrow crown and resistance to cold and drought. It is an excellent fast-growing poplar species for afforestation and urban and rural greening in arid and cold regions in the Northern hemisphere [2]. Since “Shanxin” poplar cuttings do not root easily, the survival rate is low. Therefore, research on this hybrid mainly focuses on asexual reproduction, such as cutting propagation and tissue culture and rapid propagation methods. It flowers but does not set seed and is an ideal recipient for genetic transformation to obtain safe genetically modified varieties. The use of transgenic technology can improve the ability of cuttings to root, as well as resistance to salt and alkali and resistance to pests and diseases in a short time. At present, although it has good wood properties, there are few studies focusing on wood formation in “Shanxin” poplar. Understanding the molecular biology of wood formation is important for the potential molecular improvement of “Shanxin” poplar and other species of woody plants.
Broadly speaking, the secondary xylem is the wood. The growth and development of plants and their successful adaptation to various environments depend to a large extent on the conduction of water, nutrients and other important element [3]. Xylem is a special vascular tissue that acts as a pipeline for water and mineral transport that also provides mechanical support for vertical growth. In woody plants, wood is mainly composed of secondary xylem elements [4]. Over the past two decades, several key factors, including hormones, signal transduction, transcriptional regulation and post-transcriptional regulators, have been shown to be the main factors controlling the formation of xylem [5]. The transcript profiling of wood developmental stages during this developmental sequence has revealed the intricate transcriptional regulation of wood formation [6,7]. The formation of xylem is a complex developmental process that requires cell specification and secondary cell wall deposition that is controlled at the transcriptional level. It is often affected by external factors, such as photoperiod, nutrient availability, water content and temperature, and by internal stimuli such as plant hormones and photosynthetic assimilation and the interactions between these factors [8]. Thousands of genes are actively involved in the formation of xylem and have been identified in both herbaceous and woody plants. This will expand our understanding of the regulation, metabolism and biosynthesis processes of xylem formation.
The development of xylem is also subject to seasonal regulation [9,10]. Studies of the cytological changes that occur in Chinese fir cambium have shown that the number of vascular cambium cells is positively correlated with the width of the cambium during the entire seasonal cycle. The number of cambium cells and the radial diameter of cambium cells are closely related to xylem formation [11]. The increase in the perimeter of trees is caused by the activity of the vascular cambium, which produces secondary xylem and phloem [12,13]. In the Northern temperate regions, the vascular cambium of woody plants has a seasonal activity and sleep cycle. The initiation, duration and cessation of vascular cambium activity are usually decisive factors in determining the quantity and quality of wood [11,14].
In our study, we used “Shanxin” poplar as the research subject to conduct anatomical observations of xylem development at different developmental stages during the growing season. Our objectives were to study the expression profile of genes involved in molecular regulation of the seasonal development of xylem, to increase our understanding of the molecular regulatory network that controls the formation of wood properties in “Shanxin” poplar and to provide data and materials for the molecular breeding and improvement of poplar.

2. Materials and Methods

2.1. Experimental Design

In order to analyze the seasonal expression and regulation of genes related to xylem development in “Shanxin” poplar, we selected six time points during xylem development to analyze the changing seasonal patterns. The samples were taken on 22 April (S1), 12 May (S2), 3 June (S3), 25 June (S4), 15 July (S5) and 4 August (S6). The “Shanxin” poplar is a wild type outside. All samples are sent to Biomarker (Beijing, China) for RNA extraction at the same time.

2.2. Plant Materials

The 5- to 6-year-old test trees were selected from the breeding base of Improved Variety Bases in Fulaerji District, Qiqihar City, Heilongjiang, China, 47°15′ N, 123°45′ E. The average maximum temperature at 6 time points was almost 15 °C (S1), 19 °C (S2), 25 °C (S3), 28 °C (S4), 30 °C (S5) and 25 °C (S6). At S1 and S8, the bark was difficult to separate from the xylem. Three well-developed trees with consistent growth were used at each time point as a group, with three biological replicates. Samples were taken every three weeks. A 20-cm stem section was cut at a height of 130 cm from the ground, and the developing xylem was scraped out using a surgical blade. After flash freezing in liquid nitrogen, the samples were stored at −80 °C prior to RNA extraction. At the same time, small blocks of developing xylem were excised from the bottom of each stem and fixed in formalin-alcohol-acetic acid for anatomical observation.

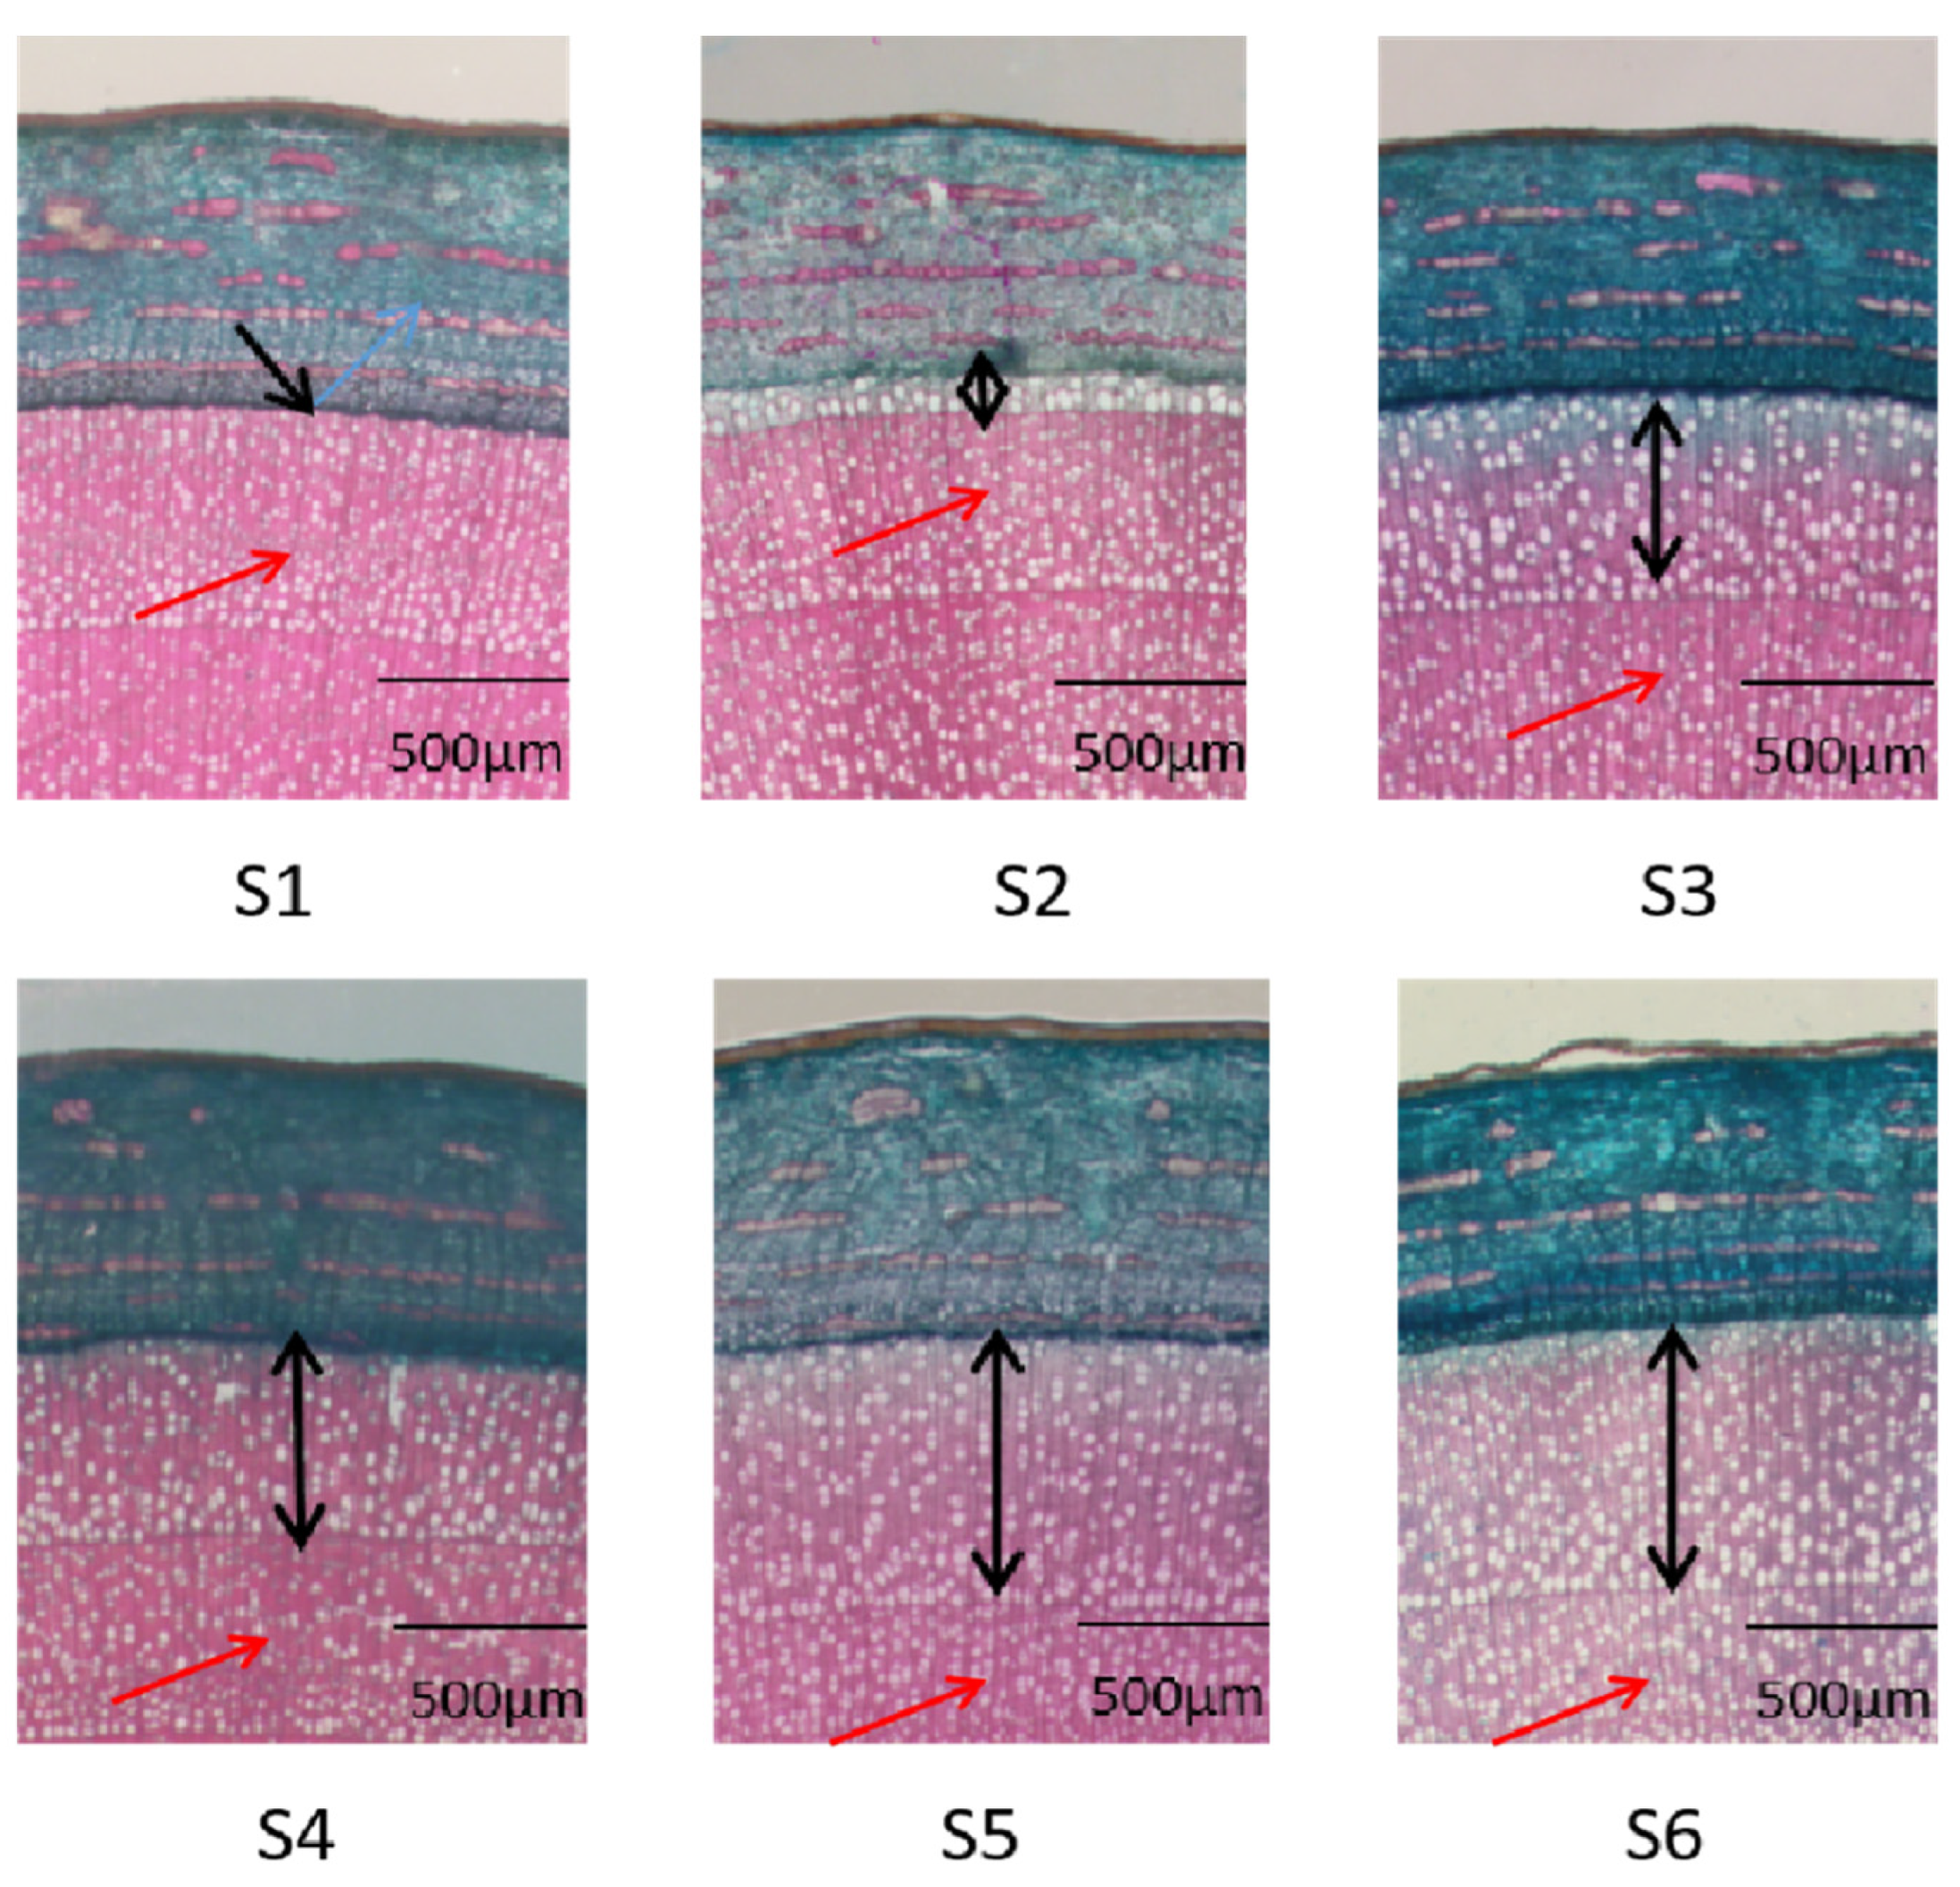
2.3. Anatomical Observation of Developing Xylem

To make slides for microscopic observation, stem sections ~3 cm were cut and were fixed in FAA (50% ethanol:formaldehyde:acetic acid = 90:5:5). The samples were evacuated for 10 min using a vacuum pump, and the valve was then opened, and the samples were allowed to stand for 10 min. This was repeated several times until there were no more bubbles produced under vacuum, and the material sank to the bottom of the solution. After 1 to 2 weeks at room temperature, the fixed samples were cut into 40-mm slices with a slide-away microtome (Leica 1007, Wetzlar, Germany) and then stained with Safranin and Fast Green for observation under a stereo light microscope (Olympus SZX7, Tokyo, Japan).

2.4. Library Construction and Transcriptome Sequencing

Total RNA was extracted using CTAB method according to the paper of Liu et al. [15]. The quality and concentration of total RNA was evaluated with a NanoDrop 2000 UV-visible Spectrophotometer (Thermo Scientific, Waltham, MA, USA). Equal amounts of total RNA from the treated samples were used for transcriptome sequencing.
The purity, concentration and integrity of RNA samples were tested using agarose gel electrophoresis to ensure the use of qualified samples for transcriptome sequencing.
A total of 1 μg of total RNA per sample was used as input material for RNA-seq library preparation. Sequencing libraries were generated using the NEBNext® Ultra™ RNA Library Prep Kit for Illumina® (New England Biolabs, Ipswich, MA, USA) following the manufacturer’s recommendations, and index codes were added to attribute sequences to each sample. Briefly, mRNA was purified from total RNA using poly-T oligo-attached magnetic beads. Fragmentation was carried out using divalent cations under elevated temperature in NEBNext First Strand Synthesis Reaction Buffer (5X). First-strand cDNA was synthesized by using random hexamer primers and M-MuLV Reverse Transcriptase. Second-strand cDNA synthesis was subsequently performed using DNA Polymerase I and RNase H. The remaining terminal overhangs were converted into blunt ends via exonuclease/polymerase activities. After adenylation of the 3′ ends of the DNA fragments, the NEBNext Adaptor with a hairpin loop structure was ligated to prepare for hybridization. In order to select cDNA fragments of ~240 bp in length, the library fragments were purified using the AMPure XP system (Beckman Coulter, Beverly, MA, USA). Uracil residues were removed with 3 μL of the USER (Uracil-Specific Excision Reagent) Enzyme (NEB, Ipswich, MA, USA) on the size-selected, adaptor-ligated cDNA at 37 °C for 15 min, followed by 5 min at 95 °C prior to PCR. Amplification was then performed using Phusion High-Fidelity DNA polymerase, Universal PCR primers and the Index (X) Primer. The PCR products were bead-purified (AMPure XP system, Beckman Coulter, Beverly, MA, USA), and the library quality was assessed on the Agilent Bioanalyzer 2100 system.
Clustering of the index-coded samples was performed on a cBot Cluster Generation System using a TruSeq PE Cluster Kit v3-cBot-HS (Illumina), according to the manufacturer’s instructions. After cluster generation, the library preparations were sequenced on an Illumina Hiseq 2000 platform, and paired-end reads were generated.

2.5. Transcriptome Assembly and Annotation

Transcriptome assembly was accomplished based on the left.fq and right.fq using Trinity [16] with min_kmer_cov set to 2 by default, and the default settings were used for all other parameters. Gene function was annotated based on the following databases: NR (NCBI nonredundant protein sequences), Pfam (Protein family), KOG/COG/eggNOG (Clusters of Orthologous Groups of proteins), Swiss-Prot (a manually annotated and reviewed protein sequence database), KEGG (Kyoto Encyclopedia of Genes and Genomes) and GO (Gene Ontology).

2.6. Identification of DEGs and GO Enrichment Analysis

Differential expression analysis of the two conditions/groups was performed using the DESeq R package (1.10.1). DESeq provides statistical routines for determining differential expression in digital gene expression data using a model based on the negative binomial distribution [17] for controlling the false discovery rate. Genes with an adjusted p-value < 0.05 found by DESeq were determined to be differentially expressed. Gene Ontology (GO) enrichment analysis of the DEGs was implemented by the topGO R package based on the Kolmogorov-Smirnov test.

2.7. KEGG Pathway Enrichment Analysis

The Kyoto Encyclopedia of Genes and Genomes [18] is a database resource for understanding high-level functions and utilities in biological systems, such as the cell, the organism and the ecosystem, from molecular-level information, especially large-scale molecular datasets generated by genome sequencing and other high-throughput experimental technologies. We used KOBAS [19] software to test the statistical enrichment of DEGs in KEGG pathways.

3. Results

3.1. Histological Observations of Xylem Development

We performed observations on the stem sections of “Shanxin” poplar at six different time points. Figure 1 shows the sections of “Shanxin” poplar stained with Safranin O-Fast green at the different stages. At S1, the xylem has not yet developed. At S2, the developing xylem is dyed green, which suggests that the xylem has begun to develop, and the xylem cells do not yet have lignified secondary walls, suggesting that they are still making their primary wall and/or expanding. At S3, the developing xylem cells are dividing rapidly, and the xylem is expanding, and most of the cells begin to synthesize secondary cell walls. These processes continue until S5, when the rate of xylem expansion is slightly reduced. There were no obvious microscopic differences between S5 and S6, and the formation of latewood was observed (Figure 1).

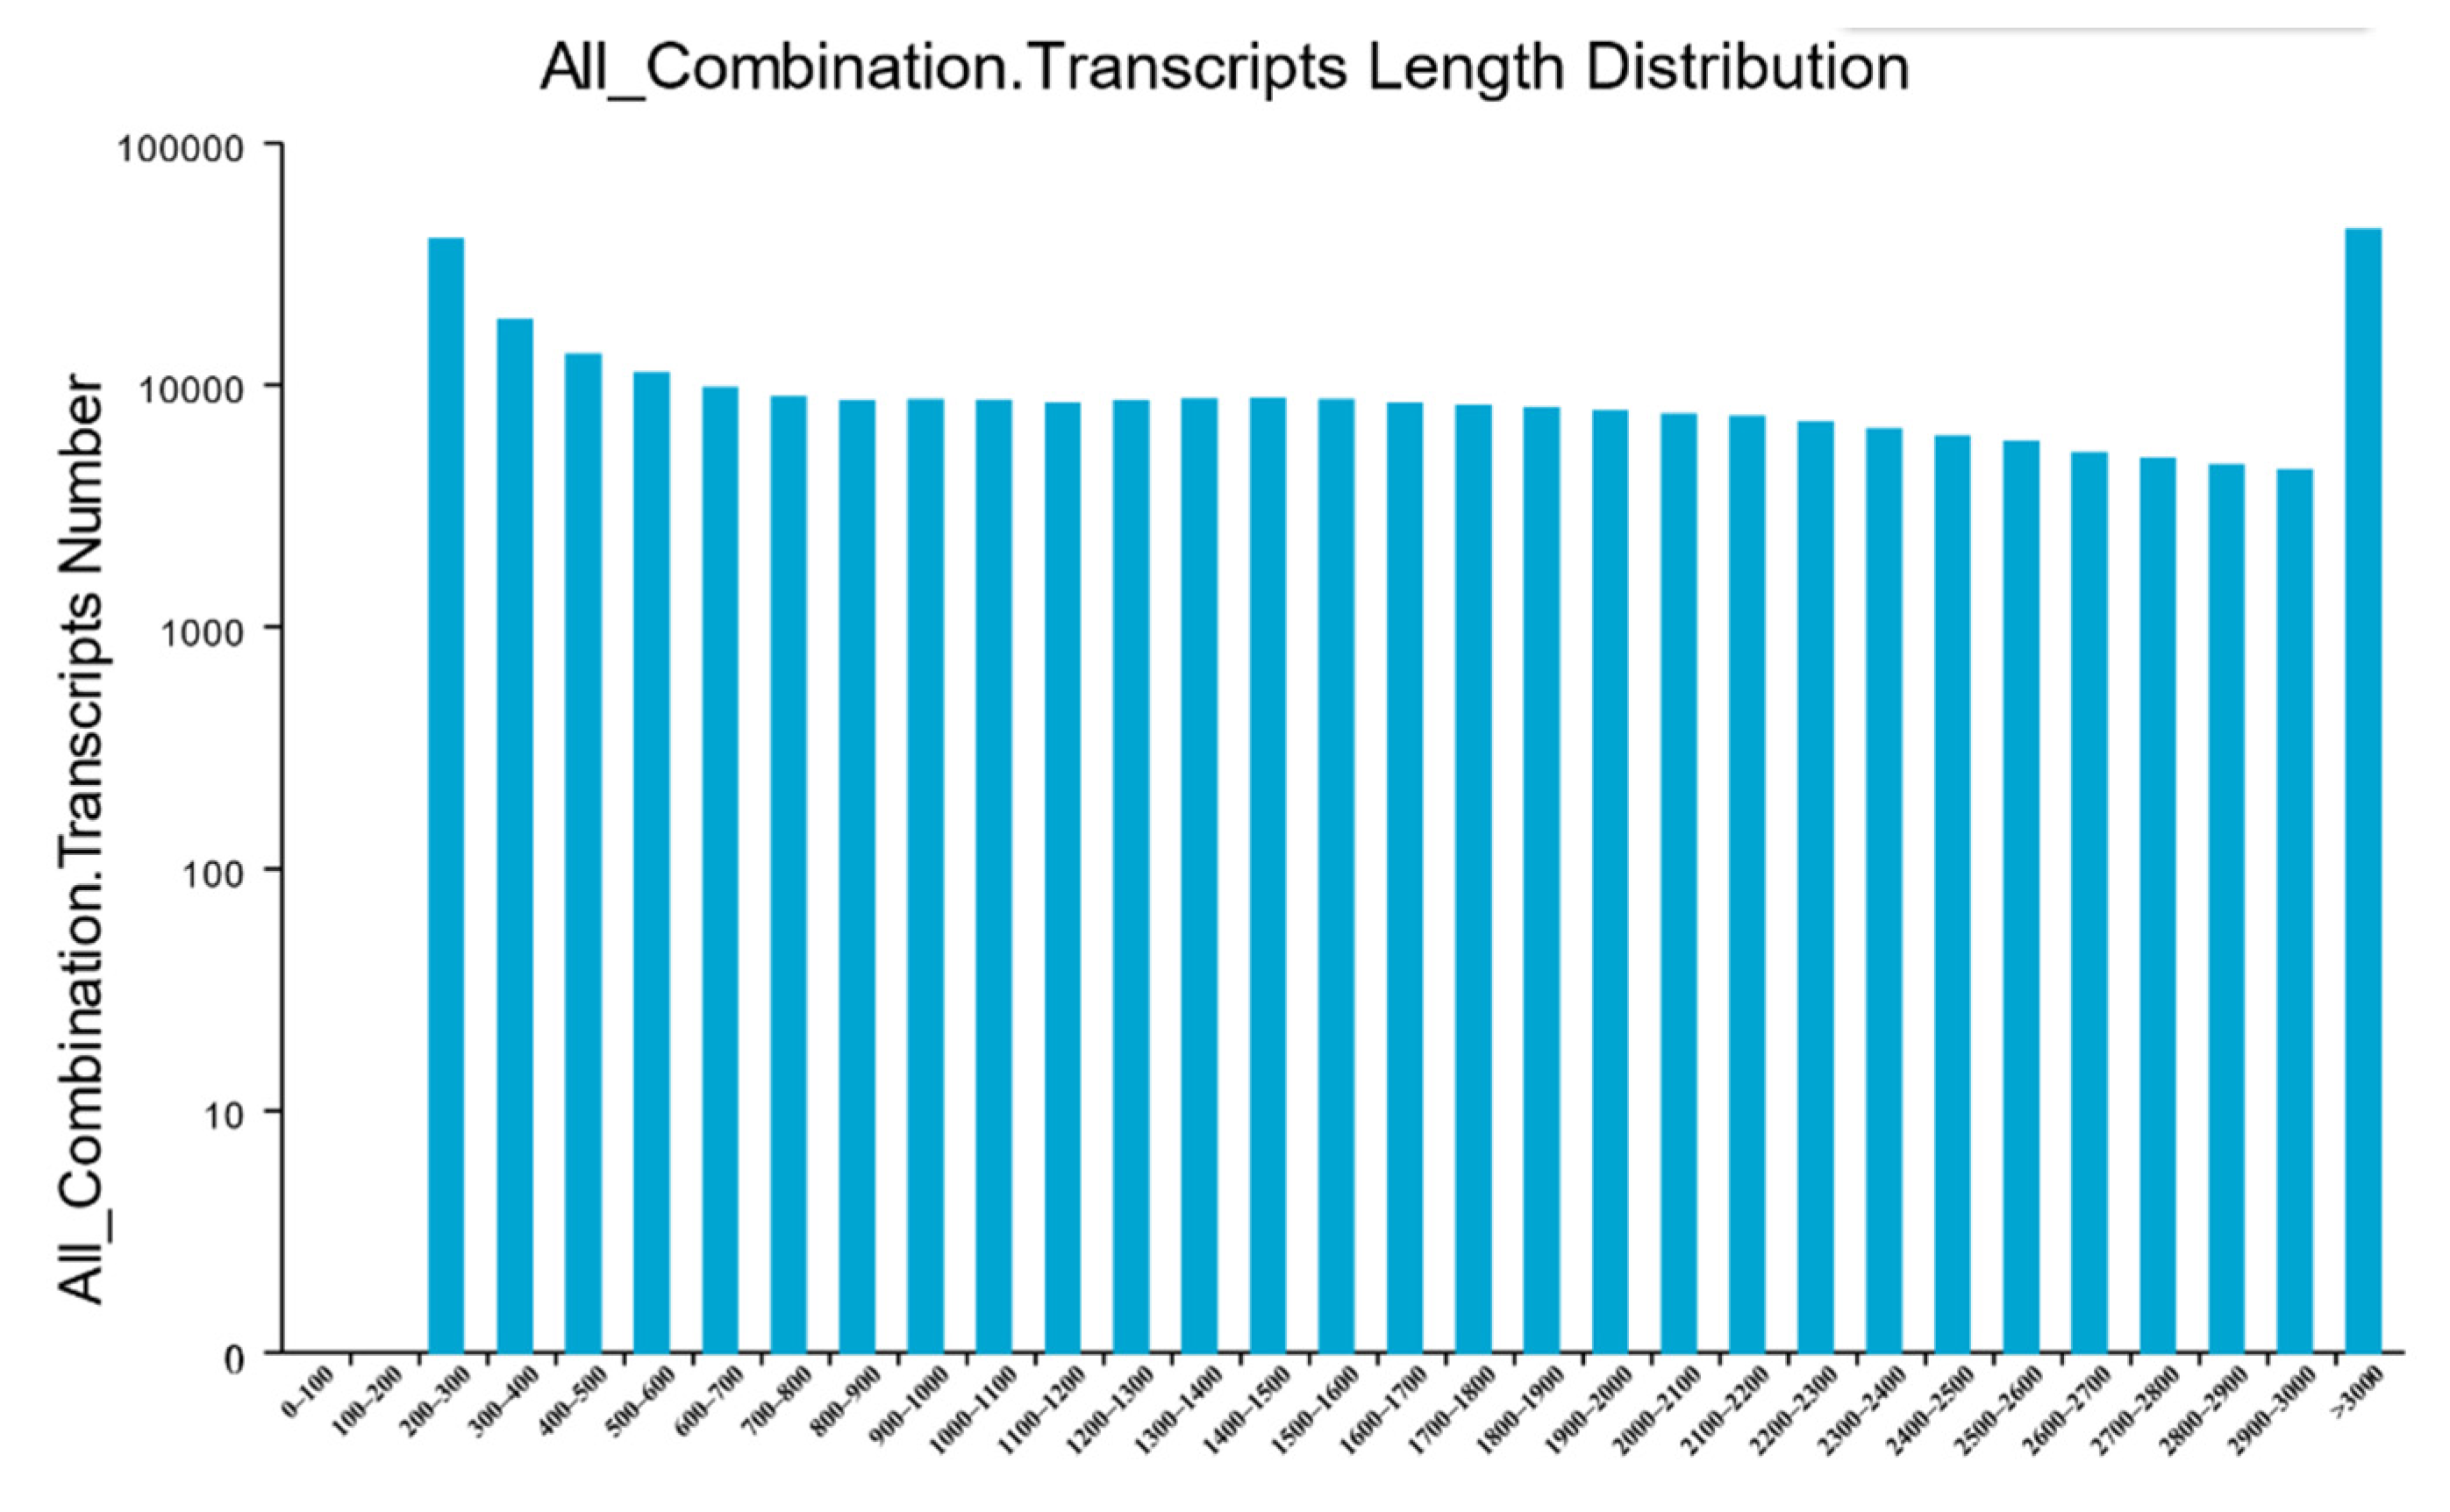
3.2. RNA Sequencing and De Novo Transcriptome Assembly

The cDNA library was constructed using the high-quality RNA extracted from the xylem of “Shanxin” poplar at the six different times. In order to characterize the “Shanxin” poplar transcriptome, the cDNA library was sequenced using the Illumina HiSeq2000 platform. After removing the low-quality reads, adaptors and ambiguous sequences, we generated a total of 121.93 Gb of clean sequencing reads with an average GC content of 44.86%. We then used Trinity [16] to assemble these high-quality reads resulting in 304,694 contigs with an average length of 1633.28 bp and an N50 length of 1764 bp (Table 1). We further assembled 84,733 unigenes with an average length of 804.05 bp. Among these unigenes, 51,512 (60.79%) were >300 bp in length, 31,892 (37.63 %) were >500 bp, 17,603 (20.77 %) were >1000 bp and 9535 (11.25%) were >2000 bp in length (Figure 2).

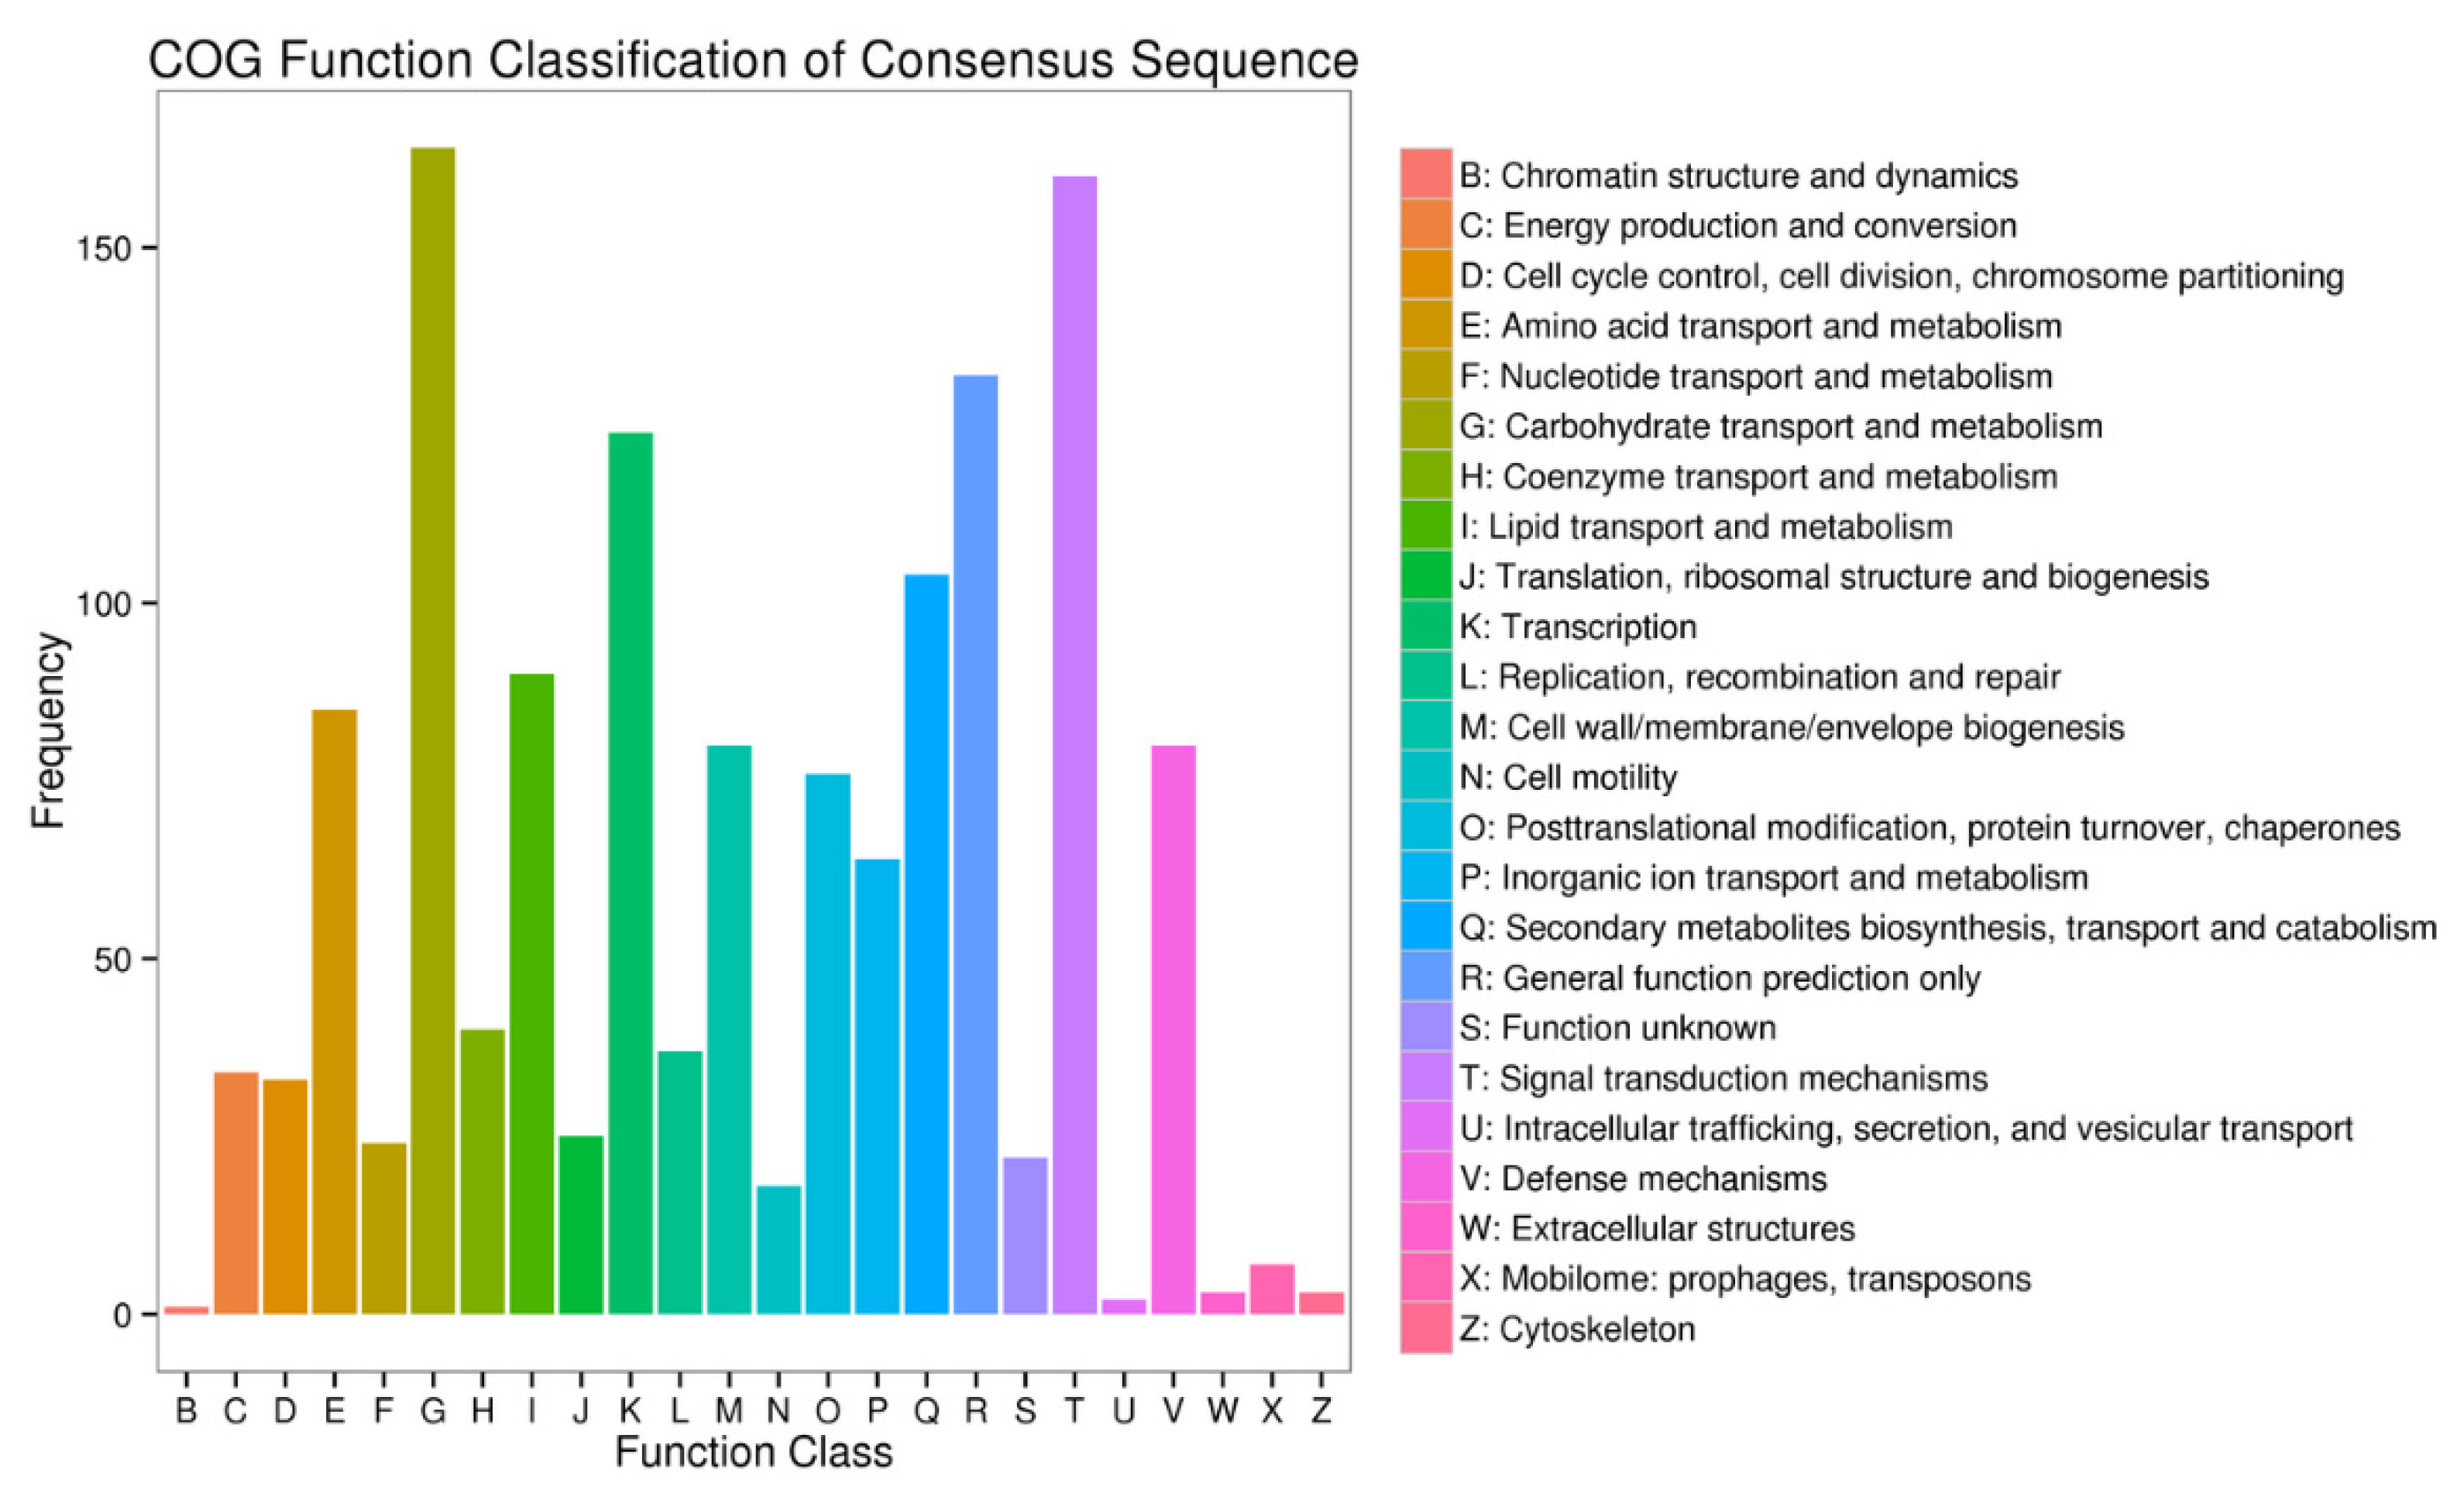
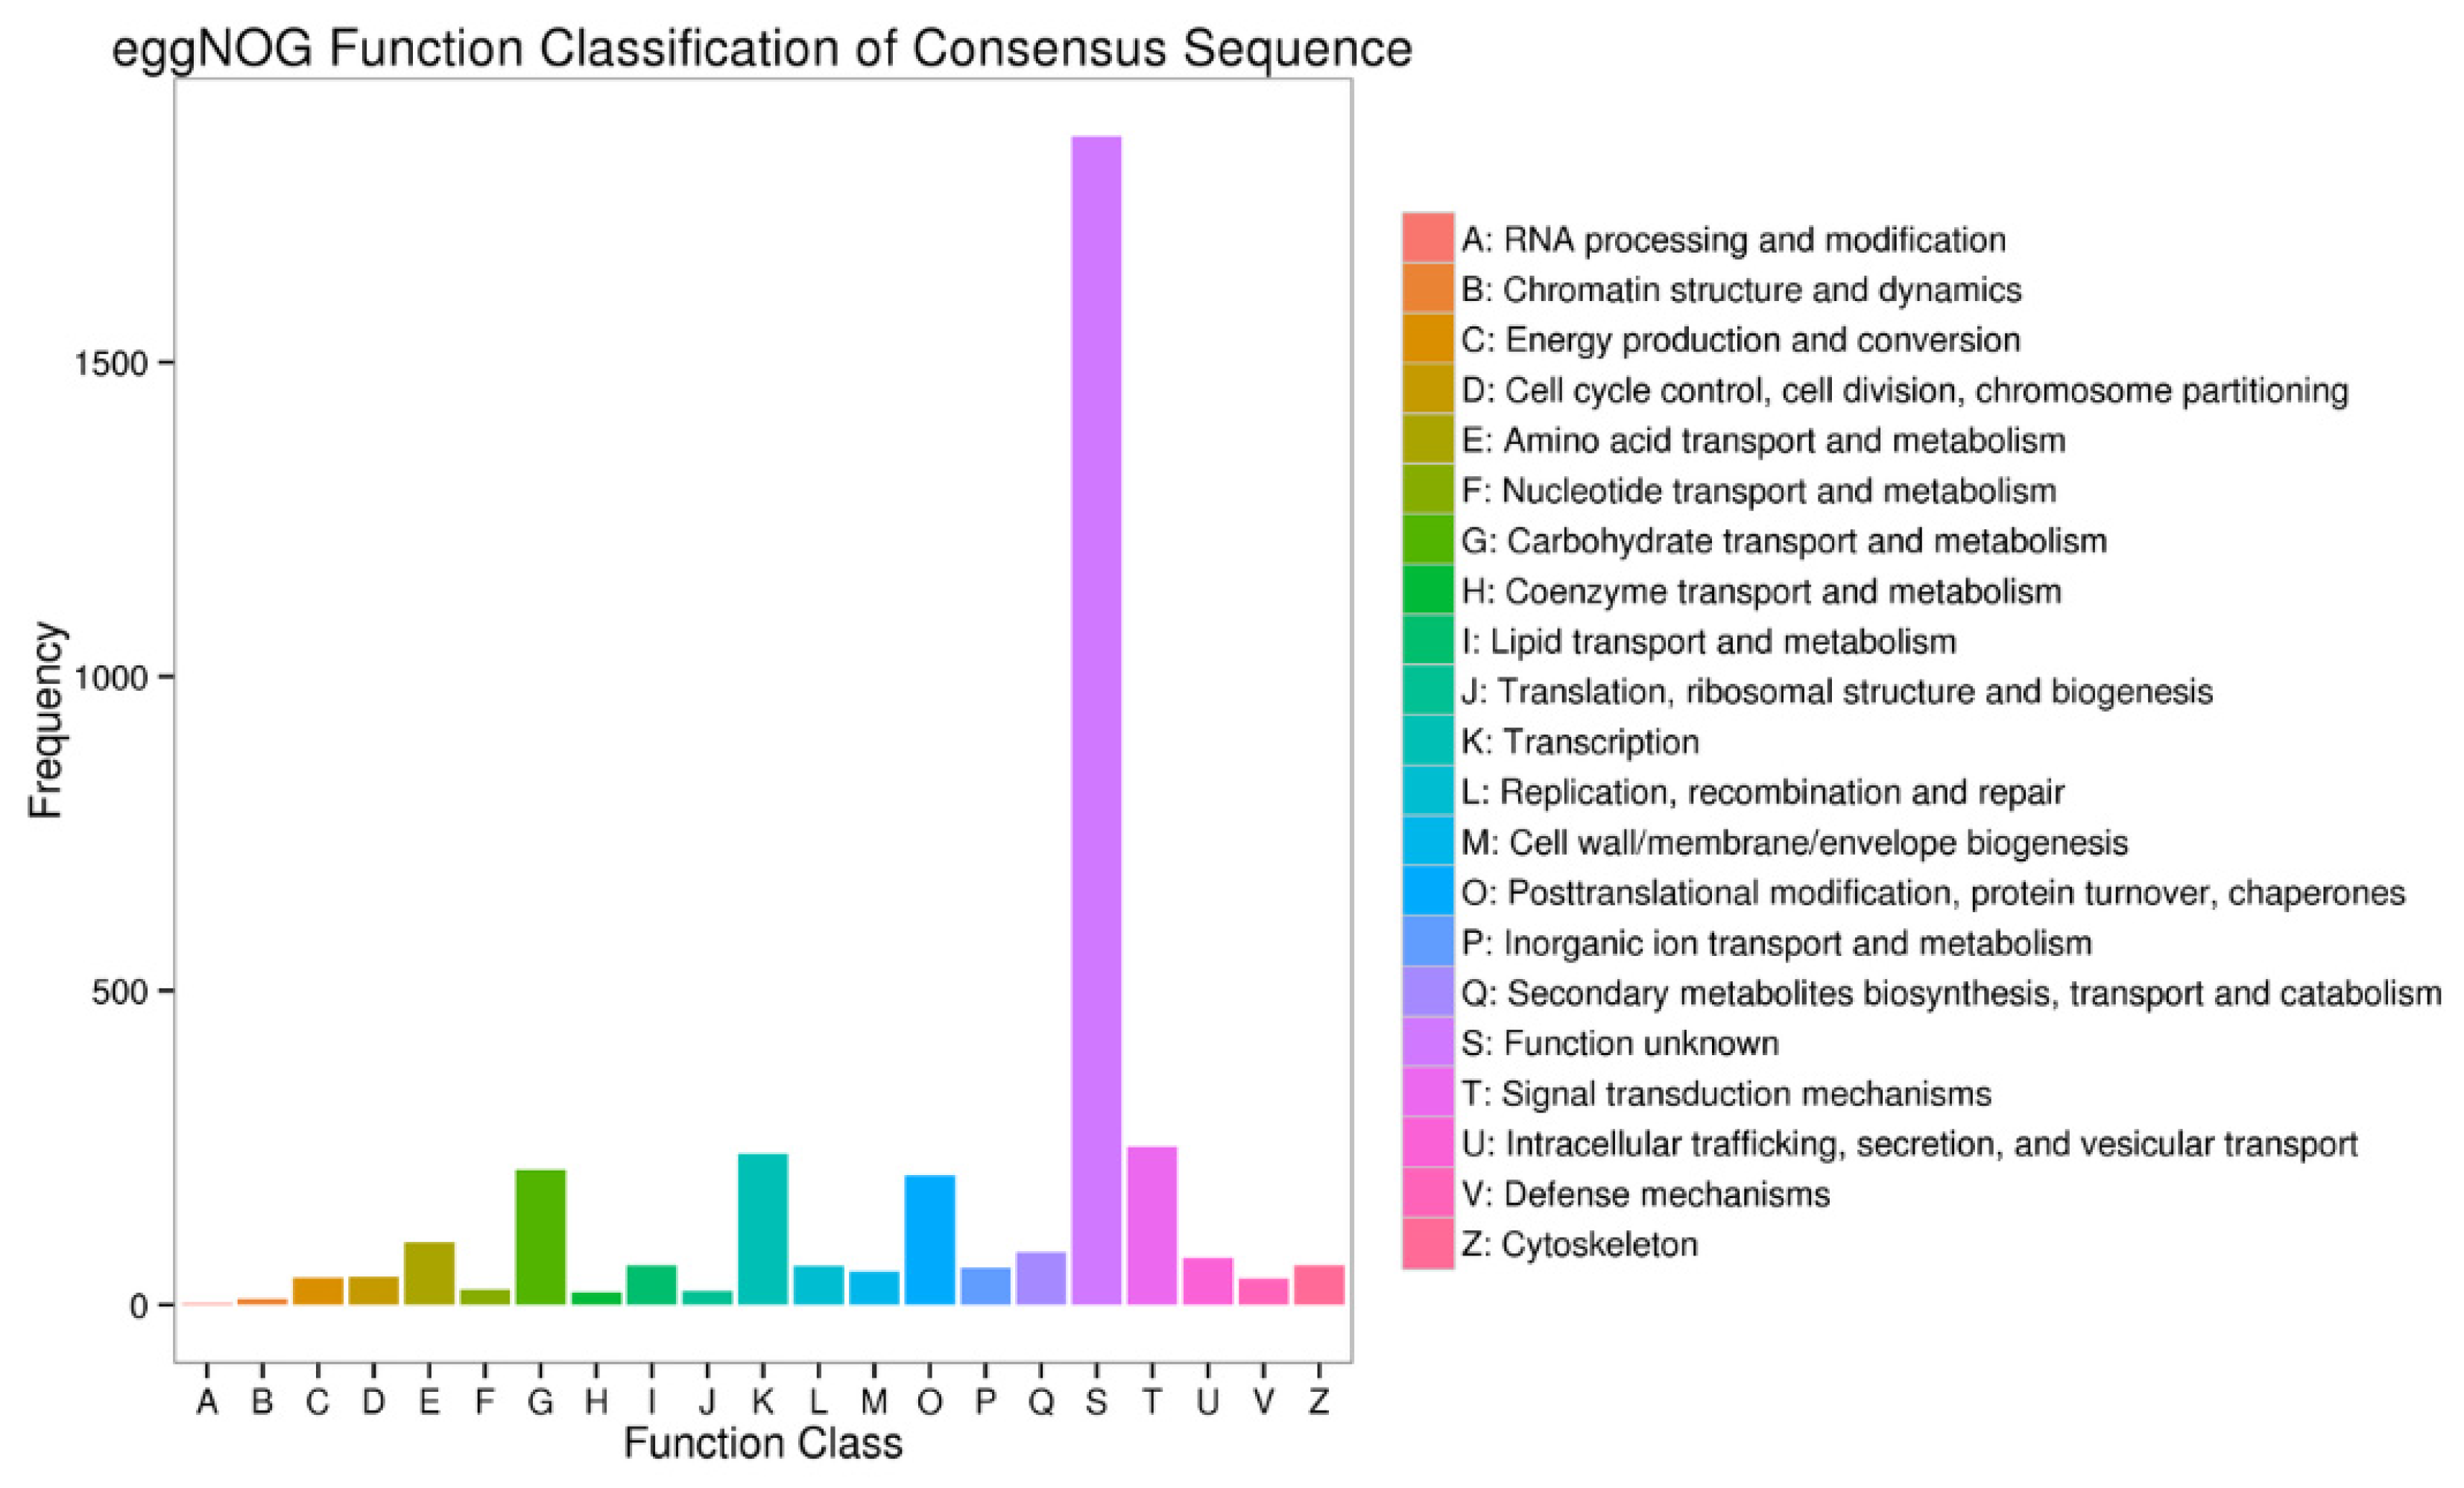
3.3. Functional Annotation of the Unigenes

By using BLAST [20] with an E-value parameter of no greater than 1e−5 and HMMER [21] with an E-value no greater than 1e−10, the assembled unigene sequences were used as search queries against the public databases, including the NCBI nonredundant protein database (Nr) [22]; the Clusters of Orthologous Groups (COGs) [23] database; the euKaryotic Orthologous Groups (KOG) [24] database; the Swiss-Prot [25] protein database; the Gene Ontology (GO) [26] database; the evolutionary genealogy of genes: Non-supervised Orthologous Groups (eggNOG) [27] database, the Protein family (Pfam) [28] database and the Kyoto Encyclopedia of Genes and Genomes (KEGG) [29] database. Altogether, 43,525 of the unigenes were matched to a sequence in at least one of the above-mentioned databases. There were also matches to 40,513 and 37,441 unigenes in the Nr and eggNOG databases, respectively. A small number of unigenes were also used to search another six databases, as shown in Table 2.
The GO analysis is widely used to assign recognized gene function to uncharacterized sequences. Based on information from the Nr annotation and the WEGO program, we assigned 40,513 unigenes to 50 different functional groups (Figure 2), and these groups were separated into the three major GO terms “biological process”, “cellular component” and “molecular function” using BLAST2GO. In the “biological process” category, the unigenes related to “metabolic process” and “cellular process” accounted for a large proportion, followed by “single-organism process” and “biological regulation”. In the “cellular component” category, the GO terms “membrane part”, “organelle part”, “cell part” and “cell” predominated, while “catalytic activity” and “binding” were the two most represented GO terms in the “molecular function” category.
We used the Cluster of Orthologous Groups (COG) database, which was constructed based on the systematic evolutionary relationships of bacteria, algae and eukaryotes to perform a phylogenetic classification of the “Shanxin” poplar gene sequences (Supplementary Table S1). For example, in the S1 vs. S2 comparison, “Carbohydrate transport and metabolism” represented the largest group, followed by “Signal transduction mechanism”. In addition, only a few unigenes grouped in the “Energy production and conversion” and “Intracellular trafficking, secretion, and vesicular transport” categories. Compared with the eggNOG database, which contains the functional description and functional classification of orthologous proteins, we can see the differences between different time points more clearly (Figure 3 and Figure 4).

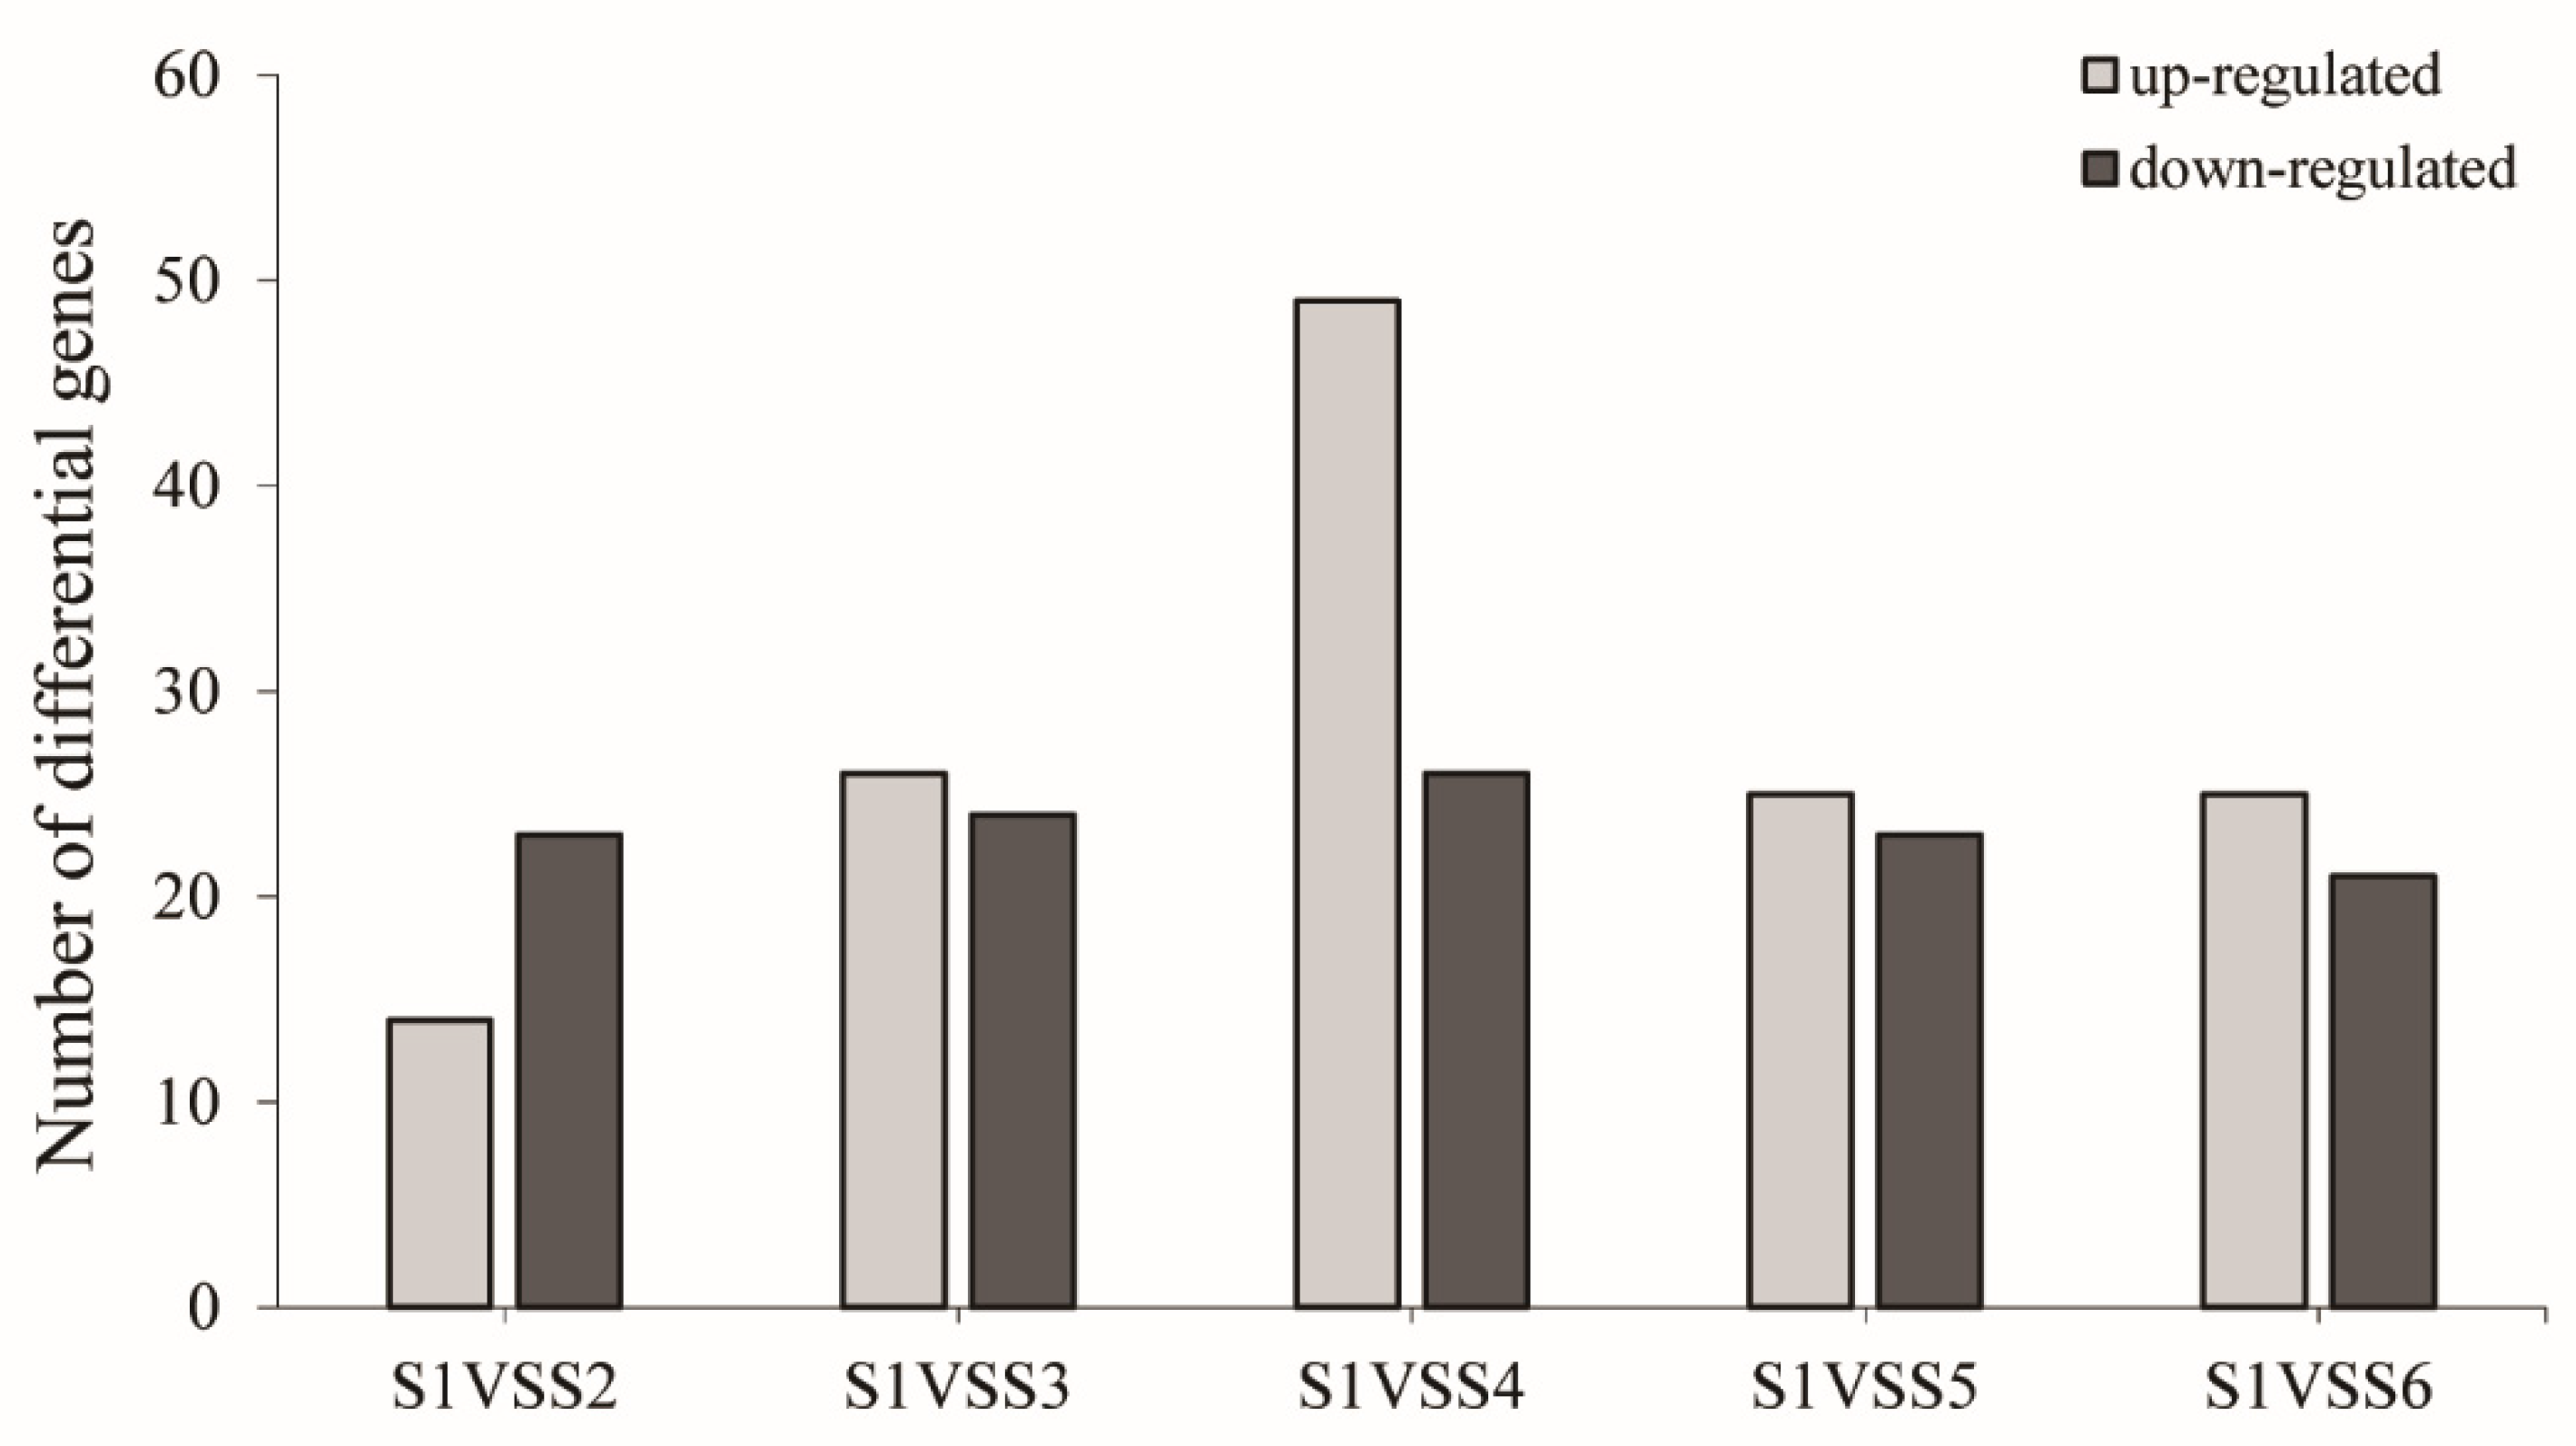
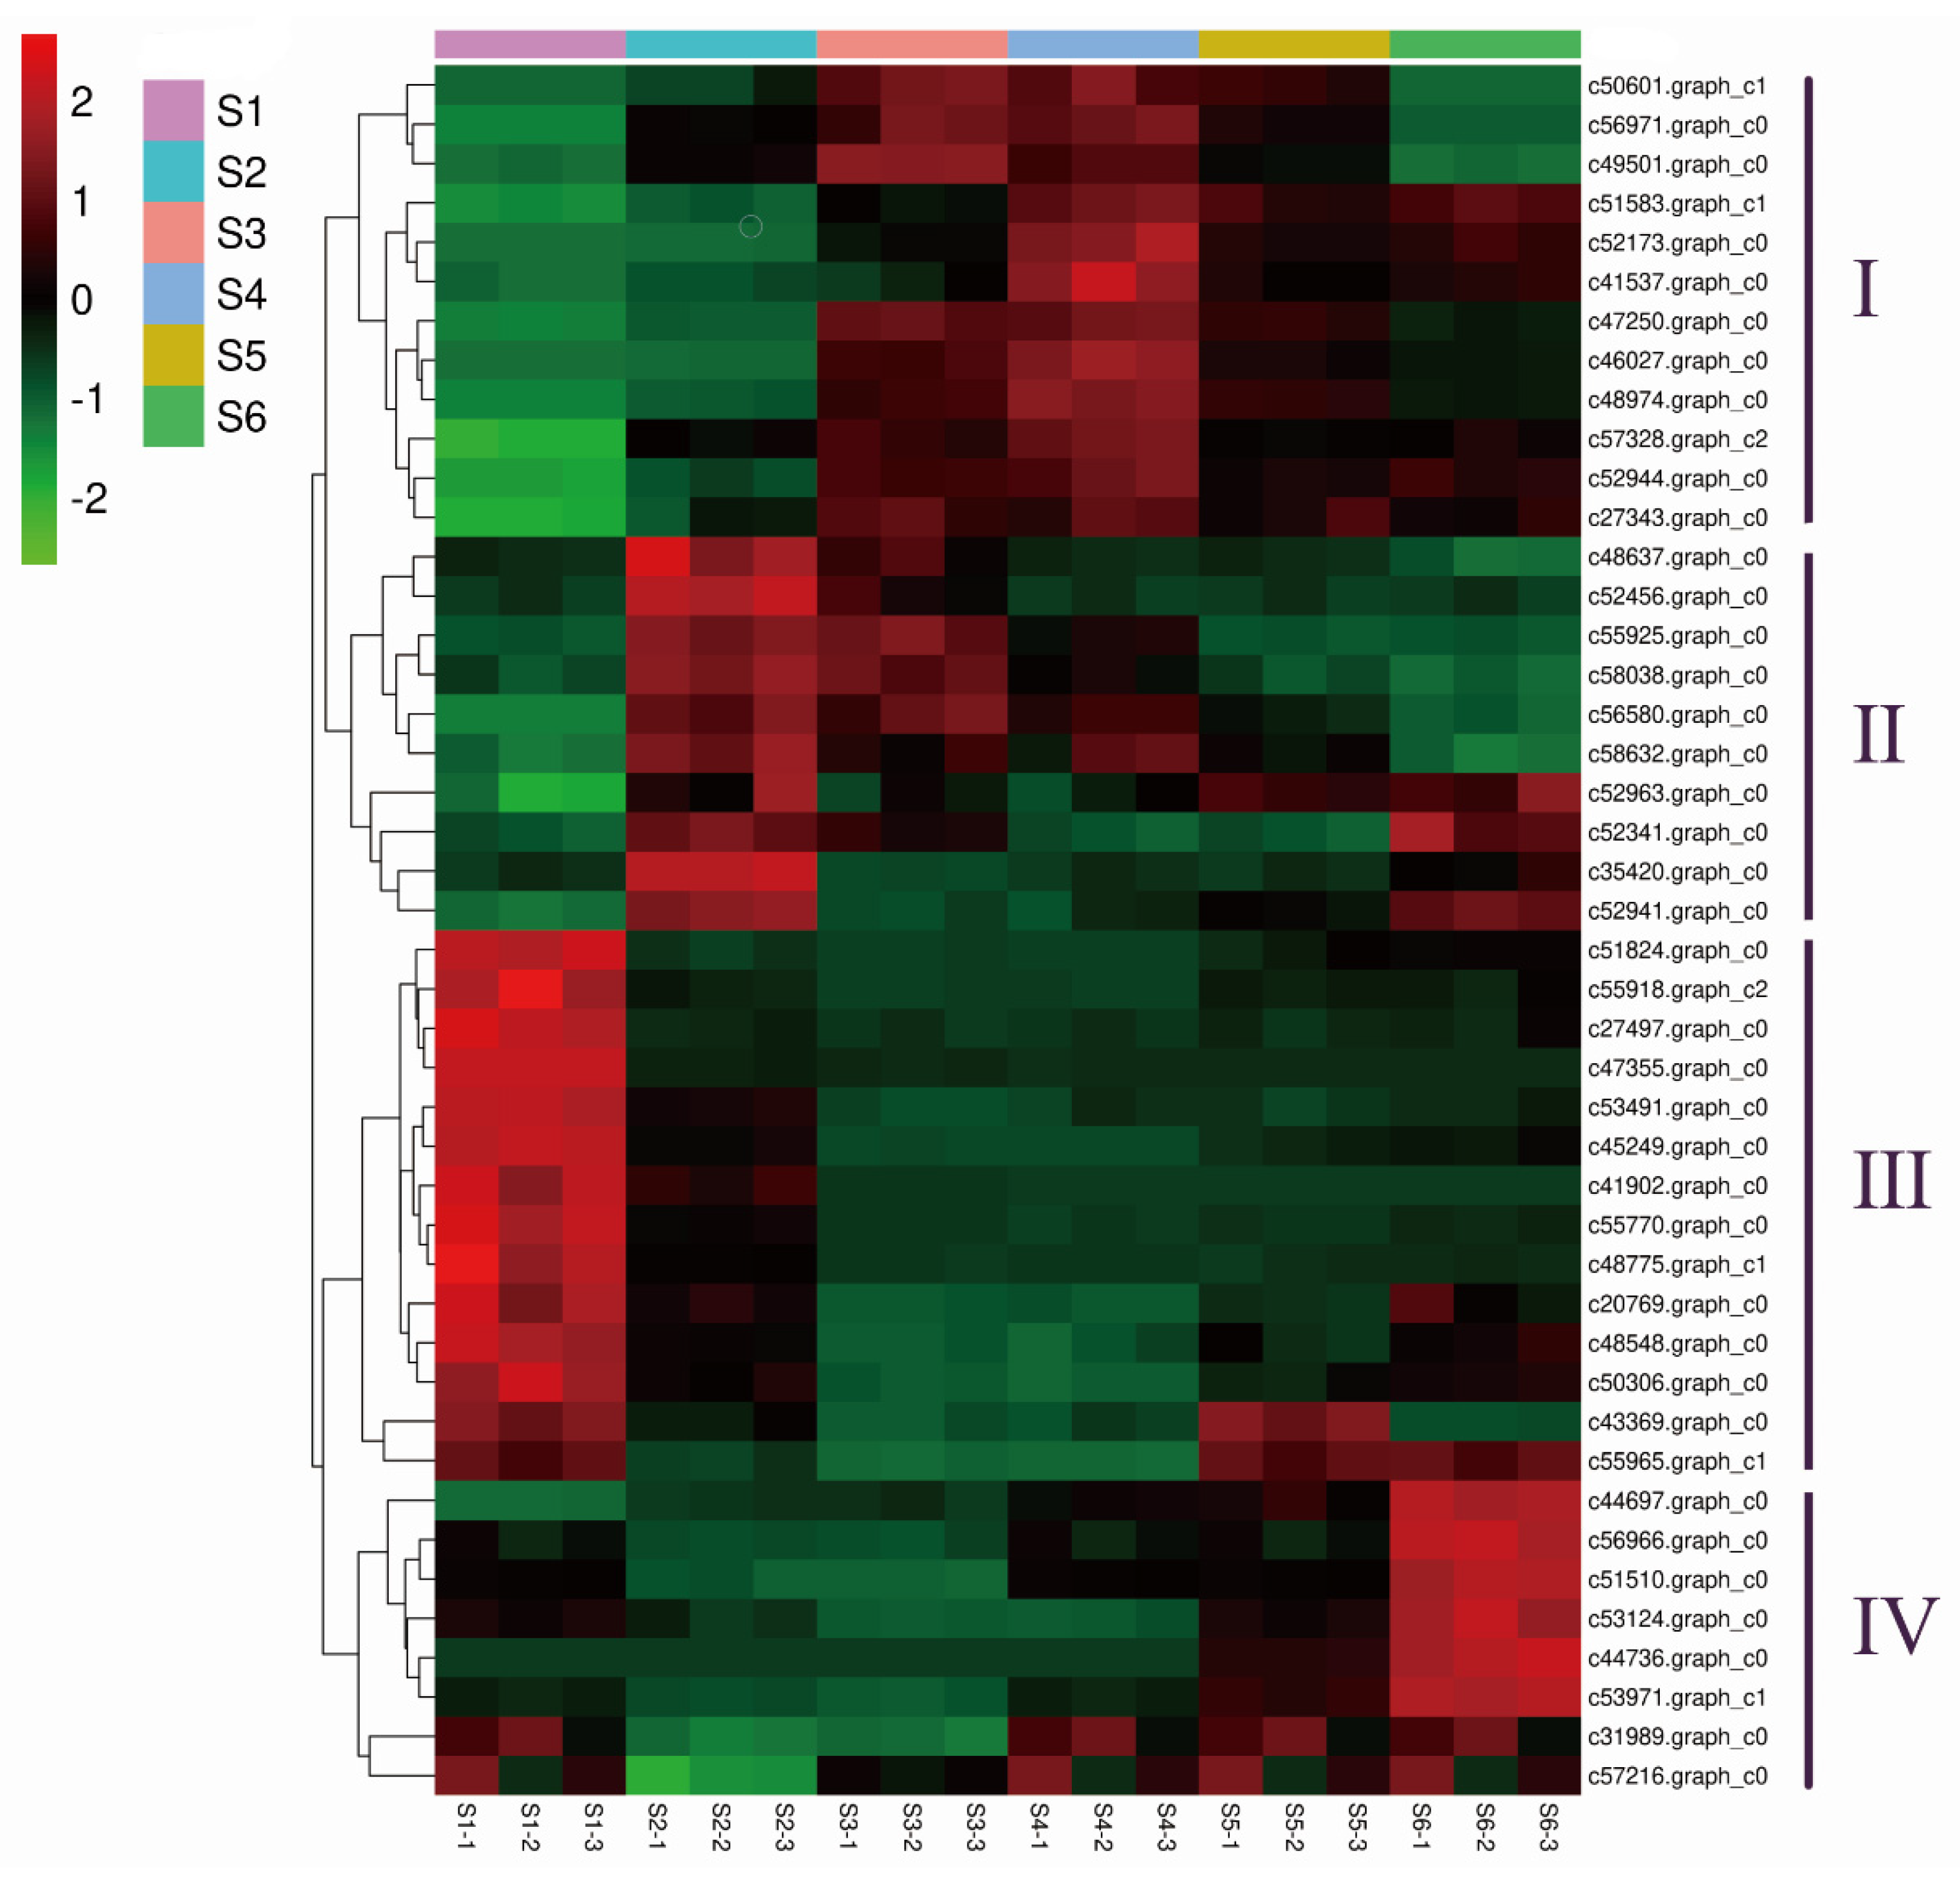
3.4. Identification of Differentially Expressed Genes (DEGs)

In order to fully understand the seasonal response of xylem development in the “Shanxin” poplar and to identify related genes, we constructed six cDNA libraries from samples taken at six time points from 22 April to 4 August (samples S1–S6). We then used DESeq2 to analyze the differential gene expression between the sample groups to obtain the DEG sets. Based on the standard criteria used to identify DEGs, including a low false discovery rate (FDR, <10−3) and |log2FPKM| > 1.0 [30], a difference in the number of DEGs in comparison of two samples was obtained. Taking S1 as the control, a total of 4273 unigenes were considered to be differentially expressed between S1 and S2 (2091 upregulated and 2182 downregulated), 8282 unigenes between S1 and S3 (4014 upregulated and 4268 downregulated), 8587 unigenes between S1 and S4 (4266 upregulated and 4321 downregulated), 6852 unigenes between S1 and S5 (3833 upregulated and 3019 downregulated) and 5875 unigenes between S1 and S6 (3308 upregulated and 2567 downregulated). This shows clearly that, as the seasons change, the trend in the number of differential genes shows an initial increase followed by a decrease. The greatest number of DEGs (8587) was enriched in the S1 vs. S4 group, while the fewest (907) were enriched in the S3 vs. S4 group (Table 3). For the S4 vs. S5 comparison, there were more upregulated DEGs than downregulated DEGs. There were more downregulated DEGs than upregulated DEGs in the S5 vs. S6 comparison, whereas the other comparisons gave a roughly similar number of upregulated and downregulated DEGs.

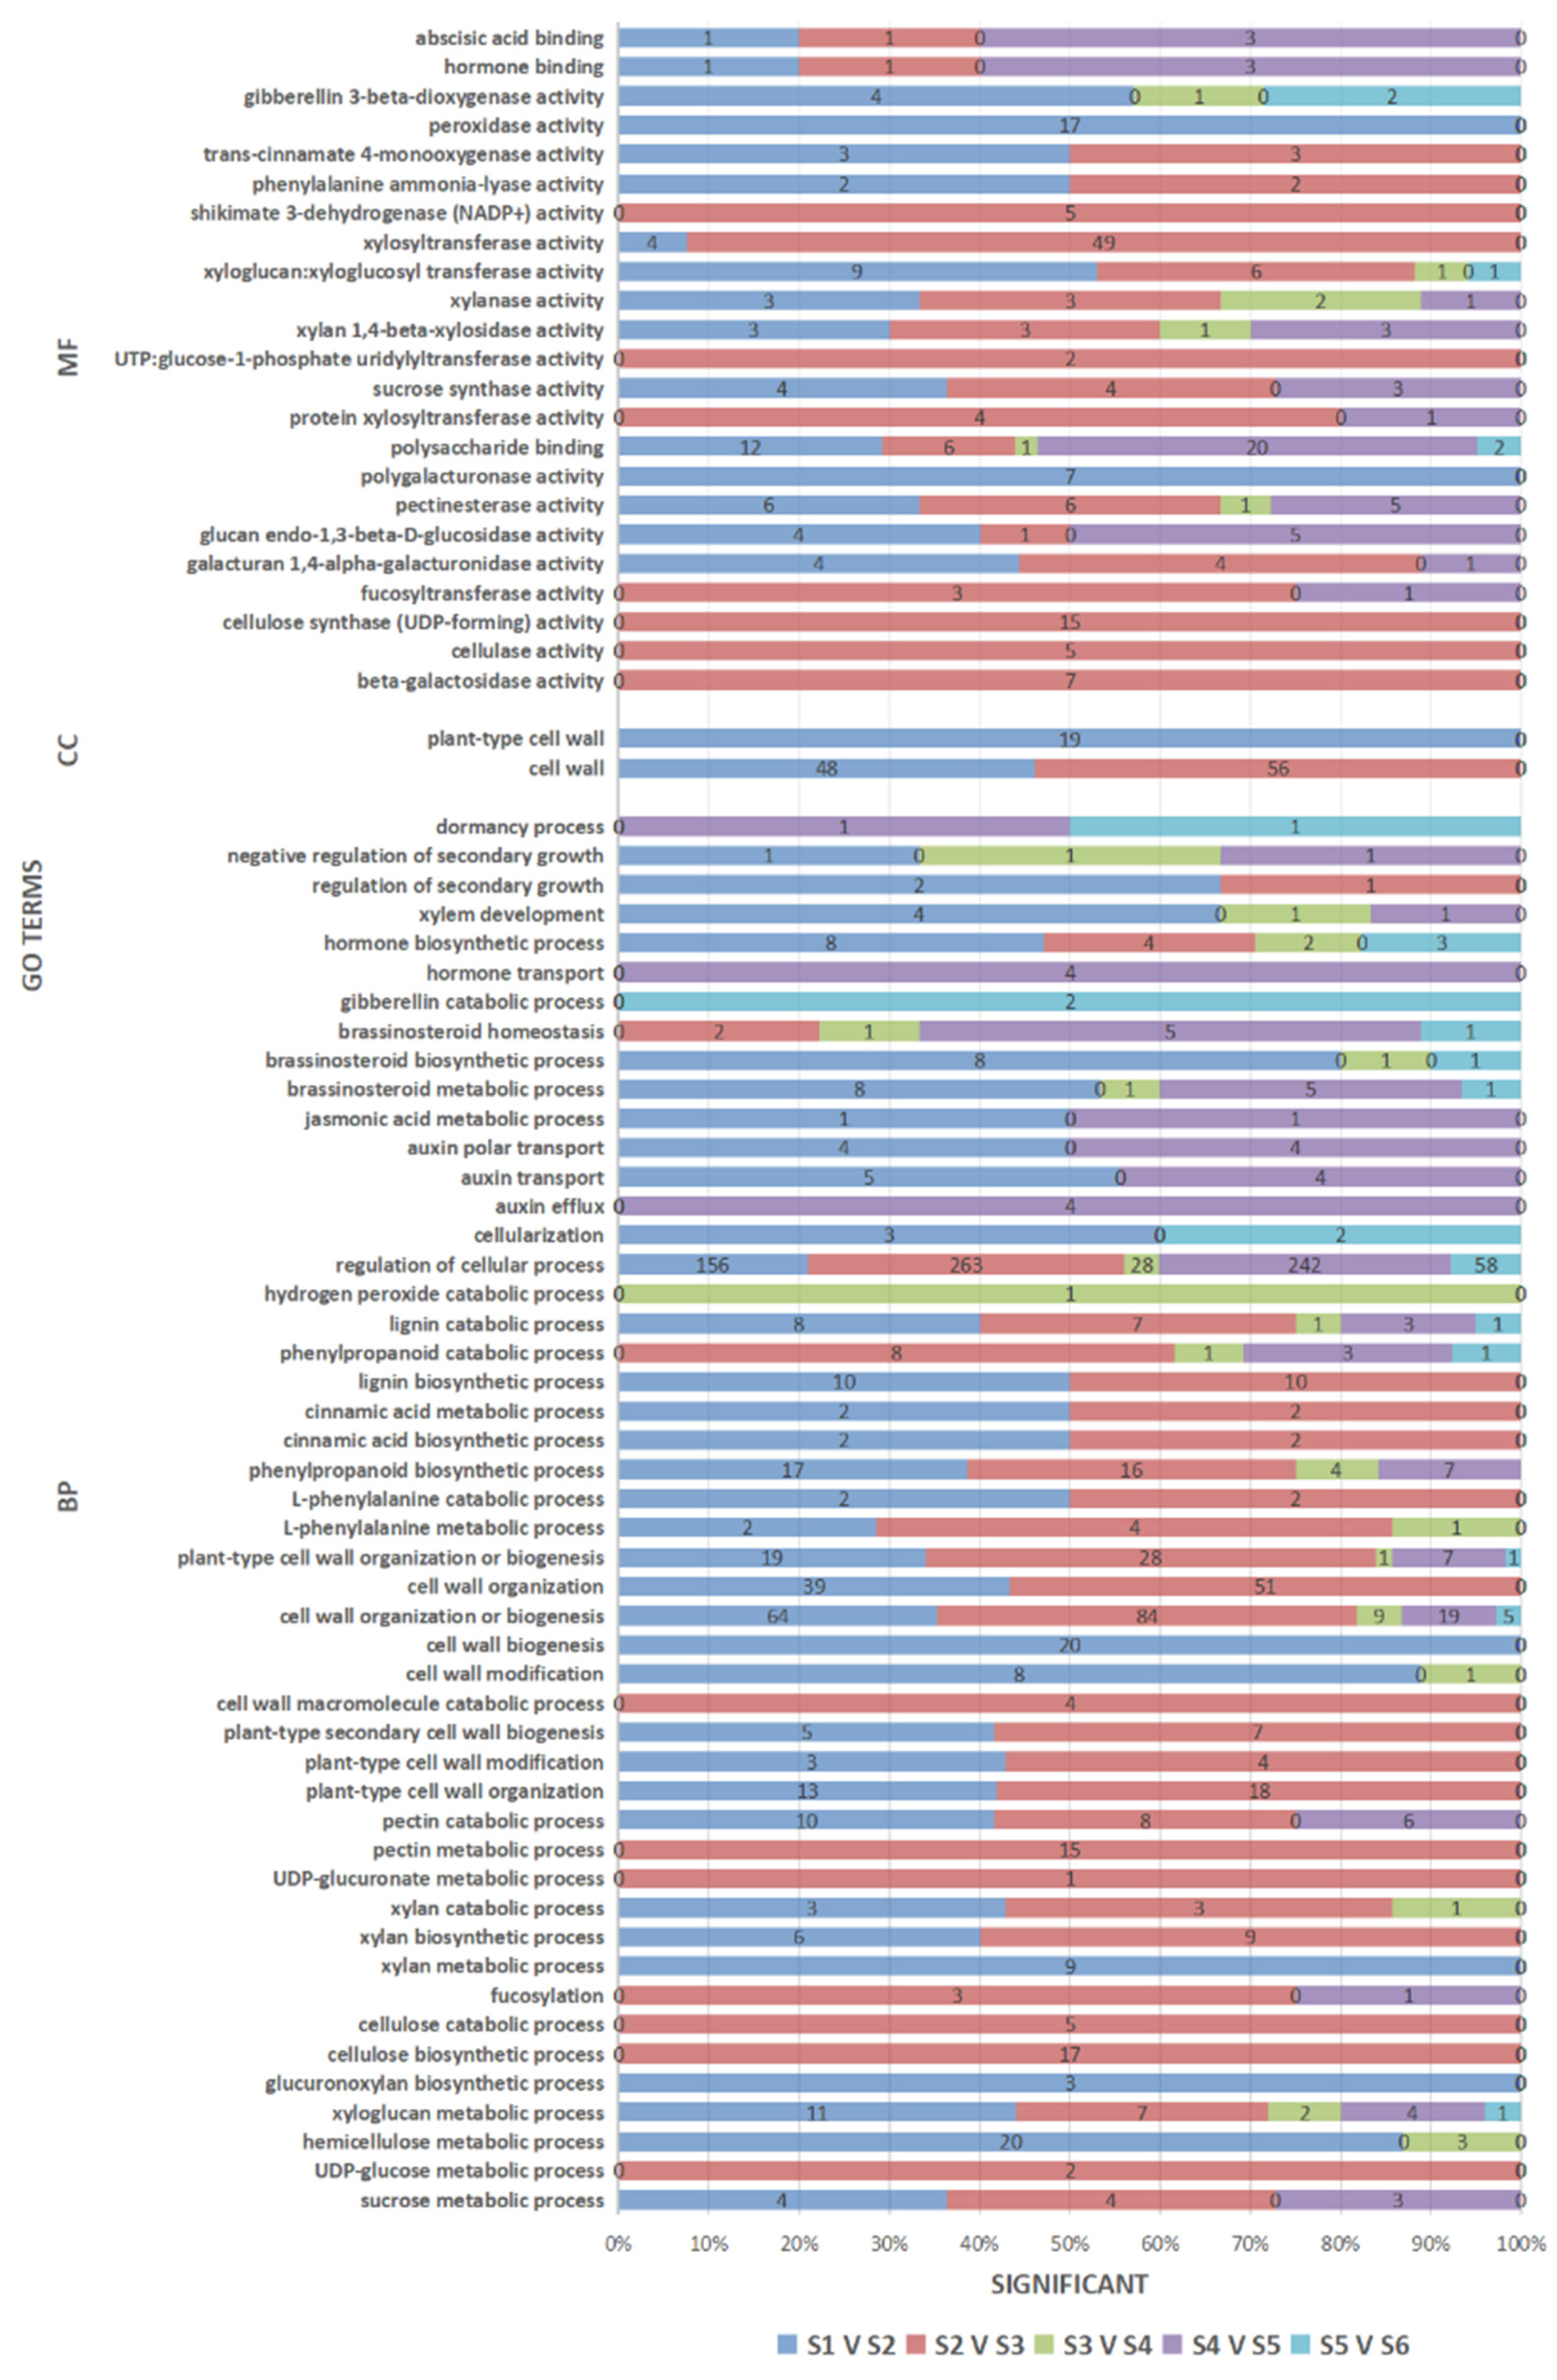
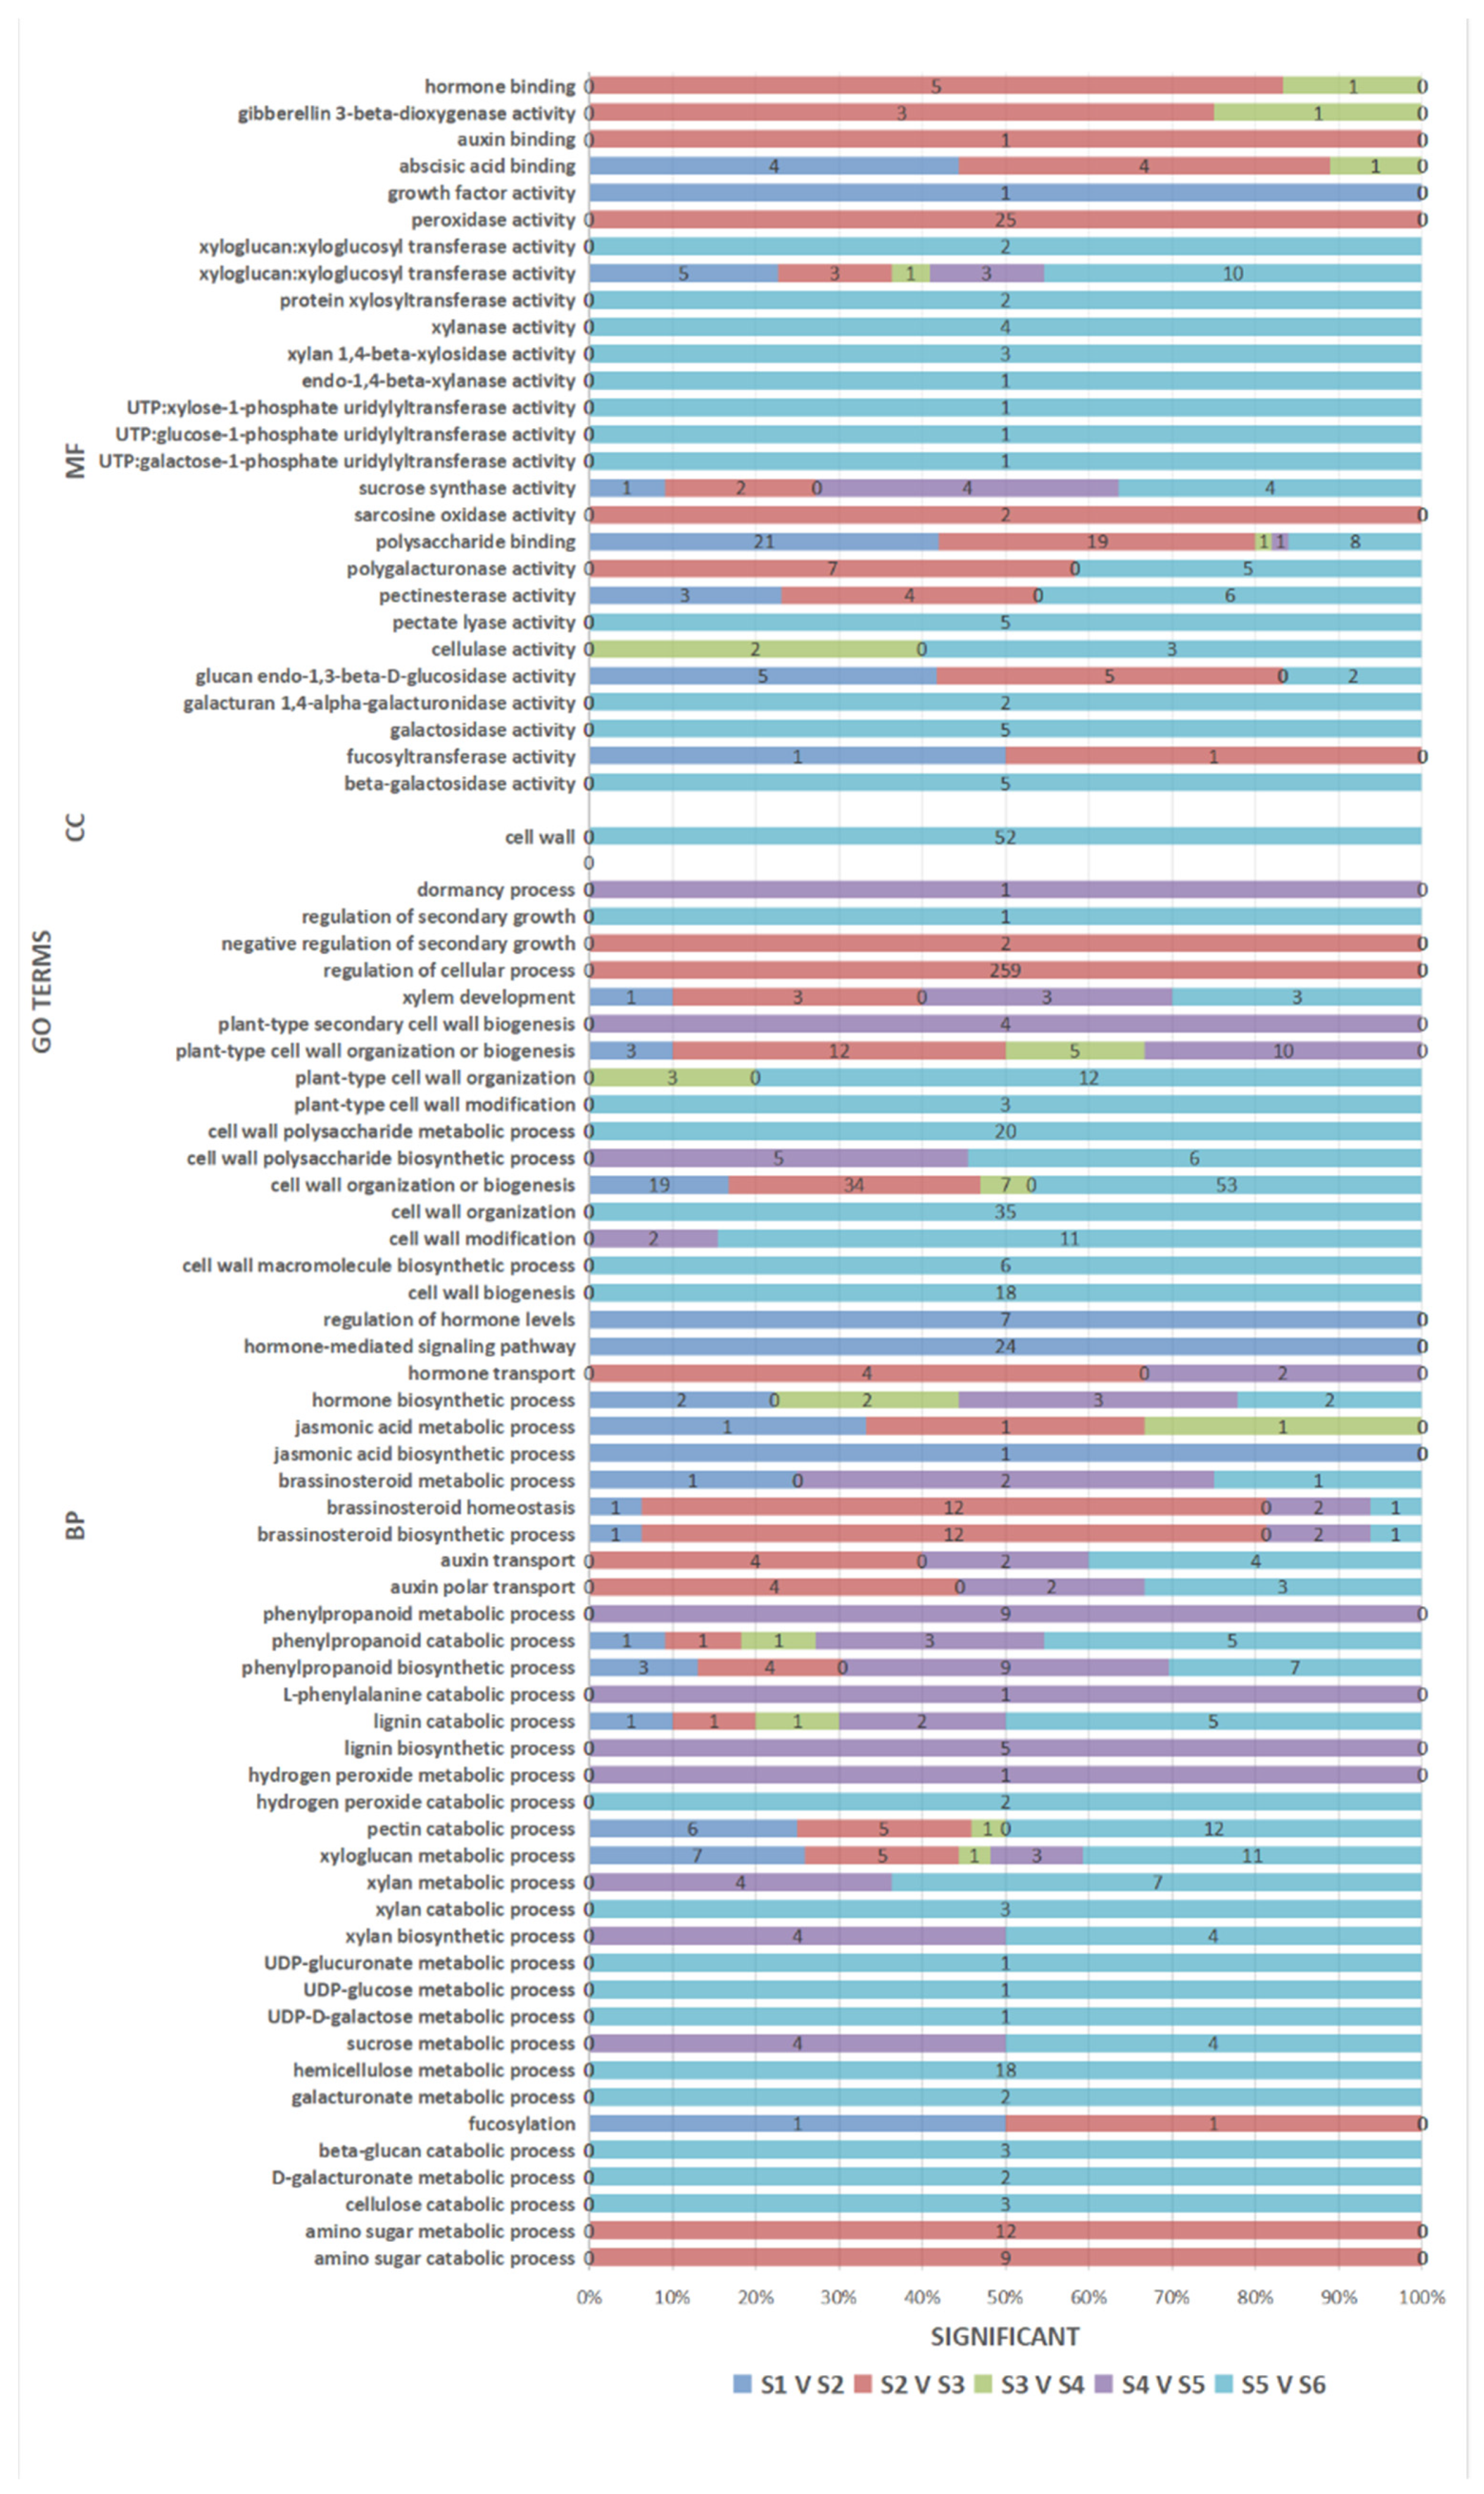
3.5. GO Enrichment Analysis of the DEGs

To explore the biological processes involved in xylem development during the seasonal change, pairwise comparisons of the samples were performed, including S1 vs. S2, S2 vs. S3, S3 vs. S4, S4 vs. S5 and S5 vs. S6 (Supplementary Table S2). Significantly enriched GO terms were then determined using a hypergeometric test to identify the functional clusters and biochemical pathways (corrected p-value). GO terms related to the different processes of xylem development were identified, such as terms related to hormones, cell wall polysaccharide biosynthesis and metabolism, lignin biosynthesis and metabolism and cell wall or xylem. Most of the GO terms related to cell wall formation and thickness in the upregulated genes were enriched in S1 vs. S2 and S2 vs. S3, while the GO terms related to hormones were enriched in S1 vs. S2 and S4 vs. S5 (p < 0.05; Figure 5). This suggests that these biological processes may play important roles in the corresponding stages of xylem development. In the downregulated genes, GO terms related to cell wall formation and thickness were enriched in S4 vs. S5 and S5 vs. S6, while GO terms related to hormones were enriched in S1 vs. S2 and S2 vs. S3 (p < 0.05; Figure 6).

3.6. Pathway Enrichment Analysis of the DEGs

Using the KEGG database, the pathways with significant changes (Q value ≤ 0.01) in xylem development among the different seasonal stages were determined (Table 4). The analysis showed that the “phenylpropanoid biosynthesis” pathway was significantly enriched in the DEGs in the S1 vs. S2, S1 vs. S5 and S1 vs. S6 comparisons; “plant hormone signal transduction” was enriched in the DEGs in the S1 vs. S2 and S1 vs. S3 comparisons; “starch and sucrose metabolism” was enriched in DEGs in all comparisons and “amino sugar and nucleotide sugar metabolism” was enriched in the DEGs in the S1 vs. S3 and S1 vs. S4 comparisons. In addition, “endocytosis”, “plant–pathogen interaction”, “phagosome” and “diterpenoid biosynthesis” were also significantly enriched in some comparisons. Some DEGs were found to be enriched in multiple KEGG pathways, such as c27167.graph_c0 (peroxidase 12-like (Populus euphratica)), c31851.graph_c0 (pathogenesis-related family protein (Populus trichocarpa)) and c20733.graph_c0 (probable fructokinase-1 (Populus euphratica)), which also shows the importance of these genes in xylem development of Shanxin Poplar.

3.7. Expression of Genes Related to Cell Expansion and Cell Wall Biosynthesis

Xylem development occurs via complex processes in vascular cambium cells through cell division, cell differentiation and expansion, secondary wall formation and programmed cell death [31]. Expansin and XTH genes are the two most important genes involved in cell expansion and cell wall synthesis [32]. We identified 10 differentially expressed expansin genes in the six different time points, and six of these genes were found to be highly expressed in stages S2 and S3 and downregulated in S5 and S6. Twelve XTH genes were identified, eight of which showed a significant upregulated expression after S2, with a declining expression at S5 (Figure 7). According to the comprehensive analysis of the gene expression and the cross-sectional section of the stem, it is speculated that these EXP and XTH genes may be involved in the regulation of cell expansion and cell wall synthesis in the early stages of xylem development.

3.8. Expression of Genes Related to Polysaccharide Biosynthesis and Metabolism

The cell wall includes the primary cell wall and secondary cell wall. Unlike the primary cell walls, which are initiated during cell division and develop along with the expansion of the cells, secondary cell walls are constructed after the cells have stopped growing [33]. The biosynthesis of cellulose in plant cell walls is mainly catalyzed by cellulose synthase (CesA) [34]. In the sequencing results, we identified 21 genes encoding cellulose synthase (CesA), 19 of which were upregulated in S2 and S3, including four that were significantly upregulated (Figure 8). In S4 and S5, the expression levels were flat, while in S6, the expression decreased slightly. At the same time, we identified six sucrose synthase-related genes, four of which were significantly upregulated in S2 and S3, and their expression levels declined continuously in S4–S6 (Figure 9).
The sugar metabolism, including pentose phosphate and glycolysis, is ubiquitous in most organisms and plays an important role in the development of xylem in plants [34]. As shown in Supplementary Table S3, there are a total of 66 DEGs in S1 vs. S2, 149 in S1 vs. S3, 149 in S1 vs. S4, 110 in S1 vs. S5 and 107 in S1 vs. S6 related to polysaccharide biosynthesis and metabolism. It can be seen that the number of DEGs is the highest in S3, in which 73 are upregulated and 76 are downregulated. Among these genes, there are more DEGs involved in regulating the “starch and sucrose metabolism” pathways than other pathways. This finding indicates that the “starch and sucrose metabolism” pathway in the xylem of “Shanxin” poplar is more important during seasonal changes and that June is an important period in xylem development.
Changes in energy metabolism alter SCW accumulation and composition. Transgenic tomato plants with altered enzyme activities associated with the tricarboxylic acid (TCA) cycle exhibited a substantial reduction in cellulose and lignin during xylem vessel development in the roots [35]. The starch and sucrose metabolism pathway participates in the synthesis of ADP-glucose and GDP-glucose by providing a-D-glucose.
It is worth noting that expression of the c48648.graph_c0 (pectin esterase inhibitor 33 OS), c51200.graph_c0 (vacuolar invertase family protein) and c46943.graph_c0 (Probable fructokinase-5 OS) genes is almost undetectable in S1, and that the expression levels peak in S3. We speculate that these genes play positive roles in regulating xylem development.

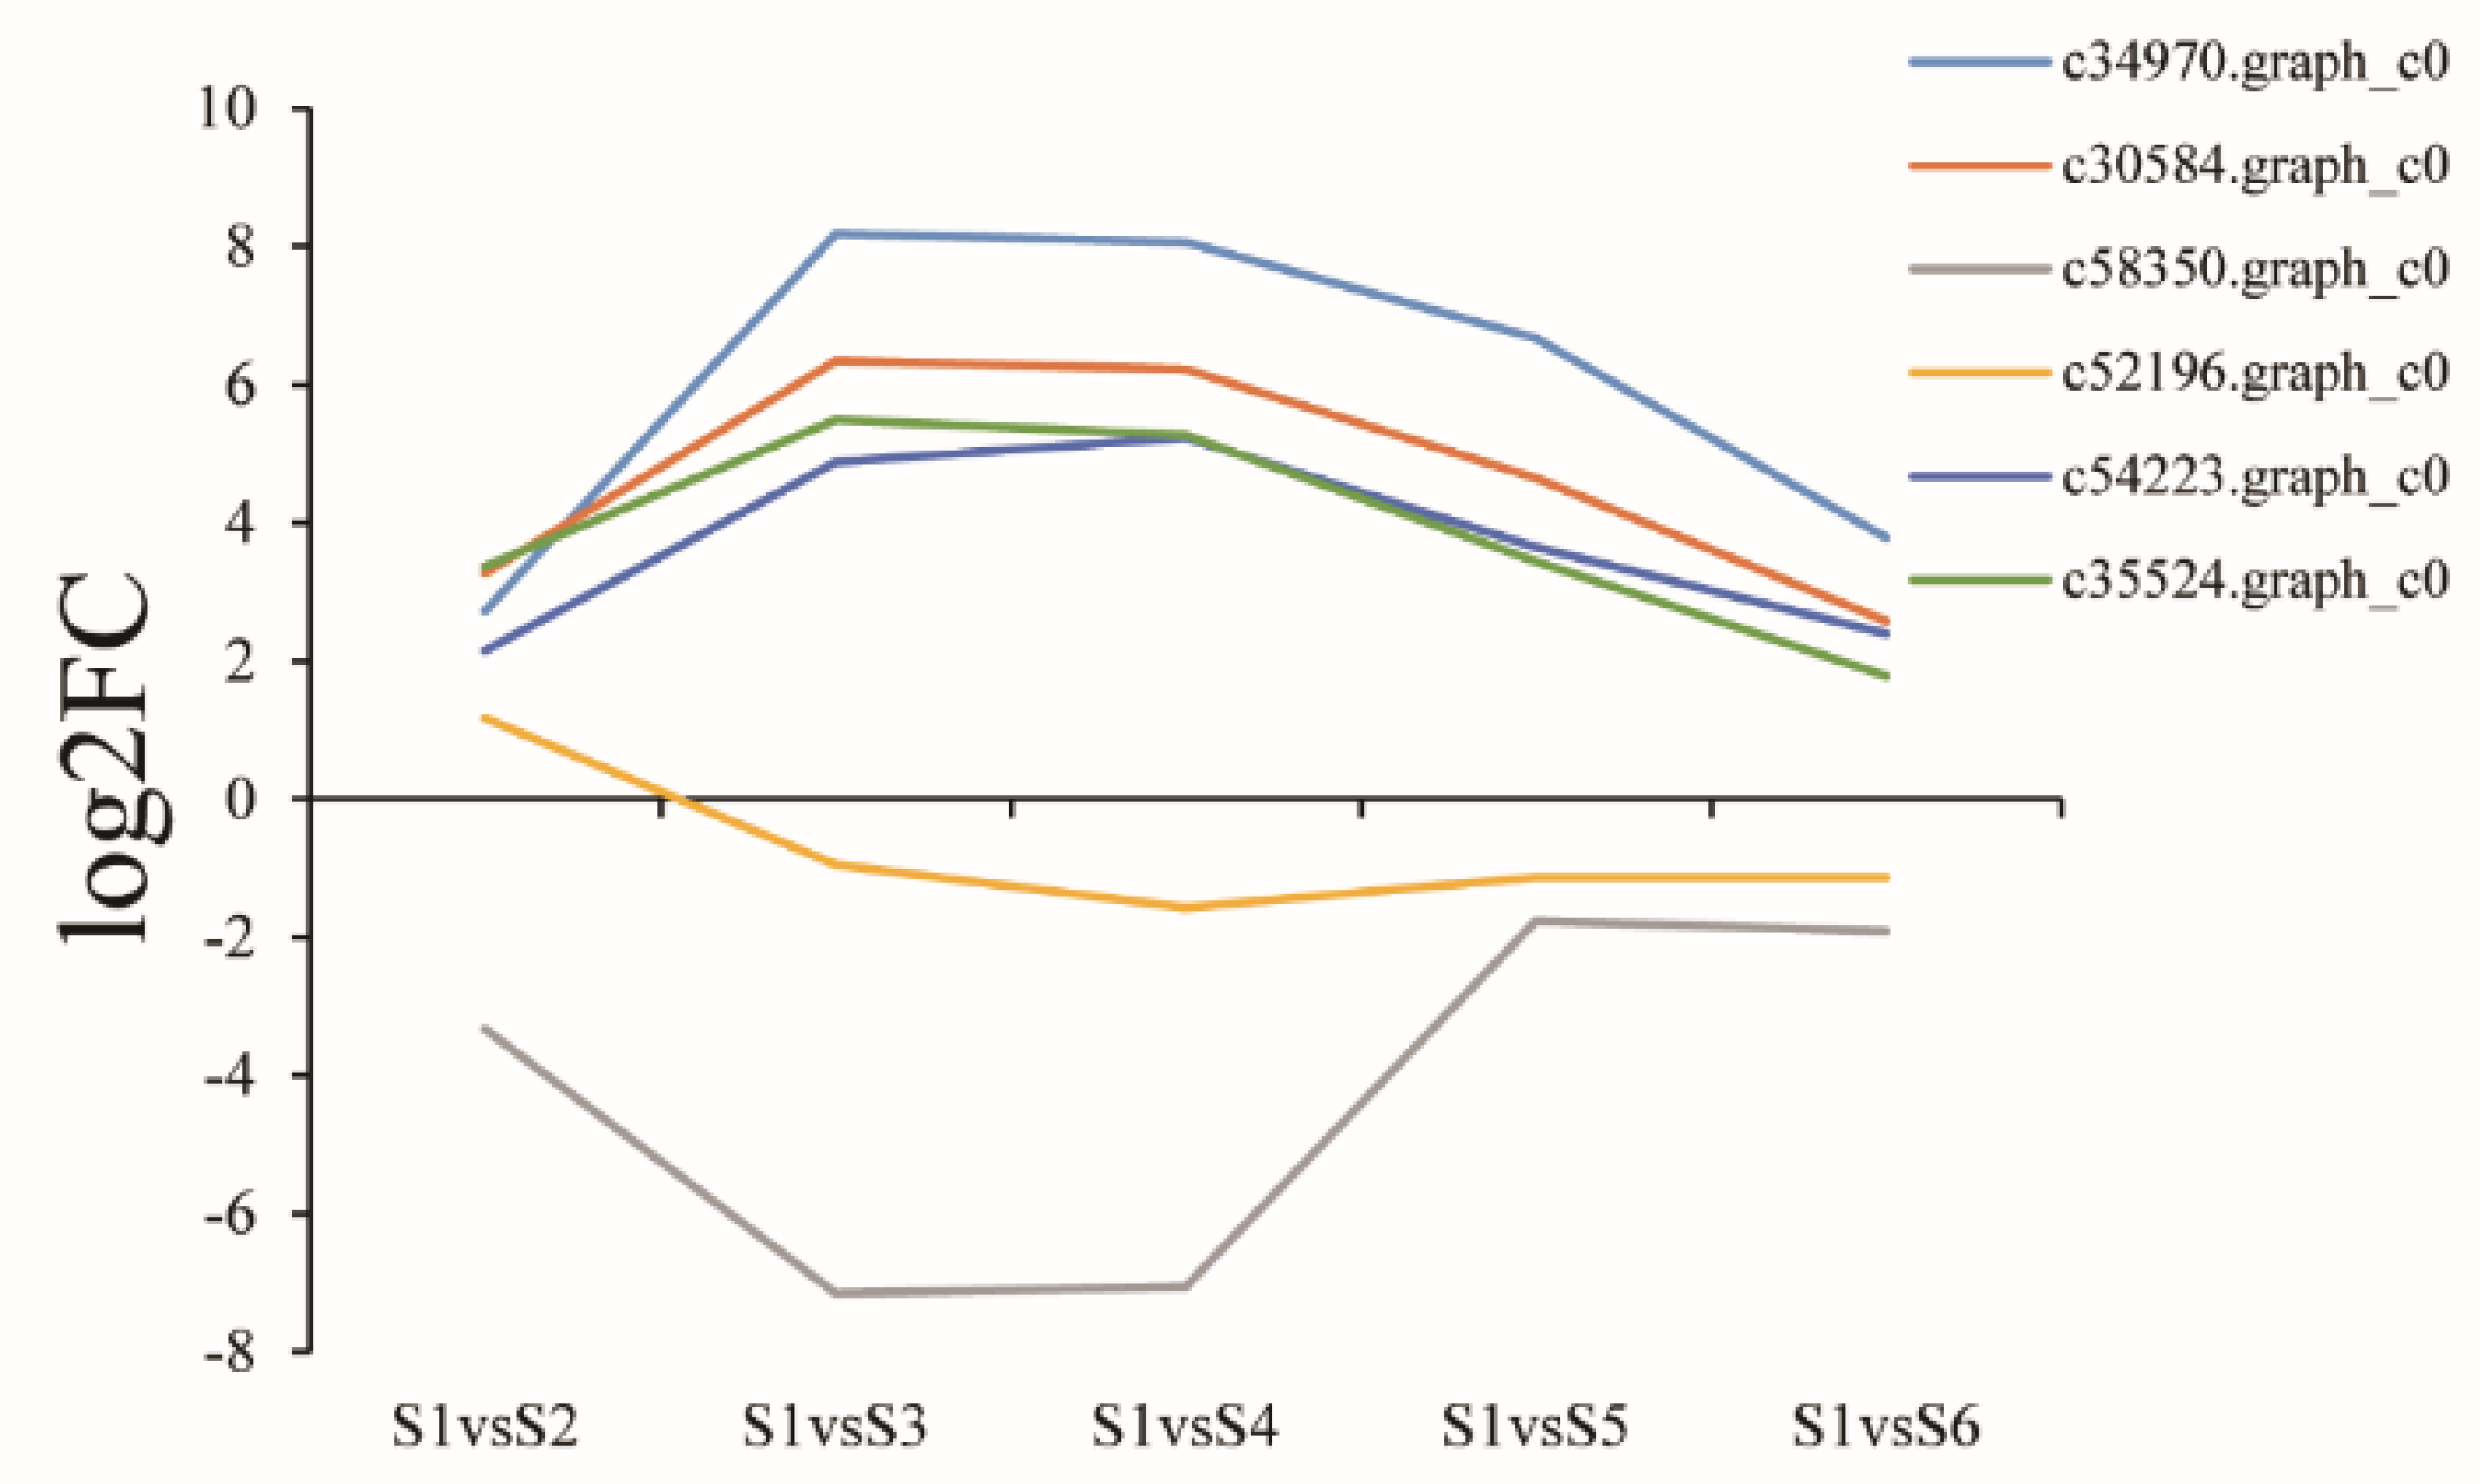
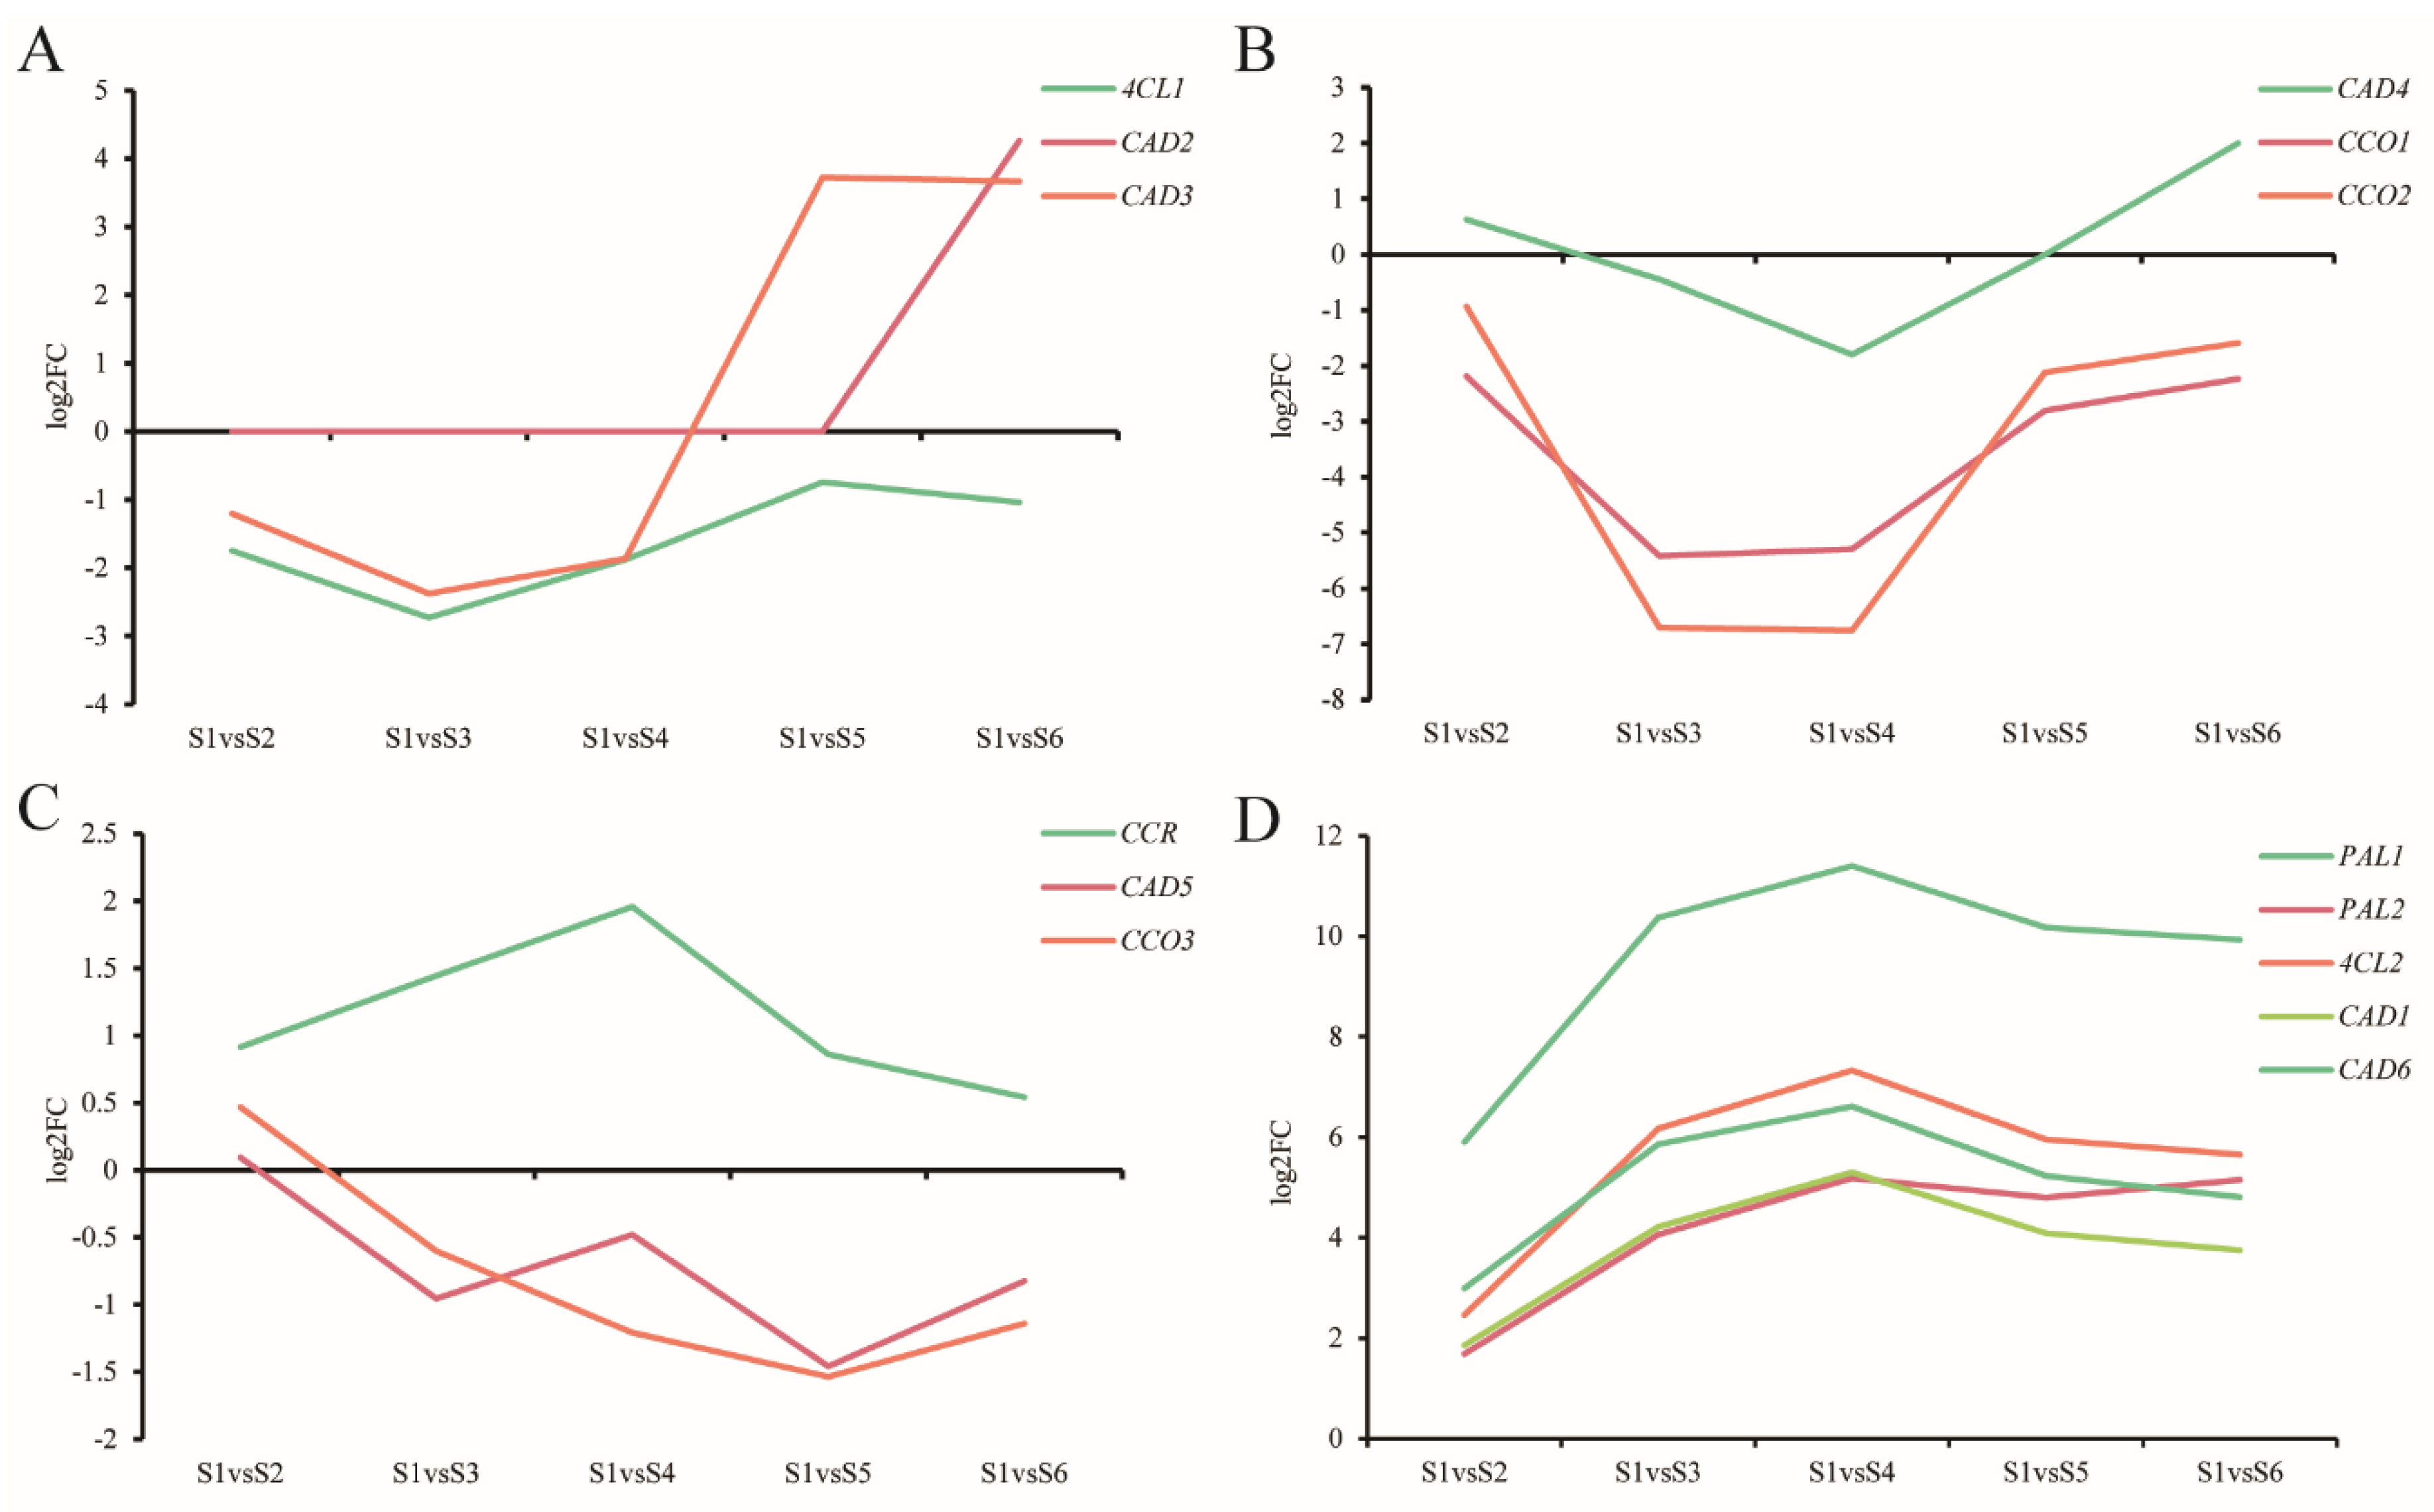
3.9. Expression of Genes Related to Lignin

The xylem of wood plants contains a large amount of lignin [36]. Many intermediate product synthases are involved in lignin synthesis, such as phenylalanine ammonia-lyase (PAL) [37], 4-coumarate:CoA ligase (4CL) [38], cinnamoyl CoA reductase (CCR) [39], cinnamyl alcohol dehydrogenase (CAD) [40], peroxidase (Prx) [41] and caffeoyl-CoA O-methyltransferase (CCoAOMT) [42] (Supplementary Table S4). Studies have shown that lignin-related genes are related to the development of xylem [43]. We identified genes for PAL (2), CCR (1), 4CL (2), CAD (5), CCoAOMT (4) and Prx (24) in our xylem transcriptomes (Figure 10 and Figure 11). Among these 38 genes, using S1 as the control, 24 genes were upregulated in S2, 10 genes were downregulated and the expression of four genes showed no significant change. In S3, 13 genes were upregulated, 17 genes were downregulated and eight showed no obvious changes. In S4, 12 genes were upregulated, 17 genes were downregulated and nine showed no obvious changes. In S5, 16 genes were upregulated, 14 genes were downregulated and eight showed no obvious changes. In S6, 21 genes were upregulated, 12 genes were downregulated and five genes had no significant changes (Supplementary Table S4). Except for some individual genes, the overall trend for gene expression was to increase first and then decrease in the six samples.

3.10. Identification of Phytohormone-Related Genes in the Xylem during the Seasonal Change

By analyzing the DEGs and comparing NR database annotations, we can get genes related to phytohormones from six different periods (Supplementary Table S5). Different types of hormones have different expression patterns, and most of them have obvious changes in S3 and S4. Compared with S1, there were 37 DEGs related to plant hormones found in S2, of which 14 were upregulated and 23 were downregulated. In S3, 50 related DEGs were found, and 26 were upregulated and 24 were downregulated. There were 49 upregulated and 26 downregulated DEGs in S4. S5 had 48 DEGs, 25 of which were upregulated and 23 were downregulated. In S6, there were 46 DEGs, 25 of which were upregulated and 21 were downregulated (Figure 12). During this period, the gene c53437.graph_c0 (auxin-responsive family protein (Populus trichocarpa)) had the largest increase in expression. The only DEGs related to abscisic acid were c43055.graph_c0 (PREDICTED: abscisic acid receptor PYL4 (Populus euphratica)), c50201.graph_c0 (PREDICTED: abscisic acid receptor PYL8-like isoform X1 (Populus euphratica)), c49741.graph_c0 (PREDICTED: abscisic acid receptor PYL8-like (Populus euphratica)) and c16442.graph_c0 (abscisic acid and environmental stress-inducible protein (Jatropha curcas)). The remaining DEGs are all related to auxin, gibberellin, cytokinin and ethylene. This indirectly explained the importance of related genes in the xylem during seasonal changes.

3.11. Identification of Transcription Factor (TF) Genes during the Seasonal Change

The secondary cell wall of the xylem is a special structure produced after the differentiation of the procambium. Its thickening process is regulated by a complex multilevel transcription network composed of a large number of transcription factors. These transcription factors mainly include a series of NAC (NAM, ATAF1/2 and CUC2) transcription factors and MYB transcription factors [44]. We found that the relative abundance of mRNAs specific for 44 TF genes showed a high degree of dynamic change during the change of seasons, including two NACs (c56971.graph_c0 and c56580.graph_c0) and nine MYBs (c50601.graph_c1, c27343.graph_c0, c47250.graph_c0, c51583.graph_c1, c48456.graph_c0, c55770.graph_c0, c51063.graph_c1, c55858.graph_c0 and c58751.graph_c0). In addition, there are genes for other transcription factors, such as WRKYs, bZIPs, GATAs and AP2/ERFs. Based on their expression patterns, the differentially expressed TF genes can be divided into four subgroups (Figure 13) [45]. In subgroup I, compared with the control group S1, the transcription level peaked at S4 and then continued to decline at S5 and S6. The TF genes in subgroup II generally showed a steady decreasing trend over the five time points; the expression of only a few individual genes (c52963.graph_c0, c52341.graph_c0, c35420.graph_c0 and c52941.graph_c0) increased again at S6. Genes in subgroup III had the highest transcript abundance. It is interesting that the TF gene expression peaked in the S1 group. The expression of TF genes in subgroup IV reached a peak at S6. In subgroup IV, there were genes for three WRKY, two heat shock transcription factors, one MYB and one MADS box TF (Supplementary Table S6).

4. Discussion

4.1. Illumina Sequencing and Functional Annotation Can Provide Valuable Transcriptomic Resources for the Analysis of Seasonal Gene Expression

Trees allow the harvest of large quantities of secondary xylem at different development stages in a long period of a growth season. Anatomical observation showed the differences of xylem development among six time points (Figure 1). Analyzing the expression profiles of genes in these stages could reveal the molecular mechanisms behind the regulation of xylem development and identify the genes related to different stages of wood formation in “Shanxin” poplar. In this study, we used Illumina high-throughput nucleotide sequencing to analyze the transcriptome of hybrid Populus by RNA-seq. Illumina sequencing, which is widely used for transcriptome assembly, produces relatively short reads compared with some other sequencing technologies but produces higher transcriptome coverage at a lower cost. We sequenced 18 transcriptome libraries of six time points and obtained a total of 121.93 Gb of clean data. These reads were de novo assembled into 84,733 contigs, of which 17,603 were >1 kb in length. This indicates that the assembled gene fragments are of high quality and may contain many full-length cDNAs. These results indicate that our “Shanxin” poplar database will be a valuable transcriptome resource for gene discovery and functional analysis (Figure 2).

4.2. Gene Expression in Response to Seasonal Changes

There have been studies to show that some known genes are involved in the regulation of xylem development and secondary cell wall biosynthesis, and examples of the induction of gene expression and inhibition of the corresponding xylem development have been reported, such as MYB [46] and NAC [47] transcription factor genes, lignin and cellulose biosynthesis genes. In our study, the change of seasons resulted in the differential expression of genes in the xylem of “Shanxin” poplar. Among them, using the S1 sample as the control group, 2091, 4014, 4266, 3833 and 3308 genes were upregulated in S2–S6, and 2182, 4268, 4321, 3019 and 2567 genes were downregulated, respectively. In S3, the upregulated genes were the most abundant (Table 3). GO terms related to cell wall formation and thickness in the upregulated genes were also enriched in S1 vs. S2 and S2 vs. S3 (Figure 5). At these time points, the developing xylem elements expand rapidly, and the secondary cell walls are deposited, and various related genes show significant differential expressions, which reflect that a large number of related genes are involved in the active development of xylem in late May to early June in Harbin when the temperature rises rapidly in the spring. Subsequently, the number of DEGs slowly decreased and the downregulated genes related to cell wall formation and thickness were enriched in S4 vs. S5 and S5 vs. S6, indicating that the xylem developmental process gradually slowed, which agrees with the histological observations. These data implied that the xylem development and its gene expression might be correlated with seasonal temperature change. The onset of wood formation (the first cell begins to grow) in Northern hemisphere conifers is primarily driven by the photoperiod and mean annual temperature (MAT) and only secondarily by the spring forcing temperature, winter chilling and moisture availability. The photoperiod interacts with the MAT and plays a dominant role in regulating the onset of secondary meristem (xylem) growth. Understanding the unique relationships between exogenous factors and wood formation could aid in predicting how forest ecosystems respond and adapt to climate warming while improving the prediction accuracy of the earth system model for carbon, water and energy cycles and assess the carbon sequestration potential of forests [48].

4.3. Genes for Polysaccharide Biosynthesis and Metabolism Were Helpful for Xylem Development during Seasonal Change

The process of xylem development is accompanied by polysaccharide biosynthesis during the formation of cell walls. The synthesis of glucoxylan and cellulose relies on various sugar metabolism pathways. We found that, in the progression from stages S1 to S6, the DEGs involved in sugar metabolism showed a certain trend in the different periods, and the highest number of DEGs was in S4, according to the differential expression and GO enrichment analyses (Table 3). In higher plants, cellulose is synthesized at the plasma membrane by the cellulose synthase (CesA) enzyme complex [49]. Sucrose synthase (SuSy) is one of the key enzymes in plant sucrose metabolism, and it is ubiquitous in most plant tissues [50]. SuSy participates in many metabolic processes in plants, including the synthesis of starch and cellulose, as well as the distribution of carbon sources [51]. In this study, the expression of CesA- and SuSy-related genes were upregulated at S3 (Figure 8 and Figure 9), indicating that cellulose biosynthesis was an important bioprocess during this period of xylem development. Some of the cellulose synthase genes continue to show an upregulated expression at S4 compared with S1; after which, the expression levels slowly decrease. Among these CESA genes, two (c57251.graph_c0 and c55736.graph_c1) are homolog to PtrCESA4 and PtrCESA7 of Populus trichocarpa wood and c32828.graph_c0 is a homolog to PtrCESA8, which suggested that they were involved in the cellulose biosynthesis of the secondary cell wall during this period (Supplementary Table S7). The study showed that several glycosyltransferases are involved in the synthesis of glucoxylan (GX) and cellulose in poplar trees [52]. We also found that there were 101 different genes related to glycosyltransferase in S4 compared with S1. A probable polygalacturonase gene and a sucrose-phosphate synthase were upregulated compared to S1 and reached a peak at S4. The polygalacturonase gene has been proven to affect the hydraulic properties of the poplar xylem [53]. Sucrose-phosphate synthase expression influences the poplar phenology [54]. The obvious changes in the DEGs in sugar metabolism pathways, cellulose synthesis and sucrose synthase indicate that S2, S3 and S4 are important stages in xylem development, and these genes play important roles in that process.

4.4. Expression of Genes Related to Lignin Synthesis Varied in the Different Stages of Xylem Development

The xylem contains a large amount of lignin [55], which is related to the accumulation of lignin during the development of the xylem. The biosynthesis of lignin is a complex process that explains the growth state of xylem at different developmental periods. Gene Ontology enrichment revealed an early and a late upregulation of the genes associated with the phenylpropanoid pathway among the six time points of xylem development of the Shanxin poplar. It has been previously shown that lignin biosynthesis is the main phenylpropanoid product during wood development and that it can occur even in the walls of dead xylem tracheary elements and possibly fibers, thanks to the neighboring, still living fibers and xylem parenchyma cells (e.g., ray cells) [56,57,58]. The molecular processes involved in monolignol biosynthesis are not restricted to the cambial activity timeframe but continue after the end of cambium cell proliferation. In temperate regions, latewood is produced when cambial activity declines with the approach of autumnal dormancy. The temporal pattern analysis showed an accumulation pattern of the genes involved in the phenylpropanoid pathway during latewood formation [59]. The protein identification of the seasonal variations of xylem also identified the proteins involved in lignin biosynthesis in mature xylem [10]. The late upregulation of the genes in the phenylpropanoid pathway might play roles in these tissues and cells. We analyzed the 14 intermediate product-related genes involved and found that most of the DEGs showed an upregulated expression trend throughout the period, and the expression levels peaked at S4 compared to S1 (Supplementary Table S4). This shows that lignin synthesis reflects the changes in the xylem during its development. The enrichment analysis of KEGGs and DEGs in the transcriptome sequencing of the “Shanxin” poplar revealed many genes that regulate lignin synthesis. The expression levels of the genes encoding CAD2 and CAD3 increased at either S5 or S6 (Figure 10A). Two CCO and one CAD genes were downregulated at S4 compared to S1 (Figure 10B). The gene c51274.graph_c0 (cinnamoyl CoA reductase), which promotes the formation of feruloyl-CoA and sinapoyl-CoA to coniferyl aldehyde and sinapaldehyde, was upregulated at S4 compared to S1 (Figure 10C). Two PAL, one 4CL and two CAD genes were upregulated from S2 to S6 compared to S1 (Figure 10D); for example, the gene c54100.graph_c0 (PAL1) reached its peak at S4, and its expression was significantly enriched (Supplementary Table S4). Combined with the results of the histological observation, these genes play roles in lignin biosynthesis in addition to xylem development. This can also be seen in the KEGG analysis of the lignin synthesis pathway in genes such as c57344.graph_c0 (2-dehydro-3-deoxyphosphoheptonate aldolase family protein) and c53880.graph_c0 (coniferyl aldehyde 5-hydroxylase 2). A coniferyl aldehyde 5-hydroxylase in aspen (P. tremuloides) was demonstrated to regulate monolignol biosynthesis in the xylem [60]. In the present study, the expression level of the gene coniferyl aldehyde 5-hydroxylase 2 is very interesting; the RPKM values at S1 were 0.7, 0.6 and 0.89, and, at S2, they were 3.85, 3.18 and 5.62. However, the RPKM values at S3 reached an astonishing 944, 1103.07 and 883.1, and, at S4, they were 1769.84, 1939.91 and 1985.57, reaching their highest levels at this time point (Supplementary Table S4). It is worth noting that the expression of gene c51159.graph_c0 (aldehyde dehydrogenase family 2 member C4) was downregulated, which directly affects the synthesis of coniferyl aldehyde and sinapaldehyde into ferulic acid and sinapic acid [61]. More interesting is that ferulic and sinapic acids are the pre-products of feruloyl-CoA and sinapoyl-CoA. The sequencing results show that these two genes must share some kind of mutual relationship. Our results suggest that these genes are involved in the response of xylem development to the seasonal changes in “Shanxin” polar.

4.5. Phytohormone Signaling during the Seasonal Change

The plant hormones auxin and gibberellin play important roles in the development of xylem. Our transcriptome data shows that the expression levels of the signal transduction pathway-related genes related to several plant hormones were significantly different at the different time points (Supplementary Table S8). The GO enrichment analysis of the DEGs showed that terms related to hormones were enriched in the S1 vs. S2, S2 vs. S3 and S4 vs. S5 comparisons, and both of the upregulation and downregulation genes in GO terms relate to hormones were enriched in S1 vs. S2. The KEGG enrichment analysis also showed the presence of the hormone signal pathway, which suggests that hormone signals play important roles at these stages. Auxin is a key regulator in the growth of the vascular cambium and in xylem development [62]. It has long been known that the activation of pre-protocells depends on auxin signaling and transport. According to the auxin tube theory, the initial auxin flux from the auxin source to the auxin pool creates its own transport channel. There were 29 DEGs related to auxin among the six time points (Supplementary Table S5). The RPKM value of the gene c53437.graph_c0 (homolog to the auxin-responsive family protein (Populus trichocarpa)) related to the auxin signal transduction pathway was 0.15 at S1, and it was upregulated to 27.60 at S2. At S4, the expression peaked at 281.1, which indicates that auxin is involved in xylem development. Gibberellin (GA) is a key signaling molecule that induces vessel growth, fiber differentiation and lignification. Gene c45848.graph_c0 (Gibberellin 2-beta-dioxygenase OS) is the most abundant gene in the gibberellin pathway in our libraries. The study showed that the accumulation of Gibberellin 2-beta-dioxygenase maintains the hypocotyl elongation [63]. However, the molecular mechanism of how GA affects the xylem elongation and secondary wall development in woody tree species is still unclear. It has been shown previously that the GA signal in the xylem mediates the occurrence of lignin and promotes fiber elongation [64]. There were 12 DEGs related to GAs among the six time points. The sequencing results showed that the expression of gibberellin-related genes was significantly different in the different periods, and the expression was the most significant at S4. The results indicate that gibberellin may play an important role in xylem development.

4.6. Transcription Factors Involved in Xylem Development

The transcription of genes encoding CesA, PAL and other enzymes related to the biosynthesis of cellulose, xylan and lignin is regulated by the transcription factors NAC and MYB [65,66,67]. SND and MYB46 are thought to play a key role in these processes [68]. In this study, many TFs were found to play an important role in xylem development; this included 44 genes predicted to encode TFs such as NACs, MYBs, WRKYs, bZIPs, GATAs and AP2/ERFs that were differentially expressed at the six time points (Figure 13). These transcription factor genes could be clustered into different groups at different stages of xylem development in a year, suggesting that each group of genes played an important role in the corresponding stages (Figure 13). The largest category belonged to the WRKY and MYB TF families, both of which consisted of eight members. At present, the involvement of WRKY transcription factors in the regulation of lignification and xylem development has only been proposed indirectly. The transcription profile analysis showed that some WRKY TF genes are differentially expressed during protoplast cell wall regeneration, secondary cell wall biosynthesis in the xylem along the axial development gradient or during the formation of tension wood [69]. Together, with these results, we can hypothesize that WRKY TFs play roles in the xylem development, especially in the autumn xylem development process, because some WRKY transcription factor genes were enriched in the S6 stage (Supplementary Table S6). In vivo assays showed that MYB46 transcriptionally activates downstream target genes for transcription factors, three of which (AtC3H14, MYB52 and MYB63) were shown to be able to activate secondary wall biosynthesis genes [70]. The R2R3-MYB family, one of the largest transcription factor families in higher plants, controls a wide variety of plant-specific processes, including, notably, phenylpropanoid metabolism and secondary cell wall formation [71]. MYB TFs can regulate the expression of the genes involved in the synthesis of phenylpropanes, thereby affecting the content of lignin and the accumulation of phenols [72,73,74]. In our xylem RNA-seq libraries, the expression of MYB genes showed different patterns. For example, the expression level of c50601.graph_c1 (homolog to the myb family transcription factor family protein (Populus trichocarpa)) in S2 was 4.85, and it was 19.98, 18.83, 14.17 and 0.67 in stages S3, S4, S5 and S6, respectively. Gene c56971.graph_c0(NAC domain-containing protein 7 OS) has the highest expression level at S3 and is similar to c50601.graph_c1 (Supplementary Table S6). The c56971.graph_c0 homolog to PtVNS/PtrWND in poplar, which induced ectopic secondary wall thickening in poplar leaves [75]. These are basically the same trend found in the expression of some lignin synthesis genes, which suggests that these genes are involved in the xylem development response to seasonal changes. We find that, in addition to the known differences in the expression levels of genes for transcription factors such as WRKY, MYB and NAC, many genes encoding transcription factors similar to LTM and BATA have also been detected, which implies their roles in xylem development in “Shanxin” polar.

5. Conclusions

In this study, using high-throughput RNA sequencing, we constructed a “Shanxin” poplar xylem transcriptome data set containing 84,733 predicted transcripts. Based on the slices of xylem development at different time points, further studies on six time points taken from April to August showed the dynamic changes in gene expression that occur during a growing season. By analyzing the different genes in the growing season, including cell expansion and cell wall biosynthesis, polysaccharide biosynthesis and metabolism, lignin-related genes, plant hormone-related genes and transcription factor (TF) genes, as well as the analysis of different enrichment pathways to understand its main biological processes, it is speculated that it may play an important role in the development of xylem. The transcriptome assembly and gene expression profile analysis of xylem development will provide data and materials that can be used in the molecular breeding of “Shanxin” poplar.

Supplementary Materials

The following are available online at https://0-www-mdpi-com.brum.beds.ac.uk/article/10.3390/f12040451/s1: Table S1: COG and eggNOG Function classification. Table S2: GO classification enrichment analysis. Table S3: The table of glucose metabolism differential genes. Table S4: The table of lignin synthesis differential genes. Table S5: The table of hormone differential genes. Table S6: The table of differential genes transcription factor. S7: CesA genes cluster analysis. S8: Hormone expression pattern.

Author Contributions

C.W.: conceptualization. C.W. and X.X.: methodology. C.Z. and Y.H.: software. C.Z., Y.H., Y.Y., M.Z., L.Z. and X.X.: formal analysis. C.Z., Y.H. and Y.Y.: investigation. C.Z. and C.W.: writing—review and editing. C.Z. and Y.H.: visualization. C.W.: funding acquisition. All authors have read and agreed to the published version of the manuscript.

Funding

This research received no external funding.

Acknowledgments

This work was supported by the Fundamental Research Funds for the Central Universities (2572019CT02), Heilongjiang Touyan Innovation Team Program (Tree Genetics and Breeding Innovation Team), The Overseas Expertise Introduction Project for Discipline Innovation (B16010).

Conflicts of Interest

The authors declare no conflict of interest.

References

  1. Wang, H.; Wang, C.; Liu, H.; Tang, R.; Zhang, H. An efficient Agrobacterium-mediated transformation and regeneration system for leaf explants of two elite aspen hybrid clones Populus alba × P. berolinensis and Populus davidiana × P. bolleana. Plant Cell Rep. 2011, 30, 2037–2044. [Google Scholar] [CrossRef] [PubMed]
  2. Guo, X.H.; Jiang, J.; Lin, S.J.; Wang, B.C.; Wang, Y.C.; Liu, G.F.; Yang, C.P. A ThCAP gene from Tamarix hispida confers cold tolerance in transgenic Populus (P. davidiana × P. bolleana). Biotechnol. Lett. 2009, 31, 1079–1087. [Google Scholar] [CrossRef] [PubMed]
  3. Bollhöner, B.; Prestele, J.; Tuominen, H. Xylem cell death: Emerging understanding of regulation and function. J. Exp. Bot. 2012, 63, 1081–1094. [Google Scholar] [CrossRef] [PubMed]
  4. Gong-Ke, Z.; Ruiqin, Z.; Himmelsbach, D.S.; Mcphail, B.T.; Zheng-Hua, Y. Molecular Characterization of PoGT8D and PoGT43B, Two Secondary Wall-Associated Glycosyltransferases in Poplar. Plant Cell Physiol. 2007, 48, 689–699. [Google Scholar]
  5. Jacobs, W.P. The Role of Auxin in Differentiation of Xylem Around a Wound. Amer. J. Bot 1952, 39, 301–309. [Google Scholar] [CrossRef]
  6. Hertzberg, M.; Aspeborg, H.; Schrader, J.; Andersson, A.; Erlandsson, R.; Blomqvist, K.; Bhalerao, R.; Uhlén, M.; Teeri, T.T.; Lundeberg, J.; et al. A transcriptional roadmap to wood formation. Proc. Natl. Acad. Sci. USA 2001, 98, 14732–14737. [Google Scholar] [CrossRef] [Green Version]
  7. Sundell, D.; Street, N.R.; Kumar, M.; Mellerowicz, E.J.; Kucukoglu, M.; Johnsson, C.; Kumar, V.; Mannapperuma, C.; Delhomme, N.; Nilsson, O. AspWood: High-Spatial-Resolution Transcriptome Profiles Reveal Uncharacterized Modularity of Wood Formation in Populus tremula. Plant Cell 2017, 153, 02017. [Google Scholar] [CrossRef] [Green Version]
  8. Plomion, C.H.; Leprovost, G.; Stokes, A. Wood Formation in Trees. Plant Physiol. 2002, 127, 1513–1523. [Google Scholar] [CrossRef]
  9. Kawana, A.; Doi, M.; Motoyama, Y. The Seasonal Patterns of Xylem Formation Denoted by Pin Marking Method (II): The Morphological Study of Denoted Date and Healed Wounds after Pin Markings on Sugi (Cryptomeria japonica) Trunks. J. Jpn. For. Soc. 1974, 56, 16–19. [Google Scholar]
  10. Vander Mijnsbrugge, K.; Meyermans, H.; Van Montagu, M.; Bauw, G.; Boerjan, W. Wood formation in poplar: Identification, characterization, and seasonal variation of xylem proteins. Planta 2000, 210, 589–598. [Google Scholar] [CrossRef]
  11. Wu, H.; Xu, H.; Li, H.; Wei, D.; Lin, J.; Li, X. Seasonal development of cambial activity in relation to xylem formation in Chinese fir. J. Plant Physiol. 2016, 195, 23–30. [Google Scholar] [CrossRef] [PubMed]
  12. Sergio Rossi, H.M.D. Causes and correlations in cambium phenology: Towards an integrated framework of xylogenesis. J. Exp. Bot. 2012, 63, 2117–2126. [Google Scholar] [CrossRef] [PubMed] [Green Version]
  13. Zhang, J.; Nieminen, K.; Serra, J.A.A.; Helariutta, Y. The formation of wood and its control. Curr. Opin. Plant Biol. 2014, 17, 56–63. [Google Scholar] [CrossRef] [PubMed]
  14. Baier, M.; Goldberg, R.; Catesson, A.-M.; Liberman, M.; Bouchemal, N.; Michon, V.; Du Penhoat, C.H. Pectin changes in samples containing poplar cambium and inner bark in relation to the seasonal cycle. Planta Berl. 1994, 193, 446–454. [Google Scholar] [CrossRef]
  15. Zhao, L.; Ding, Q.; Zeng, J.; Wang, F.R.; Zhang, J.; Fan, S.J.; He, X.Q. An Improved CTAB–Ammonium Acetate Method for Total RNA Isolation from Cotton. Phytochem. Anal. 2012, 23, 647–650. [Google Scholar] [CrossRef]
  16. Grabherr, M.G.; Haas, B.J.; Yassour, M.; Levin, J.Z.; Thompson, D.A.; Amit, I.; Adiconis, X.; Fan, L.; Raychowdhury, R.; Zeng, Q. Full-length transcriptome assembly from RNA-Seq data without a reference genome. Nat. Biotechnol. 2011, 29, 644–652. [Google Scholar] [CrossRef] [Green Version]
  17. Thissen, D.; Steinberg, L.; Kuang, D. Quick and Easy Implementation of the Benjamini-Hochberg Procedure for Controlling the False Positive Rate in Multiple Comparisons. J. Educ. Behav. Stat. 2002, 27, 77–83. [Google Scholar] [CrossRef]
  18. Hashimoto, K.; Kanehisa, M. KEGG GLYCAN for Integrated Analysis of Pathways, Genes, and Structures; Springer: Tokyo, Japan, 2008. [Google Scholar]
  19. Xie, C.; Mao, X.; Huang, J.; Ding, Y.; Wu, J.; Dong, S.; Kong, L.; Gao, G.; Li, C.Y.; Wei, L. KOBAS 2.0: A web server for annotation and identification of enriched pathways and diseases. Nucleic Acids Res. 2011, 39, 316–322. [Google Scholar] [CrossRef] [Green Version]
  20. Altschul, S.F.; Madden, T.L.; Schäffer, A.A.; Zhang, J.H.; Lipman, D.J. Gapped BLAST and PSI-BLAST: A new generation of protein databases search programs. Nucleic Acids Res. 1997, 25, 3389–3402. [Google Scholar] [CrossRef] [Green Version]
  21. Eddy, S.R.; Eddy, S. HMMER User’s Guide—Biological sequence analysis using profile hidden Markov models. Dep. Genet. 2003. [Google Scholar]
  22. Wilke, A.; Harrison, T.; Wilkening, J.; Field, D.; Glass, E.M.; Kyrpides, N.; Mavrommatis, K.; Meyer, F. The M5nr: A novel non-redundant database containing protein sequences and annotations from multiple sources and associated tools. BMC Bioinform. 2012, 13, 141. [Google Scholar] [CrossRef] [PubMed] [Green Version]
  23. Tatusov, R.L.; Galperin, M.Y.; Natale, D.A.; Koonin, E.V. The COG database: A tool for genome-scale analysis of protein functions and evolution. Nucleic Acids Res. 2000, 28, 33–36. [Google Scholar] [CrossRef] [Green Version]
  24. Koonin, E.V.; Fedorova, N.D.; Jackson, J.D.; Jacob, A.R. A comprehensive evolutionary classification of proteins encoded in complete eukaryotic genomes. Genome Biol. 2004, 5, R7. [Google Scholar] [CrossRef] [PubMed] [Green Version]
  25. Apweiler, R.; Hermjakob, H.; Sharon, N. On the frequency of protein glycosylation, as deduced from analysis of the SWISS-PROT database^1. Biochim. Biophys. Acta 1999, 1473, 4–8. [Google Scholar] [CrossRef]
  26. Ashburner, M.; Ball, C.A.; Blake, J.A.; Botstein, D.; Butler, H.; Cherry, J.M.; Davis, A.P.; Dolinski, K.; Dwight, S.S.; Eppig, J.T. Gene Ontology: Tool for the unification of biology. Nat. Genet. 2000, 25, 25–29. [Google Scholar] [CrossRef] [Green Version]
  27. Huerta-Cepas, J.; Szklarczyk, D.; Forslund, K.; Cook, H.; Heller, D.; Walter, M.C.; Rattei, T.; Mende, D.R.; Sunagawa, S.; Kuhn, M.; et al. eggNOG 4.5: A hierarchical orthology framework with improved functional annotations for eukaryotic, prokaryotic and viral sequences. Nucleic Acids Res. 2016, 44, D286–D293. [Google Scholar] [CrossRef] [Green Version]
  28. Finn, R.D.; Mistry, J.; Tate, J.; Coggill, P.; Bateman, A. The Pfam protein family’s database. Nucleic Acids Res. 2009, 38, D211–D222. [Google Scholar] [CrossRef]
  29. Minoru, K.; Susumu, G.; Shuichi, K.; Yasushi, O.; Masahiro, H. The KEGG resource for deciphering the genome. Nucleic Acids Res. 2004, 32, D277. [Google Scholar]
  30. Hezroni, H.; Koppstein, D.; Schwartz, M.G.; Avrutin, A.; Bartel, D.P. Principles of Long Noncoding RNA Evolution Derived from Direct Comparison of Transcriptomes in 17 Species. Cell Rep. 2015, 11, 1110–1122. [Google Scholar] [CrossRef] [Green Version]
  31. Borghi, L.; Gutzat, R.; Futterer, J.; Laizet, Y.; Hennig, L.; Gruissem, W. Arabidopsis RETINOBLASTOMA-RELATED Is Required for Stem Cell Maintenance, Cell Differentiation, and Lateral Organ Production. Plant. Cell 2010, 22, 1792–1811. [Google Scholar] [CrossRef] [Green Version]
  32. Harada, T.; Torii, Y.; Morita, S.; Onodera, R.; Hara, Y.; Yokoyama, R.; Nishitani, K.; Satoh, S. Cloning, characterization, and expression of xyloglucan endotransglucosylase/hydrolase and expansin genes associated with petal growth and development during carnation flower opening. J. Exp. Bot. 2011, 62, 815–823. [Google Scholar] [CrossRef] [Green Version]
  33. Li, Z.; Fernie, A.R.; Persson, S. Transition of primary to secondary cell wall synthesis. Sci. Bull. 2016, 61, 838–846. [Google Scholar] [CrossRef] [Green Version]
  34. Betancur, L.; Singh, B.; Rapp, R.A.; Wendel, J.F.; Marks, M.D.; Roberts, A.W.; Haigler, C.H. Phylogenetically Distinct Cellulose Synthase Genes Support Secondary Wall Thickening in Arabidopsis Shoot Trichomes and Cotton Fiber. J. Integr. Plant. Biol. 2010, 52, 205–220. [Google Scholar] [CrossRef]
  35. Merwe, M.J.V.D.; Osorio, S.; Araújo, W.L.; Balbo, I.; Nunes-Nesi, A.; Maximova, E.; Carrari, F.; Bunik, V.I.; Fernie, P.A.R. Tricarboxylic Acid Cycle Activity Regulates Tomato Root Growth via Effects on Secondary Cell Wall Production. Plant. Physiol. 2010, 153, 611–621. [Google Scholar] [CrossRef] [Green Version]
  36. Tsuyama, T.; Kawai, R.; Shitan, N.; Matoh, T.; Sugiyama, J.; Yoshinaga, A.; Takabe, K.; Fujita, M.; Yazaki, K. Proton-Dependent Coniferin Transport, a Common Major Transport Event in Differentiating Xylem Tissue of Woody Plants. Plant. Physiol. 2013, 162, 918–926. [Google Scholar] [CrossRef] [Green Version]
  37. Cahill, D.M.; Mccomb, J.A. A comparison of changes in phenylalanine ammonia-lyase activity, lignin and phenolic synthesis in the roots of Eucalyptus calophylla (field resistant) and E. marginata (susceptible) when infected with Phytophthora cinnamomi. Physiol. Mol. Plant. Pathol. 1992, 40, 315–332. [Google Scholar] [CrossRef]
  38. Costa, M.A.; Bedgar, D.L.; Moinuddin, S.G.A.; Kim, K.W.; Cardenas, C.L.; Cochrane, F.C.; Shockey, J.M.; Helms, G.L.; Amakura, Y.; Takahashi, H. Characterization in vitro and in vivo of the putative multigene 4-coumarate:CoA ligase network in Arabidopsis: Syringyl lignin and sinapate/sinapyl alcohol derivative formation. Phytochemistry 2005, 66, 2072–2091. [Google Scholar] [CrossRef] [PubMed]
  39. Piquemal, J.; Lapierre, C.; Myton, K.; O’Connell, A.; Boudet, A.M. Down-regulation of Cinnamoyl-CoA Reductase induces significant changes of lignin profiles in transgenic tobacco plants. Plant J. 2010, 13, 71–83. [Google Scholar] [CrossRef]
  40. Halpin, C.; Knight, M.E.; Foxon, G.A.; Campbell, M.M.; Schuch, W. Manipulation of lignin quality by downregulation of cinnamyl alcohol dehydrogenase. Plant. J. 2010, 6, 339–350. [Google Scholar] [CrossRef]
  41. Xue, Y.J.; Tao, L.; Yang, Z.M. Aluminum-induced cell wall peroxidase activity and lignin synthesis are differentially regulated by jasmonate and nitric oxide. J. Agric. Food Chem. 2008, 56, 9676. [Google Scholar] [CrossRef] [PubMed]
  42. Li, X.; Chen, W.; Zhao, Y.; Xiang, Y.; Jiang, H.; Zhu, S.; Cheng, B. Downregulation of caffeoyl-CoA O-methyltransferase (CCoAOMT) by RNA interference leads to reduced lignin production in maize straw. Genet. Mol. Biol. 2013, 36, 540–546. [Google Scholar] [CrossRef] [Green Version]
  43. Negi, S.; Tak, H.; Ganapathi, T.R. In vitro xylem vessel elements formation from banana embryogenic cells and expression analysis of vessel development-related genes. J. Plant Biotechnol. Rep. 2015, 9, 47–54. [Google Scholar] [CrossRef]
  44. Yamaguchi, M.; Ohtani, M.; Mitsuda, N.; Kubo, M.; Ohme-Takagi, M.; Fukuda, H.; Demura, T. VND-INTERACTING2, a NAC Domain Transcription Factor, Negatively Regulates Xylem Vessel Formation in Arabidopsis. Plant. Cell 2010, 22, 1249–1263. [Google Scholar] [CrossRef] [PubMed] [Green Version]
  45. Wang, M.; Zhang, X.; Liu, J.H. Deep sequencing-based characterization of transcriptome of trifoliate orange (Poncirus trifoliata (L.) Raf.) in response to cold stress. BMC Genom. 2015, 16, 555. [Google Scholar] [CrossRef] [Green Version]
  46. Changzheng, X.; Xiaokang, F.; Rui, L.; Li, G.; Lingyu, R.; Chaofeng, L.; Qiaoyan, T.; Bo, J.; Bangjun, W.; Keming, L. PtoMYB170 positively regulates lignin deposition during wood formation in poplar and confers drought tolerance in transgenic Arabidopsis. Narnia 2017, 37, 1713–1726. [Google Scholar]
  47. Zhong, R.; Yuan, Y.; Spiekerman, J.J.; Guley, J.T.; Egbosiuba, J.C.; Ye, Z.-H. Functional Characterization of NAC and MYB Transcription Factors Involved in Regulation of Biomass Production in Switchgrass (Panicum virgatum). PLoS ONE 2015, 10, e0134611. [Google Scholar] [CrossRef]
  48. Huang, J.G.; Ma, Q.; Rossi, S.; Biondi, F.; Deslauriers, A.; Fonti, P.; Liang, E.; Mäkinen, H.; Oberhuber, W.; Rathgeber, C.B.K.; et al. Photoperiod and temperature as dominant environmental drivers triggering secondary growth resumption in Northern Hemisphere conifers. Proc. Natl. Acad. Sci. USA 2020, 117, 20645–20652. [Google Scholar] [CrossRef] [PubMed]
  49. Persson, S.; Paredez, A.; Carroll, A.; Palsdottir, H.; Doblin, M.; Poindexter, P.; Khitrov, N.; Auer, M.; Somerville, C.R. Genetic evidence for three unique components in primary cell-wall cellulose synthase complexes in Arabidopsis. Proc. Natl. Acad. Sci. USA 2007, 104, 15566–15571. [Google Scholar] [CrossRef] [PubMed] [Green Version]
  50. Chalivendra, S.; Huber, S.C.; Sachs, M.M.; Rhoads, D. Sucrose Synthase. Plant. Signal. Behav. 2007, 2, 28–29. [Google Scholar] [CrossRef] [Green Version]
  51. Abid, G.; Muhovski, Y.; Jacquemin, J.M.; Mingeot, D.; Sassi, K.; Toussaint, A.; Baudoin, J.P. Characterization and expression profile analysis of a sucrose synthase gene from common bean (Phaseolus vulgaris L.) during seed development. Mol. Biol. Rep. 2012, 39, 1133–1143. [Google Scholar] [CrossRef]
  52. Appenzeller, L.; Doblin, M.; Barreiro, R.; Wang, H.; Niu, X.; Kollipara, K.; Carrigan, L.; Tomes, D.; Chapman, M.; Dhugga, K.S. Cellulose synthesis in maize: Isolation and expression analysis of the cellulose synthase (CesA) gene family. Cellulose 2004, 11, 287–299. [Google Scholar] [CrossRef]
  53. Allario, T.; Tixier, A.; Awad, H.; Lemaire, C.; Brunel, N.; Badel, E.; Barigah, T.S.; Julien, J.L.; Peyret, P.; Mellerowicz, E.J.; et al. PtxtPME1 and homogalacturonans influence xylem hydraulic properties in poplar. Physiol. Plant. 2018, 163, 502–515. [Google Scholar] [CrossRef] [PubMed]
  54. Park, J.Y.; Canam, T.; Kang, K.Y.; Unda, F.; Mansfield, S.D. Sucrose phosphate synthase expression influences poplar phenology. Tree Physiol. 2009, 29, 937–946. [Google Scholar] [CrossRef] [PubMed] [Green Version]
  55. Loureno, A.; Rencoret, J.; Chemetova, C.; Gominho, J.; Pereira, H. Lignin Composition and Structure Differs between Xylem, Phloem and Phellem in Quercus suber L. Front. Plant. Sci. 2016, 7, 1612. [Google Scholar]
  56. Farquharson, K.L. Good neighbor hypothesis of lignification holds for xylem cells, but not for interfascicular fibers. Plant. Cell 2013, 25, 3635. [Google Scholar] [CrossRef] [PubMed] [Green Version]
  57. Hosokawa, M.; Suzuki, S.; Umezawa, T.; Sato, Y. Progress of lignification mediated by intercellular transportation of monolignols during tracheary element differentiation of isolated Zinnia mesophyll cells. Plant. Cell Physiol. 2001, 42, 959–968. [Google Scholar] [CrossRef] [Green Version]
  58. Tokunaga, N.; Sakakibara, N.; Umezawa, T.; Ito, Y.; Fukuda, H.; Sato, Y. Involvement of extracellular dilignols in lignification during tracheary element differentiation of isolated Zinnia mesophyll cells. Plant Cell Physiol. 2005, 46, 224–232. [Google Scholar] [CrossRef]
  59. Emiliani, G.; Traversi, M.L.; Anichini, M.; Giachi, G.; Giovannelli, A. Transcript Accumulation Dynamics of Phenylpropanoid Pathway Genes in the Maturing Xylem and Phloem of Picea abies during Latewood Formation. J. Integr. Plant. Biol. 2011, 53, 783–799. [Google Scholar] [CrossRef]
  60. Li, L.; Zhou, Y.; Cheng, X.; Sun, J.; Marita, J.M.; Ralph, J.; Chiang, V.L. Combinatorial modification of multiple lignin traits in trees through multigene cotransformation. Proc. Natl. Acad. Sci. USA 2003, 100, 4939–4944. [Google Scholar] [CrossRef] [PubMed] [Green Version]
  61. Kumar, R.; Vashisth, D.; Misra, A.; Akhtar, M.Q.; Jalil, S.U.; Shanker, K.; Gupta, M.M.; Rout, P.K.; Gupta, A.K.; Shasany, A.K. RNAi down-regulation of cinnamate-4-hydroxylase increases artemisinin biosynthesis in Artemisia annua. Sci. Rep. 2016, 6, 26458. [Google Scholar] [CrossRef] [Green Version]
  62. Milhinhos, A.; Miguel, C.L.M. Hormone interactions in xylem development: A matter of signals. Plant. Cell Rep. 2013, 32, 867–883. [Google Scholar] [CrossRef]
  63. Liu, B.; Zhao, S.; Li, P.; Yin, Y.; Niu, Q.; Yan, J.; Huang, D. Plant buffering against the high-light stress-induced accumulation of CsGA2ox8 transcripts via alternative splicing to finely tune gibberellin levels and maintain hypocotyl elongation. Hortic. Res. 2021, 8, 2. [Google Scholar] [CrossRef]
  64. Huiyan, G.; Yucheng, W.; Huizi, L.; Ping, H.; Yuanyuan, J.; Chunrui, Z.; Yanmin, W.; Shan, G.; Chuanping, Y.; Chao, W. Exogenous GA3 Application Enhances Xylem Development and Induces the Expression of Secondary Wall Biosynthesis Related Genes in Betula platyphylla. Int. J. Mol. Sci. 2015, 16, 22960–22975. [Google Scholar]
  65. Yuan, Y.; Chong, W.; Yunjun, L.; Jian, Y.; Luqi, H.; Ji-Hong, L. The Scutellaria baicalensis R2R3-MYB Transcription Factors Modulates Flavonoid Biosynthesis by Regulating GA Metabolism in Transgenic Tobacco Plants. PLoS ONE 2013, 8, e77275. [Google Scholar] [CrossRef] [Green Version]
  66. Goicoechea, M.; Lacombe, E.; Legay, S.; Mihaljevic, S.; Grima-Pettenati, J. EgMYB2, a new transcriptional activator from Eucalyptus xylem, regulates secondary cell wall formation and lignin biosynthesis. Plant. J. 2010, 43, 553–567. [Google Scholar] [CrossRef] [PubMed] [Green Version]
  67. Ye, Z.H. Transcriptional activation of secondary wall biosynthesis by rice and maize NAC and MYB transcription factors. Plant. Cell Physiol. 2011, 52, 1856. [Google Scholar]
  68. Nakano, Y.; Yamaguchi, M.; Endo, H.; Rejab, N.A.; Ohtani, M. NAC-MYB-based transcriptional regulation of secondary cell wall biosynthesis in land plants. Front. Plant. Sci. 2015, 6, 288. [Google Scholar] [CrossRef] [PubMed] [Green Version]
  69. Guillaumie, S.; Mzid, R.; Méchin, V.; Léon, C.; Hichri, I.; Destrac-Irvine, A.; Trossat-Magnin, C.; Delrot, S.; Lauvergeat, V. The grapevine transcription factor WRKY2 influences the lignin pathway and xylem development in tobacco. Plant. Mol. Biol. 2010, 72, 215. [Google Scholar] [CrossRef]
  70. Ko, J. Ectopic expression of MYB46 identifies transcriptional regulatory genes involved in secondary wall biosynthesis in Arabidopsis. Plant. J. Cell Mol. Biol. 2010, 60, 649–665. [Google Scholar] [CrossRef] [PubMed]
  71. Soler, M.; Camargo, E.L.O.; Carocha, V.; Cassan-Wang, H.; Grima-Pettenati, J. The Eucalyptus grandis R2R3-MYB transcription factor family: Evidence for woody growth-related evolution and function. New Phytol. 2014, 206, 1364–1377. [Google Scholar] [CrossRef] [PubMed]
  72. Bonke, M.; Thitamadee, S.; Mhnen, A.P.; Hauser, M.T.; Helariutta, Y. APL regulates vascular tissue identity in Arabidopsis. Nature 2003, 426, 181–186. [Google Scholar] [CrossRef]
  73. Cominelli, E.; Sala, T.; Calvi, D.; Gusmaroli, G.; Tonelli, C. Over-expression of the Arabidopsis AtMYB41 gene alters cell expansion and leaf surface permeability. Plant. J. 2010, 53, 53–64. [Google Scholar] [CrossRef] [PubMed]
  74. Zhong, R.; Ye, R.Z.H. The MYB46 Transcription Factor Is a Direct Target of SND1 and Regulates Secondary Wall Biosynthesis in Arabidopsis. Plant. Cell Online 2007, 19, 2776–2792. [Google Scholar] [CrossRef] [PubMed] [Green Version]
  75. Ohtani, M.; Nishikubo, N.; Xu, B.; Yamaguchi, M.; Mitsuda, N.; Goué, N.; Shi, F.; Ohme-Takagi, M.; Demura, T. A NAC domain protein family contributing to the regulation of wood formation in poplar. Plant. J. 2011, 67, 499–512. [Google Scholar] [CrossRef] [PubMed]
Figure 1. The picture shows the cross-section histological observation of the stem nodes of S1–S6 in six different sampling periods in the “Shanxin” poplar. The xylem is dyed by Safranin O-staining and fast-green. Scale bar = 500 mm. The black arrow indicates the newly grown xylem, and the red arrow indicates the last year xylem.
Forests 12 00451 g001
Figure 2. Length distribution of the unigenes isolated from the “Shanxin” poplar xylem. The length intervals of the unigenes are shown on the x-axis, and the number of unigenes is shown on the y-axis.
Forests 12 00451 g002
Figure 3. Cluster of Orthologous Groups (COG) functional annotation classification of the differentially expressed genes (DEGs) isolated in S1 vs. S2 from the “Shanxin” poplar xylem.
Forests 12 00451 g003
Figure 4. eggNOG annotation of the xylem DEGs in S1 vs. S2 from the “Shanxin” poplar.
Forests 12 00451 g004
Figure 5. Distribution of the Gene Ontology (GO) terms associated with xylem development in “Shanxin” poplar after enrichment analysis of the upregulated DEGs during the seasonal change. GO terms in the three major GO ontologies are shown on the left, and the specific sample comparisons are color-coded. BP: Biological process, MF: Molecular function and CC: Cellular component. The number represents the number of enriched genes.
Forests 12 00451 g005
Figure 6. Distribution of the Gene Ontology (GO) terms associated with xylem development in “Shanxin” poplar after an enrichment analysis of the downregulated DEGs during the seasonal change. As in Figure 5, the GO terms in the three major GO ontologies are shown on the left, and the specific sample comparisons are color-coded. BP: Biological process, MF: Molecular function and CC: Cellular component. The number represents the number of enriched genes.
Forests 12 00451 g006
Figure 7. Gene expression profiling of clusters, showing log2 of the fold change variations among the five time points. (A) The expansin gene and (B) the XTH gene.
Forests 12 00451 g007
Figure 8. The log2 of the fold change variations of the cellulose synthase genes at five time points.
Forests 12 00451 g008
Figure 9. The log2 of the fold change variations of sucrose synthase-related genes at five time points.
Forests 12 00451 g009
Figure 10. The log2 of the fold change variations of lignin-related genes among five time points. (A) includes 4CL1, CAD2 and CAD 3; (B) includes CAD4, CCO1 and CCO2; (C) includes CCR, CAD5 and CCO3 and (D) includes PAL1, PAL2, 4CL2, CAD1 and CAD6. We clustered together genes with similar trends.
Forests 12 00451 g010
Figure 11. Clustering diagram of peroxidase-related genes based on different log2 of the fold change variations. (AD) refer to the four subgroups of clustering of peroxidase-related genes.
Forests 12 00451 g011
Figure 12. The number of differential genes upregulated and downregulated at 5 time points.
Forests 12 00451 g012
Figure 13. Heatmap showing the relative expression of the differentially expressed genes (DEGs) in the developing xylem of “Shanxin” poplar. The rows and columns in the heat map represent the gene IDs and the six samples, respectively.
Forests 12 00451 g013
Table 1. Results of the hybrid poplar xylem transcriptome assembly.
Length RangeTranscriptUnigene
200–30039,799 (13.06%)33,221 (39.21%)
300–50031,720 (10.41%)19,620 (23.16%)
500–100046,697 (15.33%)14,289 (16.86%)
1000–200083,525 (27.41%)8068 (9.52%)
2000+102,953 (33.79%)9535 (11.25%)
Total Number304,69484,733
Total Length497,649,34568,129,242
N50 Length24371764
Mean Length1633.28804.05
Table 2. Numbers of unigenes annotated in eight databases.
Public DatabaseNumber of Annotated Genes
COG_Annotation13,860
GO_Annotation25,234
KEGG_Annotation15,363
KOG_Annotation19,885
Pfam_Annotation23,089
Swissprot_Annotation24,234
eggNOG_Annotation37,441
nr_Annotation40,513
All_Annotated43,525
Table 3. Numbers of differentially expressed genes in the xylem sample comparisons. DEGs: differentially expressed genes.
DEG_SetAll_DEGsUpregulatedDownregulated
S1 vs._S2427320912182
S1 vs._S3828240144268
S1 vs._S4858742664321
S1 vs._S5685238333019
S1 vs._S6587533082567
S2 vs. S3647032243246
S3 vs. S4907481426
S4 vs. S535642807757
S5 vs. S617265601166
Table 4. KEGG enrichment analysis of the DEGs from the hybrid poplar xylem.
Pathway DEGs with Pathway AnnotationAll Genes with Pathway AnnotationQ Value Pathway ID
S1 vs. S2Phenylpropanoid biosynthesis43198 1.90 × 10⁻¹⁰ko00940
Plant hormone signal transduction49337 1.08 × 10⁻⁵ko04075
Starch and sucrose metabolism52368 1.11 × 10⁻⁵ko00500
Plant–pathogen interaction42307 4.63 × 10⁻⁴ko04626
S1 vs. S3Starch and sucrose metabolism953682.00 × 10−5ko00500
Endocytosis793146.57 × 10−4ko04144
Amino sugar and nucleotide sugar metabolism662529.63 × 10−4ko00520
Phagosome441597.78 × 10−3ko04145
Plant hormone signal transduction773372.86 × 10−2ko04075
S1 vs. S4Endocytosis843143.70 × 10−4ko04144
Starch and sucrose metabolism923682.56 × 10−3ko00500
Phagosome471594.01 × 10−3ko04145
Amino sugar and nucleotide sugar metabolism662528.58 × 10−3ko00520
Plant hormone signal transduction813373.22 × 10−2ko04075
S1 vs. S5Starch and sucrose metabolism853681.39 × 10−5ko00500
Phenylpropanoid biosynthesis491989.89 × 10−4ko00940
S1 vs. S6Phenylpropanoid biosynthesis541982.04 × 10−8ko00940
Starch and sucrose metabolism703684.32 × 10−4ko00500
Diterpenoid biosynthesis14335.18 × 10−4ko00904
Stilbenoid, diarylheptanoid and gingerol biosynthesis10241.50 × 10−2ko00945
Publisher’s Note: MDPI stays neutral with regard to jurisdictional claims in published maps and institutional affiliations.

