Article

A Novel Insight into Functional Divergence of the MST Gene Family in Rice Based on Comprehensive Expression Patterns

State Key Laboratory for Hybrid Rice, College of Life Sciences, Wuhan University, Wuhan 430072, China
*
Author to whom correspondence should be addressed.
Submission received: 29 January 2019 / Revised: 14 March 2019 / Accepted: 18 March 2019 / Published: 20 March 2019
(This article belongs to the Section Plant Genetics and Genomics)

Abstract

:
Sugars are critical for plant growth and development as suppliers of carbon and energy, as signal molecules, or as solute molecules for osmotic homeostasis. Monosaccharide transporter (MST) genes are involved in various processes of plant growth and development as well as in response to abiotic stresses. However, the evolution and their roles of MST genes in growth and development and in coping with abiotic stresses in rice are poorly known. Here, we identified 64 MST genes in rice genome, which are classified into seven subfamilies: STP, PLT, AZT, ERD, pGlcT, INT, and XTPH. MST genes are not evenly distributed between chromosomes (Chrs) with a bias to Chr 3, 4, 7, and 11, which could be a result of duplication of fragments harboring MST genes. In total, 12 duplication events were found in the rice MST family, among which, two pairs were derived from fragmental duplications and ten pairs were from tandem duplications. The synonymous and nonsynonymous substitution rates of duplicate gene pairs demonstrated that the MST family was under a strong negative selection during the evolution process. Furthermore, a comprehensive expression analysis conducted in 11 different tissues, three abiotic stresses, five hormone treatments, and three sugar treatments revealed different expression patterns of MST genes and indicated diversified functions of them. Our results suggest that MST genes play important roles not only in various abiotic stresses but also in hormone and sugar responses. The present results will provide a vital insight into the functional divergence of the MST family in the future study.

1. Introduction

Sugars are critical for plant growth and development as suppliers of carbon and energy, signal molecules, or as solute molecules for osmotic homeostasis [1,2,3,4]. The adequate production, storage, and transport of sugars are tightly regulated both spatially and temporally [2,5]. In plants, various sugar transporters, including the SWEET (sugar will eventually be exported transporters) family and major facilitator superfamily (MFS) [6,7,8], are engaged in the transport of sugars from source (such as mature leaves) to sink organs (e.g., roots, seeds, and other reproductive organs) [6,7,8]. MFS can be further divided into the sucrose transporter (SUT) family and monosaccharide transporter (MST) family according to their specified substrates. MSTs are integral membrane proteins, which are involved in the transmembrane transport of a wide range of monosaccharides [1,4,6].
Genome-wide identification of MST family has been conducted in many plants including Arabidopsis [9,10,11], Vitis vinifera [12], Nicotiana tabacum [13], Solanum lycopersicum [14,15], Medicago truncatula [16], and Rosa hybrid [17]. Generally, MST family can be classified into seven subfamilies, STP, PLT, XTPH, INT, AZT, pGlcT, and ERD, based on their sequence features and substrate specificities [18,19]. In Arabidopsis, the identified STP proteins (STPs) are H+/hexose cotransporters locating on plasma membranes. Most STPs exhibit a broad spectrum of absorption characteristics of substrates [6,10]. For example, AtSIP1, AtSIP2, AtSIP3, AtSIP4, AtSIP6, and AtSIP11 are able to transport glucose, xylose, mannose, and galactose in different affinities, while they cannot transport fructose [2]. In contrast, AtSTP6, AtSTP13, and OsMST4 could transport fructose but do not transport pentose, xylose, and ribose [10,12,20]. However, a few STP proteins show substrate specificity in transport. For instance, AtSTP9 specifically transports glucose and AtSTP14 exhibits specific transport of galactose [21,22]. Moreover, PLT proteins (PLTs) transport not only polyols but also monosaccharides [23,24]. In XTPH proteins (XTPHs, also called VGTs), AtVGT1 can absorb glucose but not xylose. AtVGT1 and AtVGT2 are both H+/glucose reverse transporters localized on the tonoplast, which are involved in the transport and storage of monosaccharides in vacuoles [9,11]. AZT proteins (ATZs, also called TMT) were localized on tonoplast, too. Previous studies reported that the sucrose uptake capacity of vacuoles was reduced in the attmt1/attmt2 mutant of Arabidopsis, suggesting that TMTs are involved in transporting sucrose on the tonoplast [25]. pGlcT proteins (pGlcTs) was reported to transport glucose [26]. In Arabidopsis, ERD (ERD6s, also called SFPs) is the biggest subfamily in MST family, and the first identified ERD protein (AtERD6) was induced by drought and low temperature [27]. Among them, AtSFP1 and AtSFP2 are stress-inducible facilitated diffusion transporters and differ greatly in spatiotemporal expression [28]. Taken together, MST family genes play important roles in plant growth and development, as well as in responses to biotic and abiotic stresses.
Several MST genes had been studied in rice. For example, Toyofuku et al. (2000) cloned and analyzed three MST genes in rice, OsMST1, OsMST2, and OsMST3, and found that OsMST3 protein is able to transport some monosaccharides via an energy-dependent H+ co-transport manner [29]. Furthermore, OsMST5 is involved in pollen development in rice and its monosaccharide transport activity was characterized by heterologous expression analysis [30]. In addition, OsMST4 was ubiquitously expressed and had the capability of transporting fructose, galactose, mannose, and glucose [22]. In 2008, Wang et al. demonstrated that OsMST6 was a broad-spectrum monosaccharide transporter and its expression was induced by salt stress and sugars [31]. OsTMTs was involved in vacuolar sugar transport [2]. Moreover, OsGMST1 was up-regulated under salt stress conditions and knock down of this gene conferred hypersensitivity to salt stress in rice [32]. The evolution and functional divergence analysis of OsMSTs have been systematically elucidated in 2007 [19].
While several of these genes have been well studied in various organisms, the functions of the most MST family remain unclear to date. In this study, to interpret the possible physiological role of this family, we conducted a comprehensive analysis of expressions of MST genes in different tissues and under different treatments. Additionally, a systematic bioinformatics analysis was performed, including phylogenetic reconstruction, chromosome location, structural analysis of genes and proteins, gene duplication events, and the synonymous (Ks) and nonsynonymous (Ka) substitution rates of duplicate gene pairs (Ka/Ks ratios). This study provides vital insights into the evolution of the MST family in rice and leads to a better understanding of the MSTs functions.

2. Materials and Methods

2.1. Plant Materials and Treatments

Rice ‘9311’ (O. sativa ssp. indica) was used for quantitative Real-Time PCR (qRT-PCR). After two days of germination in water at 37 °C, seeds were transferred into vermiculite saturated with ddH2O for further growth. All seedlings were grown at 26 °C, with a daily photoperiodic cycle of 16 h light and 8 h dark, with 60% relative humidity.
In this study, 11 tissue samples were collected for tissues specific expression analysis as the previous study [33]. They were calli (Cal, induced 30 days before subculture), grouting seed (GS, embryo and endosperm at 12–15 days after flowering), root (Rt, 12 day old seedlings), shoot (Sh, 12 day old seedlings), flag leaf (FL, 1 week after heading), sink leaf (SL, unexpanded flag leaves harvested approximately 3 weeks before heading), sink flag leaf sheath (SinkFLS, flag leaf sheaths harvested from plants 1 week before heading), source flag leaf sheath (SourceFLS, flag leaf sheaths harvested from plants 1 week after heading), node (Nd, the first node on the top at panicle stage), internode (InterN, part between the first node and the second node on the top at panicle stage), and panicle (Pan5, panicle grown to the length of 5 cm). Three biological replicates were performed, with samples of each were collected from 15 plants. All the samples were triturated immediately with liquid nitrogen and stored at −80 ℃ before they were used for RNA extraction.
12 days old seedlings were treated with indole-3-acetic acid (IAA, 50 μM), 6-benzylamino purine (6BA, 25 μM), abscisic acid (ABA, 100 μM), gibberellic acid (GA, 100 μM), and salicylic acid (SA, 100 μM) by spraying. Samples (leaves) were collected at 0, 1, 3, 6, and 12 h. As to salt, osmotic, and drought treatments, the roots of 12 days old seedlings were rinsed, followed by the immediate immersion in NaCl solution (200 mM), PEG 6000 solution (20%, w/v), and air. Samples (leaves) were also collected at 0, 1, 3, 6, and 12 h. Three biological replicates were produced for every treatment, each of which was collected from 12 seedlings and pooled together. These samples were triturated immediately with liquid nitrogen, and stored at −80 °C for further use. The sugar treatments were also performed similarly with the NaCl, PEG 6000 solutions in salt stress treatments were replaced by 2% sucrose, glucose, and fructose solutions.

2.2. Identification of the MST Genes

MST genes were identified using a Hidden Markov model (HMM) and BLAST homology searches [34]. The reference genome sequence and annotations were downloaded from MSU 7.0 (http://rice.plantbiology.msu.edu). Arabidopsis MST protein sequences were downloaded from the TAIR database (https://www.arabidopsis.org/). The Arabidopsis MST proteins were queried against rice genome using BLASTP (e-value, e-5) to search for rice MST genes [8,35]. PF00083 was downloaded from Pfam (http://pfam.xfam.org/) and used to search the rice proteins database using HMMER 3.0 software (http://hmmer.org/). Finally, SMART (http://smart.embl-heidelberg.de/) and Pfam (http://pfam.xfam.org/search/sequence) were utilized to verify these sequences [34,35].

2.3. Phylogenetic Analysis, Gene Structure, and Conserved Motifs

Multiple sequences alignments were performed using ClustalW with default parameters (protein weight matrix was Gonnet). MEGA 6.0 (The Pennsylvania State University, PA, USA, https://www.megasoftware.net/) was used to construct a Neighbor-Joining (NJ) phylogenetic tree of rice MST genes with 1000 bootstrap replicates [8,35,36]. Conserved motifs of MST proteins were identified by Multiple Expectation Maximization for motif Elicitation (MEME, http://meme-suite.org/tools/meme) tool with the maximum number setting to 12 [8,35]. Gene structures (exon/intron) of all MST genes were analyzed using GSDS 2.0 (http://gsds.cbi.pku.edu.cn/). Finally, TBtools was used to visualize the phylogenetic tree, gene structure, and conserved motifs of MST genes [37].

2.4. Chromosomal Locations, Gene Duplication Events, and Ka/Ks Values

Coordinates on the reference genome sequence of all MST genes were obtained from the genome annotation file. Gene duplication events were identified using the ‘duplicate_gene_classifier’ script with the default parameters, in MCScanX software (University of Georgia, GA, USA, http://chibba.pgml.uga.edu/mcscan2/) [38]. Locations of all MST genes were mapped by TBtools [34] and gene duplication events were visualized using Circos software (http://circos.ca/) [38,39]. In addition, the synonymous (Ks) and nonsynonymous (Ka) substitution rates of MST duplicate gene pairs were estimated using DnaSP 5.0 (http://www.ub.edu/dnasp/) [40]. The divergence time of each duplication event in MST family was calculated by T = Ks/(2 × 9.1 × 10−9) × 10−6 million years ago (Mya) [38].

2.5. Expression Analysis of MST Genes by qRT-PCR

All RNA extraction and reverse transcription were performed by TRIzol Ragent (Invitrogen, Beijing, China) and PrimeScript RT reagent Kit (TakaRa, Dalian, China) according to instruction manuals. qRT-PCR analyses were performed in a 96-well plate on Bio-Rad CFX96 real time PCR system (Bio-Rad, Hercules, CA, USA). The qRT-PCR reaction (10 μL) was formulated using SYBR Green Master Mix reagent (Bio-Rad, Hercules, CA, USA). All the thermal cycles were as follows: 95 °C for 5 min; 40 cycles of 95 °C for 10 s, 58–62 °C for 10 s, 72 °C for 15 s; then melt curve from 65–95 °C. Three biological replicates (from three independent RNA extractions) of each treatment were used for qRT-PCR and three technical replicates from the same RNA extraction were used for each biological replicate. The amplification specificity of primers was verified by melting curve analysis. Actin gene was used as an internal control (Primer F: TGCTATGTACGTCGCCATCCAG; Primer R: AATGAGTAACCACGCTCCGTCA). The relative expression levels of MST genes were calculated by the 2−ΔΔCT method (Table S1) [41].

2.6. Expression Correlation between MST Paralogs under Hormone and Abiotic Stress Treatments

Expression profiles of MST duplicate gene pairs were manually gathered from qRT-PCR data. Using CORREL (array1, array2) function in Excel, we calculated the correlation coefficient between each pair. According to earlier studies, significant values can assess the degree of expression diversity [42,43]. Generally, r < 0.3, 0.3 < r < 0.5, and r > 0.5 mean divergence, ongoing divergent, and non-divergence, respectively [42,43].

3. Results

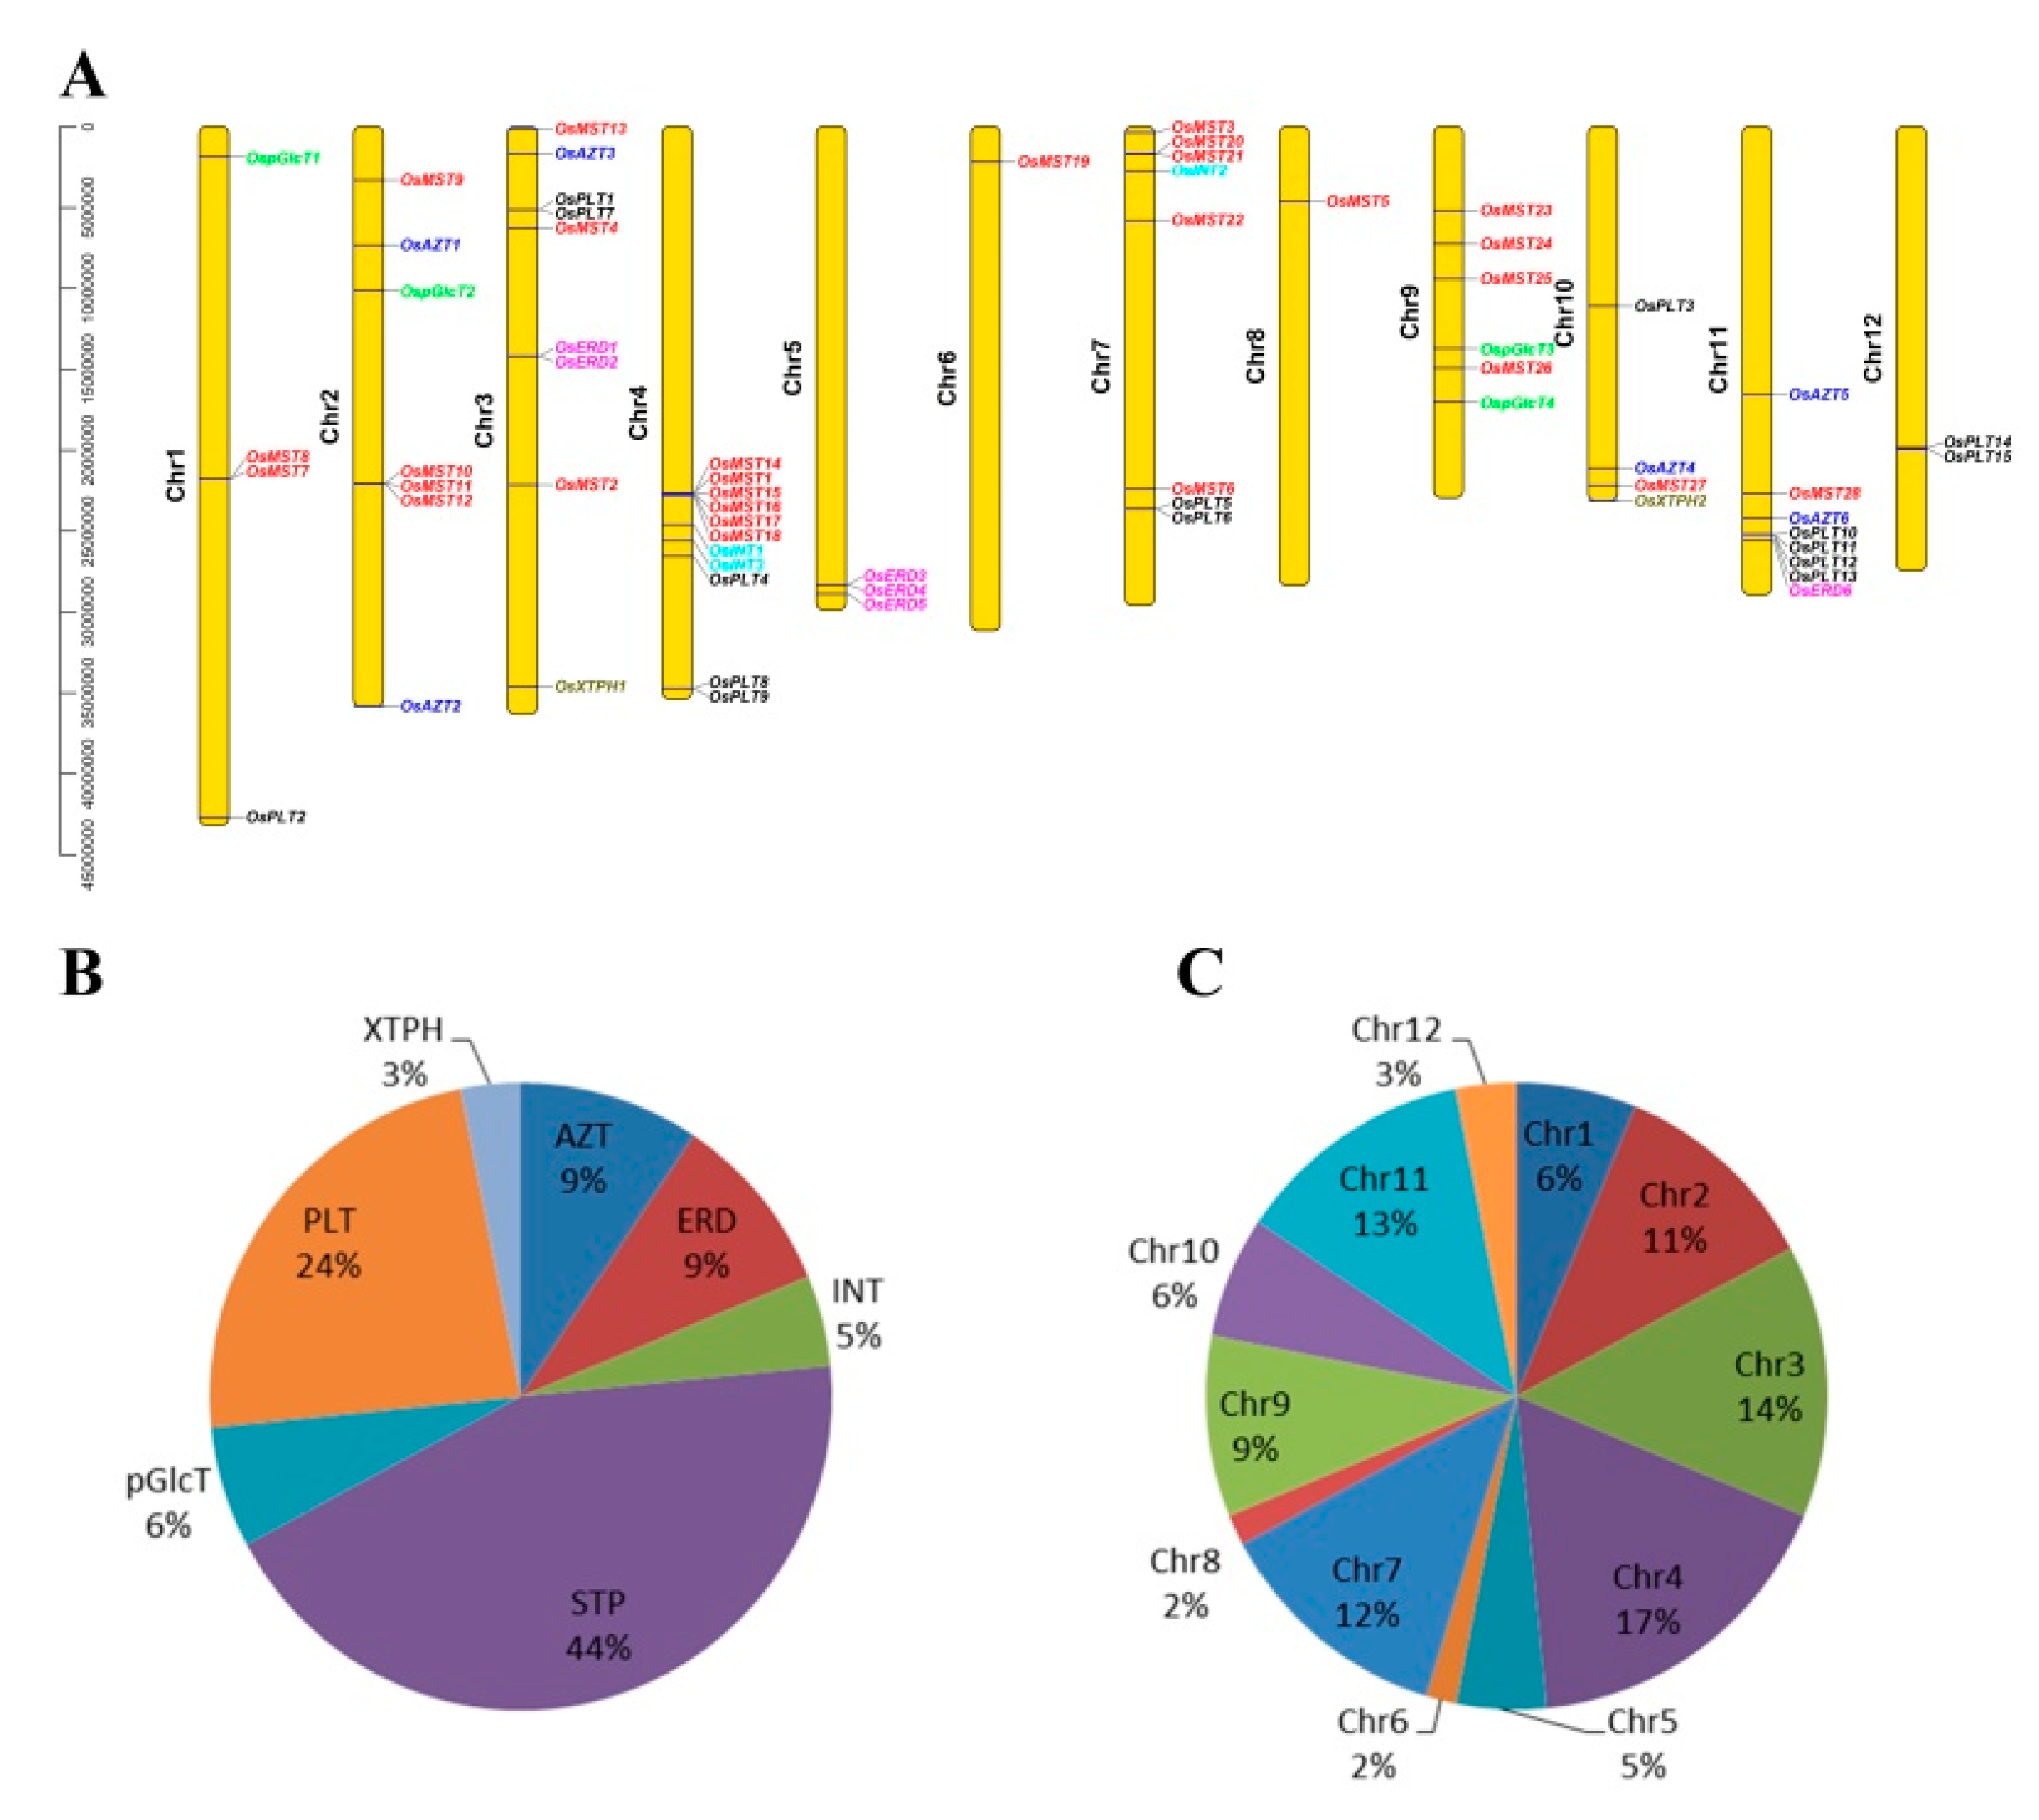
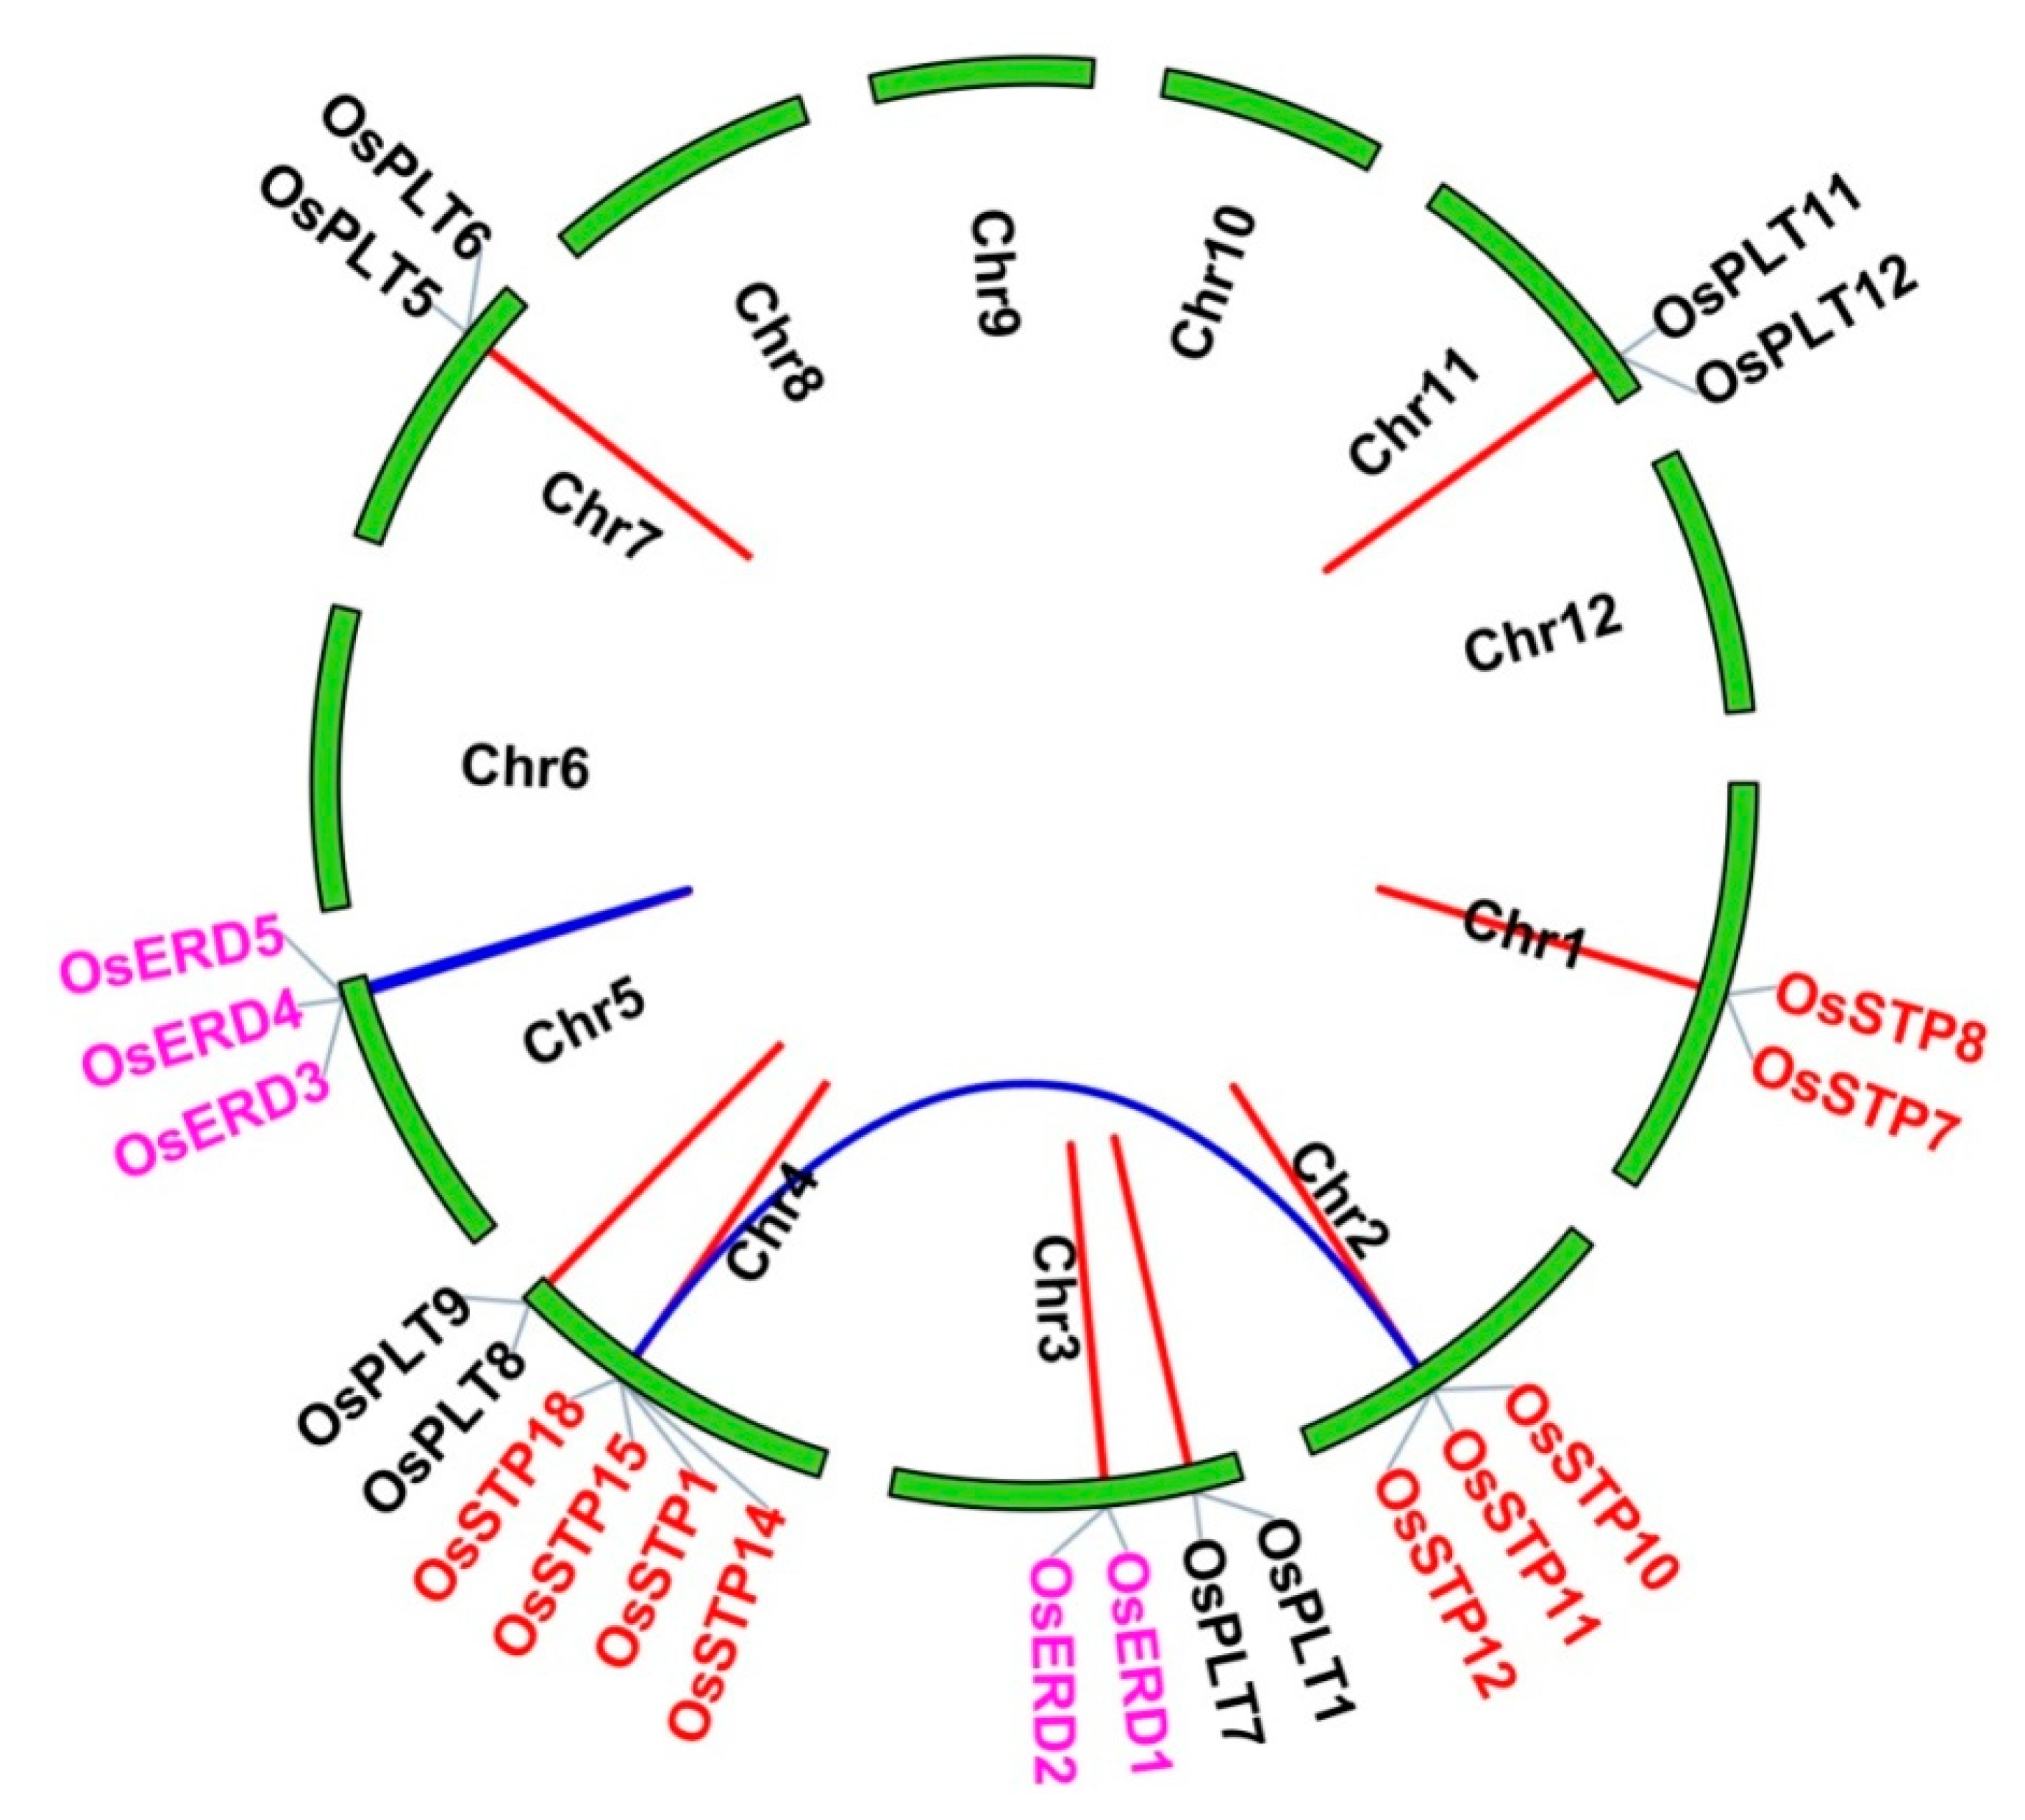
3.1. Identification, Classification, Chromosome Locations, Duplication Events, and Selection Pressure of the MST Genes

A total of 64 MST genes were identified and grouped into seven subfamilies (Figure 1 and Table 1): 28 STPs (44%), 15 PLTs (24%), six AZTs (9%), six ERDs (9%), four pGlcTs (6%), three INTs (5%), and two XTPHs (3%) (Figure 2B, Figure S1). These genes are widely dispersed across different chromosomes with a bias to Chr 4, 3, 7 and 11. Among them, 11 (17%), nine (14%), eight (12%), and eight (12%) genes were located on Chr 4, 3, 7 and 11, respectively. Furthermore, Chr2, Chr9, Chr1, Chr10, Chr5, and Chr12 had seven, six, four, four, three, and two genes, respectively, while only one gene was found in Chr6 and Chr8 (Figure 2A,C). In short, all MST genes were unevenly distributed across all 12 chromosomes. Similar uneven distribution patterns of the MST genes were also found in Arabidopsis [9,10,11], Vitis vinifera [12], and Nicotiana tabacum [13].
In addition, we observed that many genes from the same subfamily formed tandem gene clusters, such as STP cluster in Chr1, Chr2, Chr4, and Chr7, as well as ERD cluster in Chr3 and Chr5 (Figure 2A). We conjectured that gene clusters may be generated from tandem duplications and segmental duplications. Thus, MST duplicate gene pairs were evaluated using MCScanX. As a result, two segmental duplication events and ten tandem duplication events were found (Figure 3 and Table 2). Interestingly, we noticed that duplication events were only found in STP, ERD, and PLT subfamilies (Figure 3 and Table 2).
Next, Ka/Ks values of MST duplicate gene pairs were calculated to evaluate the driving force underlying the MST gene’s evolution. Ka/Ks > 1 means a positive selection, Ka/Ks < 1 means a negative selection, and Ka/Ks = 1 means a neutral selection [8,38]. The results showed that Ka/Ks values of MST duplicate gene ranged from 0.1603–0.7193, indicating that MST family was under a strong negative selection during the evolution process (Figure 3). The divergence times of duplication events were estimated from 1.80–18.08 Mya (Figure 3).

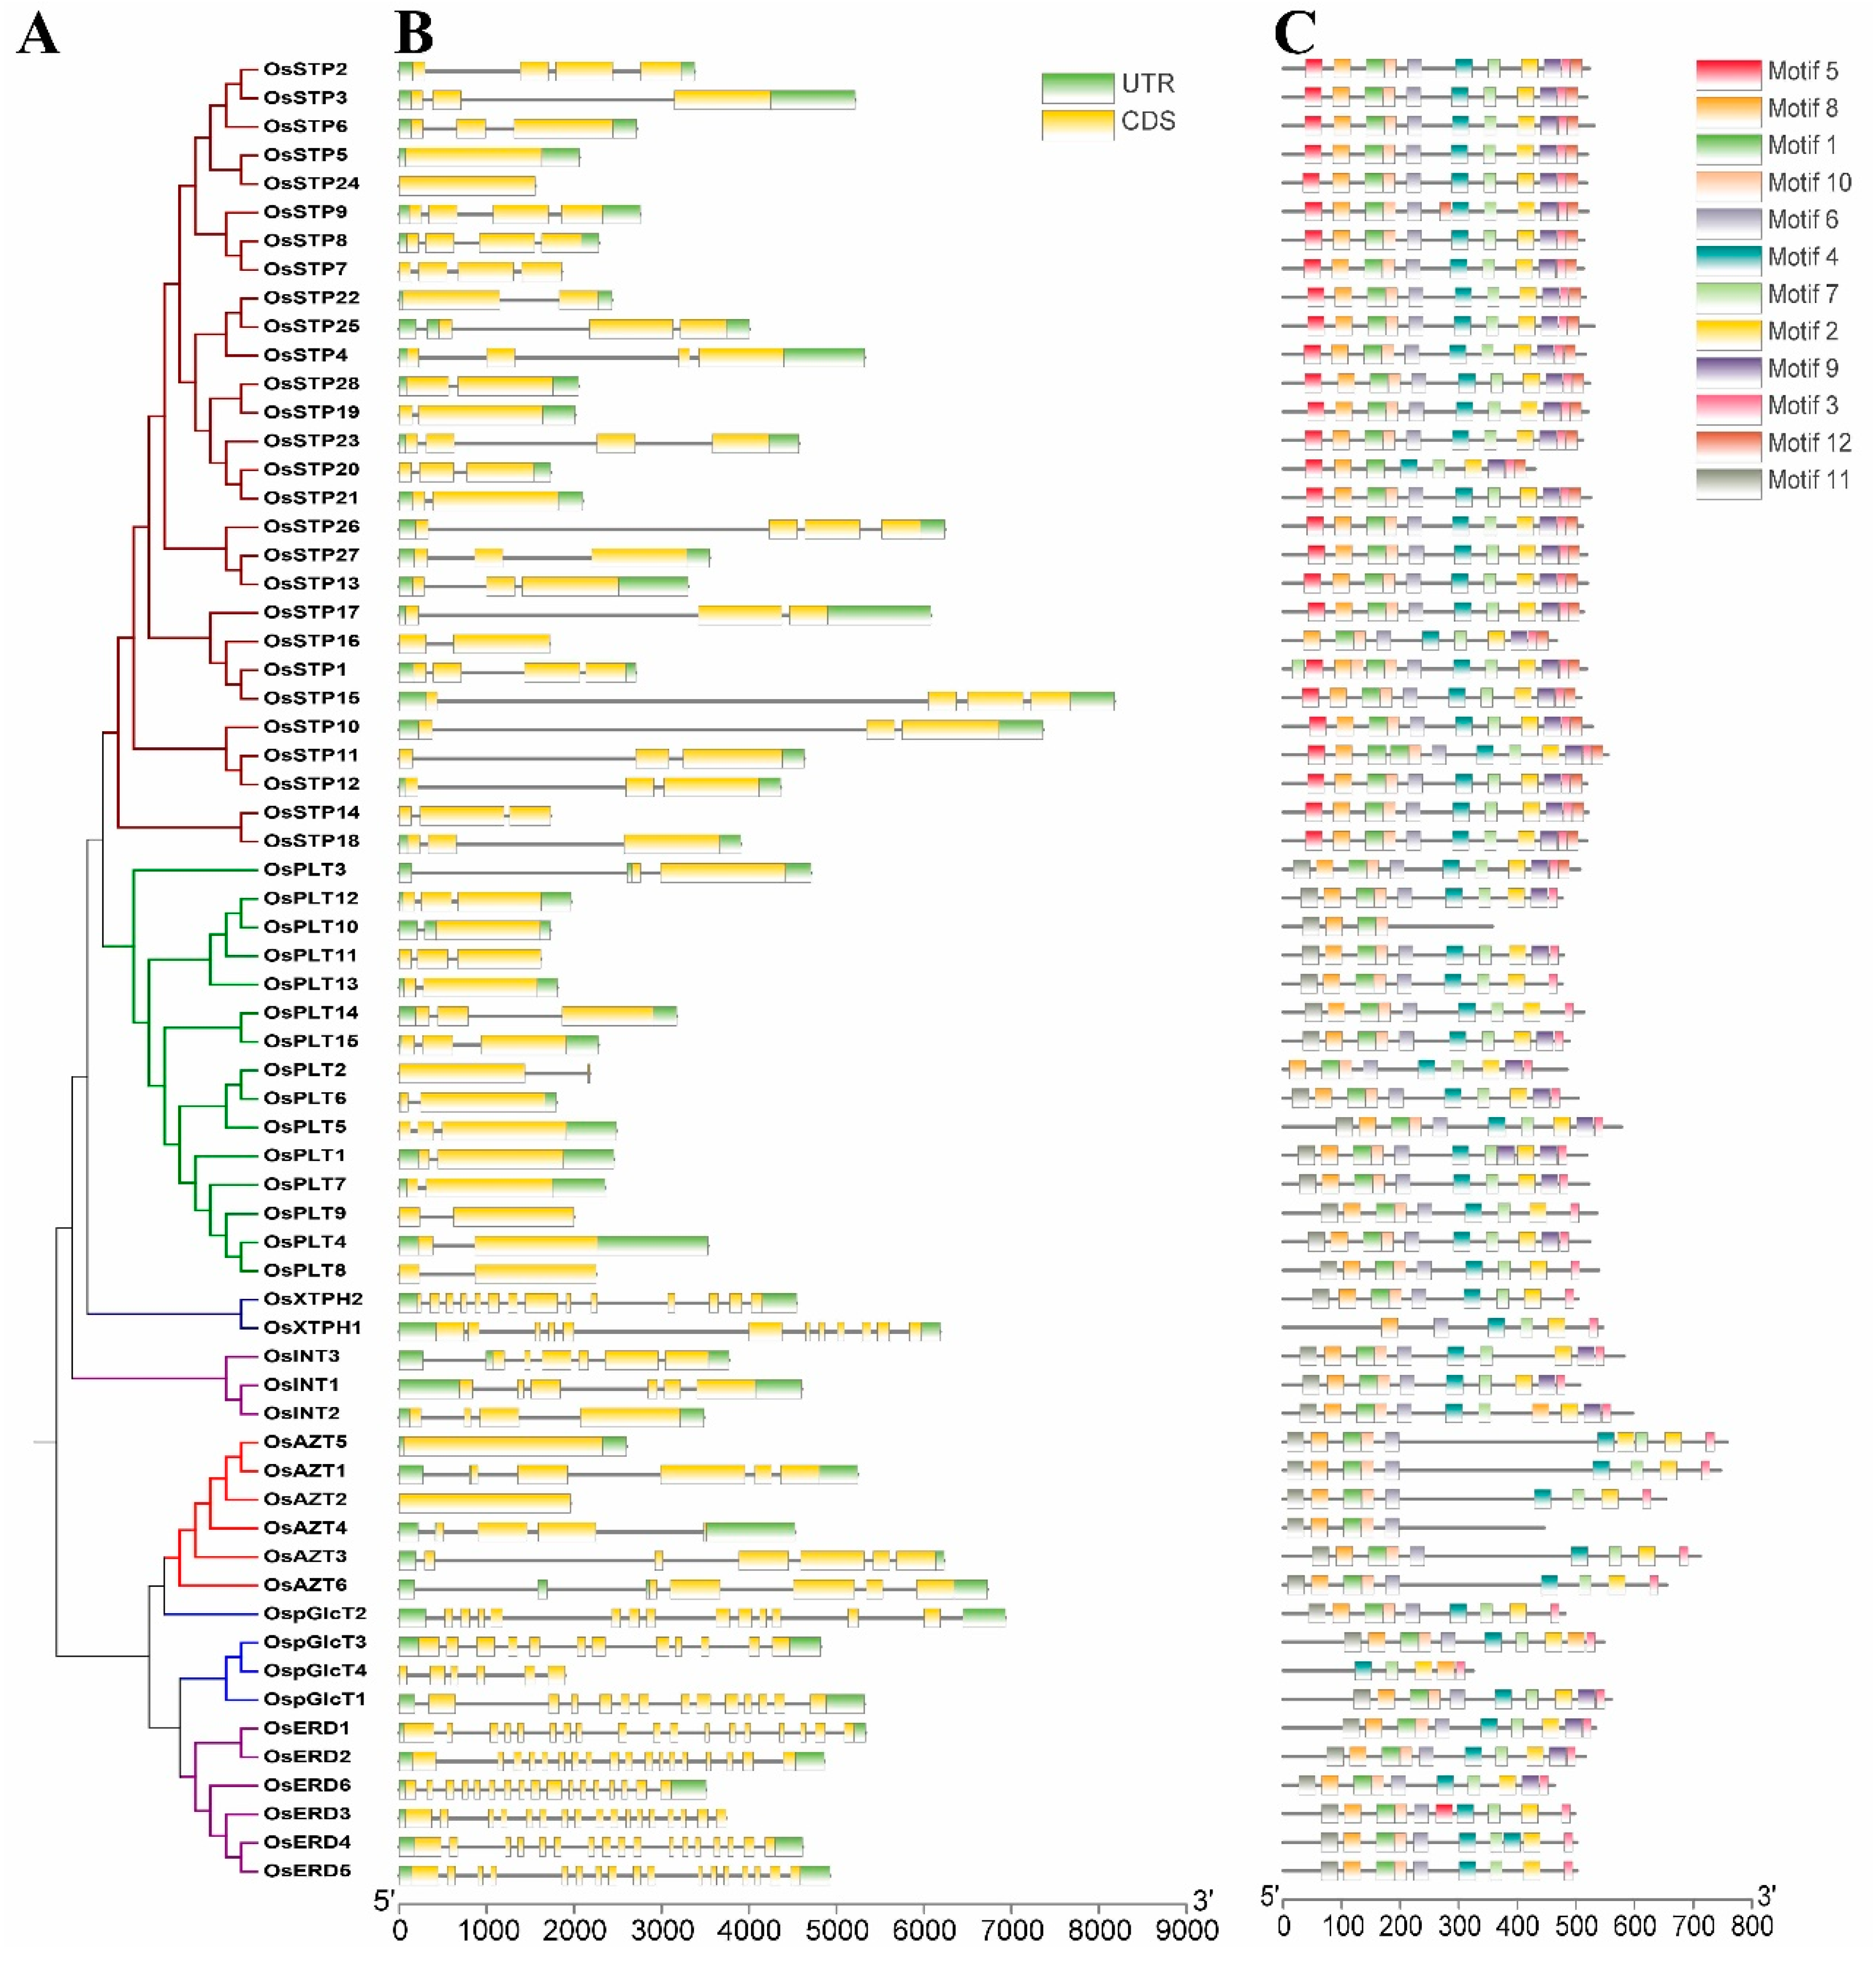
3.2. Gene Structure and Conserved Motifs

We also analyzed the gene structures and conserved motifs in rice MST genes (Figure 4), as earlier studies suggested the diversity of gene structure and protein sequences as an important driving force of multigene families’ evolution [29,34,38]. Analysis of gene structure showed that members of the XTPH, ERD, and pGlcT subfamilies had more exons than other subfamilies in coding sequence (CDS) regions, while PLT subfamily had fewer exons. On the other hand, large variations of exon numbers were observed in STP, INT, and AZT subfamilies (Figure 4B). As expected, the motifs arrangement was strongly conserved in the same subfamilies, while there were big differences between different subfamilies (Figure 4C).

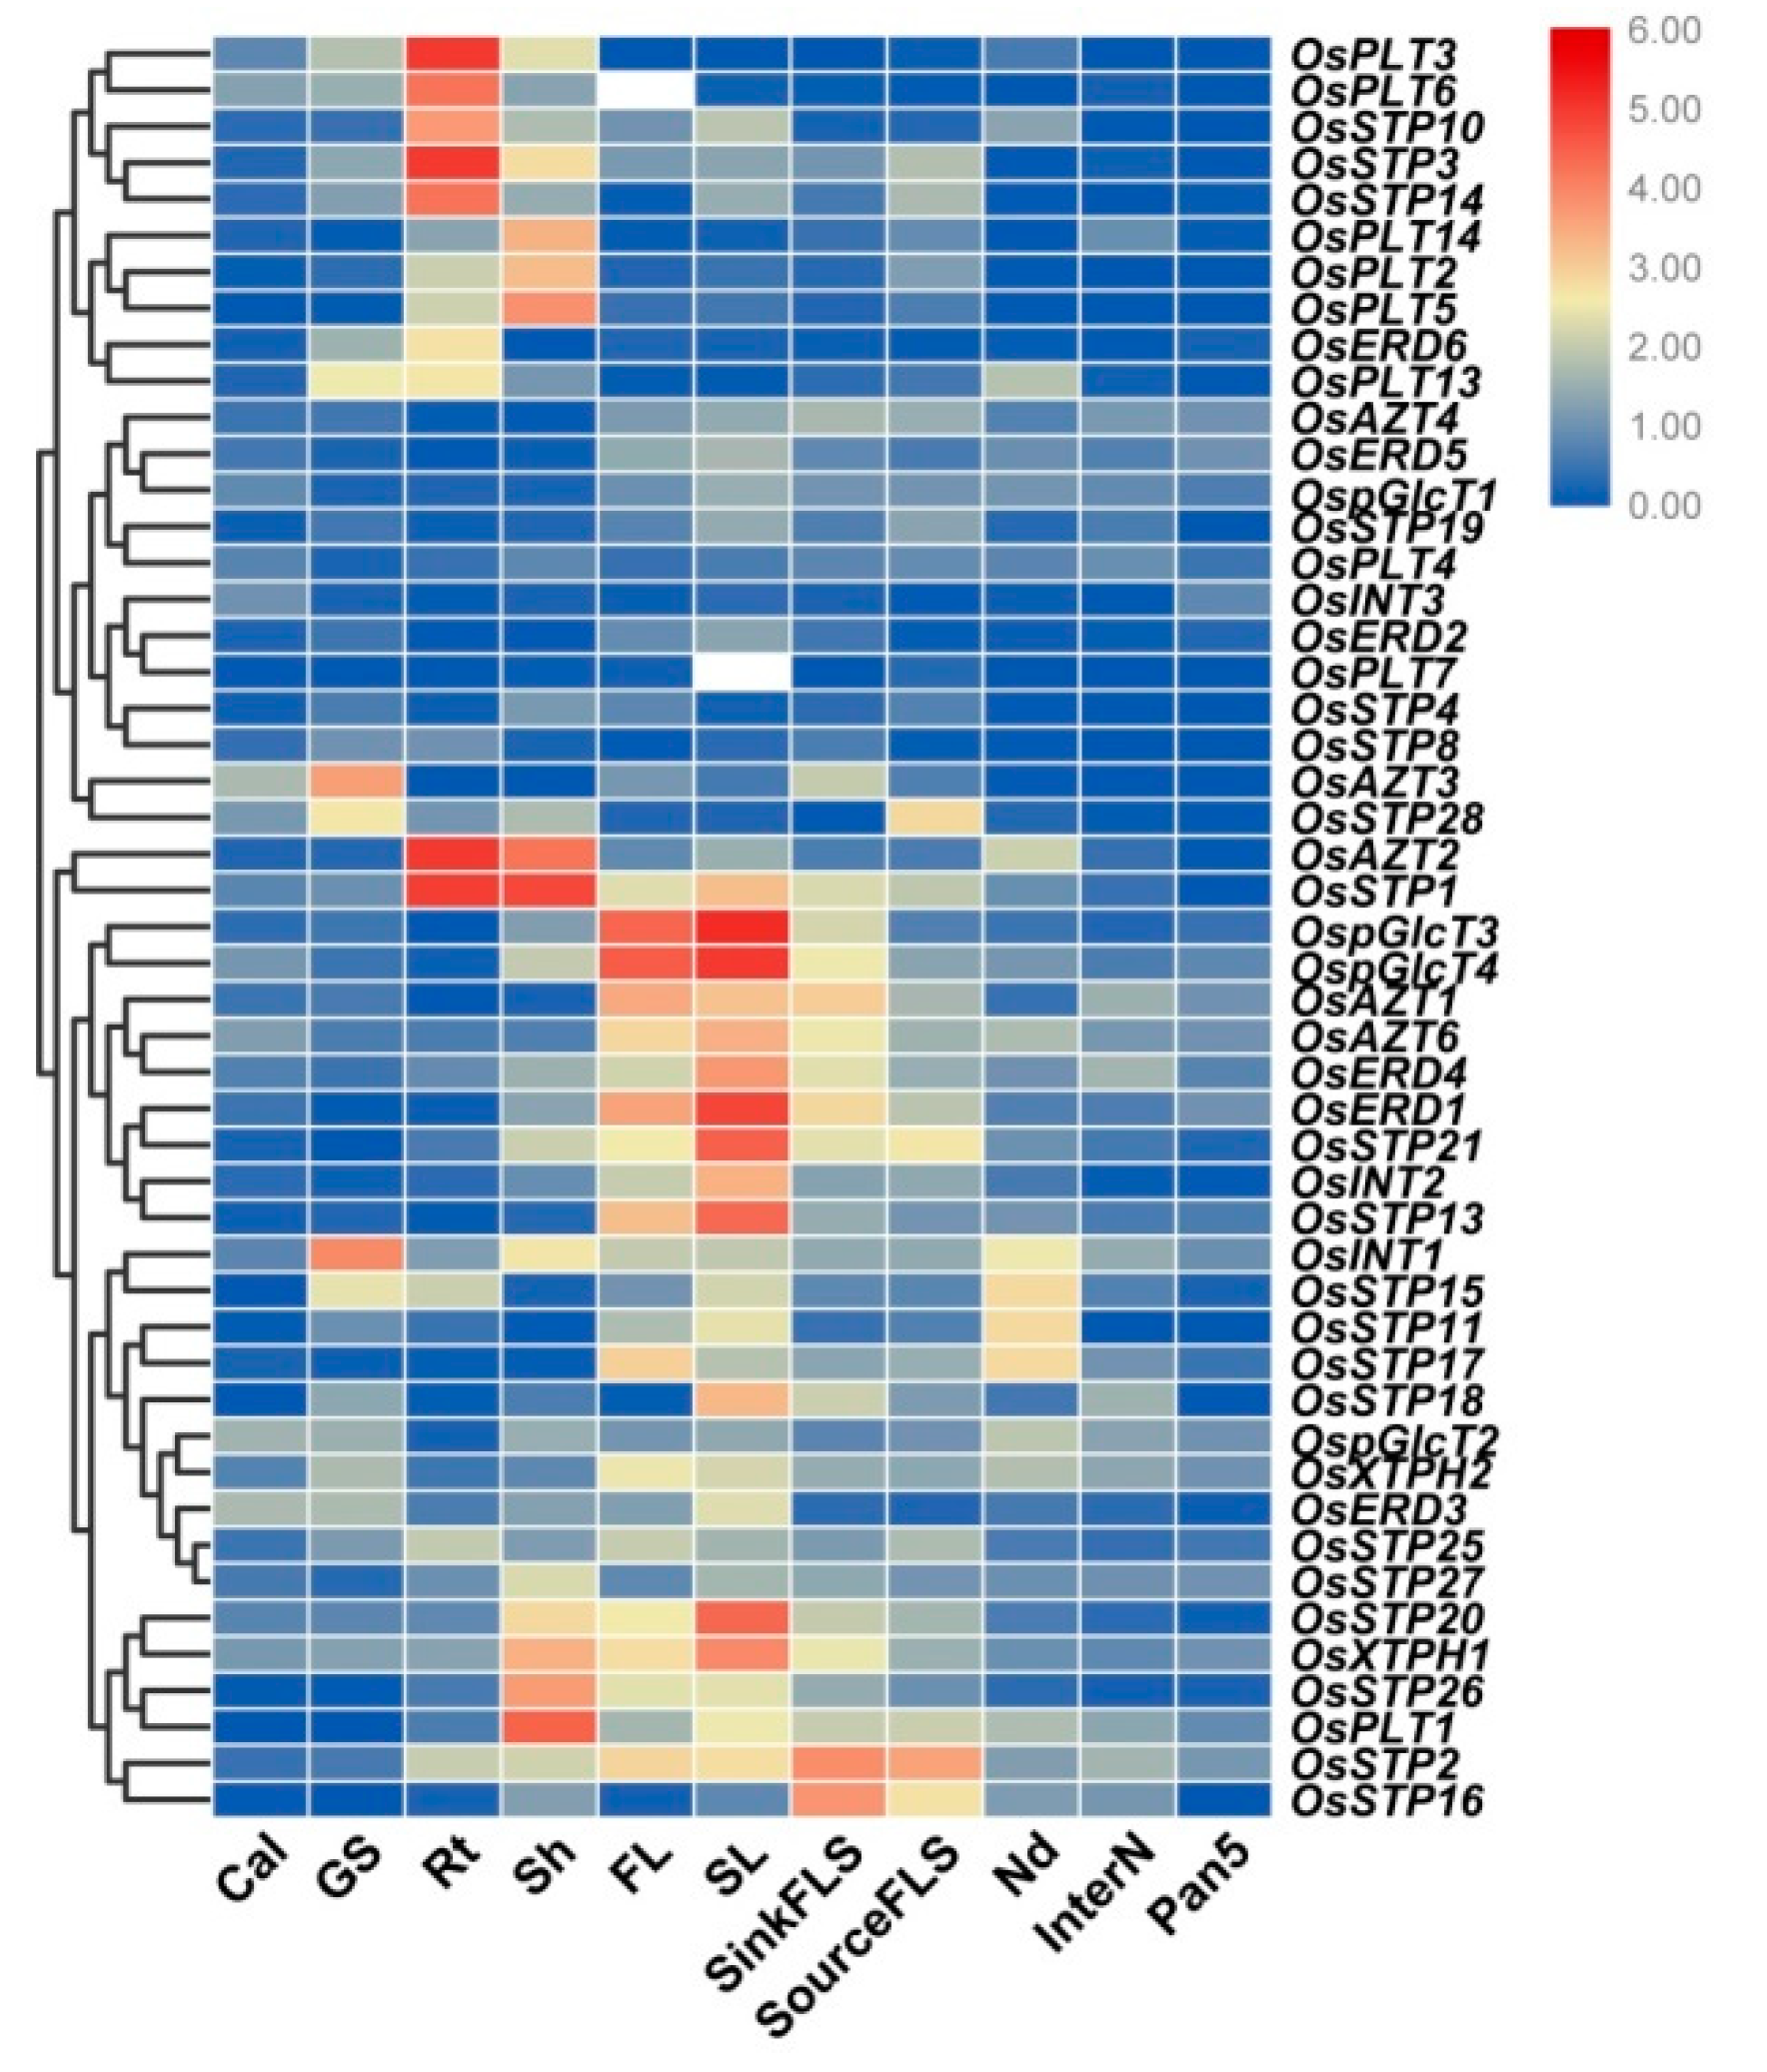
3.3. Expression Analysis of MST Genes in Various Tissues

To further characterize the potential function of MST genes, a comprehensive expression analysis of MST genes in 11 tissues was analyzed using qRT-PCR. In the present study, we found diversified expression pattern between different MST genes in rice. For example, several genes were lowly expressed in all tested tissues, namely OsAZT4, OsERD5, OspGlcT1, OsSTP19, OsPLT4, OsINT3, OsERD2, OsPLT7, OsSTP4, and OsSTP8, while the remaining MST genes showed relatively higher expressions in some specific tissues (Figure 5). For example, OsPLT3, OsPLT6, OsSTP10, OsSTP3, and OsSTP14 had the predominant expression in roots; OsPLT14, OsPLT2, and OsPLT5 showed higher expressions in shoots; OsAZT2 and OsSTP1 were highly expressed in both roots and shoots. OspGlcT3, OspGlcT4, OsAZT1, OsAZT6, OsERD4, OsERD1, OsSTP21, OsINT2, and OsSTP13 showed relatively high expression in flag leaf at 1 week after heading, sink leaf at heading stage, and sink flag leaf sheath at heading stage. OsINT1, OsATZ3, and OsSTP28 were highly expressed in grouting seed at 12–15 days after flowering. Besides, OsSTP20, OsXTPH1, OsSTP26, and OsPLT1 showed relatively high expression in shoots of 12-days-old seeding, in flag leaf at 1 week after heading and sink leaf at heading stage. OsSTP2 and OsSTP16 had advantage expressions in sink flag leaf sheath at the heading stage and source flag leaf sheath at 1 week after heading. In addition, we compared the expression of duplicate gene pairs. Different expression patterns were found in all the gene pairs (Figure 5). We particularly noticed that OsSTP14 and OsSTP1, which were tandem duplicated genes, showed similar expression patterns in various tissues, except OsSTP1 was highly expressed in flag leaf and leaf (Figure 5).

3.4. Expression Analysis of MST Genes under Abiotic Stresses

We further performed qRT-PCR analyses to detect the transcript change levels of MST genes under different abiotic stresses, including salt stress, osmotic stress, and drought stress. In this study, the fold changes >1.5 was considered to be a significant difference for the gene under treatments. We found that most MST genes were downregulated, while some others were upregulated under the tested abiotic stresses (Figure 6). OsERD2, OsSTP25, OsSTP2, OsSTP3, OsSTP11, OsPLT3, OsERD3, OsSTP4, OsSTP19, and OsSTP28 were significantly up-regulated under three abiotic stresses (Figure 6). However, some genes exhibited stress-specific expression profile. For instance, OsERD6, OspGlcT2, OsINT2, and OsPLT14 showed higher up-regulation under salt stress than under osmotic and drought stresses. OsSTP10, OsSTP1, OsSTP14, OspGlcT3, and OspGlcT4 were higher up-regulated under osmotic stress than under salt and drought stresses. OsPLT4 showed higher up-regulation under salt and drought stress than under osmotic stresses. OsPLT13 were higher up-regulated under salt and osmotic stress than under drought stresses (Figure 6).

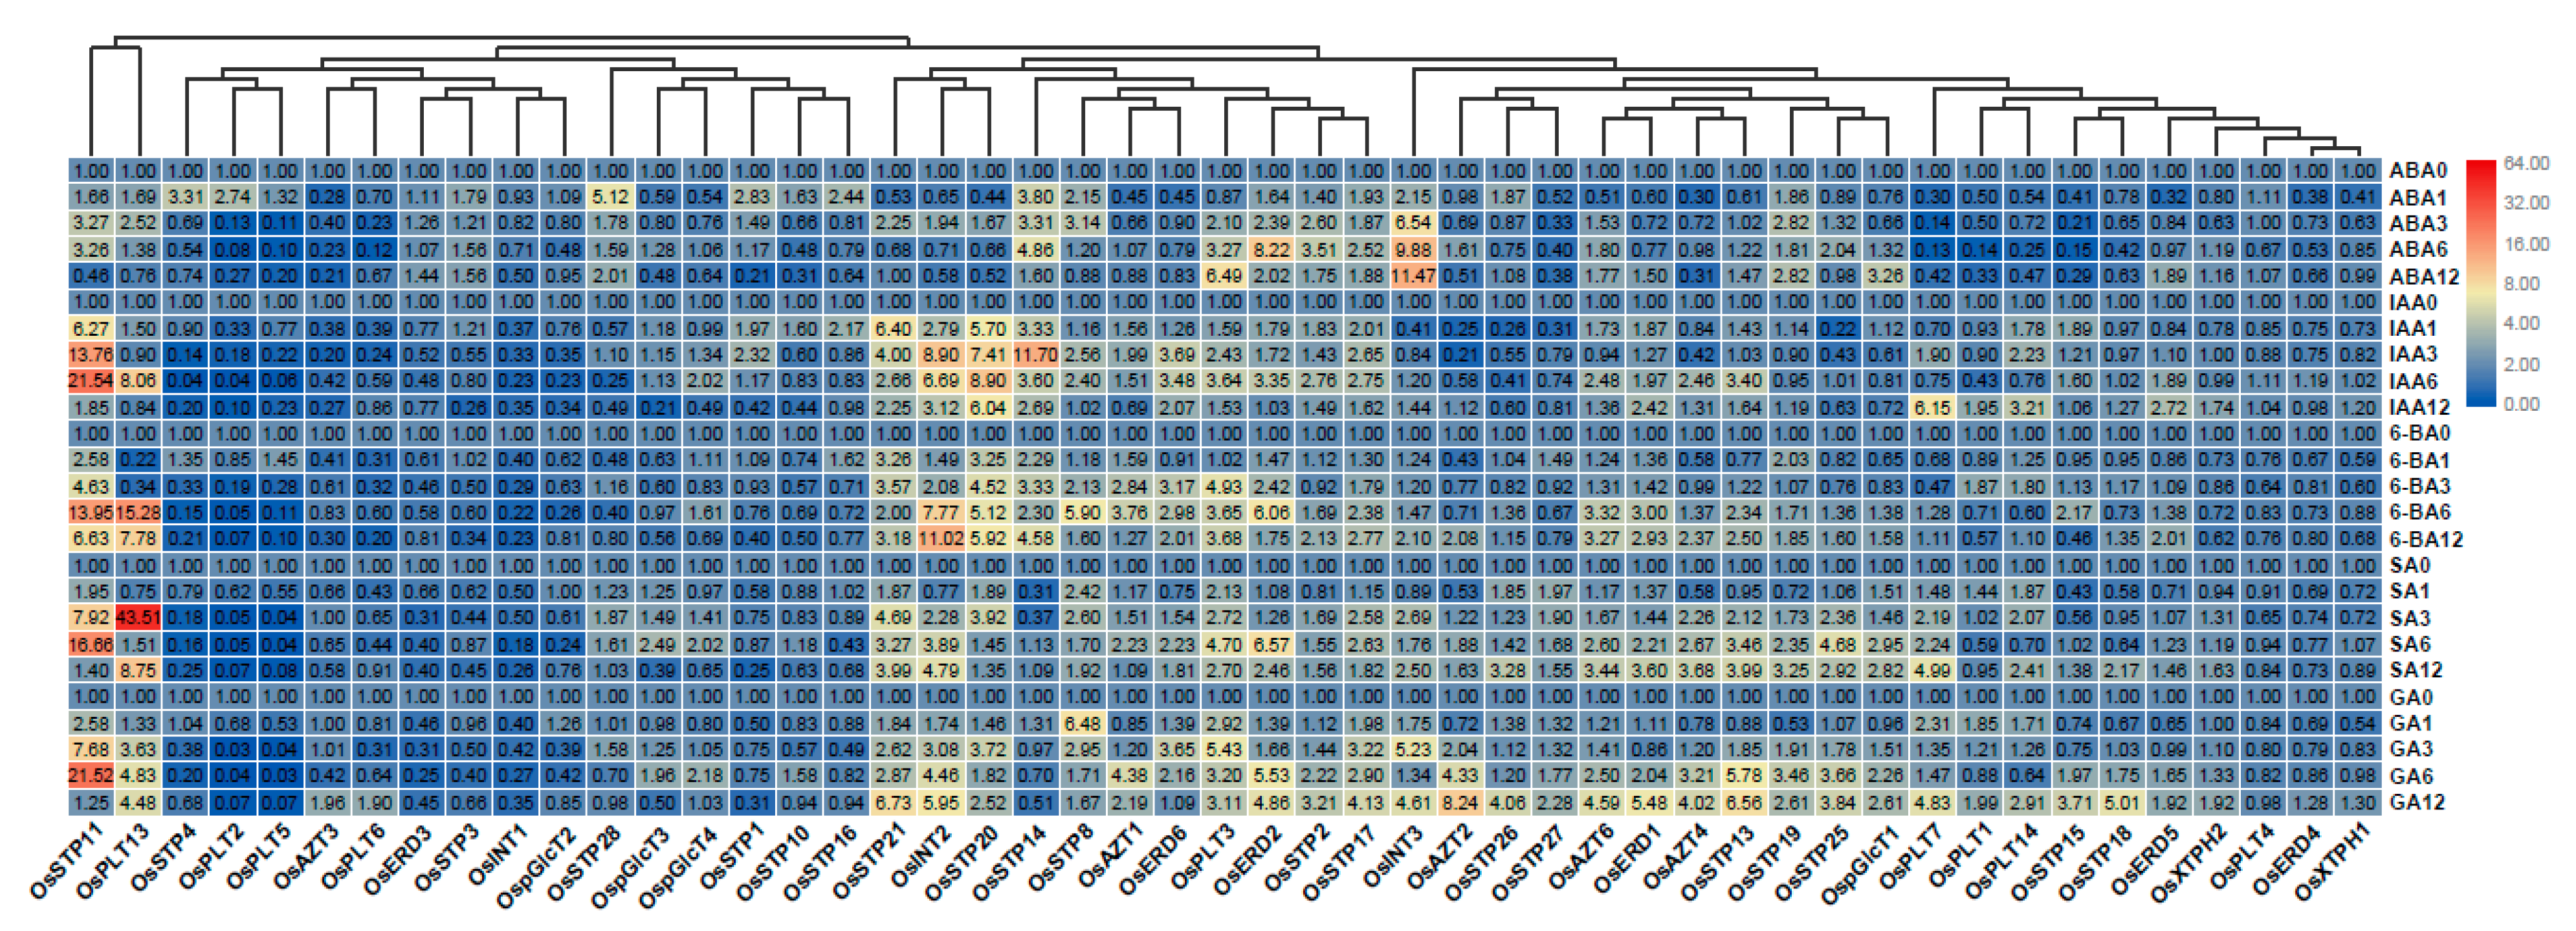
3.5. Expression Analysis of MST Genes under Hormone Treatments

To our knowledge, the function of the MST family under hormone treatments was not well-documented in rice. In this present study, we found that expression patterns of MST genes differed under five different hormone treatments (Figure 7). We found that OsSTP11, OsERD2, and OsPLT3 were up-regulated under ABA, IAA, 6-BA, SA, and GA treatments. However, OsINT3 showed higher up-regulation under ABA treatment than under other treatments (Figure 7). OsSTP21 and OsINT2 were higher up-regulated under IAA, 6-BA, SA, and GA treatments than under ABA treatment (Figure 7). OsSTP20 showed higher up-regulation under IAA, 6-BA, and GA treatments than under ABA and SA treatments (Figure 7). OsSTP14 showed higher up-regulation under ABA, IAA, and 6-BA treatments than under SA and GA treatments. OsPLT7 were higher up-regulated under SA and GA treatments than under ABA, IAA, and 6-BA treatments (Figure 7).

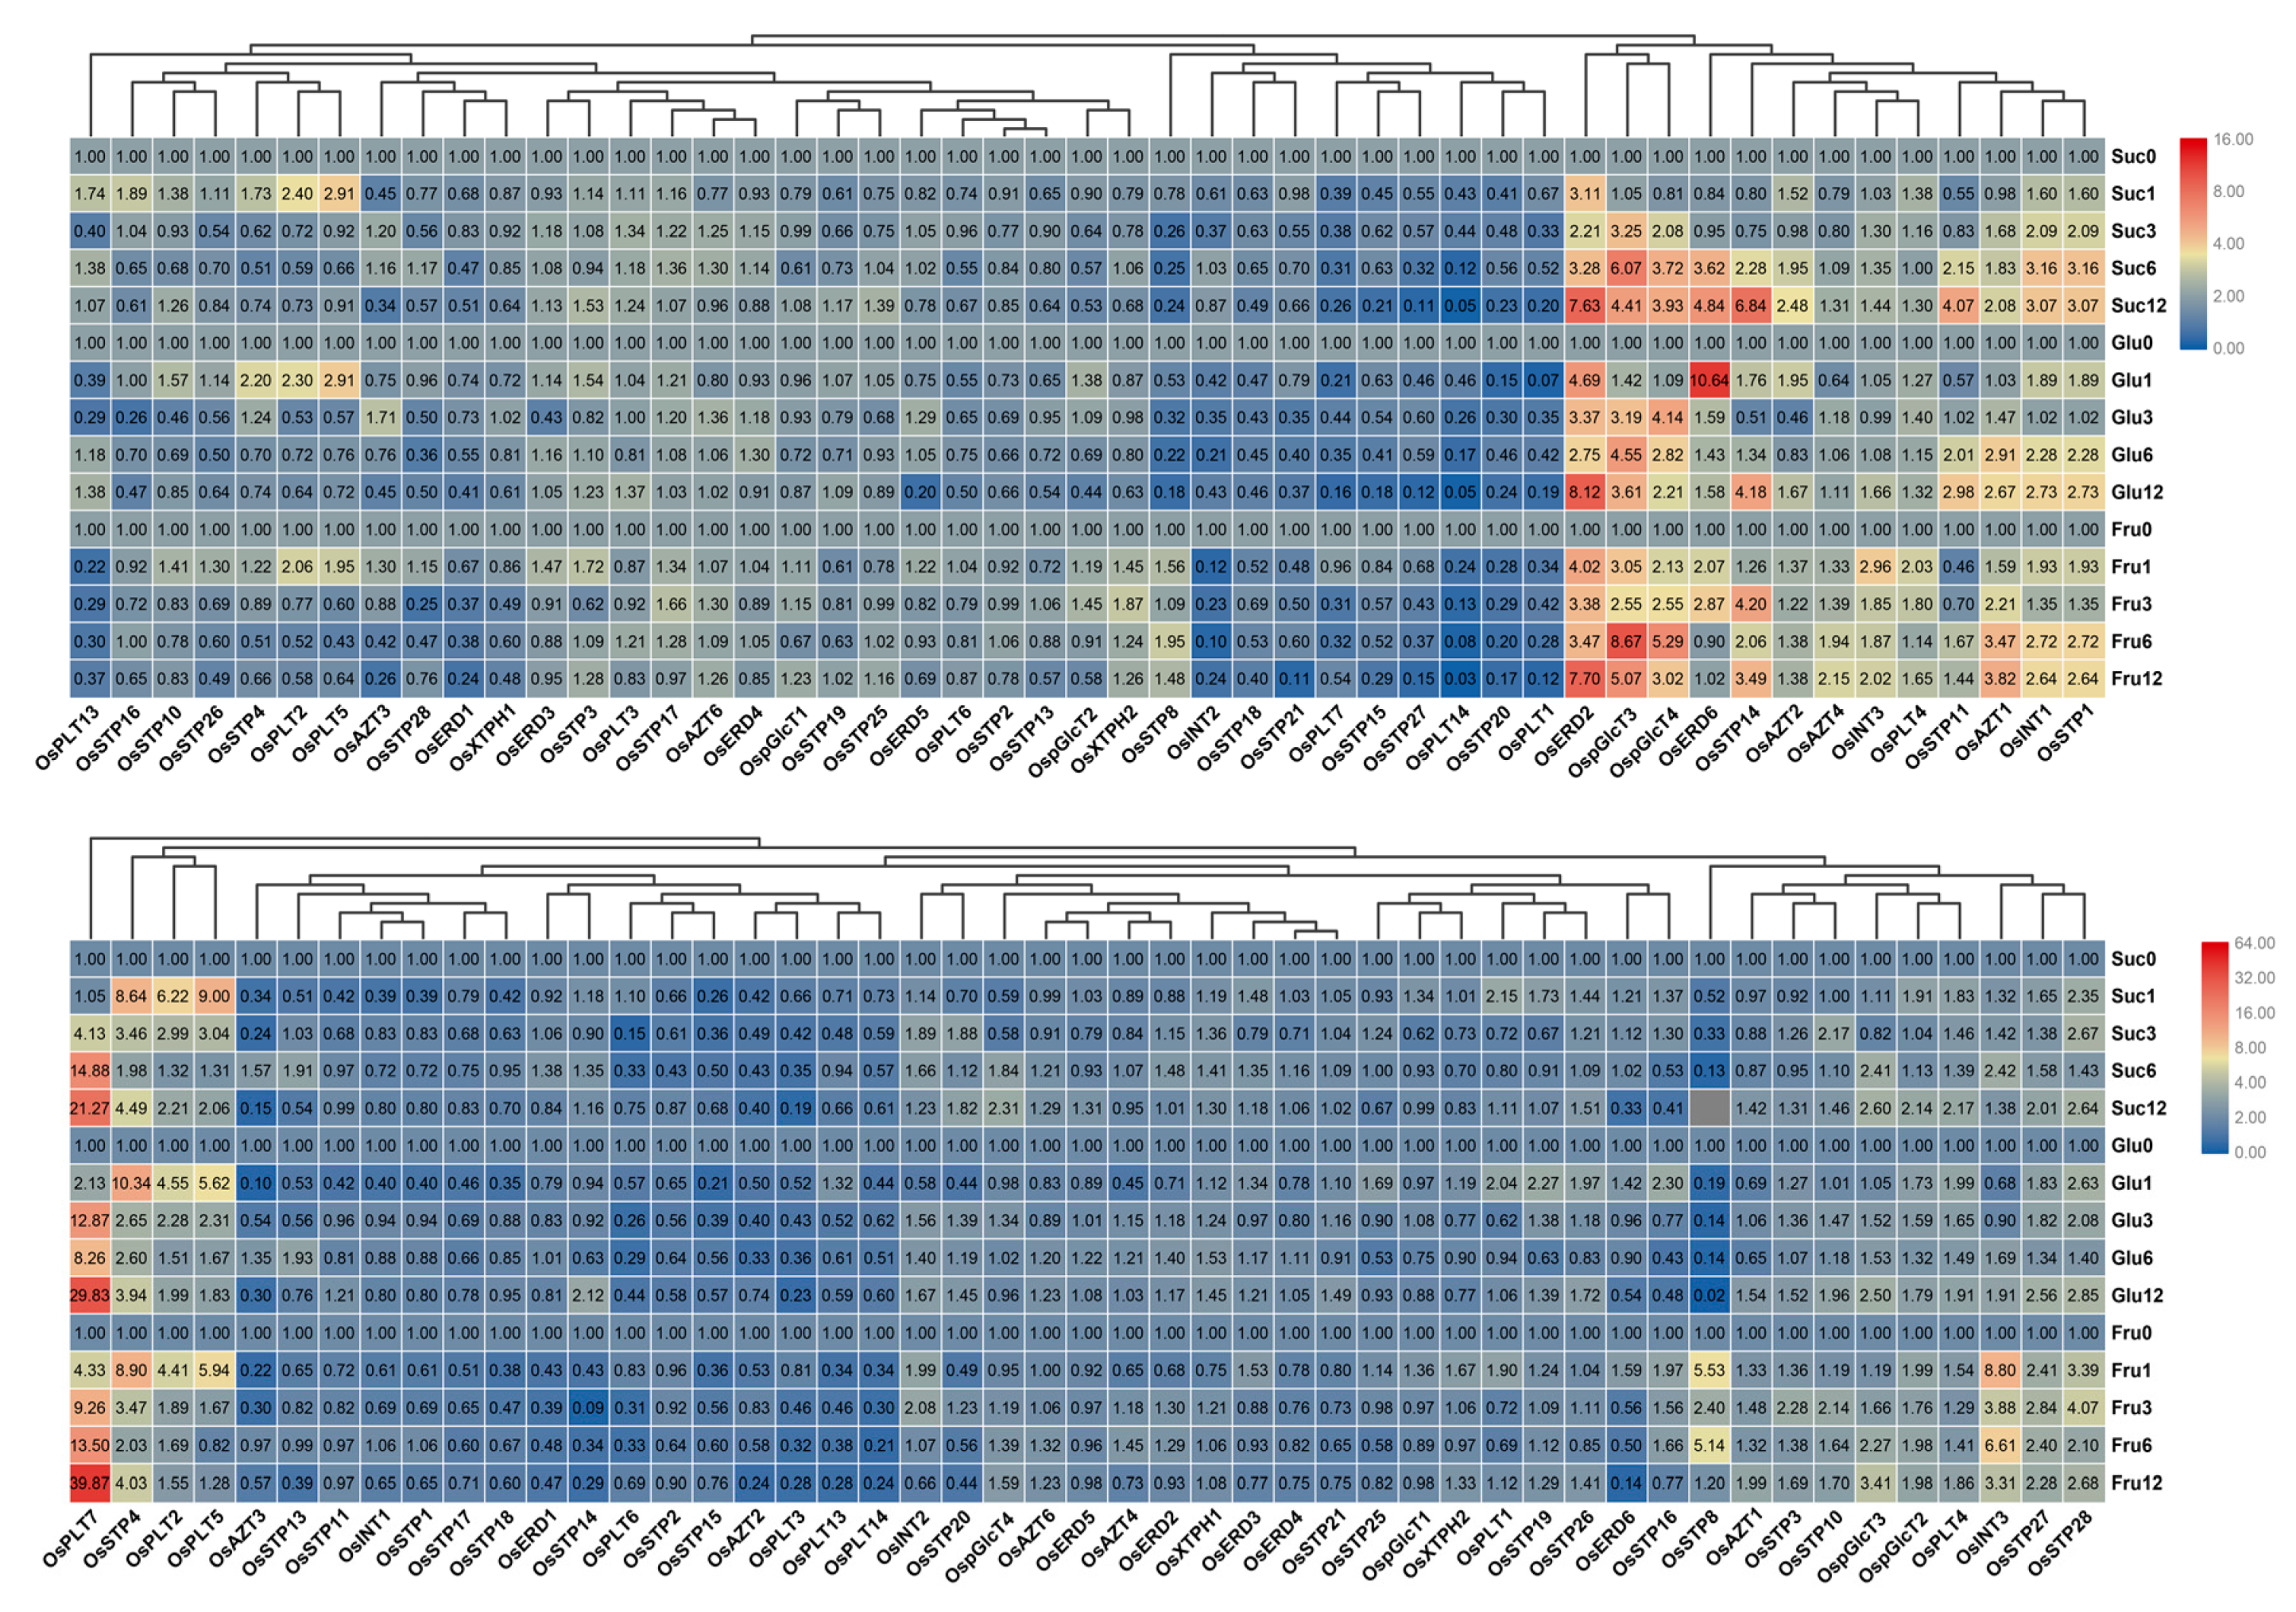
3.6. Expression Analysis of MST Genes under Sugar Treatments

Previous studies reported that MST genes are crucial for various sugar transportations [1,5,8]. We, therefore, detected expression profile of MST genes under 2% sucrose, glucose, and fructose treatments. We found that MST genes showed different expression patterns between leaf and root. In leaf, OsERD2, OspGlcT3, OspGlcT4, OsERD6, OsSTP14, OsAZT1, OsINT1, and OsSTP1 were up-regulated under sucrose, glucose, and fructose treatments. However, OsAZT2 showed higher up-regulations under sucrose treatment than under glucose and fructose treatments. OsAZT1 were higher up-regulated under sucrose and glucose treatments than under fructose treatment (Figure 8A). In root, there are lesser up-regulated genes than that in leaf (Figure 8B). OsPLT7 showed up-regulations under these three sugar treatments. OsSTP8 and OsINT3 were only up-regulated under fructose treatment.

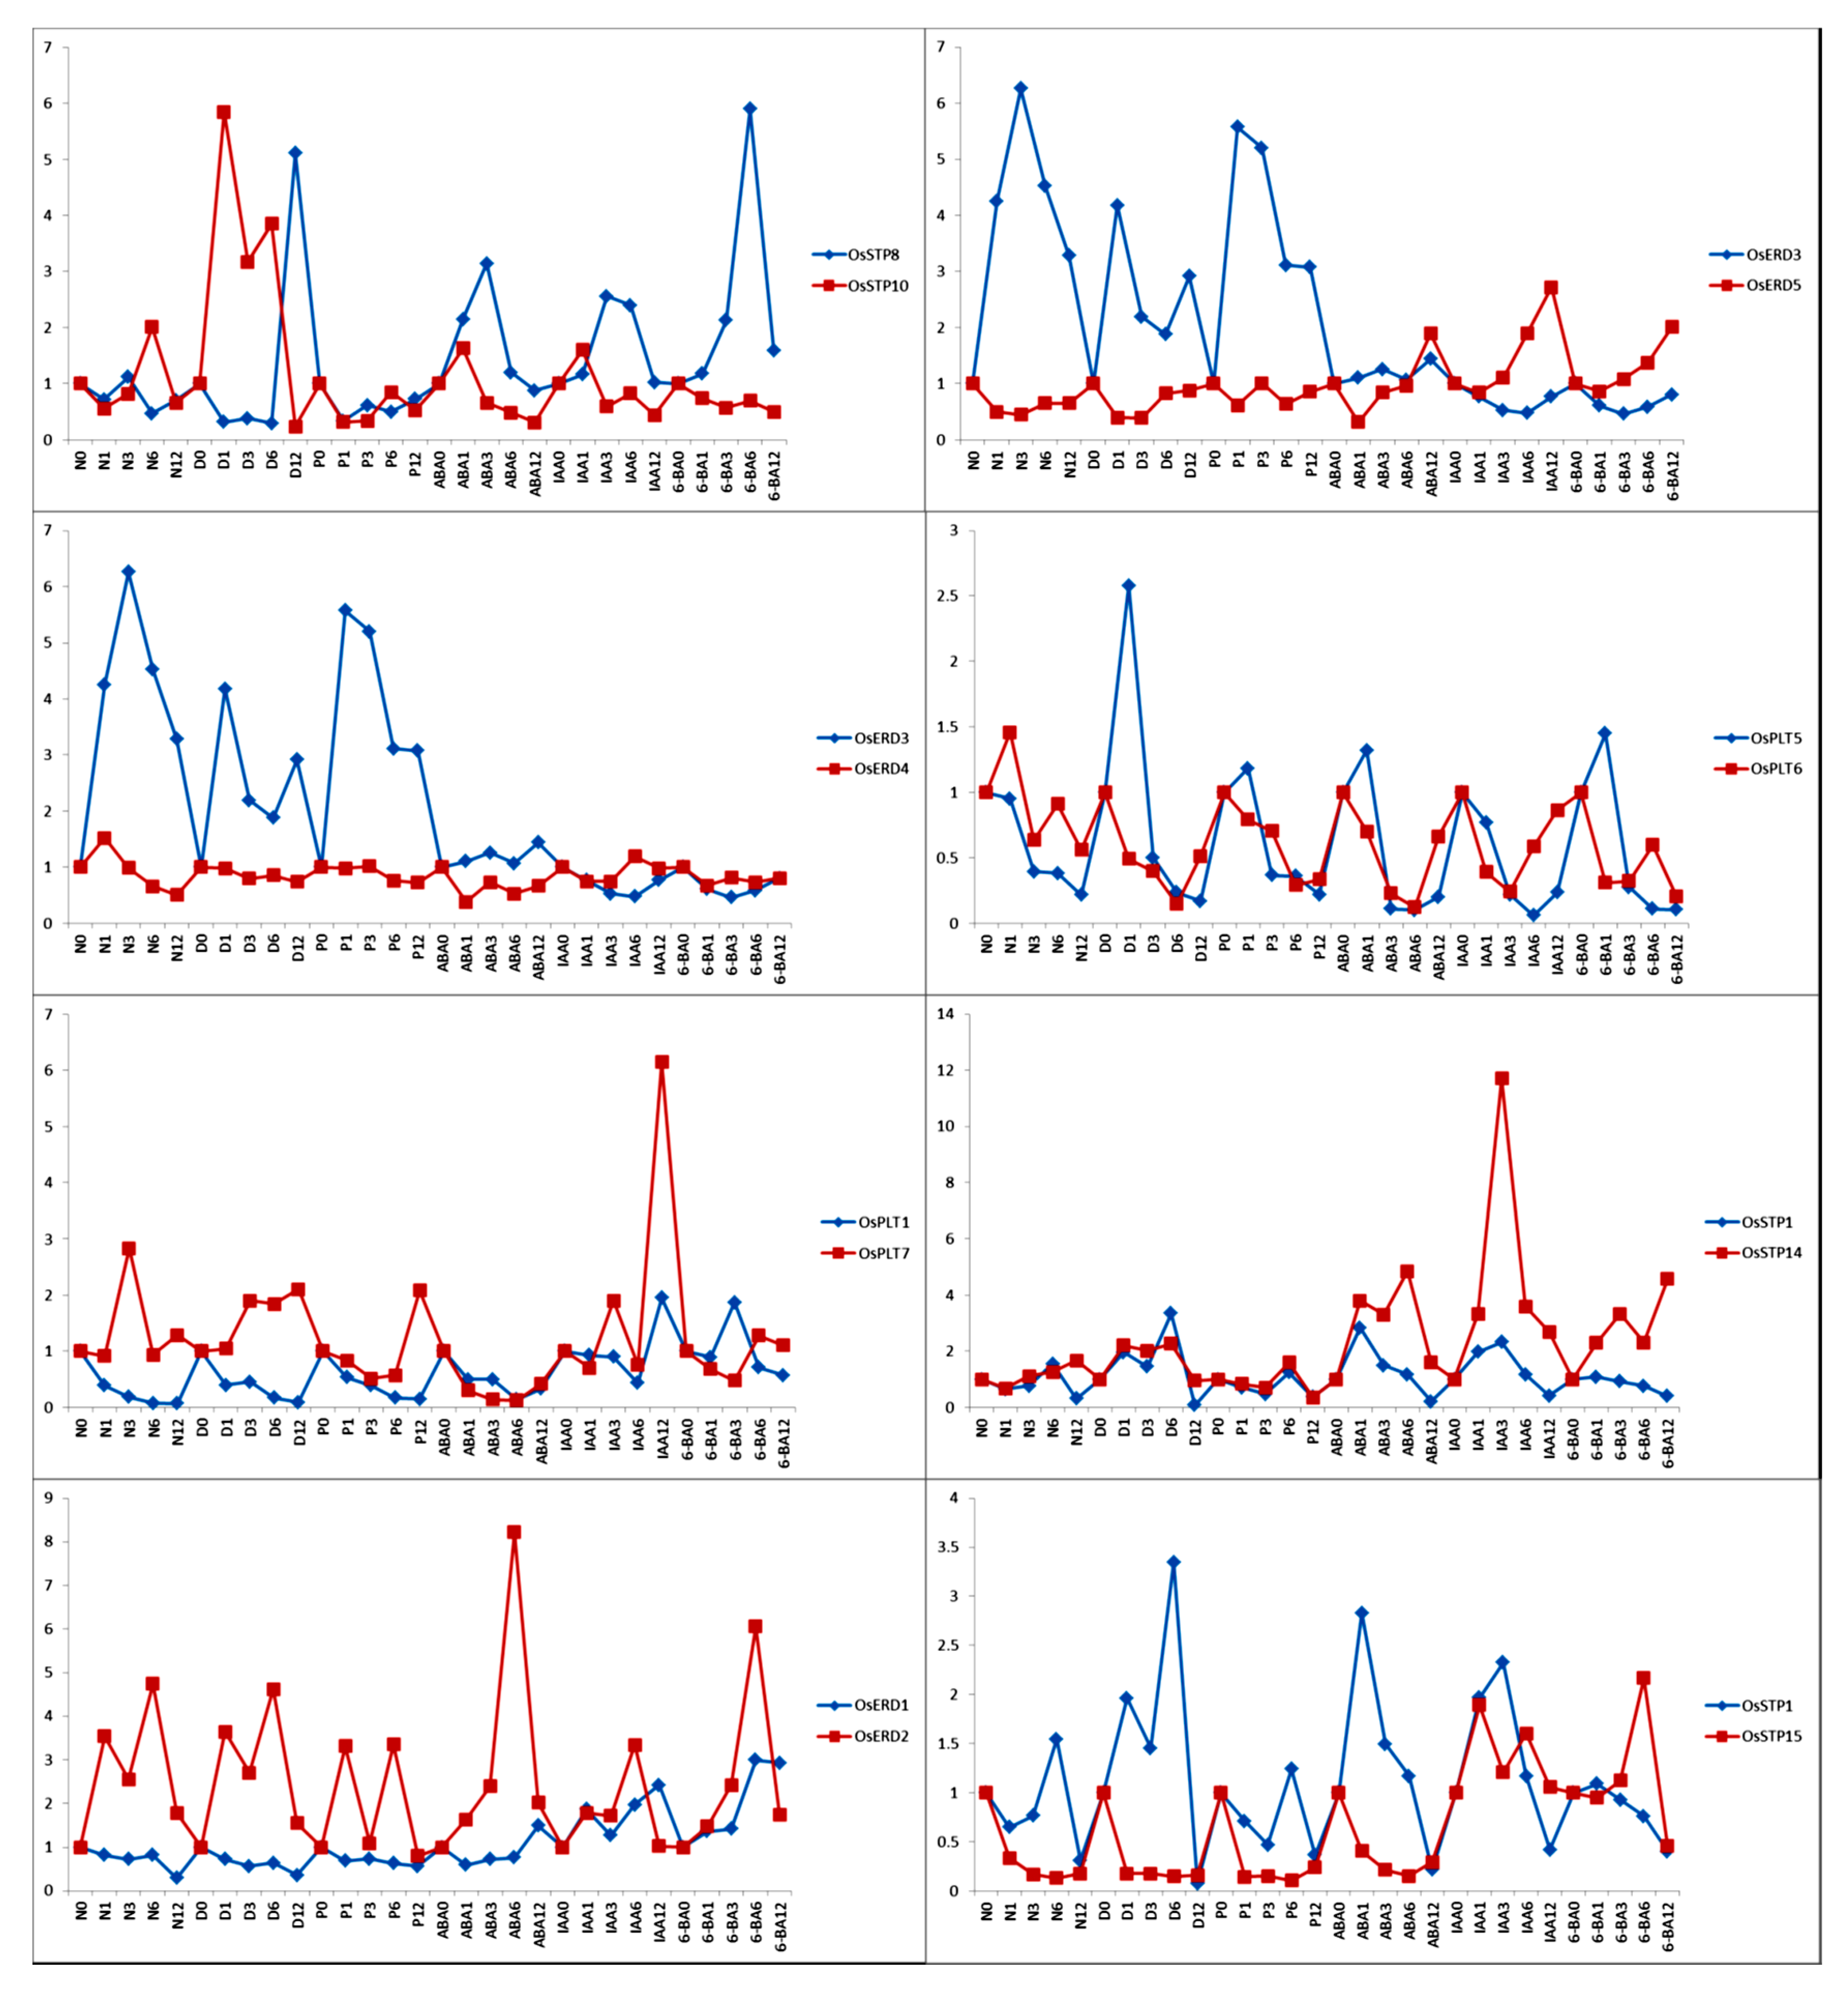
3.7. Functional Differentiation of MST Duplication Genes under Hormone Treatments and Abiotic Stress Treatments

To investigate the expression patterns of MST duplicate gene pairs and predict functional changes in these genes, we compared the expression patterns of these duplicate gene pairs under hormone treatments and abiotic stress treatments. The duplicate gene pairs are expected to show similar expression patterns [5,8,38]. However, we discovered that only one duplicate gene pair (OsSTP1 and OsSTP14) was ongoing divergent (0.42) and that the remaining duplicate gene pairs were divergent (Figure 9).

4. Discussions

In this study, our identification result of MSTs was consistent with previous Johnson’s report [19]. The rice MST gene family, which has 64 genes, is comparable to that in grape (61) [12] and cassava (64) [1], but remarkably greater than that of tomato (49) [11,14] and Arabidopsis (53) [9,10,11], and smaller than that of pear (75) [44]. The size of the MST gene family varies between different genomes in a manner independent to their evolution distances, which is the same situation in the MST subfamilies. STP subfamily was the largest subfamily (28) in rice (Figure 1 and Table 1), while it was much smaller in other genomes, such as Arabidopsis and cassava. On the other hand, ERD was the largest MST subfamily in Arabidopsis while only 6 ERD genes were found in rice (Figure 1 and Table 1) [1,9,10]. These results indicated that MST family had species-specific subfamily expansion in different plants and these expansions were driven by gene duplication events, which might play critical roles in the evolution of MST gene family [1,8,10,18,19,44].
A total of 12 duplication events of rice MSTs were found, including two segmental duplications and ten tandem duplications. However, Johnson et al. (2007) reported 13 duplication events (12 tandem duplications and one segmental duplication) [19], which was a slightly higher frequency than that in our study. This might be due to the use of different softwares and methods. In this present study, we used MCScanX software to detect duplication events, which was used to detected duplication events in the previous studies [38,45]. But our result and Johnson’s result both indicated that tandem duplication plays a more important role than segmental duplication in rice MST family expansions, especially in STP and PLT subfamilies (Figure 3). Interestingly, duplication events were only found in STP, ERD, and PLT subfamilies, which was the same in Arabidopsis [19]. Thus, we speculated these expansions of particular subfamilies may be related to the adaption to the terrestrial environment during the process of evolution. This speculation needs further to verification in future work.
The divergence times of these duplication events were estimated to be from 1.80 to 18.08 Mya (Table 2). Previous studies reported that A-genome species of the genus Oryza was completed diversification about 5 Mya [46] and the diversification of rice genus and tribe occurred about 14.1 Mya and 23.9 Mya, respectively [47]. In this study, divergence times were estimated to be 18.08 and 10.72 Mya for the two segmental duplications occurred during the evolution of MST family. In addition, the tandem duplication events detected in this study occurred in a wider range of times, 1.80–16.84 Mya. Specifically, four genes were tandemly duplicated at a <5 Mya (after the diversification of Oryza) and five genes were tandemly duplicated between the diversification of Oryza and rice genus (5 Mya < divergence time < 14.1), one was between the diversification of rice genus and tribe (14.1 < divergence time < 23.9). Based on these data, we summarized that the majority of gene duplications, including tandem duplications and segmental duplications, were produced before diversification of rice genus. During the differentiation process of rice genus, some tandem duplications and segmental duplications also played essential roles in the expansion of MST family. Notably, tandem duplications played a more important role in the recent expansion of A-genome species. Gene structure and conserved motifs of rice MST genes showed the similar characteristics with Arabidopsis, cassava, and other species (Figure 4) [1,8,10,44]. These results revealed that MST genes have conserved functions among different species. We found that the intron number of different subfamilies were different. Most MST subfamilies have 3–6 exons except the ERD and XTPH subfamilies and some pGlcT genes. A similar situation was also found in cassava and woodland strawberry [44]. These results indicated that the intron loss/gain might occur before the divergence of monocotyledon and dicotyledon.
Earlier studies proposed that surviving members of gene duplicate pairs usually evolved to neofunctionalization (NF), subfunctionalization (SF), or subneofunctionalization (SNF) [19,48]. As model-1 neofunctionalization, both duplicates retain all original functions (expressions), whereas one duplicate also gains novel functions (expressions) [19]. In this study, different expression patterns were found in all gene pairs (Figure 5). We particularly noticed that OsSTP14 and OsSTP1, which were tandem duplicated genes, showed similar expression patterns in various tissues, except OsSTP1 was highly expressed in flag leaf and leaf sheath (Figure 5), indicating OsSTP1 might be model-1 neofunctionalization. In addition, Our results revealed that significant values of most MST duplicate pairs were less than 0.3 and only one duplicate pair (OsSTP1 and OsSTP14) was more than 0.3 (Figure 9). These results suggested that most MST duplicate gene pairs had undergone functional divergence and OsSTP1 and OsSTP14 was going divergent. Our expression patterns supported Johnson et al. functional divergence results of rice MST genes that NF, SF, and SNF existed in rice MST genes.
Most MST genes showed tissue-specific expression profiles (Figure 5) except the STP and AZT subfamilies, most of which were ubiquitously expressed. And these results were consistent with previous findings on other species [1,8,10,45]. OsSTP3 (OsMST3) was the first characterized MST gene in rice. Toyofuku et al. (2000) reported that OsSTP3 was expressed in leaf blades, leaf sheaths and especially high in calli and roots and that OsMST3 was responsible for the accumulation of monosaccharides required for cell wall synthesis [10]. We confirmed its expression in roots and shoots but not in calli, which may be because of the different types of the callus samples. They also reported the characterization of OsSTP1 (OsMST1) and OsSTP2 (OsMST2), which showed no and low D-glucose transport activity, respectively [10]. However, OsSTP1 was significantly responded in shoots to glucose, fructose and sucrose treatment, which suggested OsSTP1 might play a role in other sugars transportation. OsSTP4 (OsMST4) was a ubiquitous expressed gene with high expression in sink leaf blade, leaf sheath and embryo and OsSTP4 could transport fructose and mannose as well as glucose and galactose [19]. However, OsSTP4 was relatively low expressed in all tested tissues in our study but highly responded to abiotic stresses and sugar treatments very rapidly, which indicated that OsSTP4 might not be involved in the routine work but in the response to environment change. OsSTP8 (OsMST8) was another low expressed gene in our results but was proved to be very important for the pollen development [49,50]. What’s more, OsSTP8 was believed to be responded to fructose but its transport activities need further test. Besides, OsSTP8 was also induced by different hormone treatments in our results and by cold in previous study [50], suggesting OsSTP8 might also be an important emergency response gene. OsSTP13 was highly expressed in roots and responded to hormone treatments. OsSTP27 was highly expressed in shoots and responded to sugar treatments. They showed different expression patterns from their homologs in Arabidopsis, AtSTP3, which was mainly expressed in leaves and characterized as a H+ symporter [51]. OsSTP10 and OsSTP14 showed similar expressed patterns and highly response to drought stress, but they showed different response to hormone and sugar treatments. OsSTP10 did not respond to hormone treatments and was induced in sucrose and fructose treatments in roots. OsSTP14 responded to ABA, IAA, and 6-BA and was strongly induced in sugar treatments in shoots. OsSTP16 was mainly expressed in flag leaf sheath and was rapidly responded to glucose and fructose treatments. However, their homologs in Arabidopsis, AtSTP5, did not show any monosaccharides transport activities in yeast [10]. Whether OsSTP10, OsSTP14 and OsSTP16 got transport activities towards monosaccharides needs further study. The STP subfamily expanded significantly in rice compared to Arabidopsis [18]. The different expression patterns of STP subfamily between species suggested different roles in growth and development, so the OsSTP subfamily needs further work to elucidate their function. The reports on other subfamilies were even less in rice. In previous study, OsAZT4 (OsTMT1) was a ubiquitous expressed gene and OsAZT1 (OsTMT2) showed a similar expression pattern with OsAZT4 [2]. Our results confirmed these results but OsAZT1 (OsTMT2) showed more redundancy in flag leaf and flag leaf sheath than OsAZT4 in our study (Figure 5). OsAZT1 was induced by fructose treatment in shoots, which was consistent with its transport activities towards glucose and fructose [2]. What’s more, OsAZT1 was strongly induced by sugar and 6-BA treatments, which suggested an important role of OsAZT1 in sugar transport in flag leaf and flag leaf sheath. Besides, OsAZT2 was strongly expressed in seedlings, indicating its role in early growth and development. Regarding to the pGlcT subfamily, OspGlcT2 (OsGMST1) was a ubiquitous expressed gene with strong response to sugar and salt treatments in our study, which supported its role in tolerance to salt stress [31]. Until now, there are still no reports about PLT, INT, XTPH and ERD subfamilies in rice. The studies in Arabidopsis set good examples for the studies in rice. However, even with the closest homologues in the same species, the expression patterns and functions may differ, not to mention that in the different species. The expression results of MST genes in this study provided some important messages for the future functional analysis.

5. Conclusions

In our study, a systematic investigation of the OsMST gene family including genome-wide identification, phylogenetic reconstruction, chromosome localization, gene structure analysis, gene duplication events, and Ka/Ks ratios of duplicate gene pairs, was performed. A total of 12 duplicate gene pairs were identified and generated from two segmental duplication and ten tandem duplication events in different evolutionary time points. The qRT-PCR results showed that these duplicate gene pairs have undergone functional divergence. Some MST genes showed upregulation under different abiotic stresses, indicating that these genes may play important roles in abiotic stresses. Among these, OsERD3 and OsSTP3 could serve as good candidate genes for improving various stresses tolerance of rice through genetic engineering technologies. In addition, several MST genes were found to respond to different hormone treatments. This work may offer a preliminary insight into the functional variations that have occurred during the evolution of the MST gene family.

Supplementary Materials

The following are available online at https://0-www-mdpi-com.brum.beds.ac.uk/2073-4425/10/3/239/s1, Table S1: Primers of MST genes for qRT-PCR in this study. Figure S1. The Maximum Likelihood (ML) tree for MST genes in rice.

Author Contributions

X.D. performed all of the experiments, analyzed the data, prepared the figures and tables and wrote the paper. B.A. and Y.L. conceived and designed the experiments. B.A. performed parts of the experiments. H.Z. prepared parts of the figures or tables. J.Y. guided parts of the experiments. B.A. and W.K. thoroughly revised the manuscript. All authors read and approved the final version of the manuscript.

Funding

This study was funded by the National Special Key Project for Transgenic Breeding (Grant No. 2016ZX08001001), the National Key Research and Development Program of China (2016YFD0100400).

Acknowledgments

The authors thank the anonymous referees whose constructive comments were helpful in improving the quality of this work.

Conflicts of Interest

The authors declare that they have no competing interests for this research.

References

  1. Liu, Q.; Dang, H.; Chen, Z.; Wu, J.; Chen, Y.; Chen, S.; Luo, L. Genome-wide identification, expression, and functional analysis of the sugar transporter gene family in cassava (Manihot esculenta). Int. J. Mol. Sci. 2018, 19, 987. [Google Scholar] [CrossRef] [PubMed]
  2. Jung-Il, C.; Bo, B.; Dae-Woo, L.; Nayeon, R.; Soon-Kwan, H.; Hyun-Bi, K.; Joon-Seob, E.; Sang-Bong, C.; Man-Ho, C.; Seong Hee, B. Expression analysis and functional characterization of the monosaccharide transporters, OsTMTs, involving vacuolar sugar transport in rice (Oryza sativa). New Phytol. 2010, 186, 657–668. [Google Scholar]
  3. Tian, L.; Liu, L.; Yin, Y.; Huang, M.; Chen, Y.; Xu, X.; Wu, P.; Li, M.; Wu, G.; Jiang, H. Heterogeneity in the expression and subcellular localization of POLYOL/MONOSACCHARIDE Transporter genes in Lotus japonicus. PLoS ONE 2017, 12, e0185269. [Google Scholar] [CrossRef] [PubMed]
  4. Rottmann, T.M.; Klebl, F.; Schneider, S.; Kischka, D.; Rüscher, D.; Sauer, N.; Stadler, R. Characterization of three sugar transporters, STP7, STP8 and STP12. Plant Physiol. 2018, 176, 2330–2350. [Google Scholar] [CrossRef]
  5. Julius, B.T.; Leach, K.A.; Tran, T.M.; Mertz, R.A.; Braun, D.M. Sugar transporters in plants: New insights and discoveries. Plant Cell Physiol. 2017, 58, 1442. [Google Scholar] [CrossRef]
  6. Zheng, Q.M.; Tang, Z.; Xu, Q.; Deng, X.X. Isolation, phylogenetic relationship and expression profiling of sugar transporter genes in sweet orange (Citrus sinensis). Plant Cell Tissue Org. 2014, 119, 609–624. [Google Scholar] [CrossRef]
  7. Klemens, P.A.W.; Kathrin, P.; Joachim, D.; Lara, S.; Rozenn, L.H.; Catherine, B.; Magali, B.; Fabien, C.; Anne, K.; Ekkehard, N. Overexpression of the vacuolar sugar carrier AtSWEET16 modifies germination, growth, and stress tolerance in Arabidopsis. Plant Physiol. 2013, 163, 1338–1352. [Google Scholar] [CrossRef]
  8. Zhang, W.; Wang, S.; Yu, F.; Tang, J.; Yu, L.; Wang, H.; Li, J. Genome-wide identification and expression profiling of sugar transporter protein (STP) family genes in cabbage (Brassica oleracea var. capitata L.) reveals their involvement in clubroot disease responses. Genes 2019, 10, 71. [Google Scholar] [CrossRef]
  9. Buttner, M. The monosaccharide transporter(-like) gene family in Arabidopsis. FEBS Lett. 2007, 581, 2318–2324. [Google Scholar] [CrossRef]
  10. Buttner, M. The Arabidopsis sugar transporter (AtSTP) family: An update. Plant Biol. 2010, 12, 35–41. [Google Scholar] [CrossRef]
  11. Alexandra, W.; Oliver, T.; Ingmar, F.; Christian, L.; Joachim, T.; Stefan, M.; Ulrike, S.; Enrico, M.; H Ekkehard, N. Molecular identification and physiological characterization of a novel monosaccharide transporter from Arabidopsis involved in vacuolar sugar transport. Plant Cell 2006, 18, 3476–3490. [Google Scholar]
  12. Afoufa-Bastien, D.; Medici, A.; Jeauffre, J.; Coutos-Thévenot, P.; Lemoine, R.; Atanassova, R.; Laloi, M. The Vitis vinifera sugar transporter gene family: Phylogenetic overview and macroarray expression profiling. BMC Plant Biol. 2010, 10, 245. [Google Scholar] [CrossRef] [PubMed]
  13. Emiko, O.K.; Takumi, H.; Yukio, K.; Natsumaro, K.; Junji, Y.; Seiichiro, H. Sucrose transporter NtSUT4 from tobacco BY-2 involved in plant cell shape during miniprotoplast culture. J. Plant Res. 2011, 124, 395–403. [Google Scholar]
  14. Mccurdy, D.W.; Dibley, S.; Cahyanegara, R.; Martin, A.; Patrick, J.W. Functional characterization and RNAi-mediated suppression reveals roles for hexose transporters in sugar accumulation by tomato fruit. Mol. Plant 2010, 3, 1049–1063. [Google Scholar] [CrossRef] [PubMed]
  15. Aleksandra, H.; Nicolas, S.; Fernando, C.; Fernie, A.R.; Bernhard, G.; Christina, K. Sucrose transporter LeSUT1 and LeSUT2 inhibition affects tomato fruit development in different ways. Plant J. 2006, 45, 180–192. [Google Scholar]
  16. Doidy, J.; van Tuinen, D.; Lamotte, O.; Corneillat, M.; Alcaraz, G.; Wipf, D. The Medicago truncatula sucrose transporter family: Characterization and implication of key members in carbon partitioning towards arbuscular mycorrhizal fungi. Mol. Plant 2012, 5, 1346–1358. [Google Scholar] [CrossRef] [PubMed]
  17. Laloi, M. Regulation of RhSUC2, a sucrose transporter, is correlated with the light control of bud burst in Rosa sp. Plant Cell Environ. 2011, 34, 1776–1789. [Google Scholar]
  18. Johnson, D.A.; Hill, J.P.; Thomas, M.A. The monosaccharide transporter gene family in land plants is ancient and shows differential subfamily expression and expansion across lineages. BMC Evol. Biol. 2006, 6, 64. [Google Scholar]
  19. Johnson, D.A.; Thomas, M.A. The monosaccharide transporter gene family in Arabidopsis and rice: A history of duplications, adaptive evolution, and functional divergence. Mol. Biol. Evol. 2007, 24, 2412–2423. [Google Scholar] [CrossRef]
  20. Wang, Y.; Xu, H.; Wei, X.; Chai, C.; Xiao, Y.; Zhang, Y.; Chen, B.; Xiao, G.; Ouwerkerk, P.B.; Wang, M.; et al. Molecular cloning and expression analysis of a monosaccharide transporter gene OsMST4 from rice (Oryza sativa L.). Plant Mol. Biol. 2007, 65, 439–451. [Google Scholar] [CrossRef]
  21. Schneider, S.; Beyhl, D.; Hedrich, R.N. Functional and physiological characterization of Arabidopsis INOSITOL TRANSPORTER1, a novel tonoplast-localized transporter for myo-inositol. Plant Cell 2008, 20, 1073–1087. [Google Scholar] [CrossRef]
  22. Poschet, G.; Hannich, B.; Büttner, M. Identification and characterization of AtSTP14, a novel galactose transporter from Arabidopsis. Plant Cell Physiol. 2010, 51, 1571. [Google Scholar] [CrossRef]
  23. Yvonne-Simone, K.; Dietmar, G.; Ruth, S.; Franz, K.; Lucie, L.A.; Rémi, L.; Rainer, H.; Norbert, S. Arabidopsis POLYOL TRANSPORTER5, a new member of the monosaccharide transporter-like superfamily, mediates H+-Symport of numerous substrates, including myo-inositol, glycerol, and ribose. Plant Cell 2005, 17, 204–218. [Google Scholar]
  24. Klepek, Y.S.; Volke, M.; Kai, R.K.; Wippel, K.; Hoth, S.; Hedrich, R.; Sauer, N. Arabidopsis thaliana POLYOL/MONOSACCHARIDE TRANSPORTERS 1 and 2: Fructose and xylitol/H+ symporters in pollen and young xylem cells. J. Exp. Bot. 2010, 61, 537–550. [Google Scholar] [CrossRef]
  25. Schulz, A.; Beyhl, D.; Marten, I.; Wormit, A.; Neuhaus, E.; Poschet, G.; Büttner, M.; Schneider, S.; Sauer, N.; Hedrich, R. Proton-driven sucrose symport and antiport are provided by the vacuolar transporters SUC4 and TMT1/2. Plant J. 2011, 68, 129–136. [Google Scholar] [CrossRef] [PubMed]
  26. Man-Ho, C.; Hyemin, L.; Ho, S.D.; Jong-Seong, J.; Seong Hee, B.; Youn-Il, P.; Tae-Ryong, H. Role of the plastidic glucose translocator in the export of starch degradation products from the chloroplasts in Arabidopsis thaliana. New Phytol. 2011, 190, 101–112. [Google Scholar]
  27. Quirino, B.F.; Reiter, W.D.; Amasino, R.D. One of two tandem Arabidopsis genes homologous to monosaccharide transporters is senescence-associated. Plant Mol. Biol. 2001, 46, 447–457. [Google Scholar] [CrossRef]
  28. Kohji, Y.; Yuriko, O.; Junya, M.; Kazuo, N.; Yasunari, F.; Kazuo, S.; Kazuko, Y.S. Functional analysis of an Arabidopsis thaliana abiotic stress-inducible facilitated diffusion transporter for monosaccharides. J. Biol. Chem. 2010, 285, 1138–1146. [Google Scholar]
  29. Toyofuku, K.; Kasahara, M.; Yamaguchi, J. Characterization and expression of monosaccharide transporters (OsMSTs) in rice. Plant Cell Physiol. 2000, 41, 940–947. [Google Scholar] [CrossRef] [PubMed]
  30. Budsaraporn, N.; Anna, S.; Taito, T.; Kyoko, T.; Jarunya, N.; Akira, I.; Junji, Y. Characterization of rice functional monosaccharide transporter, OsMST5. Biosci. Biotech. Biochem. 2003, 67, 556–562. [Google Scholar]
  31. Yongqin, W.; Yuguo, X.; Yu, Z.; Chenglin, C.; Gang, W.; Xiaoli, W.; Honglin, X.; Mei, W.; Ouwerkerk, P.B.F.; Zhen, Z. Molecular cloning, functional characterization and expression analysis of a novel monosaccharide transporter gene OsMST6 from rice (Oryza sativa L.). Planta 2008, 228, 525–535. [Google Scholar]
  32. Cao, H.; Guo, S.; Xu, Y.; Jiang, K.; Jones, A.M.; Chong, K. Reduced expression of a gene encoding a Golgi localized monosaccharide transporter (OsGMST1) confers hypersensitivity to salt in rice (Oryza sativa). J. Exp. Bot. 2011, 62, 4595–4604. [Google Scholar] [CrossRef]
  33. An, B.; Lan, J.; Deng, X.; Chen, S.; Ouyang, C.; Shi, H.; Yang, J.; Li, Y. Silencing of D-Lactate Dehydrogenase Impedes Glyoxalase System and Leads to Methylglyoxal Accumulation and Growth Inhibition in Rice. Front. Plant Sci. 2017, 8, 2071. [Google Scholar] [CrossRef] [PubMed]
  34. Kong, W.; Yang, S.; Wang, Y.; Bendahmane, M.; Fu, X. Genome-wide identification and characterization of aquaporin gene family in Beta vulgaris. PeerJ 2017, 5, e3747. [Google Scholar] [CrossRef] [PubMed]
  35. Kong, W.; Bendahmane, M.; Fu, X. Genome-wide identification and characterization of aquaporins and their role in the flower opening processes in carnation (Dianthus caryophyllus). Molecules 2018, 23, 1895. [Google Scholar] [CrossRef] [PubMed]
  36. Kumar, S.; Tamura, K.; Jakobsen, I.B.; Nei, M. MEGA2: Molecular evolutionary genetics analysis software. Bioinformatics 2001, 19, 1244–1245. [Google Scholar] [CrossRef]
  37. Chen, C.; Xia, R.; Chen, H.; He, Y. TBtools, a Toolkit for Biologists integrating various HTS-data handling tools with a user-friendly interface. BioRxiv 2018, 289660. [Google Scholar] [CrossRef]
  38. Kong, W.; Zhong, H.; Deng, X.; Gautam, M.; Gong, Z.; Zhang, Y.; Zhao, G.; Liu, C.; Li, Y. Evolutionary analysis of GH3 genes in six Oryza species/subspecies and their expression under salinity stress in Oryza sativa ssp. japonica. Plants 2019, 8, 30. [Google Scholar] [CrossRef] [PubMed]
  39. Krzywinski, M.; Schein, J.I. Circos: An information aesthetic for comparative genomics. Genome Res. 2009, 19, 1639–1645. [Google Scholar] [CrossRef]
  40. Librado, P.; Rozas, J. DnaSP v5: A software for comprehensive analysis of DNA polymorphism data. Bioinformatics 2009, 1451–1452. [Google Scholar] [CrossRef]
  41. Kong, W.; Zhong, H.; Gong, Z.; Fang, X.; Sun, T.; Deng, X.; Li, Y. Meta-analysis of salt stress transcriptome responses in different rice genotypes at the seedling stage. Plants 2019, 8, 64. [Google Scholar] [CrossRef]
  42. Blanc, G.; Wolfe, K.H. Widespread paleopolyploidy in model plant species inferred from age distributions of duplicate genes. Plant Cell 2004, 16, 1667–1678. [Google Scholar] [CrossRef]
  43. Yim, W.C.; Lee, B.M.; Jang, C.S. Expression diversity and evolutionary dynamics of rice duplicate genes. Mol. Genet. Genom. 2009, 281, 483–493. [Google Scholar] [CrossRef]
  44. Li, J.-M.; Zheng, D.-M.; Li, L.-T.; Qiao, X.; Wei, S.-W.; Bai, B.; Zhang, S.-L.; Wu, J. Genome-wide function, evolutionary characterization and expression analysis of sugar transporter family genes in pear (Pyrus bretschneideri Rehd). Plant Cell Physiol. 2015, 56, 1721–1737. [Google Scholar] [CrossRef]
  45. Yupeng, W.; Haibao, T.; Debarry, J.D.; Xu, T.; Jingping, L.; Xiyin, W.; Tae-Ho, L.; Huizhe, J.; Barry, M.; Hui, G. MCScanX: A toolkit for detection and evolutionary analysis of gene synteny and collinearity. Nucleic Acids Res. 2012, 40, e49. [Google Scholar]
  46. Qihui, Z.; Song, G. Phylogenetic relationships among A-genome species of the genus Oryza revealed by intron sequences of four nuclear genes. New Phytol. 2005, 167, 249–265. [Google Scholar]
  47. Tang, L.; Zou, X.H.; Achoundong, G.; Potgieter, C.; Second, G.; Zhang, D.Y.; Ge, S. Phylogeny and biogeography of the rice tribe (Oryzeae): Evidence from combined analysis of 20 chloroplast fragments. Mol. Phylogenet. Evol. 2010, 54, 266–277. [Google Scholar] [CrossRef]
  48. Xionglei, H.; Jianzhi, Z. Rapid subfunctionalization accompanied by prolonged and substantial neofunctionalization in duplicate gene evolution. Genetics 2005, 169, 1157–1164. [Google Scholar]
  49. Hui, Z.; Wanqi, L.; Xijia, Y.; Xue, L.; Ning, J.; Hong, M.; Dabing, Z. Carbon starved anther encodes a MYB domain protein that regulates sugar partitioning required for rice pollen development. Plant Cell 2010, 22, 672–689. [Google Scholar]
  50. Mamun, E.A.; Alfred, S.; Cantrill, L.C.; Overall, R.L.; Sutton, B.G. Effects of chilling on male gametophyte development in rice. Cell Biol. Int. 2006, 30, 583–591. [Google Scholar] [CrossRef]
  51. Buttner, M.E.; Baier, K.; Scholz, S.J.; Sontheim, M.; Lauterbach, C.; Var, H.; Sauer, N. AtSTP3, a green leaf-specific, low affinity monosaccharide-H+ symporter of Arabidopsis thaliana. Plant Cell Environ. 2010, 23, 175–184. [Google Scholar] [CrossRef]
Figure 1. Phylogenetic tree of the monosaccharide transporter (MST) protein sequences in rice. Multiple sequence alignment is conducted by ClustalW. Phylogenetic tree is established by Neighbor-Joining (NJ) clustering method, with 1000 Bootstrap replicates, using MEGA 6.0 software (The Pennsylvania State University, PA, USA). Different colors of arcs indicate different subfamilies.
Genes 10 00239 g001
Figure 2. Chromosomal locations of the monosaccharide transporter (MST) genes. (A) Different colors of genes represent the members from different subfamilies. (B) Pie charts of different sizes indicate the ratio of each subfamily. (C) Pie charts of different sizes indicate the ratio of each chromosome.
Genes 10 00239 g002
Figure 3. Duplication events of the monosaccharide transporter (MST) genes in rice. Different colors of genes represent the members from different subfamilies. The duplicate gene pairs of WGD or segmental/tandem events are shown with blue/red lines.
Genes 10 00239 g003
Figure 4. Phylogenetic tree (A), exon/intron structure (B), and motif compositions (C) of the monosaccharide transporter (MST) genes in rice. A: The Neighbor-Joining (NJ)-Phylogenetic trees are made in the same method with Figure 1B,C: The widths of grey bars at the bottom display relative lengths of genes and proteins. Green boxes and grey lines in B represent exons and introns, respectively. Different boxes in C represent different motifs.
Genes 10 00239 g004
Figure 5. Expression profiles of the MST genes in 11 different tissues by qRT-PCR. Cal: calli from 30 days before subculture; GS: grouting seed at 12–15 days after flowering; Rt: root of 12 days old seedlings; Sh: shoot of 12 days old seedlings; FL: flag leaf at 1 week after heading; SL: unexpanded flag leaves harvested approximately 3 weeks before heading; SinkFLS: flag leaf sheaths harvested from plants 1 week before heading; SourceFLS: flag leaf sheaths harvested from plants 1 week after heading; Nd: the first node on the top at panicle stage; InterN: internode, part between the first node and the second node on the top at panicle stage; Pan5: the length of 5 cm of panicle. The color scale represents relative expression levels based on the 2−ΔΔCT method: red indicates a high level and green represents a low level of transcript abundance.
Genes 10 00239 g005
Figure 6. Expression changes of the MST genes under three abiotic stresses by qRT-PCR. N0, N1, N3, N6, and N12 represent 0 h, 1 h, 3 h, 6 h, and 12 h after 200 mM NaCl solution treatment. D0, D1, D3, D6, and D12 represent 0 h, 1 h, 3 h, 6 h, and 12 h after roots exposed to the air. P0, P1, P3, P6, and P12 represent 0 h, 1 h, 3 h, 6 h, and 12 h after 20% PEG6000 solution treatment. The fold values were calculated by the 2−ΔΔCT method. The heat map was made based on the fold changes. The color scale represents fold changes: red indicates high up-regulation and green represents low up-regulation.
Genes 10 00239 g006
Figure 7. Expression changes of the MST genes under ABA, IAA, 6-BA, SA, and GA treatments by qRT-PCR. 0, 1, 3, 6, 12 represents 0 h, 1 h, 3 h, 6 h, and 12 h after hormone treatment. The fold values were calculated by the 2−ΔΔCT method. The heat map was made based on the fold changes. The color scale represents fold changes with red indicating high and green indicating low up-regulation.
Genes 10 00239 g007
Figure 8. Expression changes of the MST genes in leaf (A) and root (B) under sucrose, glucose, and fructose treatments by qRT-PCR. 0, 1, 3, 6, 12 represents 0 h, 1 h, 3 h, 6 h, and 12 h after hormone treatment. The fold values were calculated by the 2−ΔΔCT method. The heat map was made based on the fold values. The color scale at the right of each small image represents fold values: red indicates high up-regulation and green represents low up-regulation.
Genes 10 00239 g008
Figure 9. Expression patterns comparison of MST duplicate genes under hormone treatments and abiotic stress treatments. X-axis represents the various points from different treatments. Y-axis on the left indicates the relative values by qRT-PCR. Red numbers represent significant values.
Genes 10 00239 g009
Table 1. The detailed information on rice monosaccharide transporter (MST) genes.
NameTIGR Locus TagRAP-DBMST Subfamily
OsAZT1LOC_Os02g13560.1Os02g0229400AZT
OsAZT2LOC_Os02g58530.1Os02g0832100AZT
OsAZT3LOC_Os03g03680.1Os03g0128900AZT
OsAZT4LOC_Os10g39440.2Os10g0539900AZT
OsAZT5LOC_Os11g28610.1Os11g0475600AZT
OsAZT6LOC_Os11g40540.2Os11g0620400AZT
OsERD1LOC_Os03g24860.1Os03g0363500ERD
OsERD2LOC_Os03g24870.1Os03g0363600ERD
OsERD3LOC_Os05g49260.1Os05g0567700ERD
OsERD4LOC_Os05g49270.1Os05g0567800ERD
OsERD5LOC_Os05g50280.1Os05g0579000ERD
OsERD6LOC_Os11g42430.1Os11g0643800ERD
OsINT1LOC_Os04g41460.1Os04g0491700INT
OsINT2LOC_Os07g05640.1Os07g0151200INT
OsINT3LOC_Os04g43210.1Os04g0511400INT
OsSTP1LOC_Os04g37980.1Os04g0452700STP
OsSTP10LOC_Os02g36414.1Os02g0573500STP
OsSTP11LOC_Os02g36440.1Os02g0574000STP
OsSTP12LOC_Os02g36450.1Os02g0574100STP
OsSTP13LOC_Os03g01170.1Os03g0101300STP
OsSTP14LOC_Os04g37970.1Os04g0452600STP
OsSTP15LOC_Os04g37990.1Os04g0453200STP
OsSTP16LOC_Os04g38010.1Os04g0453300STP
OsSTP17LOC_Os04g38026.1Os04g0453400STP
OsSTP18LOC_Os04g38220.1Os04g0454200STP
OsSTP19LOC_Os06g04900.1Os06g0141100STP
OsSTP2LOC_Os03g39710.1Os03g0594400STP
OsSTP20LOC_Os07g03910.1Os07g0131200STP
OsSTP21LOC_Os07g03960.1Os07g0131600STP
OsSTP22LOC_Os07g10590.1Os07g0206600STP
OsSTP23LOC_Os09g09520.1Os09g0268300STP
OsSTP24LOC_Os09g12590.1Os09g0297300STP
OsSTP25LOC_Os09g15330.1Os09g0322000STP
OsSTP26LOC_Os09g24924.1Os09g0416200STP
OsSTP27LOC_Os10g41190.1Os10g0561300STP
OsSTP28LOC_Os11g38160.1Os11g0594000STP
OsSTP3LOC_Os07g01560.1Os07g0106200STP
OsSTP4LOC_Os03g11900.1Os03g0218400STP
OsSTP5LOC_Os08g08070.1Os08g0178200STP
OsSTP6LOC_Os07g37320.1Os07g0559700STP
OsSTP7LOC_Os01g38680.1Os01g0567600STP
OsSTP8LOC_Os01g38670.1Os01g0567500STP
OsSTP9LOC_Os02g06540.1Os02g0160400STP
OspGlcT1LOC_Os01g04190.2Os01g0133400pGlcT
OspGlcT2LOC_Os02g17500.1Os02g0274900pGlcT
OspGlcT3LOC_Os09g23110.1Os09g0394500pGlcT
OspGlcT4LOC_Os09g27900.1Os09g0452300pGlcT
OsPLT1LOC_Os03g10090.1Os03g0197100PLT
OsPLT10LOC_Os11g41830.1Os11g0637000PLT
OsPLT11LOC_Os11g41840.1Os11g0637100PLT
OsPLT12LOC_Os11g41850.1Os11g0637200PLT
OsPLT13LOC_Os11g41870.1Os11g0637400PLT
OsPLT14LOC_Os12g32760.1Os12g0512100PLT
OsPLT15LOC_Os12g32940.1Os12g0514000PLT
OsPLT2LOC_Os01g73590.1Os01g0966900PLT
OsPLT3LOC_Os10g21590.1Os10g0360100PLT
OsPLT4LOC_Os04g44750.1Os04g0529800PLT
OsPLT5LOC_Os07g39350.1Os07g0582400PLT
OsPLT6LOC_Os07g39360.1Os07g0582500PLT
OsPLT7LOC_Os03g10100.1Os03g0197200PLT
OsPLT8LOC_Os04g58220.1Os04g0678900PLT
OsPLT9LOC_Os04g58230.1Os04g0679000PLT
OsXTPH1LOC_Os03g60820.1Os03g0823100XTPH
OsXTPH2LOC_Os10g42830.1Os10g0579200XTPH
TIGR locus tag means gene ID in MSU7.0 (http://rice.plantbiology.msu.edu/), RAP-DB means gene ID in The Rice Annotation Project (RAP, https://rapdb.dna.affrc.go.jp/). MST: monosaccharide transporter.
Table 2. Ka, Ks and Ka/Ks values for duplication gene pairs in rice.
Seq_1Seq_2KaKsKa/KsDate (MYA)Duplication Type
OsSTP10OsSTP180.32903060.57791250.569343218.078602Segmental duplication
OsERD3OsERD50.19510741.14481280.170427310.720185Segmental duplication
OsSTP11OsSTP120.03284130.10135880.32401021.8044666Tandem duplication
OsSTP8OsSTP70.06159790.11355650.5424433.3845026Tandem duplication
OsPLT11OsPLT120.07770160.15527190.50042264.2693165Tandem duplication
OsERD3OsERD40.08374050.51369120.16301724.6011267Tandem duplication
OsPLT8OsPLT90.1421040.34549650.41130387.807912Tandem duplication
OsPLT5OsPLT60.14810740.30723560.48206478.1377715Tandem duplication
OsPLT1OsPLT70.19146380.33533850.570956810.51999Tandem duplication
OsSTP14OsSTP10.19757530.38678370.510815910.855785Tandem duplication
OsERD1OsERD20.21011770.92007980.22836911.54493Tandem duplication
OsSTP1OsSTP150.30655270.42617860.719305816.843556Tandem duplication
Synonymous (Ks) and nonsynonymous (Ka) substitution rates of duplicate gene pairs (Ka/Ks ratios).

