Article

De Novo Assembly and Comparative Transcriptome Profiling of Anser anser and Anser cygnoides Geese Species’ Embryonic Skin Feather Follicles

1
College of Animal Science and Technology, Jilin Agricultural University, Changchun 130118, China
2
Key Laboratory for Animal Production, Product Quality and Safety of Ministry of Education, Changchun 130118, China
3
Beijing General Station of Animal Husbandry, Beijing 100107, China
*
Authors to whom correspondence should be addressed.
These authors contributed equally to this work.
Submission received: 20 February 2019 / Revised: 2 May 2019 / Accepted: 6 May 2019 / Published: 8 May 2019
(This article belongs to the Section Animal Genetics and Genomics)

Abstract

:
Geese feather production and the quality of downy feathers are additional economically important traits in the geese industry. However, little information is available about the molecular mechanisms fundamental to feather formation and the quality of feathers in geese. This study conducted de novo transcriptome sequencing analysis of two related geese species using the Illumina 4000 platform to determine the genes involved in embryonic skin feather follicle development. A total of 165,564,278 for Anser anser and 144,595,262 for Anser cygnoides clean reads were generated, which were further assembled into 77,134 unigenes with an average length of 906 base pairs in Anser anser and 66,041 unigenes with an average length of 922 base pairs in Anser cygnoides. To recognize the potential regulatory roles of differentially expressed genes (DEGs) during geese embryonic skin feather follicle development, the obtained unigenes were annotated to Gene Ontology (GO), Eukaryotic Orthologous Groups (KOG), and Kyoto Encyclopedia of Genes and Genomes (KEGG) for functional analysis. In both species, GO and KOG had shown similar distribution patterns during functional annotation except for KEGG, which showed significant variation in signaling enrichment. Anser asnser was significantly enriched in the calcium signaling pathway, whereas Anser cygnoides was significantly enriched with glycerolipid metabolism. Further analysis indicated that 14,227 gene families were conserved between the species, among which a total of 20,715 specific gene families were identified. Comparative RNA-Seq data analysis may reveal inclusive knowledge to assist in the identification of genetic regulators at a molecular level to improve feather quality production in geese and other poultry species.

1. Introduction

Geese are an economically important agricultural poultry species raised worldwide with the ability to produce high quality meat, fatty liver, as well as feathers and down [1]. Birds are covered with feathers, which are peculiar appendages of the epidermal and dermal layers of the skin [2]. Feather development and growth occur at the bottom of a dermal papilla in the follicle. Follicular morphogenesis and the first premature feathers, named as the natal down, first begin to grow during the embryonic development period [3]. There are three major divisions of feathers in birds: downy feathers (radially symmetrical) derived from secondary feather follicles; contour feathers (bilaterally symmetrical); and flight feathers (bilaterally asymmetrical) derived from primary feather follicles [4]. Evolution in birds has resulted in feathers adopting various forms in morphology, color, and mechanical properties not only amongst different poultry species, but also among the different individual body parts, hence providing a useful model to investigate the phenotypic variations at the molecular level of related species [5]. There is well-documented detailed information on the growth, morphogenesis, and structural features of fowl feather follicles [6,7]. Even though there exist some precise similarities in the general characteristics of feather follicle formation in avian, there are still substantial variations in feather morphogenesis within and between species. The prenatal downy follicles in geese are further subdivided in primary and secondary feather follicles that have evolved autonomously of each other and form levels in a linear arrangement. In postnatal life, primary follicles with the greater diameter progress to contour and flight feathers, whereas the secondary follicles of a smaller diameter appear later and develop specifically into downy feathers [8]. The nutritional and environmental conditions “indirectly” influence the quality and quantity of feathers while genetics “directly” influence the quality and quantity of feathers [9]. Furthermore, the quantity and quality of geese downy feathers characteristics vary considerably within and between breeds [10]. Geese downy feathers and soft feathers provide high quality insulation materials for bedding and clothing, and hence serve as supreme economical traits [11]. However, there have been few discoveries about the variations in molecular mechanisms that regulate geese feather follicle development between closely related species.
Understanding the genomic and transcriptional regulators of complex functional mechanisms in closely related animal species require the universal and comparative analysis of biological and cellular processes [12]. Next generation sequencing (NGS) is an advanced technology used in large-scale transcriptome analysis and provides a novel opportunity to generate large amounts of gene expression data in a given time [13]. High-throughput RNA-sequencing (RNA-Seq) is a cost-effective NGS molecular technique, which is widely used in the mass gene expression profiling of living organisms, including nonmodel species with restricted genomic information [14]. RNA-Seq independently relies on prior information of the gene sequences of the target species, hence transcriptomic reconstruction is useful for molecular genetic researches in nonmodel species [15]. The genomic information, including gene expression analysis, Simple Sequence Repeat (SSR), gene and transcription factor (TF) discoveries, is acquired through the vital step of the de novo assembly by sequencing mass data reads [16]. Anser cygnoides are light-bodied geese species characterized by a higher reproduction rate, better environmental adaptability, and enhanced disease resistance capacity, which are indicators of good original material and the natural gene pool of crossbreed predominance and high performance [17]. In our previous study, we used the transcriptome analysis of geese (Anser anser) embryonic skin feather follicles from embryonic day 13 (E13), embryonic day 18 (E18), and embryonic day 28 (E28) to identify various gene expression profiles by using the de novo transcriptome sequencing analysis [18]. In the present study, we have expanded our research by the transcriptome sequencing of Anser cygnoides geese to compare the expression pattern profiling with geese (Anser anser) at the last day of embryonic development (E28) before hatching. A comparative transcriptome analysis will provide good knowledge of the functional molecular mechanisms associated with feather follicle formation and different gene expressions and signaling pathways, which might be helpful for future investigations as molecular markers to improve downy feather breeding in geese.

2. Materials and Methods

2.1. Ethics Statement

All the experimental procedures on animals were carried out in coherence with appropriate guidelines established by the Ministry of Agriculture of the People’s Republic of China. This study was approved by the Animal Health and Care Committee of Geese Industry Research and Development Centre of Jilin Agricultural University (Approval number: GR(J)18-006. Date: 29 March 2018; GR(J)18-008. Date: 13 April 2018).

2.2. Animal Sample Collection

Seventy-two eggs from each species were collected from a geese breeding research center (Jilin Agricultural University, Jilin Province, Northeast of China). The eggs were incubated in one incubator, but in separate racks following the farm daily incubation procedures. At embryonic day 28 (E28), three embryos for each species were randomly selected to conduct this study. The cervical dislocation method was applied to slaughter the sampled geese embryos to obtain the embryonic skin across the dorsal regions about 1 cm2 around the midline and from two wings. These were rinsed separately with water pretreated by diethylpyrocarbonate to cleanse the samples and inactivate RNases [19]. All of the samples were immediately put in liquid nitrogen and stored in a −80 °C refrigerator for RNA isolation.

2.3. RNA Isolation

The total RNA of the sampled dorsal skin tissues was isolated using the TRIzol Reagent (Invitrogen Life Technologies, Carlsbad, CA, USA), according to the manufacturer’s instructions. The total RNA for each sample was treated with DNAse 1 (Ambion/Life Technologies) to remove genomic DNA contamination. A Nanodrop 2000 (Thermo Fisher Scientific, Waltham, MA, USA) with the absorbance at 260 nm was used to determine the concentration and purity of the RNA. The quality of the RNA was detected by 1.2% agarose gel electrophoresis and the integrity of RNA was measured by using an Agilent 2100 Bio analyzer (Agilent, Santa Clara, CA, USA).

2.4. Library Sequencing

The total RNA for each sample was used to prepare the library sequencing by (Invitrogen Life Technologies, Carlsbad, CA, USA) following the manufacture’s protocol. Briefly, poly (A)-containing mRNA was purified using oligo(dT) cellulose. The first-strand complementary DNA (cDNA) was synthesized from short mRNA fragments, which were reverse-transcribed and amplified with random primers to form double-stranded cDNA. The cDNA library was used as the template to perform Polymerase Chain Reaction (PCR) amplification for fragment enrichment and 1.2% RNase-free agarose gel electrophoresis was used to make the ligation products size fractioned. A RNase H. TruSeq Stranded RNA Sample Preparation Kit (Illumina) was used to generate sequencing libraries. An Illumina HiSeq 4000 platform (Gene Denovo Co., Guangzhou, China) was used for sequencing six cDNA libraries from each species. The raw sequencing data has been uploaded in the National Center for Biotechnology Information (NCBI) sequence read archive (SRA) under the accession numbers SRP156879 and PRJNA521094.

2.5. De Novo Assembly and Functional Annotation

The open-source software FastQC (www.bioinformatics.babraham.ac.uk/projects/fastqc) was used to check and visualize the raw reads. The obtained raw data from the libraries was trimmed to remove low quality reads and adaptor sequences. Reads with more than 10% unknown nucleotide base pairs were discarded. De novo assembly of the high-quality reads from the six accessions was performed by Trinity software (version: 2.1.1, Broad Institute of Massachusetts Institute of Technology and Harvard, Cambridge, MA, USA) with default parameters and no reference sequence. The longest transcripts in the cluster units were considered as nonredundant unigenes. The functionality of the assembled transcripts was predicted in comparison with BLASTX searches in the NCBI non-redundant (Nr) protein database (available online: http://www.ncbi.nlm.nih.gov), Swiss-Prot protein database (available online: http://www.expasy.ch/sprot), KEGG pathway database (available online: http://www.genome.jp/kegg), and KOG database (available online: http://0-www-ncbi-nlm-nih-gov.brum.beds.ac.uk/COG) using the BLASTN algorithms cut-off (E-value < 10−5). The direction of the unigene sequence from the four databases was determined based on the high scoring alignments. The discrepancy between the alignment resulted from the employed databases, and the merits of the results were accredited following this order: Nr, Swiss-Prot, KEGG, and KOG. Unigene sequence mismatches in any of four databases entries, coding regions, and sequence direction were determined by using expressed sequence tags (ESTs) Scan.

2.6. Differentially Expressed Genes (DEGs) Analysis

Unigene annotations provide information regarding the expression and functional annotation of the identified genes. Clean unigene read sequences were mapped into the transcriptome reference databases by using BLASTX (E-value < 10−5). Based on the annotations in the protein databases, Blast2GO was used to obtain GO annotations for the aligned unigene sequences, the Web Gene Ontology Annotation Plot (WEGO) software was used to establish GO functional classifications for all unigenes, and the KEGG database was used to obtain pathway annotations (E-value threshold 10−5). The gene expression analysis was estimated by using the RPKM (reads per kilobase per million mapped reads) method [20]. The differentially expressed genes (DEGs) were defined with a |log2 Fold Change| > 1 using a threshold of false discovery rates (FDR < 0.05) and the corresponding value threshold was statistically significant. Meanwhile, gene expression data were normalized to log2(Anser anser/Anser cygnoides).

2.7. RNA-Seq Data Validation by Real Time Quantitative Polymerase Chain Reaction (RT-qPCR)

RNA-Seq data reliability was validated by conducting RT-qPCR. Eight DEGs: collagen type I alpha 1 chain (COL1A1); tumor protein, translationally-controlled 1 (TPT1); glyceraldehyde-3-phosphate dehydrogenase (GAPDH); aldehyde dehydrogenase 2 family member (ALDH2); Wnt family member 5B (WNT5B); SRP receptor beta subunit (SRPRB); transforming growth factor beta regulator 1 (TBRG1); and sorting nexin 3 (SNX3) were randomly selected. Total RNA was extracted from each species through embryonic skin feather follicle samples collected for RNA-Seq. cDNA was then synthesized using a ReverTra Ace qPCR RT Kit (TOYOBO, Osaka, Japan) from 1 μg of the same total RNA samples; the β -actin gene was used as the reference house-keeping gene. SYBR Green Real time PCR Master Mix (TOYOBO, Osaka, Japan) was used to perform the qPCR reactions in an Applied Biosystems 7500 Real-Time PCR System (Thermo Fisher Scientific Inc.,Waltham, MA, USA) with a 20 μL reaction system comprising 10 μL of SYBR Green Real time PCR Master Mix, 0.8 μL of each of the forward and reverse primers (200 μM), 2 μL of cDNA, and 6.4 μL of distilled water. The RT-qPCR program was 95 °C for 60 s; followed by 40 cycles of 95 °C for 15 s, 60 °C for 15 s, and 72 °C for 45 s; and ended with a final stage of melting curve analysis. The relative quantification of gene expression was detected in triplicate per sample. Relative expression values were calculated using the 2−ΔΔCt method.

3. Results

3.1. Illumina cDNA Data Sequencing and De Novo Assembly

Three RNA-Seq were constructed from both Anser anser and Anser cygnoides. The cDNA libraries were generated and transcriptome sequencing was performed using an Illumina sequencing platform in order to obtain highly reliable de novo transcriptome assembly for each species. First, open-source software FastQC (www.bioinformatics.babraham.ac.uk/projects/fastqc) was used to evaluate the sequence information. The total of 170,246,914 raw reads for Anser anser were generated and 147,754,320 raw reads for Anser cygnoides (Table 1). After disposal of adaptor, low quality sequences, and reads from ribosomal RNA (rRNA) contaminations, the high-quality reads were de novo assembled into unique transcripts using Trinity software resulting in 165,564,278 and 144,595,262 clean reads obtained for Anser anser and Anser cygnoides, respectively. Moreover, the clean reads generated from Anser anser consisted of 24,315,965,489 nucleotides and Anser cygnoides produced 21,274,765,140 nucleotides. Furthermore, the obtained clean sequences were de novo assembled into unique transcripts (unigene). For Anser anser, 77,134 total unigenes with an average length of 906 base pairs and a N50 of 2318 base pairs were generated. A total of 66,041 unigenes were generated with an average length of 922 base pairs and 2206 base pairs at N50 level for Anser cygnoides. The length of distribution of the assembled unigenes for both species is illustrated in Figure 1. The GC content of the assembled unigenes for Anser anser and Anser cygnoides was less variable between the species, each with an average of 49% and 50% GC, respectively.

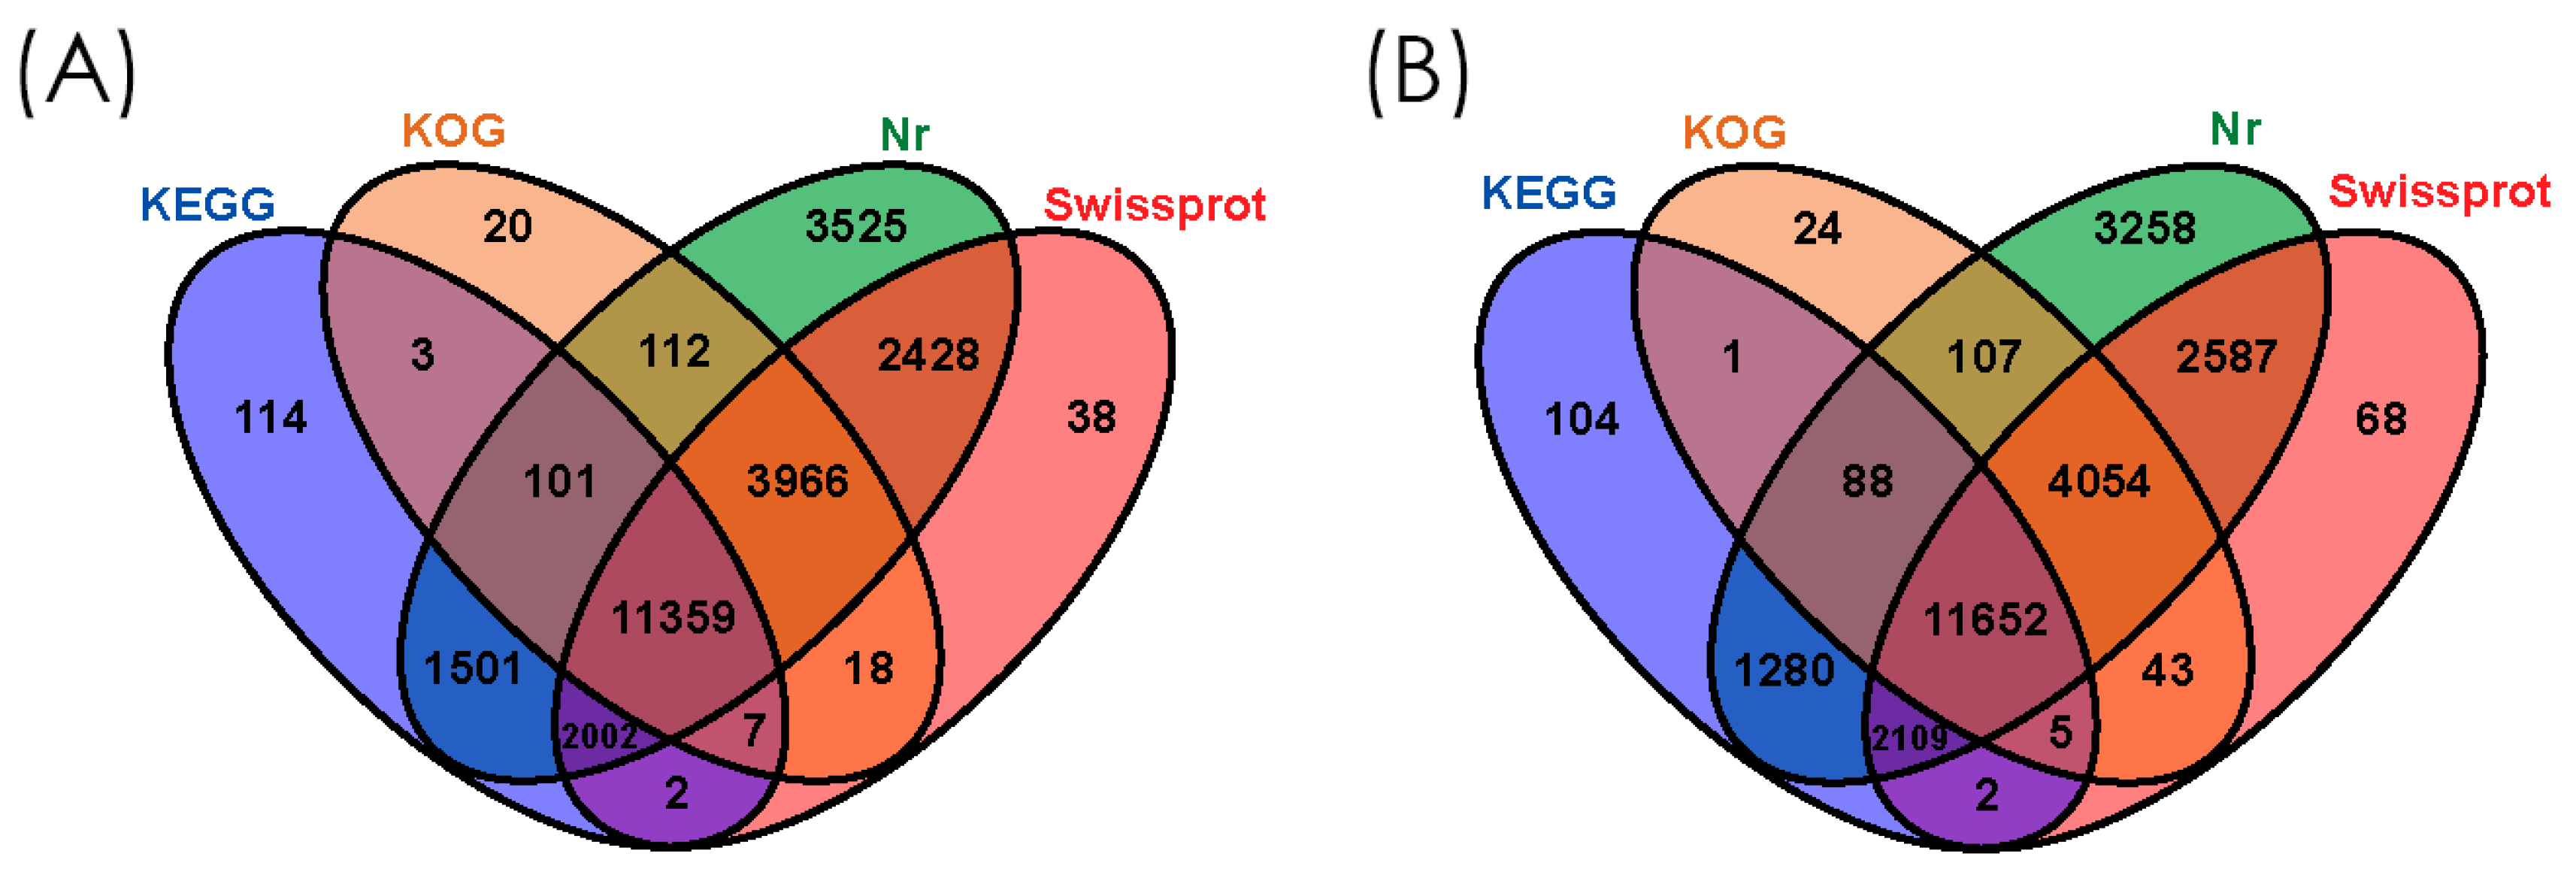
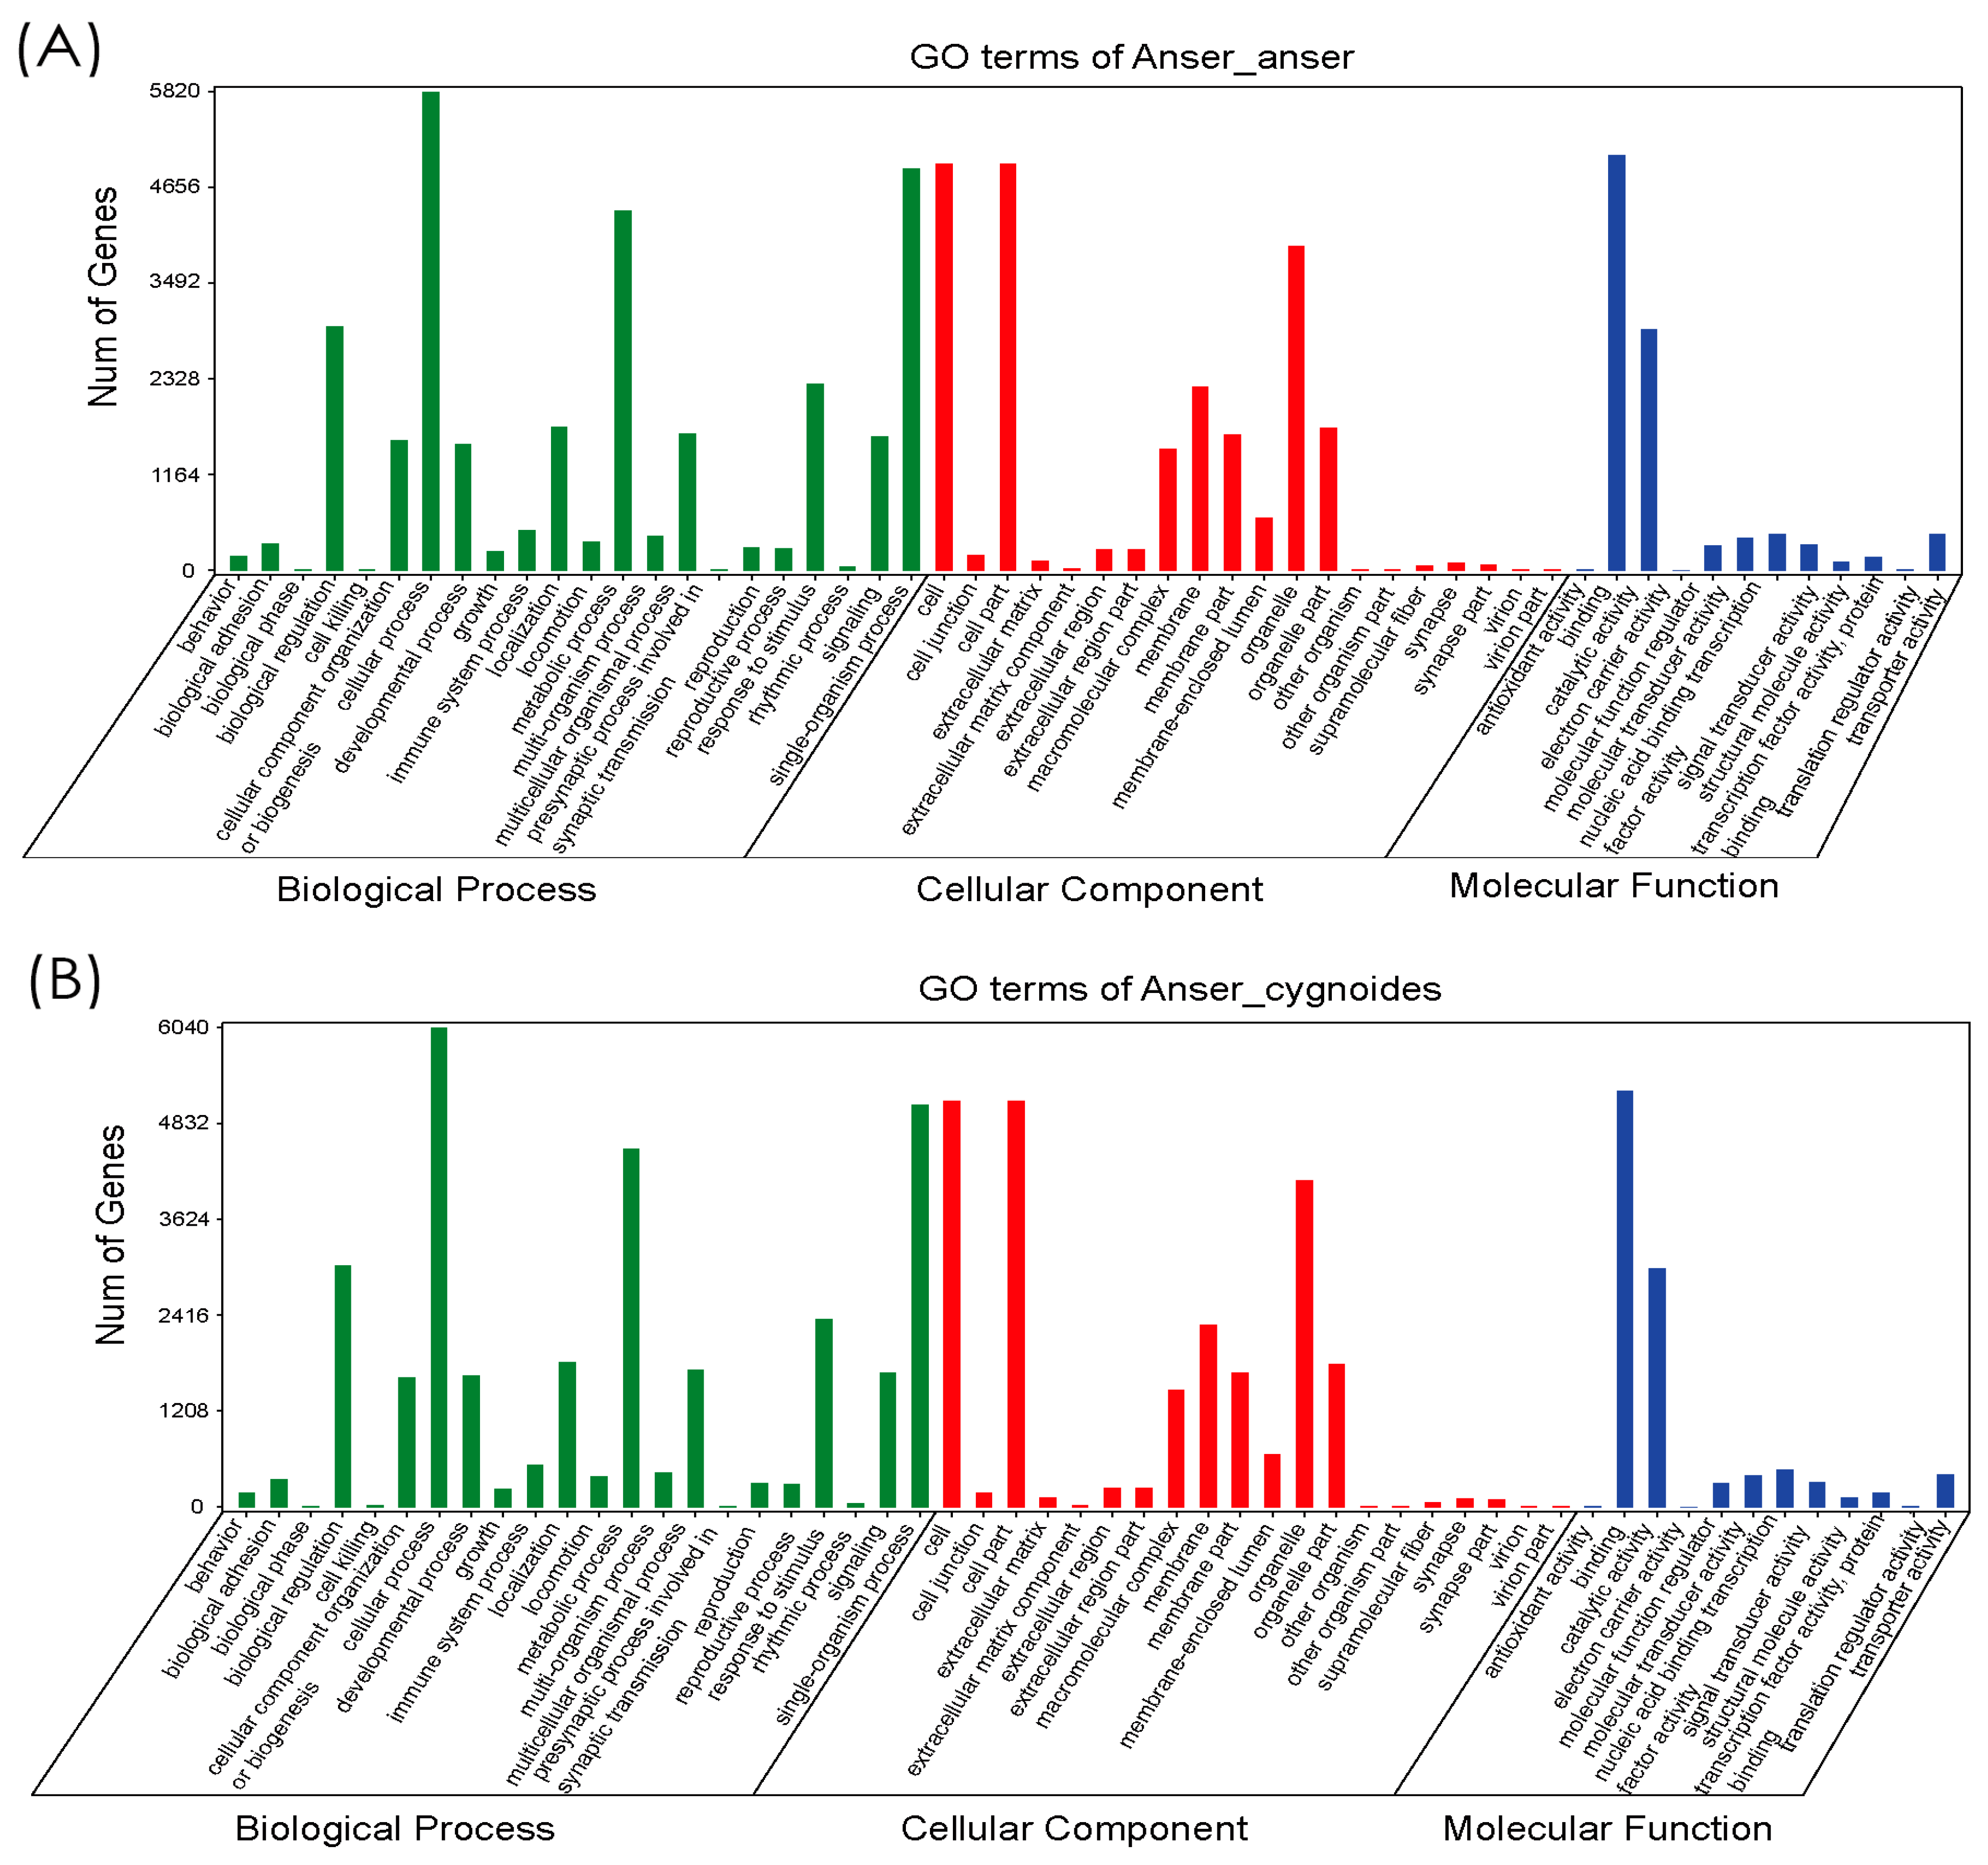
3.2. Functional Annotation of Gene Ontology (GO), Eukaryotic Orthologous Groups (KOG), and Kyoto Encyclopedia of Genes and Genomes (KEGG)

Annotation of the Anser anser and Anser cygnoides assembled unigene sequences were performed using BLASTX (E value ≤ 1 × 10⁻⁵) searched against the NCBI non-redundant protein (Nr) database, the Swiss-Prot protein database, Eukaryotic Orthologous Groups (KOG), and Kyoto Encyclopedia of Genes and Genomes (KEGG) (Figure 2). A total of 77,134 for Anser anser and 66,041 for Anser cygnoides unigenes were annotated. From the above-annotated sequences for both species, most of the genes had insignificant (without annotation genes) BLAST hits to the four databases; 51,938 for Anser anser and 40,659 for Anser cygnoides. Generally, the Nr database annotated more unigenes for both species with 24,994 (32.40%), followed by the Swiss-Prot database with 19,820 (25.70%), 15,586 (20.21%) in the KOG database, and 15,089 (19.56%) in KEGG for Anser anser whereas Anser cygnoides annotated 25,135 (38.06%) in the Nr database, 20,520 (31.07%) in the Swiss-Prot database, 15,974 (24.19%) in the KOG database, and 15,241 (23.08%) in the KEGG database. More noticeably, all of the employed databases had a higher E-value distribution hits (strong homology) E-value from 1 × 10−150 in both species.
The annotated sequences of 19,926 unigenes from Anser anser and 20,515 from Anser cygnoides were assigned to Gene Ontology (GO) terms, which were classified into three GO categories known as biological process, cellular component, and molecular functions (Figure 3A,B). For both species, the gene distribution in each of the GO categories was comparatively similar. In the biological processes category, cellular process (5814, 6035) was predominant, followed by single-organism process (4886, 5067), metabolic process (4373, 4514), and biological regulation (2962, 3045). In the cellular component category, cell and cell part showed a predominant number of genes in both species (4945, 5114; 4945, 5114), followed by organelle (3945, 4116), and membrane (2235, 2298). In molecular function, binding (5048, 5244) and catalytic activity (2930, 3004) were prominently observed.
Orthologous unigene functional prediction and classification of Anser anser and Anser cygnoides were performed using the KOG database. The unigenes were assembled to 25 KOG categories (Figure 4A,B), from which both species had a similar trend of functional classes. We found that the cluster for “signal transduction mechanisms” represented the largest group among all of the groups (7121 (21.58%) for Anser anser unigenes and 7315 (21.63%) for Anser cygnoides unigenes, followed by “general function prediction only” (5575 (16.89%); 5659 (16.73%)), “posttranslational modification, protein turnover, chaperones” (2886 (8.74%); 2912 (8.61%)), and “transcription” (2116 (6.41%); 2243 (6.63%)). Additional detailed information of all clusters is provided in Table S1.
Furthermore, to investigate the potential difference in signaling pathways between Anser anser and Anser cygnoides, the annotated unigenes were mapped to the KEGG database. In this study, we found 218 pathways were mapped for Anser anser and 216 pathways for Anser cygnoides, showing variation in the contribution for each pathway in a species-specific manner (Tables S2 and S3). Amongst the top 20 enriched pathways, ten pathways in Anser anser were significantly enriched at levels (Qvalue ≤ 0.05) namely “calcium signaling pathway (ko04020)”, “PPAR signaling pathway (ko03320)”, “glycerolipid metabolism (ko00561)”, “adrenergic signaling in cardiomyocytes (ko04261)”, “cardiac muscle contraction (ko04260)”, “Jak-STAT signaling pathway (ko04630)”, “hippo signaling pathway (ko04390)”, “axon guidance (ko04360)”, “alanine, aspartate and glutamate metabolism (ko00250)”, and “tyrosine metabolism (ko00350)”, respectively (Figure 5A). In Anser cygnoides amongst 20 top enriched pathways, 11 pathways were significantly enriched at the level (Qvalue ≤ 0.05) including “glycerolipid metabolism (ko00561)”, “ABC transporters (ko02010)”, “neurotrophin signaling pathway (ko04722)”, “linoleic acid metabolism (ko00591)”, “ECM-receptor interaction (ko04512)”, “alpha-linolenic acid metabolism (ko00592)”, “PPAR signaling pathway (ko03320)”, “long-term potentiation (ko04720)”, “ MAPK signaling pathway (ko04010)”, calcium signaling pathway (ko04020)”, and “inflammatory mediator regulation of TRP channels (ko04750)”, successively (Figure 5B).

3.3. Gene Homology Analysis

BLASTp was used in conjunction with OrthoMCL to find homogenes of homology between species. Ideally, the sequences were aligned in pairs and in the BLAST alignment, the pair of genes with an E value of less than 1 × 10⁻⁷ was considered to be a homologous gene between species. OrthoMCL was used to classify genes that were homologous to each other into the same family. We found a total of 34,942 gene families based on sequence alignment homology and 53,154 genes, of which 24,839 families and 42,711 genes belonged to Anser anser, and 24,330 gene families with 42,493 genes belonged to Anser cygnoides. In the comparative transcriptome of the two species, we identified 14,227 gene families and 32,050 genes conserved between Anser anser and Anser cygnoides. We further identified 10,612 gene families and 10,661 genes for Anser anser, and 10,103 gene families and 10,443 genes for Anser cygnoides that were differentially expressed (Figure 6). We identified the specific gene families of each species to annotate their functions and analyze their KEGG and GO enrichment. The annotations of specific genes in Anser anser and Anser cygnoides are listed in Tables S4 and S5, respectively.

3.4. Differentially Expressed Genes (DEGs) Analysis

In order to identify the differentially expressed genes, the unigenes from the significantly enriched pathway in each species were randomly selected. We identified pathways commonly enriched in GO terms for hair follicle and skin development (Table 2). We further identified various genes, which contributed significantly to geese embryonic skin feather follicle development between the two species (Table 3).

3.5. Validation of RNA-Seq by RT-qPCR

The reliability of the RNA-Seq data was validated by RT-qPCR through the random selection of eight DEGs: COL1A1, TPT1, GAPDH, ALDH2, WNT5B, SRPRB, TBRG1, and SNX3. For comparison, in the Anser anser species, the DEGs COL1A1, ALDH2, and SNX3 were upregulated, whereas TPP1, GAPDH, WNT5B, SRPRB, and TBRG1 were downregulated. The expression patterns of RT-qPCR data showed a consistent trend with the RNA-Seq results and hence validated the authenticity of the transcriptome (Figure 7).

4. Discussion

Regional variations in feather color on an individual body are referred to as pigment patterning [21]. Feather distribution and pigmentation patterns can be distinctive at different stages of a bird’s life span [22]. Poultry melanin is produced by melanocytes within feathers (from a horizontal ring at the proximal base of the feather follicle) and moves to the barb ridges to produce pigments during feather development [23]. Furthermore, different bird species display diverse genetic mechanisms that entail specific spatio-temporal regulation, which leads to distinctive pigmentation during development [24]. The authors in [25] reported the appearance of different feather pigmentation patterns in certain regions of quail embryo at different stages of development. The variation in feather pigmentation pattern between the two experimental geese species during embryonic growth is illustrated in Figure 8.
In the past few years, there have been numerous studies on the complex signaling pathway mechanisms regulating skin and hair/feather follicle growth/development in mammals. However, the significant difference in the molecules and signaling transduction pathways controlling embryonic skin feather follicles between the closely related poultry species is not fully understood. The difference between avian feather follicle development might be associated with complex hierarchical branching patterns of the ectodermal organ that control endothermy, communication, and flight [26]. To further elucidate the differentially expressed genes between the two geese species, KEGG signaling pathway analysis was performed. The major commonly shared signaling pathways in the top 20 enriched pathways between the two species’ embryonic skin feather follicles included the calcium signaling pathway, PPAR signaling, glycerolipid metabolism, the hippo signaling pathway, the phospholipase D signaling pathway, purine metabolism, and ECM–receptor interaction. Among others, some of these signaling pathways have been predicted in previous studies and are involved in the regulation of human skin development, specifically the differentiation of the epidermis [27], in chicken feather/scale development [28], hair follicle morphogenesis in cashmere goat (Capra hircus) [29], and mouse skin development [30]. Moreover, it is worth noticing that there were some signaling pathways present in a species-specific-manner at a significant level (Qvalue ≤ 0.05), adrenergic signaling in cardiomyocytes, cardiac muscle contraction, Jak-STAT signaling pathway, and axon guidance in Anser anser. For Anser cygnoides, they included ABC transporters, neurotrophin signaling, linoleic acid metabolism, Alpha-Linoleic acid metabolism, and long-term potentiation. These differences may be attributed to the contribution of the genes involved in these pathways to the phenotypic expression differences in feather color, quality, and quantity between the species. In this study, we found that the calcium signaling pathway and glycerolipid metabolism were the major pathways involved in the embryonic skin development of the two species. Calcium deficiency may be associated with poor quality feathers that break easily and have a dull, ragged-looking appearance [31]. Additionally, [32] found that calcium enrichment increased the number of black feather growth (feather melanization) and hence the size of the black plumage patch. Glycerolipids form the major components of sebum (surface lipid), contributing to bat communication, innate immune system, compound adsorption, pheromone release, organization of the stratum corneum, ultraviolet protection, hydration, and water repellency [33]. Therefore, we suggest that the genes belonging to these pathways could be target genes, advocating further understanding of the molecular mechanisms regulating feather follicles development between the two species.
The family of Wnt proteins signaling secretes highly conserved molecules that play a vital role during embryogenesis including cell differentiation, cell proliferation, and cell degeneration determination, thus regulating growth in many biological events [34]. In this study, we found that the Wnt6 gene was differentially expressed between the two species in the regulation of biological processes. The study in [35] found that Wnt6 was also differentially expressed during embryonic skin feather formation. Neurotrophins and their receptors’ proteins family do not only participate in neuronal cell survival and differentiation, but also contribute to certain biological activities on nonneuronal tissues such as skin [36]. A previous report by [37] indicated that NGFR was expressed in a multiple number of cell types derived from the inner endoderm mesoderm and surface ectoderm. Our study revealed that NGFR was expressed differentially in the feather follicle development of the geese Anser anser and Anser cygnoides. The fibroblast growth factors (FGFs) and their receptors are the main regulators of organogenesis during early stages of embryonic development, tissue repair, and regeneration in adults [38]. The FGF family is divided into seven subfamilies consisting of 22 polypeptides that control metabolic activity, survival, migration, proliferation, neural functions, and differentiation in various cells [39]. The authors in [40] found that FGF16 was expressed in brown adipose tissue during embryonic development in rats. Our results also showed that FGF16 was differentially expressed for the developmental process in the embryonic skin feather follicles in geese. Bone morphogenetic proteins (BMPs) are the largest members of secreted signaling molecules belonging to the transforming growth-beta (TGF-b) and their mutual action with distinct receptors impose several important biological processes [41]. BMPs regulate cell proliferation, differentiation, and apoptosis in different body cell/tissue types including developing epidermis, hair follicle growth, and melanogenesis in embryonic and postnatal skin [42]. The study by [43] indicated that BMP7 was expressed throughout the epidermis before placode formation and was consequently constrained to the primordium in both the dermis and epidermis. We found that BMP7 was upregulated in Anser anser, suggesting that BMP might have an indispensable contribution to the epithelium development when compared to the Anser cygnoides species. Histone deacetylase 2 (HDAC2) is a member of the class I histone deacetylases, which catalyzes the deacetylation of histones and acts as a promoter and a coding region of transcribed genes and regulates chromatin structure and transcription [44]. HDAC2 was expressed in the outer root sheath, hair matrix, and epidermal layer of the skin, and the epidermal suppression of HDAC2 activity indirectly impacts pigmentation, resulting in abnormal ectodermal organ morphogenesis, interrupted hair follicle homeostasis, and regeneration [45]. In [46], it was revealed that HDAC2 expression varied during epidermal cell development in mice. In this study, we found that HDAC2 was involved in the embryonic skin development in both species, but was downregulated in Anser cygnoides. This might be associated with the minimal contribution of HDAC2 in skin feather follicle development in Anser cygnoides. Insulin-like growth factor 1 receptor (IGF-1R) is a member of an insulin like growth factor receptor (IGFR) family of growth hormones [47]. IGF-1R mediates the action of insulin growth factor 1 (IGF-1), which is locally produced by mesenchyme-derived cells. Subsequent activation of heterotetrameric IGF-1R leads to its auto-phosphorylation and function as a base for multiple signaling transduction pathways including the activation of mitogen-activated protein kinase (MAPKs) and phosphatidylinositol 3-kinase (PI3Ks) [48]. Immunity-related cells (some thymocytes, natural killer cells, some T lymphocytes, monocytes, and most B cells) expressed IGR-1R depending on the stimulation conditions [49]. These study findings revealed that IGF-1R participated in the morphogenesis of an epithelium upregulated in Anser anser and downregulated in Anser cygnoides, which implies that IGF-1R might play an imperative role in controlling and regulating skin formation and feather development. During embryogenesis, the formation of blood vessels occurs through vasculogenesis, thus the primitive vascular network forms from the differentiation of undifferentiated angioblasts into endothelial cells [50]. Vascular endothelial growth factor-C (VEGF-C) is a known member of the vascular endothelial growth factor (VEGF) family that has different functions such as endothelia regulatory factors [51]. The authors [52] found that hair growth in rabbits was significantly accelerated by VEGF-C through the activation of cells controlling the regulation of the hair growth cycle through growth factors. Our results showed that VEGF-C was differentially expressed between two species contributing to biological regulation in the focal adhesion signaling pathway, thus VEGF-C may play an important role in geese angiogenesis. Platelet-derived growth factor (PDGF) is a potent mitogen consisting of three different polypeptides (PDGF-A, PDGF-B, and PDGF-C) produced in numerous types of cells such as endothelial and keratinocyte cells and is essential for proliferation, differentiation, and growth [53]. PDGFB was observed in the keratinocytes cells of the hair follicles and not detected in the cultured dermal papillae cells in humans [54]. Our research found that PDGFB was predominantly expressed in the Anser anser species and comparatively less in Anser cygnoides embryonic skin. This suggests that PDGFB might have a substantial role in the epithelium development of Anser anser to enhance cell proliferation and differentiation. Taken together, the selected differentially expressed genes were more pronounced in the Anser anser geese species, suggesting that these genes might have potential in regulating feather formation and hence improving the quality of downy feathers.
Ultimately, the RNA-Seq results were validated by RT-qPCR to access the relative expression levels of the eight randomly selected DEGs (COL1A1, TPT1, GAPDH, ALDH2, WNT5B, SRPRB, TBRG1, and SNX3), which showed a consistent trend of expression, therefore authenticating our results’ reliability. Skin connective tissue is comprised mainly of collagens type I and III, representing about 80% of the dermis and confer stress resistance mechanisms providing protection from skin tearing and deformation [55]. COL1A1 is a type 1 collagen that regulates cell proliferation, migration, and control gene expression [56]. The present reports on COL1A1 have focused mainly on bone diseases, tumor tissues, osteoporosis, and esteogenesis [57,58]. In our present study, COL1A1 was upregulated for Anser anser in both RNA-Seq and RT-qPCR, suggesting that COL1A1 may have a key functional role in geese embryonic skin feather follicle development. However, there is a scarcity of information on the molecular mechanism of COL1A1 involvement in controlling geese feather formation and development.

5. Conclusions

In conclusion, by using the RNA-Seq technique, we were able to establish transcriptome profile characterization of the embryonic skin feather follicles of the two geese species with different potentials for the production performance quality of downy feathers. A total of 170,246,914 raw reads for Anser anser and 147,754,320 raw reads for Anser cygnoides were obtained. De novo assembly by Trinity generated 165,564,278 and 144,595,262 clean reads for Anser anser and Anser cygnoides, respectively, which were further assembled into 77,134 unigenes with an average length of 906 base pairs in Anser anser and 66,041 unigenes with an average length of 922 base pairs in Anser cygnoides. This study further identified differentially expressed genes such as IGF1R, VEGFC, PDGFB, and KCNMA1, and significantly enriched signal transduction pathways, particularly the calcium signaling pathway and glycerolipid metabolism, through the help of bioinformatics software to provide a deep insight into the genomic variations between the two related species, which might be responsible for the quality of feathers. The identification of genes and involved signaling transduction cascades can be targets for further study in promoting high-grade downy feathers and assist in skin-related studies in other animals.

Supplementary Materials

The following are available online at https://0-www-mdpi-com.brum.beds.ac.uk/2073-4425/10/5/351/s1, Table S1: Detailed information of the 25 KOG categories, Table S2: Pathway Enrichment in the Anser anser, Table S3: Pathway Enrichment in the Anser cygnoides, Table S4: Annotations of specific genes in the Anser anser, Table S5: Annotations of specific genes in the Anser cygnoides.

Author Contributions

Conceptualization and writing—original draft preparation, C.T.S., C.L., and Y.S. (Yongfeng Sun); data curation, H.L., C.X., Y.S. (Yue Sun), and J.L.; software, Y.Z., review and editing, P.M., S.C., and J.H.; resources, S.L., W.Y. and Y.S. (Yujian Sui).

Funding

This research was funded by Jilin Province Science and Technology Development Project (20180201034NY), the Carlos-Jilin goose cross systems development and popularization demonstration (2018), the Jilin native high quality poultry breeds reproduction and extension (201804), and the Jilin Agricultural University youth talent support program (2018).

Acknowledgments

Authors appreciated the Geese Industry Research and Development Centre of Jilin Agricultural University undergraduate students for their participation and close monitoring during the incubation period. We also acknowledge the Jilin Agricultural University Geese Research Farm for keeping and raising animals to conduct this research.

Conflicts of Interest

Authors declare no conflict of interest.

References

  1. Ding, N.; Han, Q.; Zhao, X.Z.; Li, Q.; Li, J.; Zhang, H.F.; Gao, G.L.; Luo, Y.; Xie, Y.H.; Su, J. Differential gene expression in pre-laying and laying period ovaries of Sichuan White geese (Anser cygnoides). Genet. Mol. Res. 2015, 14, 6773–6785. [Google Scholar] [CrossRef] [PubMed]
  2. Kozák, J. An overview of feathers formation, moults and down production in geese. Asian-Australas. J. Anim. Sci. 2011, 24, 881–887. [Google Scholar] [CrossRef]
  3. Yu, M.; Yue, Z.; Wu, P.; Wu, D.Y.; Mayer, J.A.; Medina, M.; Widelitz, R.B.; Jiang, T.X.; Chuong, C.M. The biology of feather follicles. Int. J. Dev. Biol. 2004, 48, 181–191. [Google Scholar] [CrossRef]
  4. Widelitz, R.B.; Veltmaat, J.M.; Mayer, J.A.; Foley, J.; Chuong, C.M. Mammary glands and feathers: Comparing two skin appendages which help define novel classes during vertebrate evolution. Semin. Cell Dev. Biol. 2007, 18, 255–266. [Google Scholar] [CrossRef] [Green Version]
  5. Ng, C.S.; Chen, C.K.; Fan, W.L.; Wu, P.; Wu, S.M.; Chen, J.J.; Lai, Y.T.; Mao, C.T.; Lu, M.Y.; Chen, D.R.; et al. Transcriptomic analyses of regenerating adult feathers in chicken. BMC Genom. 2015, 16, 756. [Google Scholar] [CrossRef]
  6. Widelitz, R.B.; Jiang, T.X.; Yu, M.; Shen, T.; Shen, J.Y.; Wu, P.; Yu, Z.; Chuong, C.M. Molecular biology of feather morphogenesis: A testable model for evo-devo research. J. Exp. Zool. B Mol. Dev. Evol. 2003, 298, 109–122. [Google Scholar] [CrossRef]
  7. Dhouailly, D.; Godefroit, P.; Martin, T.; Nonchev, S.; Caraguel, F.; Oftedal, O. Getting to the root of scales, feather and hair: As deep as odontodes? Exp. Dermatol. 2017, 28, 503–508. [Google Scholar] [CrossRef] [Green Version]
  8. Xu, R.F.; Wu, W.; Xu, H. Investigation of feather follicle development in embryonic geese. Poult. Sci. 2007, 86, 2000–2007. [Google Scholar] [CrossRef]
  9. Leeson, S.; Walsh, T. Feathering in commercial poultry II. Factors influencing feather growth and feather loss. World Poultry Sci. J. 2004, 60, 52–63. [Google Scholar] [CrossRef]
  10. Chen, X.; Bai, H.; Li, L.; Zhang, W.; Jiang, R.; Geng, Z. Follicle characteristics and follicle developmental related Wnt6 polymorphism in Chinese indigenous Wanxi-white goose. Mol. Biol. Rep. 2012, 39, 9843–9848. [Google Scholar] [CrossRef]
  11. Wu, W.; Xu, R.F.; Li, C.H.; Wu, C.X. Characterization of embryonic feather follicle development in the Chinese indigenous Jilin white goose. Asian-Australas. J. Anim. Sci. 2008, 21, 346–352. [Google Scholar] [CrossRef]
  12. Liu, Y.; Xie, L.; Gong, G.; Zhang, W.; Zhu, B.; Hu, Y. De novo comparative transcriptome analysis of Acremonium chrysogenum: High-yield and wild-type strains of cephalosporin C producer. PLoS ONE 2014, 9, e104542. [Google Scholar] [CrossRef]
  13. Torre, S.; Tattini, M.; Brunetti, C.; Guidi, L.; Gori, A.; Marzano, C.; Landi, M.; Sebastiani, F. De novo assembly and comparative transcriptome analyses of red and green morphs of sweet basil grown in full sunlight. PLoS ONE 2016, 11, e0160370. [Google Scholar] [CrossRef]
  14. Yoshida, Y.; Tomiyama, T.; Maruta, T.; Tomita, M.; Ishikawa, T.; Arakawa, K. De novo assembly and comparative transcriptome analysis of Euglena gracilis in response to anaerobic conditions. BMC Genom. 2016, 17, 182. [Google Scholar] [CrossRef]
  15. Martin, J.A.; Wang, Z. Next-generation transcriptome assembly. Nat. Rev. Genet. 2011, 12, 671–682. [Google Scholar] [CrossRef] [Green Version]
  16. Wu, G.; Zhang, L.; Yin, Y.; Wu, J.; Yu, L.; Zhou, Y.; Li, M. Sequencing, de novo assembly and comparative analysis of Raphanus sativus transcriptome. Front. Plant Sci. 2015, 6, 198. [Google Scholar] [CrossRef]
  17. Li, H.F.; Zhu, W.Q.; Chen, K.W.; H, Y.; Xu, W.J.; Song, W. Two maternal origins of Chinese domestic goose. Poult Sci. 2011, 90, 2705–2710. [Google Scholar] [CrossRef] [PubMed] [Green Version]
  18. Liu, C.; Sello, C.T.; Sun, Y.; Zhou, Y.; Lu, H.; Sui, Y.; Hu, J.; Xu, C.; Sun, Y.; Liu, J.; et al. De novo transcriptome sequencing analysis of goose (anser anser) embryonic skin and the identification of genes related to feather follicle morphogenesis at three stages of development. Int. J. Mol. Sci. 2018, 19, 3170. [Google Scholar] [CrossRef] [PubMed]
  19. Pernthaler, A.; Amann, R. Simultaneous fluorescence in situ hybridization of mRNA and rRNA in environmental bacteria. Appl. Environ. Microbiol. 2004, 70, 5426–5433. [Google Scholar] [CrossRef] [PubMed]
  20. Mortazavi, A.; Williams, B.A.; McCue, K.; Schaeffer, L.; Wold, B. Mapping and quantifying mammalian transcriptomes by RNA-Seq. Nat. Methods 2008, 5, 621. [Google Scholar] [CrossRef]
  21. Gluckman, T.L.; Mundy, N.I. The differential expression of MC1R regulators in dorsal and ventral quail plumages during embryogenesis: Implications for plumage pattern formation. PloS ONE 2017, 12, e0174714. [Google Scholar] [CrossRef] [Green Version]
  22. Ng, C.S.; Li, W.H. Genetic and molecular basis of feather diversity in birds. Genome Biol. Evol. 2018, 10, 2572–2586. [Google Scholar] [CrossRef] [PubMed]
  23. Lin, S.J.; Foley, J.; Jiang, T.X.; Yeh, C.Y.; Wu, P.; Foley, A.; Yen, C.M.; Huang, Y.C.; Cheng, H.; Chen, C.F.; et al. Topology of feather melanocyte progenitor niche allows complex pigment patterns to emerge. Science 2013, 340, 1442–1445. [Google Scholar] [CrossRef] [Green Version]
  24. Haupaix, N.; Curantz, C.; Bailleul, R.; Beck, S.; Robic, A.; Manceau, M. The periodic coloration in birds forms through a prepattern of somite origin. Science 2018, 361, eaar4777. [Google Scholar] [CrossRef]
  25. Ainsworth, S.J.; Stanley, R.L.; Evans, D.J.R. Developmental stages of the Japanese quail. J. Anat. 2010, 216, 3–15. [Google Scholar] [CrossRef]
  26. Chen, X.; Ge, K.; Wang, M.; Zhang, C.; Geng, Z. Integrative analysis of the Pekin duck (Anas anas) MicroRNAome during feather follicle development. BMC Dev. Biol. 2017, 17, 12. [Google Scholar] [CrossRef]
  27. Watt, F.M.; Fujiwara, H. Cell-extracellular matrix interactions in normal and diseased skin. Cold Spring Harb. Perspect. Biol. 2011, 3, a005124. [Google Scholar] [CrossRef] [PubMed]
  28. Chang, K.W.; Huang, N.A.; Liu, I.H.; Wang, Y.H.; Wu, P.; Tseng, Y.T.; Hughes, M.W.; Jiang, T.X.; Tsai, M.H.; Chen, C.Y.; et al. Emergence of differentially regulated pathways associated with the development of regional specificity in chicken skin. BMC Genom. 2015, 16, 22. [Google Scholar] [CrossRef]
  29. Zhu, B.; Xu, T.; Yuan, J.; Guo, X.; Liu, D. Transcriptome sequencing reveals differences between primary and secondary hair follicle-derived dermal papilla cells of the Cashmere goat (Capra hircus). PLoS ONE 2013, 8, e76282. [Google Scholar] [CrossRef]
  30. Michalik, L.; Wahli, W. Peroxisome proliferator-activated receptors (PPARs) in skin health, repair and disease. Biochim. Biophys. Acta 2007, 1771, 991–998. [Google Scholar] [CrossRef] [PubMed]
  31. Van Zeeland, Y.R.; Schoemaker, N.J. Plumage disorders in psittacine birds-part 1: Feather abnormalities. EJCAP 2014, 24, 34–47. [Google Scholar]
  32. McGraw, K.J. An update on the honesty of melanin-based color signals in birds. Pigment Cell Melanoma Res. 2008, 21, 133–138. [Google Scholar] [CrossRef] [Green Version]
  33. Pannkuk, E.L.; Mcguire, L.P.; Gilmore, D.F.; Savary, B.J.; Risch, T.S. Glycerophospholipid analysis of eastern red bat (Lasiurus borealis) hair by electrospray ionization tandem mass spectrometry. J. Chem. Ecol. 2014, 40, 227–235. [Google Scholar] [CrossRef] [PubMed]
  34. Gudjonsson, J.E.; Johnston, A.; Stoll, S.W.; Riblett, M.B.; Xing, X.; Kochkodan, J.J.; Ding, J.; Nair, R.P.; Aphale, A.; Voorhees, J.J.; et al. Evidence for altered Wnt signaling in psoriatic skin. J. Investig. Dermatol. 2010, 130, 1849–1859. [Google Scholar] [CrossRef]
  35. Chodankar, R.; Chang, C.H.; Yue, Z.; Jiang, T.X.; Suksaweang, S.; Burrus, L.; Chuong, C.M.; Widelitz, R. Shift of localized growth zones contributes to skin appendage morphogenesis: Role of the Wnt/β-catenin pathway. J. Investig. Dermatol. 2003, 120, 20–26. [Google Scholar] [CrossRef]
  36. Truzzi, F.; Marconi, A.; Pincelli, C. Neurotrophins in healthy and diseased skin. Dermatoendocrinol 2011, 3, 32–36. [Google Scholar] [CrossRef] [Green Version]
  37. Thomson, T.M.; Rettig, W.J.; Chesa, P.G.; Green, S.H.; Mena, A.C.; Old, L.J. Expression of human nerve growth factor receptor on cells derived from all three germ layers. Exp. Cell Res. 1988, 174, 533–539. [Google Scholar] [CrossRef]
  38. Ornitz, D.M.; Itoh, N. The fibroblast growth factor signaling pathway. Wiley Interdiscip. Rev. Dev. Biol. 2015, 4, 215–266. [Google Scholar] [CrossRef]
  39. Maddaluno, L.; Urwyler, C.; Werner, S. Fibroblast growth factors: Key players in regeneration and tissue repair. Development 2017, 144, 4047–4060. [Google Scholar] [CrossRef]
  40. Chen, G.J.; Forough, R. Fibroblast growth factors, fibroblast growth factor receptors, diseases, and drugs. Recent Pat. Cardiovasc. Drug Discov. 2006, 1, 211–224. [Google Scholar] [CrossRef]
  41. Botchkarev, V.A.; Sharov, A.A. BMP signaling in the control of skin development and hair follicle growth. Differentiation 2004, 72, 512–526. [Google Scholar] [CrossRef] [PubMed]
  42. Botchkarev, V.A. Bone morphogenetic proteins and their antagonists in skin and hair follicle biology. J. Investig. Dermatol. 2003, 120, 36–47. [Google Scholar] [CrossRef]
  43. Michon, F.; Forest, L.; Collomb, E.; Demongeot, J.; Dhouailly, D. BMP2 and BMP7 play antagonistic roles in feather induction. Development 2008, 135, 2797–2805. [Google Scholar] [CrossRef]
  44. Jahan, S.; Sun, J.M.; He, S.; Davie, J.R. Transcription-dependent association of HDAC2 with active chromatin. J. Cell. Physiol. 2018, 233, 1650–1657. [Google Scholar] [CrossRef]
  45. Hughes, M.W.; Jiang, T.X.; Lin, S.J.; Leung, Y.; Kobielak, K.; Widelitz, R.B.; Chuong, C.M. Disrupted ectodermal organ morphogenesis in mice with a conditional histone deacetylase 1, 2 deletion in the epidermis. J. Investig. Dermatol. 2014, 134, 24–32. [Google Scholar] [CrossRef] [PubMed]
  46. LeBoeuf, M.; Terrell, A.; Trivedi, S.; Sinha, S.; Epstein, J.A.; Olson, E.N.; Morrisey, E.E.; Millar, S.E. Hdac1 and Hdac2 act redundantly to control p63 and p53 functions in epidermal progenitor cells. Dev Cell. 2010, 19, 807–818. [Google Scholar] [CrossRef] [Green Version]
  47. Sharp, L.L.; Jameson, J.M.; Cauvi, G.; Havran, W.L. Dendritic epidermal T cells regulate skin homeostasis through local production of insulin-like growth factor 1. Nat. Immunol. 2005, 6, 73–79. [Google Scholar] [CrossRef]
  48. Vincent, A.M.; Feldman, E.L. Control of cell survival by IGF signaling pathways. Growth Horm. IGF Res. 2002, 12, 193–197. [Google Scholar] [CrossRef]
  49. Stentz, F.B.; Kitabchi, A.E. De novo emergence of growth factor receptors in activated human CD4+ and CD8+ T lymphocytes. Metabolism 2004, 53, 117–122. [Google Scholar] [CrossRef]
  50. Detmar, M. The role of VEGF and thrombospondins in skin angiogenesis. J. Dermatol. Sci. 2000, 24, S78–S84. [Google Scholar] [CrossRef]
  51. Jeltsch, M.; Kaipainen, A.; Joukov, V.; Meng, X.; Lakso, M.; Rauvala, H.; Swartz, M.; Fukumura, D.; Jain, R.K.; Alitalo, K. Hyperplasia of lymphatic vessels in VEGF-C transgenic mice. Science 1997, 276, 1423–1425. [Google Scholar] [CrossRef]
  52. Cegielski, M.; Izykowska, I.; Chmielewska, M.; Dziewiszek, W.; Bochnia, M.; Calkosinski, I.; Dziegiel, P. Characteristics of MIC-1 antlerogenic stem cells and their effect on hair growth in rabbits. In Vivo 2013, 27, 97–106. [Google Scholar] [CrossRef]
  53. Tomita, Y.; Akiyama, M.; Shimizu, H. PDGF isoforms induce and maintain anagen phase of murine hair follicles. J. Dermatol. Sci. 2006, 43, 105–115. [Google Scholar] [CrossRef] [Green Version]
  54. Kamp, H.; Geilen, C.; Sommer, C.; Blume-Peytavi, U. Regulation of PDGF and PDGF receptor in cultured dermal papilla cells and follicular keratinocytes of the human hair follicle. Exp. Dermatol. 2003, 12, 662–672. [Google Scholar] [CrossRef]
  55. Bigot, N.; Beauchef, G.; Hervieu, M.; Oddos, T.; Demoor, M.; Boumediene, K.; Galéra, P. NF-κB accumulation associated with COL1A1 transactivators defects during chronological aging represses type I collagen expression through a–112/–61-bp region of the COL1A1 promoter in human skin fibroblasts. J. Investig. Dermatol. 2012, 32, 2360–2367. [Google Scholar] [CrossRef] [PubMed]
  56. Wang, Q.; Peng, Z.; Xiao, S.; Geng, S.; Yuan, J.; Li, Z. RNAi-mediated inhibition of COL1A1 and COL3A1 in human skin fibroblasts. Exp. Dermatol. 2007, 16, 611–617. [Google Scholar] [CrossRef] [Green Version]
  57. Zhang, Z.; Wang, Y.; Zhang, J.; Zhong, J.; Yang, R. COL1A1 promotes metastasis in colorectal cancer by regulating the WNT/PCP pathway. Mol. Med. Rep. 2018, 17, 5037–5042. [Google Scholar] [CrossRef] [PubMed] [Green Version]
  58. Byers, P.H.; Pyott, S.M. Recessively inherited forms of osteogenesis imperfecta. Annu. Rev. Genet. 2012, 46, 475–497. [Google Scholar] [CrossRef]
Figure 1. Summary of the unigene length distribution after Trinity assembly (≥200 nucleotides) for both species. The highest unigene numbers were observed from the 200–299 nucleotides range with 30,856 and 25,186 unigenes, respectively.
Genes 10 00351 g001
Figure 2. Venn diagrams showing the unigene assembly BLAST results of Anser anser (A) and Anser cygnoides (B) transcriptome against four databases. These show the differences and similarities of the number of unigenes annotated in each database within the individual species and between different species.
Genes 10 00351 g002
Figure 3. Comparison of the GO functional annotations of unigenes between the Anser anser (A) and Anser cygnoides (B) species into three major categories: biological process, cellular component, and molecular function.
Genes 10 00351 g003
Figure 4. Transcriptomes of Eukaryotic Orthologous Groups (KOG) classifications for Anser anser (A) and Anser cygnoides (B). To identify and classify possible functions, all unigenes were aligned to the KOG database.
Genes 10 00351 g004
Figure 5. Top 20 enriched KEGG pathways for Anser anser (A) and Anser cygnoides (B). The y-axis represents the name of the pathway, and the x-axis represents the rich factor and the ratio of the number of DEGs and the number of all genes in the pathway is represented by the rich factor. The Qvalue indicates the significant enrichment of the DEGs and pathways.
Genes 10 00351 g005
Figure 6. Gene families and genes obtained from the transcriptomes of Anser anser and Anser cygnoides. Gene families and genes were identified from the two transcriptomes using BLASTp and an OrthoMCL, with the total number of gene families and genes belonging to each species shown in the figure with 14,227 gene families and 32,050 genes conserved between the two species’ transcriptomes.
Genes 10 00351 g006
Figure 7. RNA-Seq data reliability check by RT-qPCR. Panel A indicates the RNA-Seq expression level (RPKM) defined as the False Discovery Rate (FDR) < 0.05 and |log2 Fold Change| > 1 and panel B represents the mRNA expression level calculated as the 2−ΔΔCt method of the selected genes.
Genes 10 00351 g007
Figure 8. The Anser anser and Anser cygnoides fluffy embryonic downy pigmentation. (A) Anser anser; (B) Anser cygnoides.
Genes 10 00351 g008
Table 1. Transcriptome sequencing summary of Anser anser and Anser cygnoides.
Anser anserAnser cygnoides
Total number of raw reads170,246,914147,754,320
Total number of clean reads165,564,278144,595,262
Total length of clean reads (bp)24,315,965,48921,274,765,140
Q20 percentage after filter (%)98.3198.46
Total number of unigenes77,13466,041
GC percentage of unigenes (%)49.317049.8801
N50 length of unigenes (bp)23182206
Max length of unigenes (bp)24,41222,078
Min length of unigenes (bp)201201
Table 2. Statistically common enriched GO terms (GO: 0001942//hair follicle development; GO: 0043588//skin development) between Anser anser and Anser cygnoides.
PathwaysDEGs in Anser anser (2200)All genes in Anser anser (6850)DEGs in Anser cygnoides (2100)All genes in Anser cygnoides (6777)Pathway ID
Cytokine-cytokine receptor interaction71 (3.23%)230 (3.36%)49 (2.33%)210 (3.1%)ko04060
Adherens junction26 (1.18%)98 (1.43%)48 (2.29%)120 (1.77%)ko04520
Cell cycle32 (1.45%)170 (2.48%)55 (2.62%)190 (2.8%)ko04110
TGF-beta signaling pathway24 (1.09%)108 (1.58%)17 (0.81%)95 (1.4%)ko04350
Wnt signaling pathway52 (2.36%)182 (2.66%)50 (2.38%)192 (2.83%)ko04310
Endocytosis125 (5.68%)388 (5.66%)120 (5.71%)376 (5.55%)ko04144
Metabolic pathways569 (25.86%)1688 (24.64%)513 (24.43%)1623 (23.95%)ko01100
MAPK signaling pathway129 (5.86%)372 (5.43%)149 (7.1%)393 (5.8%)ko04010
Hedgehog signaling pathway16 (0.73%)61 (0.89%)18 (0.86%)61 (0.9%)ko04340
Table 3. The KEGG pathway and GO function of DEGs associated with embryonic skin feather follicle development.
SymbolAnser anserAnser cygnoidesKEGG PathwayGO Function
Gene IDRPKMGene IDRPKM
Wnt6Unigene00086425.0506Unigene00343643.4138ko04310//Wnt signaling pathwayGO:0050789//regulation of biological process
NGFRUnigene000236724.2656Unigene004529112.6814ko04060//Cytokine-cytokine receptor interactionGO:0001942//hair follicle development
FGF16Unigene00162212.0958Unigene00193290.8415ko04010//MAPK signaling pathwayGO:0032502//developmental process
BMP7Unigene00434571.8824Unigene00103780.6135ko04060//Cytokine-cytokine receptor interactionGO:0060429//epithelium development
HDAC2Unigene003947917.7176Unigene00224480.0936ko04110//Cell cycleGO:0043588//skin development
IGF1RUnigene00543922.1838Unigene00052101.695ko04144//EndocytosisGO:0002009//morphogenesis of an epithelium
VEGFCUnigene00196113.3092Unigene00221842.561ko04510//Focal adhesionGO:0065007//biological regulation
PDGFBUnigene00533518.9492Unigene00443875.1886ko04010//MAPK signaling pathwayGO:0060429//epithelium development
KCNMA1Unigene00547010.4124Unigene00427120.6262ko04270//Vasc-ular smooth muscle contractionGO:0008544//epidermis development

