Pangloss: A Tool for Pan-Genome Analysis of Microbial Eukaryotes


1
Genome Evolution Laboratory, Department of Biology, Maynooth University, W23 F2K8 Maynooth, Ireland
2
Human Health Research Institute, Maynooth University, W23 F2K8 Maynooth, Ireland
*
Author to whom correspondence should be addressed.
Genes 2019, 10(7), 521; https://0-doi-org.brum.beds.ac.uk/10.3390/genes10070521
Submission received: 7 June 2019
/
Revised: 5 July 2019
/
Accepted: 8 July 2019
/
Published: 10 July 2019
(This article belongs to the Special Issue Tools for Population and Evolutionary Genetics)
Abstract
:Although the pan-genome concept originated in prokaryote genomics, an increasing number of eukaryote species pan-genomes have also been analysed. However, there is a relative lack of software intended for eukaryote pan-genome analysis compared to that available for prokaryotes. In a previous study, we analysed the pan-genomes of four model fungi with a computational pipeline that constructed pan-genomes using the synteny-dependent Pan-genome Ortholog Clustering Tool (PanOCT) approach. Here, we present a modified and improved version of that pipeline which we have called Pangloss. Pangloss can perform gene prediction for a set of genomes from a given species that the user provides, constructs and optionally refines a species pan-genome from that set using PanOCT, and can perform various functional characterisation and visualisation analyses of species pan-genome data. To demonstrate Pangloss’s capabilities, we constructed and analysed a species pan-genome for the oleaginous yeast Yarrowia lipolytica and also reconstructed a previously-published species pan-genome for the opportunistic respiratory pathogen Aspergillus fumigatus. Pangloss is implemented in Python, Perl and R and is freely available under an open source GPLv3 licence via GitHub.
1. Introduction
Species pan-genomes have been extensively studied in prokaryotes, where pan-genome evolution is primarily driven by rampant horizontal gene transfer (HGT) [1,2,3,4]. Pan-genome evolution in prokaryotes can also vary substantially as a result of lifestyle and environmental factors; opportunistic pathogens such as Pseudomonas aeruginosa have large “open” pan-genomes with large proportions of accessory genes, whereas obligate intracellular parasites such as Chlamydia species have smaller “closed” pan-genomes with larger proportions of conserved core genes and a smaller pool of novel genetic content [5,6,7]. Studies of pan-genome evolution within eukaryotes has not been as extensive as that of prokaryotes to date, as eukaryote genomes are generally more difficult to sequence and assemble in large numbers relative to prokaryote genomes. However, consistent evidence for pan-genomic structure within eukaryotes has been demonstrated in plants, fungi and plankton [8,9,10,11,12]. Unlike prokaryote pan-genomes, eukaryote pan-genomes evolve via a variety of processes besides HGT, these include variations in ploidy and heterozygosity within plants [8], and cases of introgression, gene duplication and repeat-induced point mutation in fungi and plankton [9,10,11,12].
The majority of software and pipelines available for pan-genome analysis are explicitly or implicitly intended for prokaryote datasets. For example, the commonly-cited pipeline Roary is intended for use with genomic location data generated by the prokaryote genome annotation software Prokka [13,14]. A number of other methodologies such as seq-seq-pan or SplitMEM use genome alignment or de Bruijn graph-based approaches for pan-genome construction, which are usually computationally impracticable for eukaryote analysis [15,16]. Other common pan-genome methodologies, such as the Large Scale BLAST Score Ratio (LS-BSR) approach or the Markov Cluster Algorithm (MCL)/MultiParanoid-dependent Pan-genome Analysis Pipeline (PGAP), may have potential application in eukaryote pan-genome analysis but as of writing no such application has occurred [17,18,19,20]. Of the eukaryote pan-genome analyses in the literature, some construct pan-genomes by mapping and aligning sequence reads using pipelines such as the Eukaryotic Pan-genome Analysis Toolkit (EUPAN) [8,12,21], or have constructed and characterised eukaryote pan-genomes using bespoke BLAST-dependent or clustering algorithm-dependent sequence clustering approaches [9,10,12]. In a previous article, we constructed and analysed the species pan-genomes of four model fungi including Saccharomyces cerevisiae, using the synteny-based Pan-genome Ortholog Clustering Tool (PanOCT, https://sourceforge.net/projects/panoct/) method in addition to our own prediction and analysis pipelines [11,22]. PanOCT was initially developed for prokaryote pan-genome analysis, and constructs a pan-genome from a given dataset by clustering homologous sequences from different input genomes together into clusters of syntenic orthologs based on a measurement of local syntenic conservation between these sequences, referred to as a conserved gene neighbourhood (CGN) score, and BLAST score ratio (BSR) assessment of sequence similarity [22,23]. Crucially, this synteny-based approach allows PanOCT to distinguish between paralogous sequences within the same genome when assessing orthologous sequences between genomes [11].
Here, we present a refined and improved version of our PanOCT-based pan-genome analysis pipeline which we have called Pangloss. Pangloss incorporates reference-based and ab initio gene model prediction methods, and synteny-based pan-genome construction using PanOCT with an optional refinement based on reciprocal sequence similarity between clusters of syntenic orthologs. Pangloss can also perform a number of downstream characterisation analyses of eukaryote pan-genomes, including Gene Ontology (GO-slim) term enrichment in core and accessory genomes, selection analyses in core and accessory genomes and visualisation of pan-genomic data. To demonstrate the pipeline’s capabilities we have constructed and analysed a species pan-genome for the oleaginous yeast Yarrowia lipolytica using Pangloss [24]. Y. lipolytica is one of the earliest-diverging yeasts and has seen various applications as a non-conventional yeast model for protein secretion, regulation of dimorphism and lipid accumulation, and is a potential alternative source for biofuels and other oleochemicals [25,26,27,28,29,30,31]. We have also reconstructed the species pan-genome of the opportunistic respiratory pathogen Aspergillus fumigatus from a previous study as a control [11]. Pangloss is implemented in Python, Perl and R, and is freely available under an open source GPLv3 licence from http://github.com/chmccarthy/Pangloss.
2. Materials and Methods
2.1. Implementation
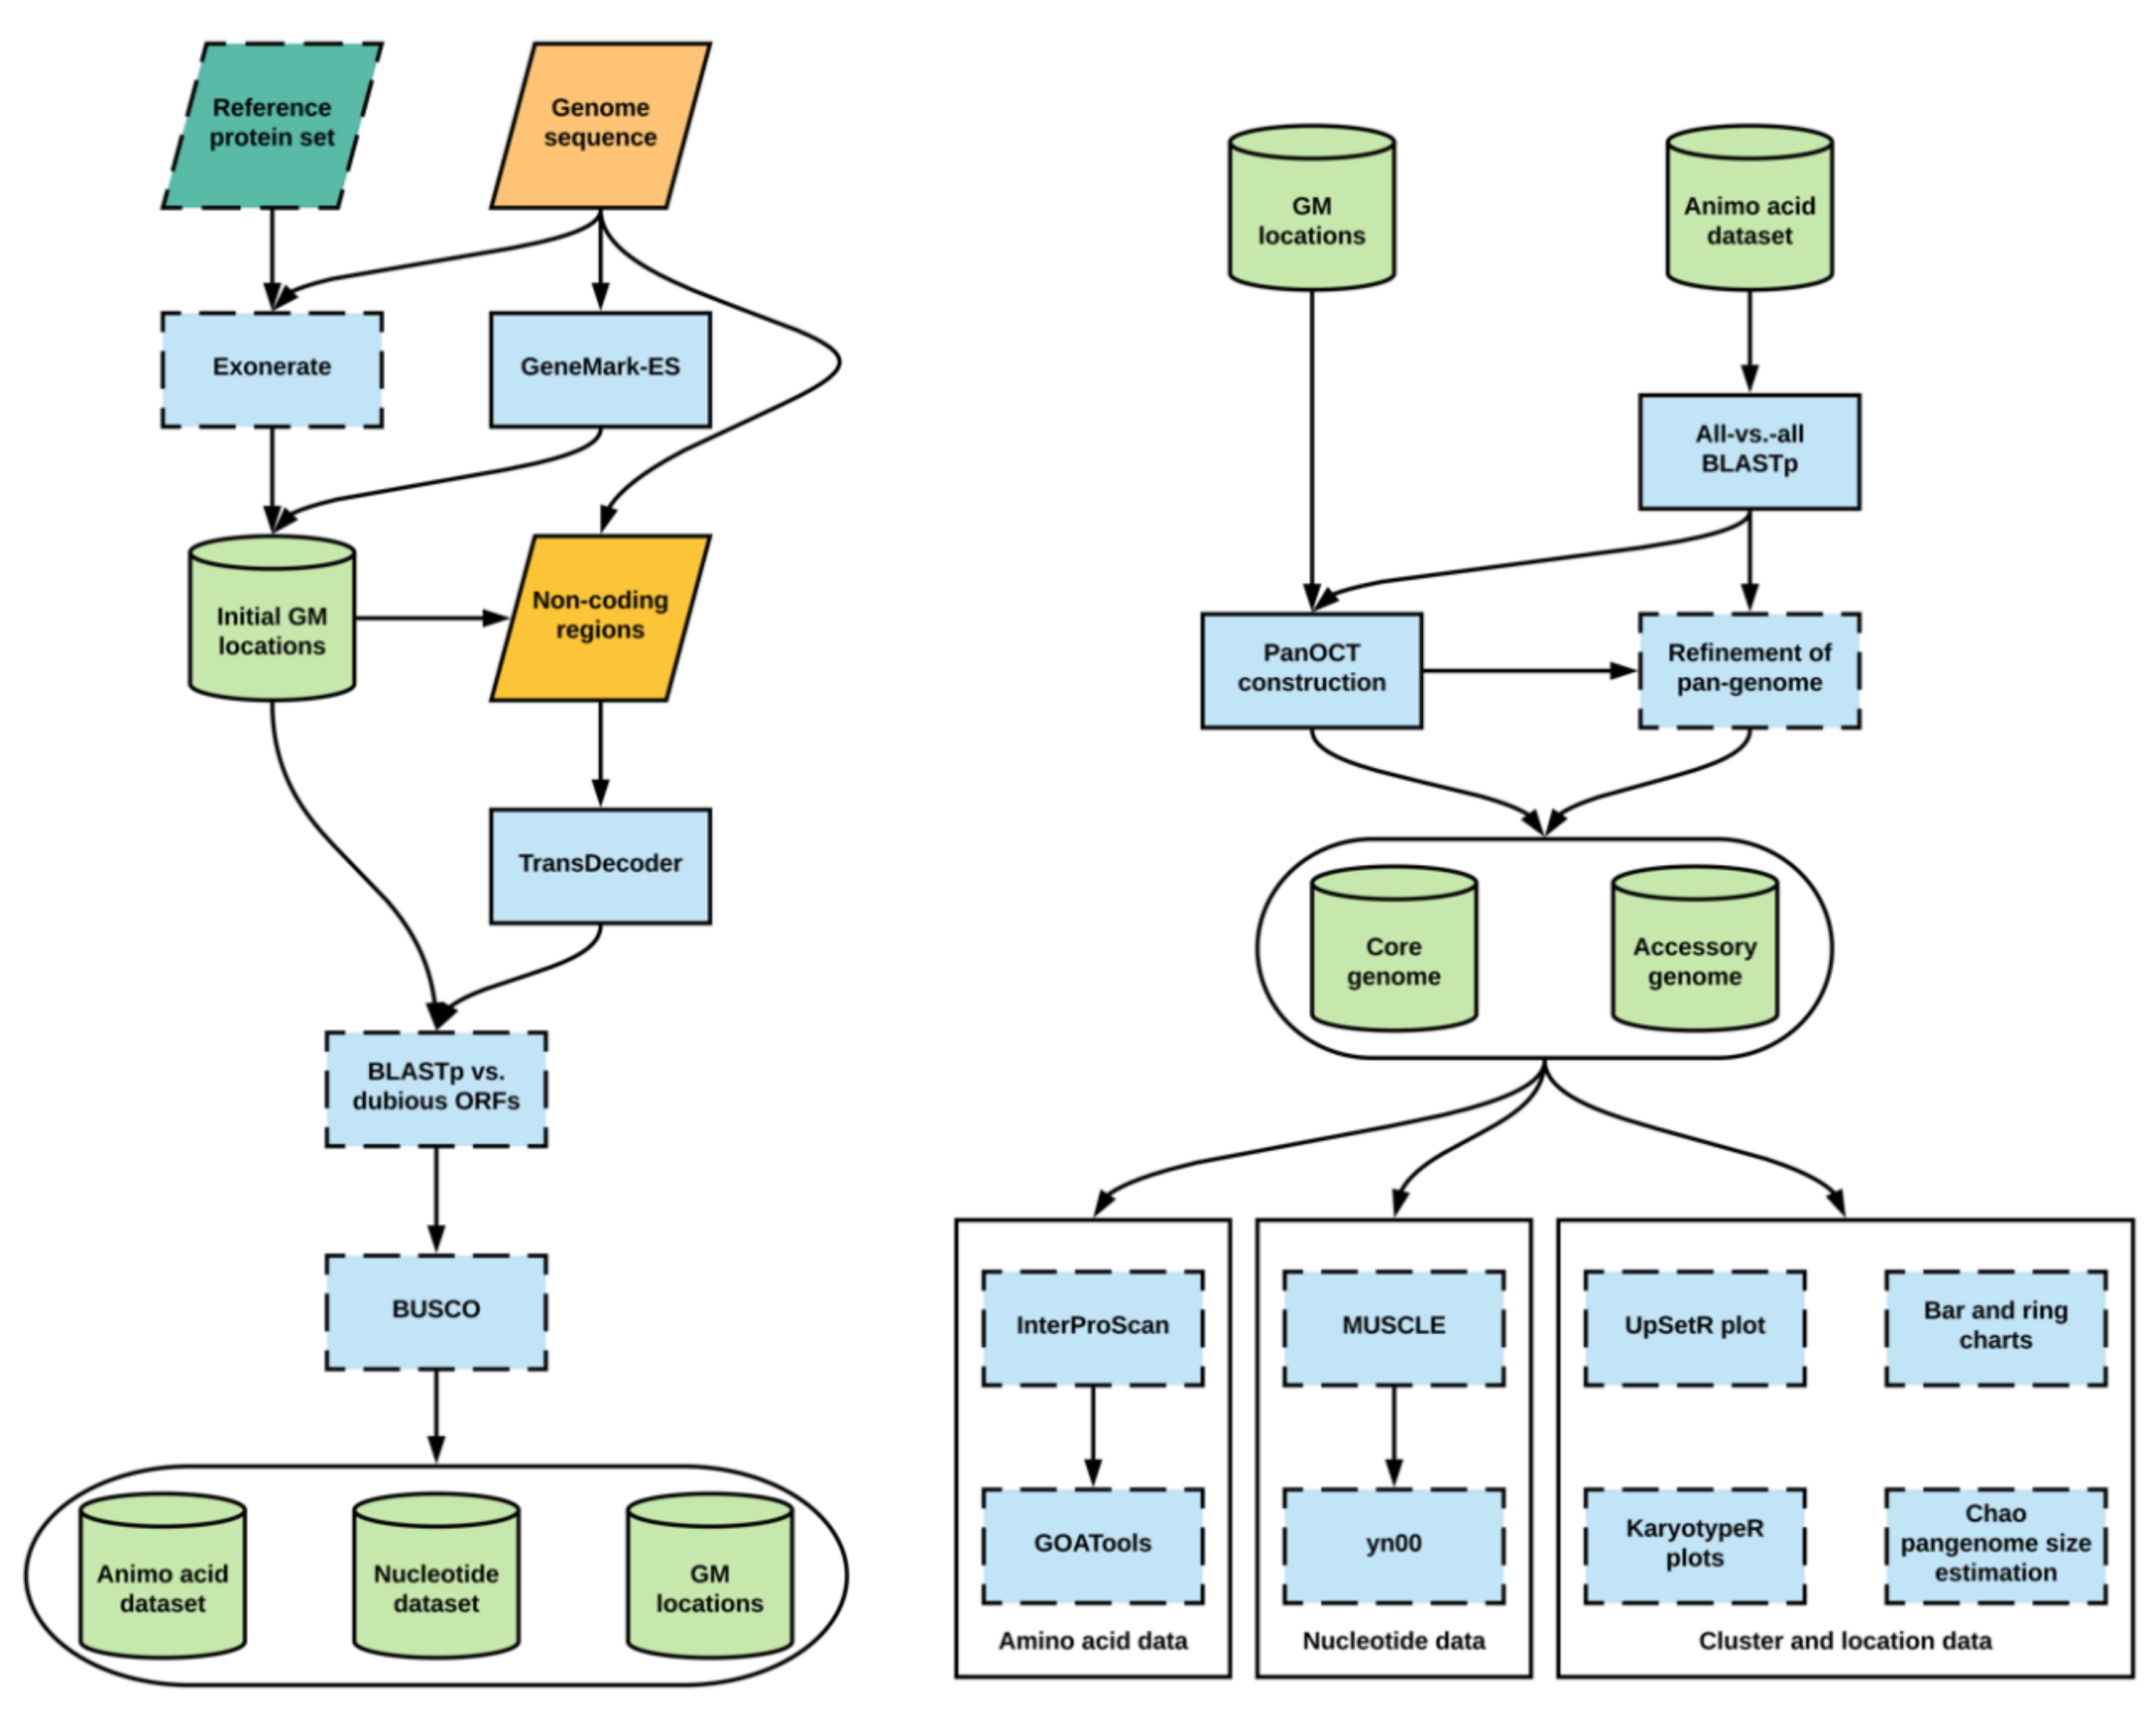
Pangloss is predominantly written in Python with some R and Perl components, and is compatible with macOS and Linux operating systems. Pangloss performs a series of gene prediction, gene annotation and functional analyses to characterise the pan-genomes of microbial eukaryotes. These analyses can be enabled by the user by invoking their corresponding flags on the command line, and many of the parameters of these analyses are controlled by Pangloss using a configuration file. The various dependencies for eukaryote pan-genome analysis using Pangloss are given in Table 1 along with versions tested and the workflow of Pangloss is given in Figure 1, both are described in greater detail below [32,33,34,35,36,37,38,39,40,41,42,43,44,45]. A user manual as well as further installation instructions and download locations for all dependencies of Pangloss are available from http://github.com/chmccarthy/Pangloss/.
2.1.1. Gene Model Prediction and Annotation
By default, Pangloss performs its own gene model prediction to generate nucleotide and protein sequence data for all gene models from each genome in a dataset (Figure 1). Pangloss also generates a set of PanOCT-compatible gene model location data for each genome. Gene model prediction can be skipped by including the argument --no_pred at the command-line if such data has already been generated, or the user can solely run gene model prediction with no downstream analysis by including the argument --pred_only at the command-line. For each genome in a dataset, up to three methods of prediction are used:
- All predicted protein sequences from a user-provided reference genome are queried against each genome using Exonerate (https://www.ebi.ac.uk/about/vertebrate-genomics/software/exonerate), with a heuristic protein2genome search model [33]. Translated gene model top-hits with an alignment score of ≥90% of the maximum possible alignment score as determined by Exonerate are retained as potential gene models. This search step is parallelized through Python’s multiprocessing library and can be optionally disabled by the user by including the argument --no_exonerate at the command-line.
- Ab initio hidden Markov model (HMM)-dependent gene model prediction is performed using GeneMark-ES (http://exon.gatech.edu/GeneMark/) with self-training enabled [38]. If the species of interest is fungal, the user can enable a fungal-specific branch point site prediction model in the configuration file. If the user has also predicted gene models via step 1, those gene models whose locations do not overlap with gene models predicted via GeneMark-ES are incorporated into the latter dataset.
- All remaining non-coding regions of the genome are extracted and subjected to position weight matrix (PWM)-dependent gene model prediction using TransDecoder (https://github.com/TransDecoder/TransDecoder/wiki) [39]. Any remaining predicted gene models with a length of ≥200 amino acids are included in the final gene model dataset.
There are a number of optional steps after that the user can take to assess the quality of gene model prediction within a dataset (Figure 1). The user can filter gene model sets for potential pseudogenes by querying a set of known dubious genes (either user-curated or from an appropriate resource such as the Saccharomyces Genome Database) against each gene model set using BLASTp (enabled via the --qc command-line argument) [46,47]. Any gene models whose top BLASTp hit against a dubious gene has sequence coverage of ≥70% are removed from further analysis. The completeness of each gene model set can also be assessed using BUSCO (https://gitlab.com/ezlab/busco) (enabled via the --busco command-line argument), with the appropriate dataset assigned by the user [41].
2.1.2. BLASTp and PanOCT Analysis
By default, all predicted gene models within a dataset are combined and an all-vs.-all BLASTp search is performed within Pangloss with a user-defined e-value cut-off (default = 10−4) (Figure 1). However, if the user prefers to perform the all-vs.-all BLASTp step on their own high-performance computational environment they can skip the search via the --no_blast command-line argument. The BLASTp search data, along with all gene models and gene model location datasets combined, are used as input for PanOCT. For a pan-genome dataset of syntenic ortholog clusters as constructed by Pangloss, clusters that contain an ortholog from all input genomes are classified as “core” clusters (containing “core” gene models) and clusters missing an ortholog from ≥1 input genomes are classified as “accessory” clusters (containing “accessory” gene models) [11]. Pangloss also generates nucleotide and amino acid datasets for every core and accessory cluster for further downstream analyses.
2.1.3. Refinement of Pan-Genome Construction Based on Reciprocal Sequence Similarity
After construction of the initial pan-genome, the user has the option of refining the pan-genome with Pangloss via the --refine command-line argument (Figure 1). This method attempts to refine the PanOCT-derived microsyntenic pan-genome by accounting for microsynteny loss due to genome assembly artefacts or genomic rearrangements. In this method, Pangloss first extracts all accessory clusters from the accessory genome and parses the previously-generated all-vs.-all BLASTp data used for PanOCT. For each accessory cluster A, Pangloss extracts the BLASTp data for each ortholog in A and generates a list of BLASTp top-hits to each strain genome not represented in A with ≥30% sequence identity. If this list matches another accessory cluster B in the accessory genome, Pangloss will then check if each ortholog in B has a reciprocal strain top-hit to each ortholog in A. If A and B satisfy this criterion they are merged into a new cluster AB, and A and B themselves are subsequently removed from the accessory genome. If this new cluster AB has an ortholog from every input strain genome in the dataset it is then reclassified as a core cluster [11].
2.1.4. Functional Annotation and Characterisation of Pan-Genome Components
There are optional arguments in Pangloss through which the user can characterise pan-genomes once they are constructed (Figure 1). If InterProScan (https://www.ebi.ac.uk/interpro/download.html) is installed, the user can select to have the entire pan-genome dataset annotated with Pfam, InterPro and gene ontology (GO) information via the --ips command-line argument [44]. Additionally, if GOAtools (https://github.com/tanghaibao/goatools) is installed, the output from InterProScan can be used to perform GO-enrichment analysis of the core and accessory components of the pan-genome via the --go command-line argument, using Fischer’s exact test (FET) with parent term propagation and false discovery rate correction (p < 0.05) using a p-value distribution generated from 500 resampled p-values [45,48].
2.1.5. Selection Analysis of Pan-Genome Using yn00
The user can perform selection analysis on core and accessory gene model clusters using yn00 from the PAML (http://abacus.gene.ucl.ac.uk/software/paml.html#download) package of phylogenetic software (enabled via the --yn00 command-line argument) (Figure 1) [43]. For each cluster in a pangenome dataset, an amino acid alignment is performed using MUSCLE (https://www.ebi.ac.uk/Tools/msa/muscle/) with the default parameters. A corresponding nucleotide alignment is then generated by Pangloss by transferring gaps in the amino acid alignment into the nucleotide data for the same cluster. yn00 selection analysis is handled by Biopython’s Bio.Phylo.PAML module (https://biopython.org/) and is run with the default parameters (universal genetic code, equal weighting of pathways between codons and estimated codon frequencies). From each cluster alignment, Pangloss will report where available the estimated transition/transversion rate ratio of the cluster (κ) and the number of pairwise alignments within the cluster that show evidence of positive selection according to Yang and Nielsen’s method where the dN/dS ratio (ω) is ≥ 1, if ω ≠ ∞ [49].
2.1.6. Visualisation of Pan-Genome Data
A number of optional methods of visualising pan-genome data are incorporated into Pangloss (Figure 1). A simple ring chart of the proportion of core and accessory gene models in a pangenome dataset is generated in R using the --size command-line argument. The same flag also generates a bar chart for the distribution of syntenic cluster sizes within a pangenome dataset and estimates the true size of the pan-genome using the Chao lower bound method in R, as previously implemented in the prokaryote pan-genome analysis package micropan [50,51]. The Chao lower bound method estimates the size of a population given a set of occurrence data for that population from singleton and doubleton occurrences [50]. In the case of pan-genomic data we can estimate the true number of syntenic clusters within a pan-genome () given the observed number of clusters (N) from the numbers of 1-member and 2-member clusters in the pan-genome (y1 and y2, respectively), as given by the equation [50]:
The Chao lower bound method is a conservative method of estimating true pan-genome size, but it is worth noting that this estimation may be skewed in cases of overabundance of singleton data (e.g., singleton genes arising from highly fragmented genomes) [51,52]. The distribution of syntenic orthologous gene models within the species accessory genome can be visualised using the R package UpSetR via the --upset command-line argument [35]. This generates an ortholog distribution plot based on the UpSet technique of visualising intersections of sets and their occurrences within a dataset using matrix representation, allowing for more input sets than similar Venn-based or Euler-based methods [53]. Finally, karyotype plots of the genomic locations of core and accessory gene models along each chromosome/contig within a genome, coloured by either pan-genome component or by syntenic cluster size, can be generated for each genome in a dataset using the Bioconductor package KaryoploteR (https://bioconductor.org/packages/release/bioc/html/karyoploteR.html) via the --karyo command-line argument [36,37].
2.2. Dataset Assembly
2.2.1. Yarrowia lipolytica
Nuclear genome assembly data for seven Yarrowia lipolytica strains was obtained from GenBank. Each strain genome was selected based on geographic and environmental distribution, information on which is found in Table S1 [24,54,55,56]. Gene model and gene model location prediction was carried out for all Y. lipolytica strain genomes using Pangloss (Figure 1). GeneMark-ES gene model prediction was performed with a fungal branching point model and TransDecoder gene model prediction was performed with an amino acid sequence length cut-off of ≥200 aa. All predicted gene model sets were filtered against a set of 936 known pseudogenes or dubious open reading frames (ORFs) from Saccharomyces cerevisiae and Candida albicans obtained from the Saccharomyces and Candida Genome Database websites respectively, with a BLASTp e-value cut-off of 10−4 [47,57]. Gene models with sequence coverage of ≥70% to a pseudogene/dubious ORF were removed from the dataset (Table S1). BUSCO analysis for each strain gene model set was performed using the Saccharomycetales dataset (Table S1). In total, 45,533 gene models were predicted across our entire Y. lipolytica pan-genome dataset, with an average of 6504 gene models per strain and BUSCO completeness per gene model set ranging from approximately 83–89% (87.9% average) (Table S1).
2.2.2. Aspergillus fumigatus
Nuclear genome assembly data for 12 Aspergillus fumigatus strains was obtained from GenBank. Each strain genome was previously used to construct an initial A. fumigatus species pan-genome using a similar approach to that implemented in Pangloss, and strains were selected based on geographic and environmental distribution including both clinical and wild-type strains [11] (Table S1). Gene model and gene model location prediction was carried out for all A. fumigatus genomes using Pangloss (Figure 1). GeneMark-ES gene model prediction was performed with a fungal branching point model and TransDecoder gene model prediction was performed with an amino acid sequence length cut-off of ≥200 aa. No filtering for pseudogenes or dubious ORFs was performed for the A. fumigatus dataset as no such data is available. BUSCO analysis for each strain gene model set was performed using the Eurotiomycetes dataset (Table S1). In total, 113,414 gene models were predicted across our entire A. fumigatus pan-genome dataset, with an average of 9451 gene models per strain and BUSCO completeness per gene model set ranging from approximately 93–97% (96% average) (Table S1).
2.3. Pangenome Analysis
2.3.1. Yarrowia lipolytica
An all-vs.-all BLASTp search for the entire Y. lipolytica dataset was performed within Pangloss with an e-value cut-off of 10−4. PanOCT analysis for the Y. lipolytica dataset was performed within Pangloss using the default parameters for PanOCT (CGN window = 5, sequence identity cut-off ≥35%). Pan-genome refinement was carried out within Pangloss (Table S1). Pfam, InterPro and gene ontology annotation of the dataset was performed using InterProScan with the default parameters [44,58,59,60]. GO-slim enrichment analysis was carried out for both the core and accessory Y. lipolytica genomes using GOATools. GO terms were mapped to the general GO-slim term basket and a Fischer’s exact test (FET) analysis with parent term propagation and false discovery rate (FDR) correction (p < 0.05) with a p-value distribution generated from 500 resampled p-values [45,48,60]. yn00 analysis of the Y. lipolytica pan-genome dataset was performed within Pangloss with the default parameters [43,49]. All plots were generated within Pangloss using its various R components as detailed above (Figure 1, Figure 2, Figure 3, Figure 4 and Figure 5).
2.3.2. Aspergillus fumigatus
An all-vs.-all BLASTp search for the entire A. fumigatus dataset was performed within Pangloss with an e-value cut-off of 10−4. PanOCT analysis for the A. fumigatus dataset was performed within Pangloss using the default parameters for PanOCT (CGN window = 5, sequence identity cut-off ≥35%). Pan-genome refinement was carried out within Pangloss (Table S1).
3. Results
3.1. Analysis of the Yarrowia lipolytica Pan-Genome
A Y. lipolytica species pan-genome was constructed with Pangloss via PanOCT using publicly-available assembly data from seven strains, including the reference CLIB122 strain and a number of other industrially-relevant strains [24,54,55,56] (Table S1). Strain genomes ranged in size from 19.7–21.3 Mb, and the majority had been assembled to near-scaffold quality (Table S1). A total of 45,533 valid Y. lipolytica gene models were predicted by Pangloss after filtering for known pseudogenes from model yeasts, for an average of ~6505 gene models per strain genome (Table S1). Pangloss constructed a refined species pan-genome for Y. lipolytica containing 6042 core syntenic clusters (42,294 gene models in total) and 972 accessory syntenic clusters (3239 gene models in total) (Figure 2, Table 2 and Table S1). This gives a core:accessory proportion split of approximately 92:8 in terms of gene models and 87:13 in terms of unique syntenic clusters (Figure 2, Table S1). These core:accessory proportions were similar to our previous analyses of other yeasts such as Saccharomyces cerevisiae (85:15) and Candida albicans (91:9) [11]. Accessory genome size in individual Y. lipolytica strains varied from 303 gene models in IBT446 to 583 gene models in H222 (Table S1). Using Chao’s lower bound method, the size of the Y. lipolytica pan-genome was estimated to contain 7970 syntenic clusters (Figure 3). 341 syntenic clusters were missing an ortholog in one strain, with 202 clusters missing an ortholog from IBT446 only, and 390 syntenic clusters consisted of a singleton gene model (Figure 3 and Figure 4). The number of singleton gene models in individual strains varied from 23 gene models in WSH-Z06 and CBA6003 to 121 gene models in H222 (Figure 4). Karyotype plots were generated for each Y. lipolytica strain in our dataset and display varying amounts of accessory gene models distributed across the six chromosomes of Y. lipolytica (e.g., CLIB122 in Figure 5a,b). This is similar to our previous observation of accessory genome distribution within the Candida albicans pan-genome, which may have arisen due to a lack of non-clinical strain genomes for that species [11]. A large accessory region in chromosome D in CLIB122 (NC_006070.1, Figure 5a,b) appears to be the result of a gapped region in the same chromosome in PO1f, presumably arising from sequencing artefacts (Figure 5a,b).
3.2. Characterisation of the Yarrowia lipolytica Pan-Genome
Selection analysis was performed for all non-singleton clusters in the Y. lipolytica core and accessory genome using yn00, which estimates synonymous and non-synonymous rates of substitution within a gene family using pairwise comparisons [43]. Of the 6042 core clusters in the Y. lipolytica pan-genome dataset, 453 clusters had at least one pairwise alignment which had ω ≥ 1 (7% of all core clusters), whereas for the 582 non-singleton accessory clusters only 52 clusters had at least one pairwise alignment with ω ≥ 1 (9% of all non-singleton accessory clusters). It is possible that the low levels of positive selection (i.e., clusters with ≥1 pairwise alignment with ω ≥ 1) within the accessory genome reflects the potential lack of evolutionary distance between the strains in our Y. lipolytica dataset. The Y. lipolytica pangenome dataset was annotated with Pfam, InterPro and gene ontology data using InterProScan [44,58,59,60]. Approximately 77% of the total dataset (35,139 gene models) contained at least one Pfam domain. GO-slim enrichment analysis was performed for both core and accessory genomes using GOATools with the default parameters as implemented in Pangloss (Table S2). Unlike our previous analysis of term enrichment in fungal pan-genomes, transport processes appear to be enriched within the core Y. lipolytica genome and processes relating to the production of organic and aromatic compounds are enriched within the accessory Y. lipolytica genome (Table S2) [11]. The former may be due to the array of the lipid transport systems that Y. lipolytica uses to live in environments rich in hydrophobic substrates [61]. Similarly, genes whose functions are related to intracellular organelle function are enriched in the Y. lipolytica core genome—this may encompass the accumulation of lipids and fatty acids within organelles and lipid body formation within the Y. lipolytica cell (Table S2) [62].
3.3. Reanalysis of the Aspergillus fumigatus Pan-Genome
As a way of assessing the quality of Pangloss’s pan-genome construction we also reconstructed a species pan-genome for Aspergillus fumigatus, the opportunistic agent of invasive aspergillosis, using a previously-analysed dataset containing both clinical and wild-type strains [11,63] (Table 2, Table S1). A total of 113,414 valid A. fumigatus gene models were predicted by Pangloss with an average of ~9451 gene models per strain genome (Table 2, Table S1). Pangloss constructed a refined species pan-genome for A. fumigatus containing 7668 core syntenic clusters (92,016 gene models in total) and 1783 accessory syntenic clusters (21,398 gene models in total) (Table 2, Table S1). This gives a core:accessory proportion split of approximately 81:19 in terms of gene models and 67:33 in terms of unique syntenic clusters (Table 2, Table S1). These core:accessory proportions are relatively in line with our previous study of the same A. fumigatus pan-genome dataset, which found core:accessory proportion splits of 83:17 in terms of gene models and 73:27 in terms of unique syntenic clusters [11]. Variation between the two A. fumigatus pan-genome analyses is a result of performing gene prediction using Exonerate in our initial analysis but not in this subsequent reanalysis [11].
4. Discussion
As pan-genome analysis of eukaryotes becomes more commonplace, ideally the amount of software to construct and characterise eukaryote pan-genome should begin to match that which is already available for prokaryotes. Our software pipeline Pangloss applies a sequence similarity and synteny-based approach from prokaryote pan-genome analysis, implemented in the previously-published Perl software PanOCT, to eukaryote pan-genome analysis and allows the user to perform their own gene prediction and downstream characterisation and visualisation of pan-genome data from one self-contained script [11,22]. Although our pipeline has been designed for eukaryote pan-genome analysis, as PanOCT is a prokaryote method in origin, Pangloss should also support prokaryote datasets—albeit with some modifications to gene model prediction strategies by the user. Unlike other common gene clustering approaches, such as MCL, PanOCT incorporates local synteny via assessing the CGN between potential orthologs as a criterion to clustering in addition to sequence similarity [19,22]. This makes PanOCT distinct from most clustering approaches in that it can distinguish orthologs from paralogs (i.e., if one assumes that “true” orthologs are more likely to be located in relatively-similar regions of their respective genomes they then should in turn be more likely to cluster together when syntenic conservation is taken into consideration). This is of particular relevance to eukaryote pan-genomes, as gene duplication plays a substantial role in eukaryote gene family and genome evolution [11,64]. Although this approach is more stringent than clustering gene families based on approaches like MCL or BLAST searches alone, it is potentially more reflective of evolution on a gene-level basis within strains of the same species.
There are ways in which our approach can be improved upon in future methodologies, both in terms of prediction and analytic strategies. For example, Pangloss has an optional Exonerate-based gene model prediction strategy which searches input genomes for translated homologs of reference sequences [33]. This is an exhaustive approach that may pick up potential gene models missed by GeneMark-ES and/or TransDecoder, but it is also time-inefficient. To search all 6472 reference protein sequences from Y. lipolytica CLIB222 against a single Y. lipolytica genome takes, on average, four hours on three threads on a server running Ubuntu 18.04.2 LTS (approximately nine sequences per minute per thread), whereas both GeneMark-ES gene model prediction with fungal point branching and subsequent ORF prediction in non-coding regions with TransDecoder performed on the same genome with the same number of threads typically takes ~30–35 min. It is for this reason primarily that we have made the Exonerate-based strategy optional for any gene prediction that is performed by Pangloss. Furthermore, PanOCT’s memory usage increases exponentially per strain added, notwithstanding the potentially complex distribution of gene models between strains themselves [11,22]. Constructing a species pan-genome using PanOCT from a small and relatively well-conserved dataset, such as that for our Y. lipolytica or A. fumigatus studies, should be achievable on most standard hardware. For larger datasets, such as our previous pan-genome analysis of 100 Saccharomyces cerevisiae genomes; however, it may be preferable to perform such analysis on a high-performance computational environment or otherwise an alternative synteny-based method of pan-genome construction may be more appropriate [11]. Finally, we would encourage users to interrogate and visualise the results of analysis using Pangloss and adjust the input parameters where appropriate for their data. In our case, the parameters which were chosen for use in Pangloss for this analysis (e.g., BLAST e-value cut-off, CGN window size) are largely based on those from our previous analysis of fungal pan-genomes or other studies using PanOCT [11,22]. Depending on the size of a pan-genome dataset or the species of interest, different cut-offs may be more suitable (e.g., for species with longer average gene lengths a lower sequence identity cut-off for PanOCT clustering than the default (>35%) may be more appropriate). Many of these parameters can be adjusted in the configuration file provided with Pangloss.
5. Conclusions
Pan-genome analysis of eukaryotes has become more common, but many of the available software for pan-genome analysis are intended for use with prokaryote data. We have developed Pangloss, a pipeline that allows users to generate input data and construct species pan-genomes for microbial eukaryotes using the synteny-dependent PanOCT method and various downstream characterisation analyses. To demonstrate the capabilities of our pipeline we constructed a species pan-genome for Yarrowia lipolytica, an oleaginous yeast with potential biotechnological applications, and performed various functional and data visualisation analyses using Pangloss. The Y. lipolytica pangenome is similar in terms of core and accessory genome proportions to previously analysed fungal pan-genomes but is unique in that biological processes such as transport are statistically-enriched in the core genome. We also used Pangloss to reconstruct a species pan-genome for the respiratory pathogen Aspergillus fumigatus using a previously-analysed dataset and found that Pangloss generated a similar pan-genomic structure for A. fumigatus to that of our previous analysis. Building on our previous work on fungal pan-genomes, this study not only provides further evidence for pan-genomic structure within eukaryote species but also presents a methodological pipeline for future eukaryote pan-genome analysis.
Supplementary Materials
The following are available online at https://www.mdpi.com/2073-4425/10/7/521/s1. Table S1, Information for Yarrowia lipolytica and Aspergillus fumigatus pan-genome datasets. Core gene models labelled in green, accessory gene models labelled in red. References and strain information taken from cited articles where available, otherwise from GenBank or similar resources with relevant links included. Table S2. GO-slim enrichment analysis for the Yarrowia lipolytica pan-genome dataset. Fischer’s exact test with FDR correction (p < 0.05) carried out using GOATools within Pangloss. All terms present in the table are either significantly over- or under-represented in either the Y. lipolytica core or accessory genome. Significantly over-represented terms labelled green, significantly under-represented terms labelled red.
Author Contributions
C.G.P.M: Conceptualization, methodology, software, formal analysis, investigation, data curation, Writing—Original draft, and Writing—Review and editing. D.A.F: Conceptualization, methodology, investigation, Writing—Review and editing, supervision, and project administration.
Funding
CGPM is funded by an Irish Research Council Government of Ireland Postgraduate Scholarship (Grant No. GOIPG/2015/2242).
Acknowledgments
The authors would like to acknowledge the original contributors to all sequencing data used in this analysis for making their data publicly available. The authors would also like to acknowledge the DJEI/DES/SFI/HEA Irish Centre for High-End Computing (ICHEC) for the provision of computational facilities and support.
Conflicts of Interest
The authors declare that they have no competing interests.
References
- Tettelin, H.; Masignani, V.; Cieslewicz, M.J.; Donati, C.; Medini, D.; Ward, N.L.; Angiuoli, S.V.; Crabtree, J.; Jones, A.L.; Durkin, A.S.; et al. Genome analysis of multiple pathogenic isolates of Streptococcus agalactiae: Implications for the microbial “pan-genome.”. Proc. Natl. Acad. Sci. USA 2005, 102, 13950–13955. [Google Scholar] [CrossRef] [PubMed]
- Medini, D.; Donati, C.; Tettelin, H.; Masignani, V.; Rappuoli, R. The microbial pan-genome. Curr. Opin. Genet. Dev. 2005, 15, 589–594. [Google Scholar] [CrossRef] [PubMed]
- Rouli, L.; Merhej, V.; Fournier, P.E.; Raoult, D. The bacterial pangenome as a new tool for analysing pathogenic bacteria. New Microbes New Infect. 2015, 7, 72–85. [Google Scholar] [CrossRef] [PubMed] [Green Version]
- Vernikos, G.; Medini, D.; Riley, D.R.; Tettelin, H. Ten years of pan-genome analyses. Curr. Opin. Microbiol. 2015, 23, 148–154. [Google Scholar] [CrossRef] [PubMed]
- Mosquera-Rendón, J.; Rada-Bravo, A.M.; Cárdenas-Brito, S.; Corredor, M.; Restrepo-Pineda, E.; Benítez-Páez, A. Pangenome-wide and molecular evolution analyses of the Pseudomonas aeruginosa species. Bmc Genom. 2016, 17, 45. [Google Scholar] [CrossRef] [PubMed]
- Lefébure, T.; Bitar, P.D.P.; Suzuki, H.; Stanhope, M.J. Evolutionary dynamics of complete Campylobacter pan-genomes and the bacterial species concept. Genome Biol. Evol. 2010, 2, 646–655. [Google Scholar] [CrossRef] [PubMed]
- Sigalova, O.; Chaplin, A.V.; Bochkareva, O.O.; Shelyakin, P.V.; Filaretov, V.A.; Akkuratov, E.; Burskaya, V.; Gelfand, M.S. Chlamydia pan-genomic analysis reveals balance between host adaptation and selective pressure to genome reduction. bioRxiv 2018, 506121. [Google Scholar] [CrossRef]
- Golicz, A.A.; Bayer, P.E.; Barker, G.C.; Edger, P.P.; Kim, H.R.; Martinez, P.A.; Chan, C.K.K.; Severn-Ellis, A.; McCombie, W.R.; Parkin, I.A.P.; et al. The pangenome of an agronomically important crop plant Brassica oleracea. Nat. Commun. 2016, 7, 13390. [Google Scholar] [CrossRef] [PubMed]
- Plissonneau, C.; Hartmann, F.E.; Croll, D. Pangenome analyses of the wheat pathogen Zymoseptoria tritici reveal the structural basis of a highly plastic eukaryotic genome. Bmc Biol. 2018, 16, 5. [Google Scholar] [CrossRef]
- Peter, J.; De Chiara, M.; Friedrich, A.; Yue, J.-X.; Pflieger, D.; Bergstrom, A.; Sigwalt, A.; Barré, B.; Freel, K.; Llored, A.; et al. Genome evolution across 1,011 Saccharomyces cerevisiae isolates. Nature 2018, 556, 339–344. [Google Scholar] [CrossRef]
- McCarthy, C.G.P.; Fitzpatrick, D.A. Pan-genome analyses of model fungal species. Microb. Genom. 2019, 5, 1–23. [Google Scholar] [CrossRef] [PubMed]
- Read, B.A.; Kegel, J.; Klute, M.J.; Kuo, A.; Lefebvre, S.C.; Maumus, F.; Mayer, C.; Miller, J.; Monier, A.; Salamov, A.; et al. Pan genome of the phytoplankton Emiliania underpins its global distribution. Nature 2013, 499, 209–213. [Google Scholar] [CrossRef] [PubMed]
- Page, A.J.; Cummins, C.A.; Hunt, M.; Wong, V.K.; Reuter, S.; Holden, M.T.G.; Fookes, M.; Falush, D.; Keane, J.A.; Parkhill, J. Roary: Rapid large-scale prokaryote pan genome analysis. Bioinformatics 2015, 31, 3691–3693. [Google Scholar] [CrossRef] [PubMed]
- Seemann, T. Prokka: Rapid prokaryotic genome annotation. Bioinformatics 2014, 30, 2068–2069. [Google Scholar] [CrossRef] [PubMed]
- Jandrasits, C.; Dabrowski, P.W.; Fuchs, S.; Renard, B.Y. seq-seq-pan: building a computational pan-genome data structure on whole genome alignment. Bmc Genom. 2018, 19, 47. [Google Scholar] [CrossRef] [PubMed]
- Marcus, S.; Lee, H.; Schatz, M.C. SplitMEM: A graphical algorithm for pan-genome analysis with suffix skips. Bioinformatics 2014, 30, 3476–3483. [Google Scholar] [CrossRef]
- Sahl, J.W.; Caporaso, J.G.; Rasko, D.A.; Keim, P. The large-scale blast score ratio (LS-BSR) pipeline: a method to rapidly compare genetic content between bacterial genomes. PeerJ 2014, 2, e332. [Google Scholar] [CrossRef] [PubMed] [Green Version]
- Enright, A.J.; Van Dongen, S.; Ouzounis, C.A. An efficient algorithm for large-scale detection of protein families. Nucleic Acids Res. 2002, 30, 1575–1584. [Google Scholar] [CrossRef]
- Alexeyenko, A.; Tamas, I.; Liu, G.; Sonnhammer, E.L.L. Automatic clustering of orthologs and inparalogs shared by multiple proteomes. Bioinformatics 2006, 22, e9–e15. [Google Scholar] [CrossRef] [Green Version]
- Zhao, Y.; Wu, J.; Yang, J.; Sun, S.; Xiao, J.; Yu, J. PGAP: Pan-genomes analysis pipeline. Bioinformatics 2012, 28, 416–418. [Google Scholar] [CrossRef]
- Hu, Z.; Sun, C.; Lu, K.C.; Chu, X.; Zhao, Y.; Lu, J.; Shi, J.; Wei, C. EUPAN enables pan-genome studies of a large number of eukaryotic genomes. Bioinformatics 2017, 33, 2408–2409. [Google Scholar] [CrossRef] [PubMed]
- Fouts, D.E.; Brinkac, L.; Beck, E.; Inman, J.; Sutton, G. PanOCT: Automated clustering of orthologs using conserved gene neighborhood for pan-genomic analysis of bacterial strains and closely related species. Nucleic Acids Res. 2012, 40, e172. [Google Scholar] [CrossRef] [PubMed]
- Rasko, D.A.; Myers, G.S.A.; Ravel, J. Visualization of comparative genomic analyses by BLAST score ratio. Bmc Bioinform. 2005, 6, 2. [Google Scholar] [CrossRef] [PubMed]
- Dujon, B.; Sherman, D.; Fischer, G.; Durrens, P.; Casaregela, S.; Lafentaine, I.; De Montigny, J.; Marck, C.; Neuvéglise, C.; Talla, E.; et al. Genome evolution in yeasts. Nature 2004, 430, 35–44. [Google Scholar] [CrossRef] [PubMed]
- Shen, X.-X.; Zhou, X.; Kominek, J.; Kurtzman, C.P.; Hittinger, C.T.; Rokas, A. Reconstructing the Backbone of the Saccharomycotina Yeast Phylogeny Using Genome-Scale Data. G3 Genes Genomes Genet. 2016, 6, 3927–3939. [Google Scholar] [CrossRef] [PubMed]
- O’Brien, C.E.; McCarthy, C.G.P.; Walshe, A.E.; Shaw, D.R.; Sumski, D.A.; Krassowski, T.; Fitzpatrick, D.A.; Butler, G. Genome analysis of the yeast Diutina catenulata, a member of the Debaryomycetaceae/Metschnikowiaceae (CTG-Ser) clade. PLoS ONE 2018, 13, e0198957. [Google Scholar] [CrossRef]
- Nicaud, J.M. Yarrowia lipolytica. Yeast 2012, 29, 409–418. [Google Scholar] [CrossRef]
- Adrio, J.L. Oleaginous yeasts: Promising platforms for the production of oleochemicals and biofuels. Biotechnol. Bioeng. 2017, 114, 1915–1920. [Google Scholar] [CrossRef]
- Friedlander, J.; Tsakraklides, V.; Kamineni, A.; Greenhagen, E.H.; Consiglio, A.L.; MacEwen, K.; Crabtree, D.V.; Afshar, J.; Nugent, R.L.; Hamilton, M.A.; et al. Engineering of a high lipid producing Yarrowia lipolytica strain. Biotechnol. Biofuels 2016, 9, 77. [Google Scholar] [CrossRef]
- Qiao, K.; Wasylenko, T.M.; Zhou, K.; Xu, P.; Stephanopoulos, G. Lipid production in Yarrowia lipolytica is maximized by engineering cytosolic redox metabolism. Nat. Biotechnol. 2017, 35, 173–177. [Google Scholar] [CrossRef]
- Zeng, W.; Fang, F.; Liu, S.; Du, G.; Chen, J.; Zhou, J. Comparative genomics analysis of a series of Yarrowia lipolytica WSH-Z06 mutants with varied capacity for α-ketoglutarate production. J. Biotechnol. 2016, 239, 76–82. [Google Scholar] [CrossRef] [PubMed]
- Cock, P.J.A.; Antao, T.; Chang, J.T.; Chapman, B.A.; Cox, C.J.; Dalke, A.; Friedberg, I.; Hamelryck, T.; Kauff, F.; Wilczynski, B.; et al. Biopython: Freely available Python tools for computational molecular biology and bioinformatics. Bioinformatics 2009, 25, 1422–1423. [Google Scholar] [CrossRef] [PubMed]
- Slater, G.S.C.; Birney, E. Automated generation of heuristics for biological sequence comparison. Bmc Bioinform. 2005, 6, 31. [Google Scholar] [CrossRef] [PubMed]
- Wickham, H. ggplot2. Wiley Interdiscip. Rev. Comput. Stat. 2011, 3, 180–185. [Google Scholar] [CrossRef]
- Conway, J.R.; Lex, A.; Gehlenborg, N. UpSetR: An R package for the visualization of intersecting sets and their properties. Bioinformatics 2017, 33, 2938–2940. [Google Scholar] [CrossRef]
- Obenchain, V.; Bravo, H.C.; Huber, W.; Lawrence, M.; Carlson, M.; MacDonald, J.; Carey, V.J.; Irizarry, R.A.; Love, M.I.; Hahne, F.; et al. Orchestrating high-throughput genomic analysis with Bioconductor. Nat. Methods 2015, 12, 115–121. [Google Scholar] [CrossRef]
- Gel, B.; Serra, E. KaryoploteR: An R/Bioconductor package to plot customizable genomes displaying arbitrary data. Bioinformatics 2017, 33, 3088–3090. [Google Scholar] [CrossRef]
- Ter-Hovhannisyan, V.; Lomsadze, A.; Chernoff, Y.O.; Borodovsky, M. Gene prediction in novel fungal genomes using an ab initio algorithm with unsupervised training. Genome Res. 2008, 18, 1979–1990. [Google Scholar] [CrossRef] [Green Version]
- Haas, B.J.; Papanicolaou, A.; Yassour, M.; Grabherr, M.; Blood, P.D.; Bowden, J.; Couger, M.B.; Eccles, D.; Li, B.; Lieber, M.; et al. De novo transcript sequence reconstruction from RNA-seq using the Trinity platform for reference generation and analysis. Nat. Protoc. 2013, 8, 1494–1512. [Google Scholar] [CrossRef]
- Camacho, C.; Coulouris, G.; Avagyan, V.; Ma, N.; Papadopoulos, J.; Bealer, K.; Madden, T.L. BLAST+: Architecture and applications. Bmc Bioinform. 2009, 10, 421. [Google Scholar] [CrossRef]
- Simão, F.A.; Waterhouse, R.M.; Ioannidis, P.; Kriventseva, E.V.; Zdobnov, E.M. BUSCO: Assessing genome assembly and annotation completeness with single-copy orthologs. Bioinformatics 2015, 31, 3210–3212. [Google Scholar] [CrossRef] [PubMed]
- Edgar, R.C. MUSCLE: Multiple sequence alignment with high accuracy and high throughput. Nucleic Acids Res. 2004, 32, 1792–1797. [Google Scholar] [CrossRef] [PubMed]
- Yang, Z. PAML 4: Phylogenetic analysis by maximum likelihood. Mol. Biol. Evol. 2007, 24, 1586–1591. [Google Scholar] [CrossRef] [PubMed]
- Jones, P.; Binns, D.; Chang, H.-Y.Y.; Fraser, M.; Li, W.; McAnulla, C.; McWilliam, H.; Maslen, J.; Mitchell, A.; Nuka, G.; et al. InterProScan 5: Genome-scale protein function classification. Bioinformatics 2014, 30, 1236–1240. [Google Scholar] [CrossRef] [PubMed]
- Klopfenstein, D.V.; Zhang, L.; Pedersen, B.S.; Ramírez, F.; Vesztrocy, A.W.; Naldi, A.; Mungall, C.J.; Yunes, J.M.; Botvinnik, O.; Weigel, M.; et al. GOATOOLS: A Python library for Gene Ontology analyses. Sci. Rep. 2018, 8, 10872. [Google Scholar] [CrossRef] [PubMed]
- Altschul, S.F.; Gish, W.; Miller, W.; Myers, E.W.; Lipman, D.J. Basic local alignment search tool. J. Mol. Biol. 1990, 215, 403–410. [Google Scholar] [CrossRef]
- Engel, S.R.; Cherry, J.M. The new modern era of yeast genomics: Community sequencing and the resulting annotation of multiple Saccharomyces cerevisiae strains at the Saccharomyces Genome Database. Database 2013, 2013, bat012. [Google Scholar] [CrossRef] [PubMed]
- Agresti, A. Categorical Data Analysis; Wiley Series in Probability and Statistics; John Wiley and Sons Inc.: Hoboken, NJ, USA, 2002; ISBN 0471360937. [Google Scholar]
- Yang, Z.; Nielsen, R. Estimating synonymous and nonsynonymous substitution rates under realistic evolutionary models. Mol. Biol. Evol. 2000, 17, 32–43. [Google Scholar] [CrossRef] [PubMed]
- Chao, A. Non-parametric estimation of the classes in a population. Scand. J. Stat. 1984, 11, 265–270. [Google Scholar] [CrossRef]
- Snipen, L.; Liland, K.H. micropan: An R-package for microbial pan-genomics. Bmc Bioinform. 2015, 16, 1–8. [Google Scholar] [CrossRef] [PubMed]
- Böhning, D.; Kaskasamkul, P.; van der Heijden, P.G.M. A modification of Chao’s lower bound estimator in the case of one-inflation. Metrika 2019, 82, 361–384. [Google Scholar] [CrossRef]
- Lex, A.; Gehlenborg, N.; Strobelt, H.; Vuillemot, R.; Pfister, H. UpSet: Visualization of intersecting sets. Ieee Trans. Vis. Comput. Graph. 2014, 20, 1983–1992. [Google Scholar] [CrossRef] [PubMed]
- Liu, L.; Alper, H.S. Draft Genome Sequence of the Oleaginous Yeast Yarrowia lipolytica PO1f, a Commonly Used Metabolic Engineering Host. Genome Announc. 2014, 2. [Google Scholar] [CrossRef] [PubMed]
- Magnan, C.; Yu, J.; Chang, I.; Jahn, E.; Kanomata, Y.; Wu, J.; Zeller, M.; Oakes, M.; Baldi, P.; Sandmeyer, S. Sequence assembly of Yarrowia lipolytica strain W29/CLIB89 shows transposable element diversity. PLoS ONE 2016, 11, e0162363. [Google Scholar] [CrossRef] [PubMed]
- Devillers, H.; Neuvéglise, C. Genome Sequence of the Oleaginous Yeast Yarrowia lipolytica H222. Microbiol. Resour. Announc. 2019, 8. [Google Scholar] [CrossRef] [PubMed]
- Skrzypek, M.S.; Binkley, J.; Binkley, G.; Miyasato, S.R.; Simison, M.; Sherlock, G. The Candida Genome Database (CGD): Incorporation of Assembly 22, systematic identifiers and visualization of high throughput sequencing data. Nucleic Acids Res. 2017, 45, D592–D596. [Google Scholar] [CrossRef]
- Finn, R.D.; Coggill, P.; Eberhardt, R.Y.; Eddy, S.R.; Mistry, J.; Mitchell, A.L.; Potter, S.C.; Punta, M.; Qureshi, M.; Sangrador-Vegas, A.; et al. The Pfam protein families database: Towards a more sustainable future. Nucleic Acids Res. 2015, 44, D279–D285. [Google Scholar] [CrossRef]
- Hunter, S.; Jones, P.; Mitchell, A.; Apweiler, R.; Attwood, T.K.; Bateman, A.; Bernard, T.; Binns, D.; Bork, P.; Burge, S.; et al. InterPro in 2011: New developments in the family and domain prediction database. Nucleic Acids Res. 2012, 40, D306–D312. [Google Scholar] [CrossRef]
- Carbon, S.; Dietze, H.; Lewis, S.E.; Mungall, C.J.; Munoz-Torres, M.C.; Basu, S.; Chisholm, R.L.; Dodson, R.J.; Fey, P.; Thomas, P.D.; et al. Expansion of the gene ontology knowledgebase and resources: The gene ontology consortium. Nucleic Acids Res. 2017, 45, D331–D338. [Google Scholar] [CrossRef]
- Thevenieau, F.; Beopoulos, A.; Desfougeres, T.; Sabirova, J.; Albertin, K.; Zinjarde, S.; Nicaud, J.-M. Uptake and Assimilation of Hydrophobic Substrates by the Oleaginous Yeast Yarrowia lipolytica. In Handbook of Hydrocarbon and Lipid Microbiology; Springer: Berlin/Heidelberg, Germany, 2009; pp. 1513–1527. [Google Scholar]
- Mlíčková, K.; Roux, E.; Athenstaedt, K.; D’Andrea, S.; Daum, G.; Chardot, T.; Nicaud, J.M. Lipid accumulation, lipid body formation, and acyl coenzyme A oxidases of the yeast Yarrowia lipolytica. Appl. Env. Microbiol. 2004, 70, 3918–3924. [Google Scholar] [CrossRef]
- Nierman, W.C.; Pain, A.; Anderson, M.J.; Wortman, J.R.; Kim, H.S.; Arroyo, J.; Berriman, M.; Abe, K.; Archer, D.B.; Bermejo, C.; et al. Genomic sequence of the pathogenic and allergenic filamentous fungus Aspergillus fumigatus. Nature 2005, 438, 1151–1156. [Google Scholar] [CrossRef] [PubMed]
- Friedman, R.; Hughes, A.L. Gene duplication and the structure of eukaryotic genomes. Genome Res. 2001, 11, 373–381. [Google Scholar] [CrossRef] [PubMed]
Figure 1.
Workflow of Pangloss. Optional analyses represented with dotted borders. Refer to implementation for further information. GM: Gene model.
Figure 1.
Workflow of Pangloss. Optional analyses represented with dotted borders. Refer to implementation for further information. GM: Gene model.

Figure 2.
Pan-genome of Yarrowia lipolytica represented as a ring chart of proportions of core and accessory ortholog clusters within the total dataset. Modified from original figure generated by Pangloss. Core proportions coloured in green, accessory proportions coloured in red.
Figure 2.
Pan-genome of Yarrowia lipolytica represented as a ring chart of proportions of core and accessory ortholog clusters within the total dataset. Modified from original figure generated by Pangloss. Core proportions coloured in green, accessory proportions coloured in red.

Figure 3.
Bar chart representing the distribution of syntenic cluster sizes within Yarrowia lipolytica pan-genome and Chao’s lower bound estimation of true pan-genome size. Figure generated by Pangloss.
Figure 3.
Bar chart representing the distribution of syntenic cluster sizes within Yarrowia lipolytica pan-genome and Chao’s lower bound estimation of true pan-genome size. Figure generated by Pangloss.

Figure 4.
UpSet plot of the distribution of syntenic orthologs within the Yarrowia lipolytica accessory genome, ranked by syntenic cluster frequency. UpSet plots represent intersections between sets within data as a matrix and the number of occurrences of those intersections as a bar chart. In our case, the set intersection matrix represents clusters which contain a syntenic ortholog from 1–6 strains in our dataset and the number of their occurrences is given by the bar chart. Numbers of singleton clusters range from 22 in WSH-Z06 to 121 in H222. Figure generated by Pangloss.

Figure 5.
Karyotype plots of core and accessory gene model locations across the six chromosomes of Yarrowia lipolytica strain CLIB122. Left: (a) Gene model locations coloured by source pan-genome component (core: green, accessory: red). Right: (b) Gene model locations coloured by the size of their source syntenic cluster. Non-coding regions coloured in grey. Both figures generated by Pangloss.


Table 1.
List of various dependencies for Pangloss, versions tested in parentheses. PanOCT included with Pangloss. See http://github.com/chmccarthy/Pangloss/ for download location and detailed installation instructions for each dependency.
Table 1.
List of various dependencies for Pangloss, versions tested in parentheses. PanOCT included with Pangloss. See http://github.com/chmccarthy/Pangloss/ for download location and detailed installation instructions for each dependency.
| Dependencies | Function |
|---|---|
| Python (2.7.10) *. BioPython (1.7.3) [32] | Base environment for Pangloss. |
| Exonerate (2.4) [33], GeneMark-ES (4.3.8) [38], TransDecoder (5.5) [39] | Gene model prediction. |
| BLAST+ (2.9.0) [40] | All-vs.-all sequence similarity search, dubious gene similarity search. |
| BUSCO (3.1) [41] | Gene model set completeness analysis. |
| PanOCT (3.2) [22] | Pan-genome construction. |
| MUSCLE (3.8.31) [42], PAML (4.8) [43] | Selection analysis of core/accessory cluster alignment using yn00. |
| InterProScan (5.34)† [44], GOATools (0.8.12) [45] | Functional classification and functional enrichment analysis of pan-genome. |
| R (3.6), ggplot (3.2) [34], ggrepel (0.8.1), UpSetR (1.4) [35], Bioconductor (3.9) [36], KaryoploteR (1.10.3) [37] | Visualisation of pan-genome size and distributions across genomes. |
* Required for all analyses. † InterProScan is only available for Linux distributions.
Table 2.
Pan-genomes of Yarrowia lipolytica and Aspergillus fumigatus. Refer to Table S1 for further information including strain assembly statistics, BUSCO completeness and links to relevant literature.
Table 2.
Pan-genomes of Yarrowia lipolytica and Aspergillus fumigatus. Refer to Table S1 for further information including strain assembly statistics, BUSCO completeness and links to relevant literature.
| Species | Strains | Core Genome | Accessory Genome | Pan-Genome | |||
|---|---|---|---|---|---|---|---|
| Gene Models | Clusters | Gene Models | Clusters | Gene Models | Clusters | ||
| Yarrowia lipolytica | 7 | 42,294 | 6042 | 3239 | 972 | 45,533 | 7014 |
| Aspergillus fumigatus | 12 | 92,016 | 7668 | 21,398 | 3727 | 113,414 | 11,395 |
© 2019 by the authors. Licensee MDPI, Basel, Switzerland. This article is an open access article distributed under the terms and conditions of the Creative Commons Attribution (CC BY) license (http://creativecommons.org/licenses/by/4.0/).
Share and Cite
MDPI and ACS Style
McCarthy, C.G.P.; Fitzpatrick, D.A. Pangloss: A Tool for Pan-Genome Analysis of Microbial Eukaryotes. Genes 2019, 10, 521. https://0-doi-org.brum.beds.ac.uk/10.3390/genes10070521
AMA Style
McCarthy CGP, Fitzpatrick DA. Pangloss: A Tool for Pan-Genome Analysis of Microbial Eukaryotes. Genes. 2019; 10(7):521. https://0-doi-org.brum.beds.ac.uk/10.3390/genes10070521
Chicago/Turabian StyleMcCarthy, Charley G. P., and David A. Fitzpatrick. 2019. "Pangloss: A Tool for Pan-Genome Analysis of Microbial Eukaryotes" Genes 10, no. 7: 521. https://0-doi-org.brum.beds.ac.uk/10.3390/genes10070521
Note that from the first issue of 2016, this journal uses article numbers instead of page numbers. See further details here.