Comparative Transcriptome Analysis of Gene Expression and Regulatory Characteristics Associated with Different Vernalization Periods in Brassica rapa

 , and
, and 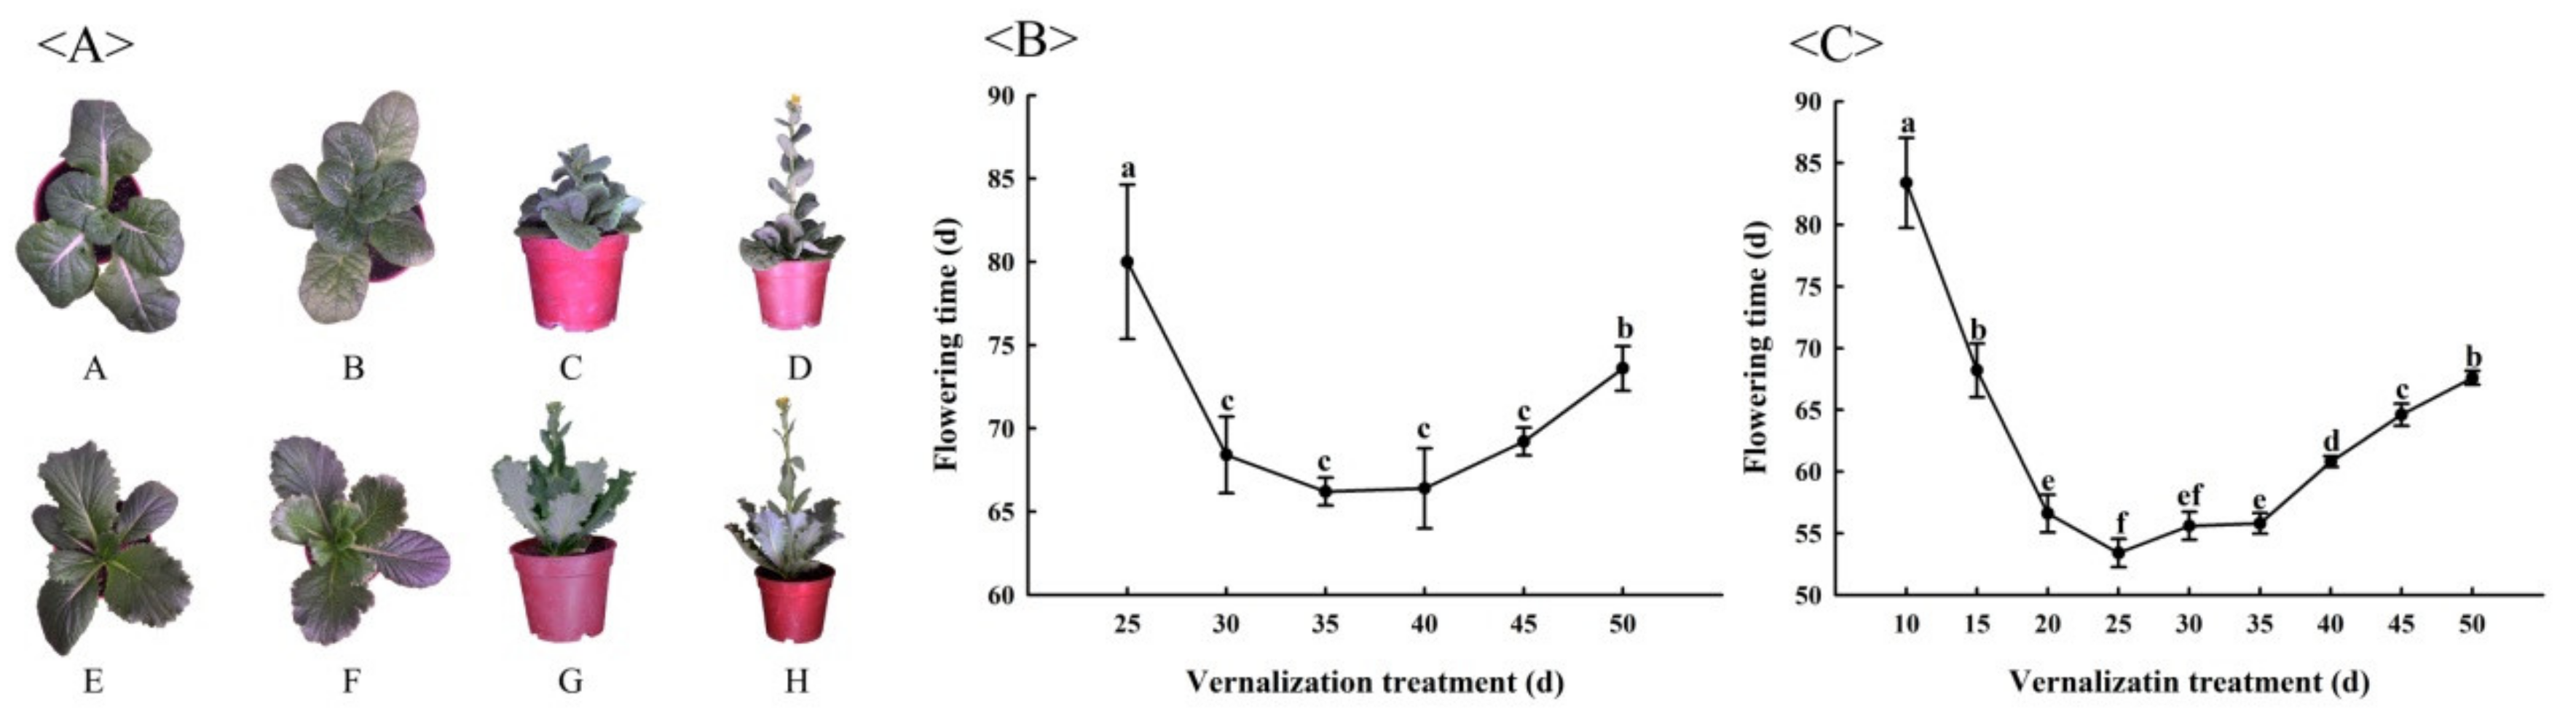
Abstract
:1. Introduction
2. Materials and Methods
2.1. Plant Materials andTreatments
2.2. RNA Extraction and Illumina Sequencing
2.3. Transcriptome Analysis
2.4. Self-Organizing Feature MapAnalysis
2.5. Gene Annotations andqRT-PCR
3. Results
3.1. Confirmation of Investigation Periods
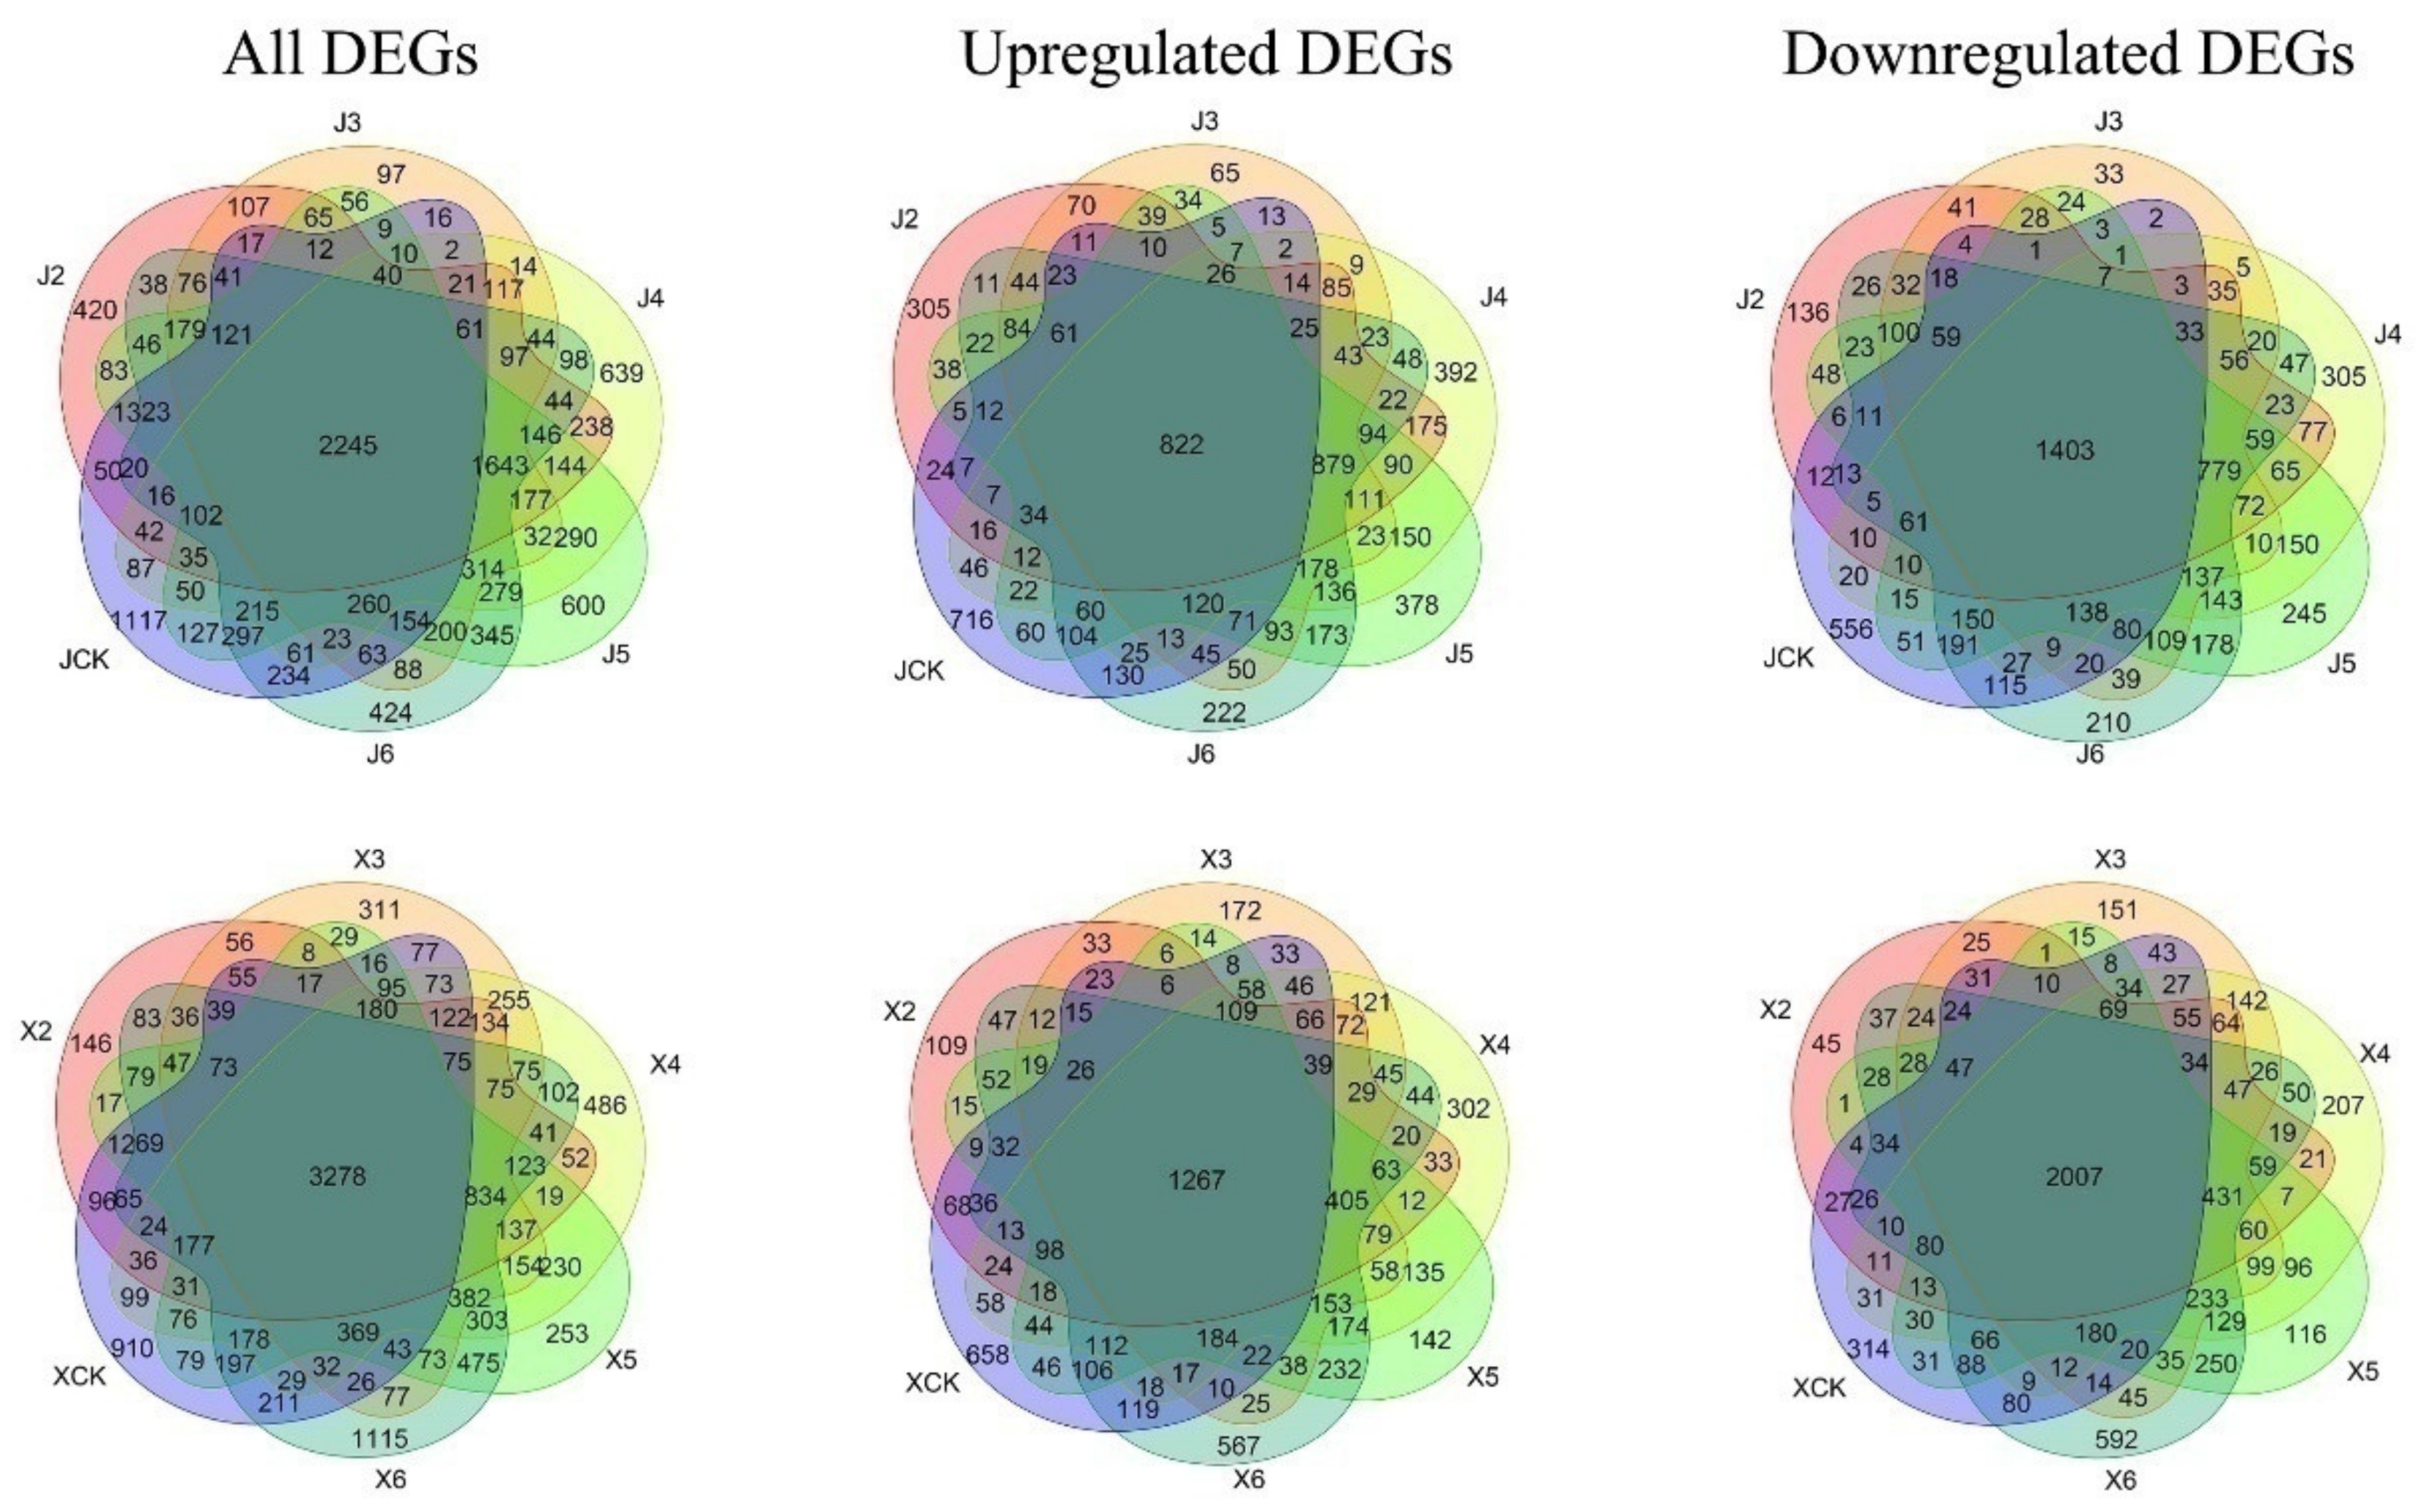
3.2. DEG Analysis of ‘JWW’ and ‘XBJ’
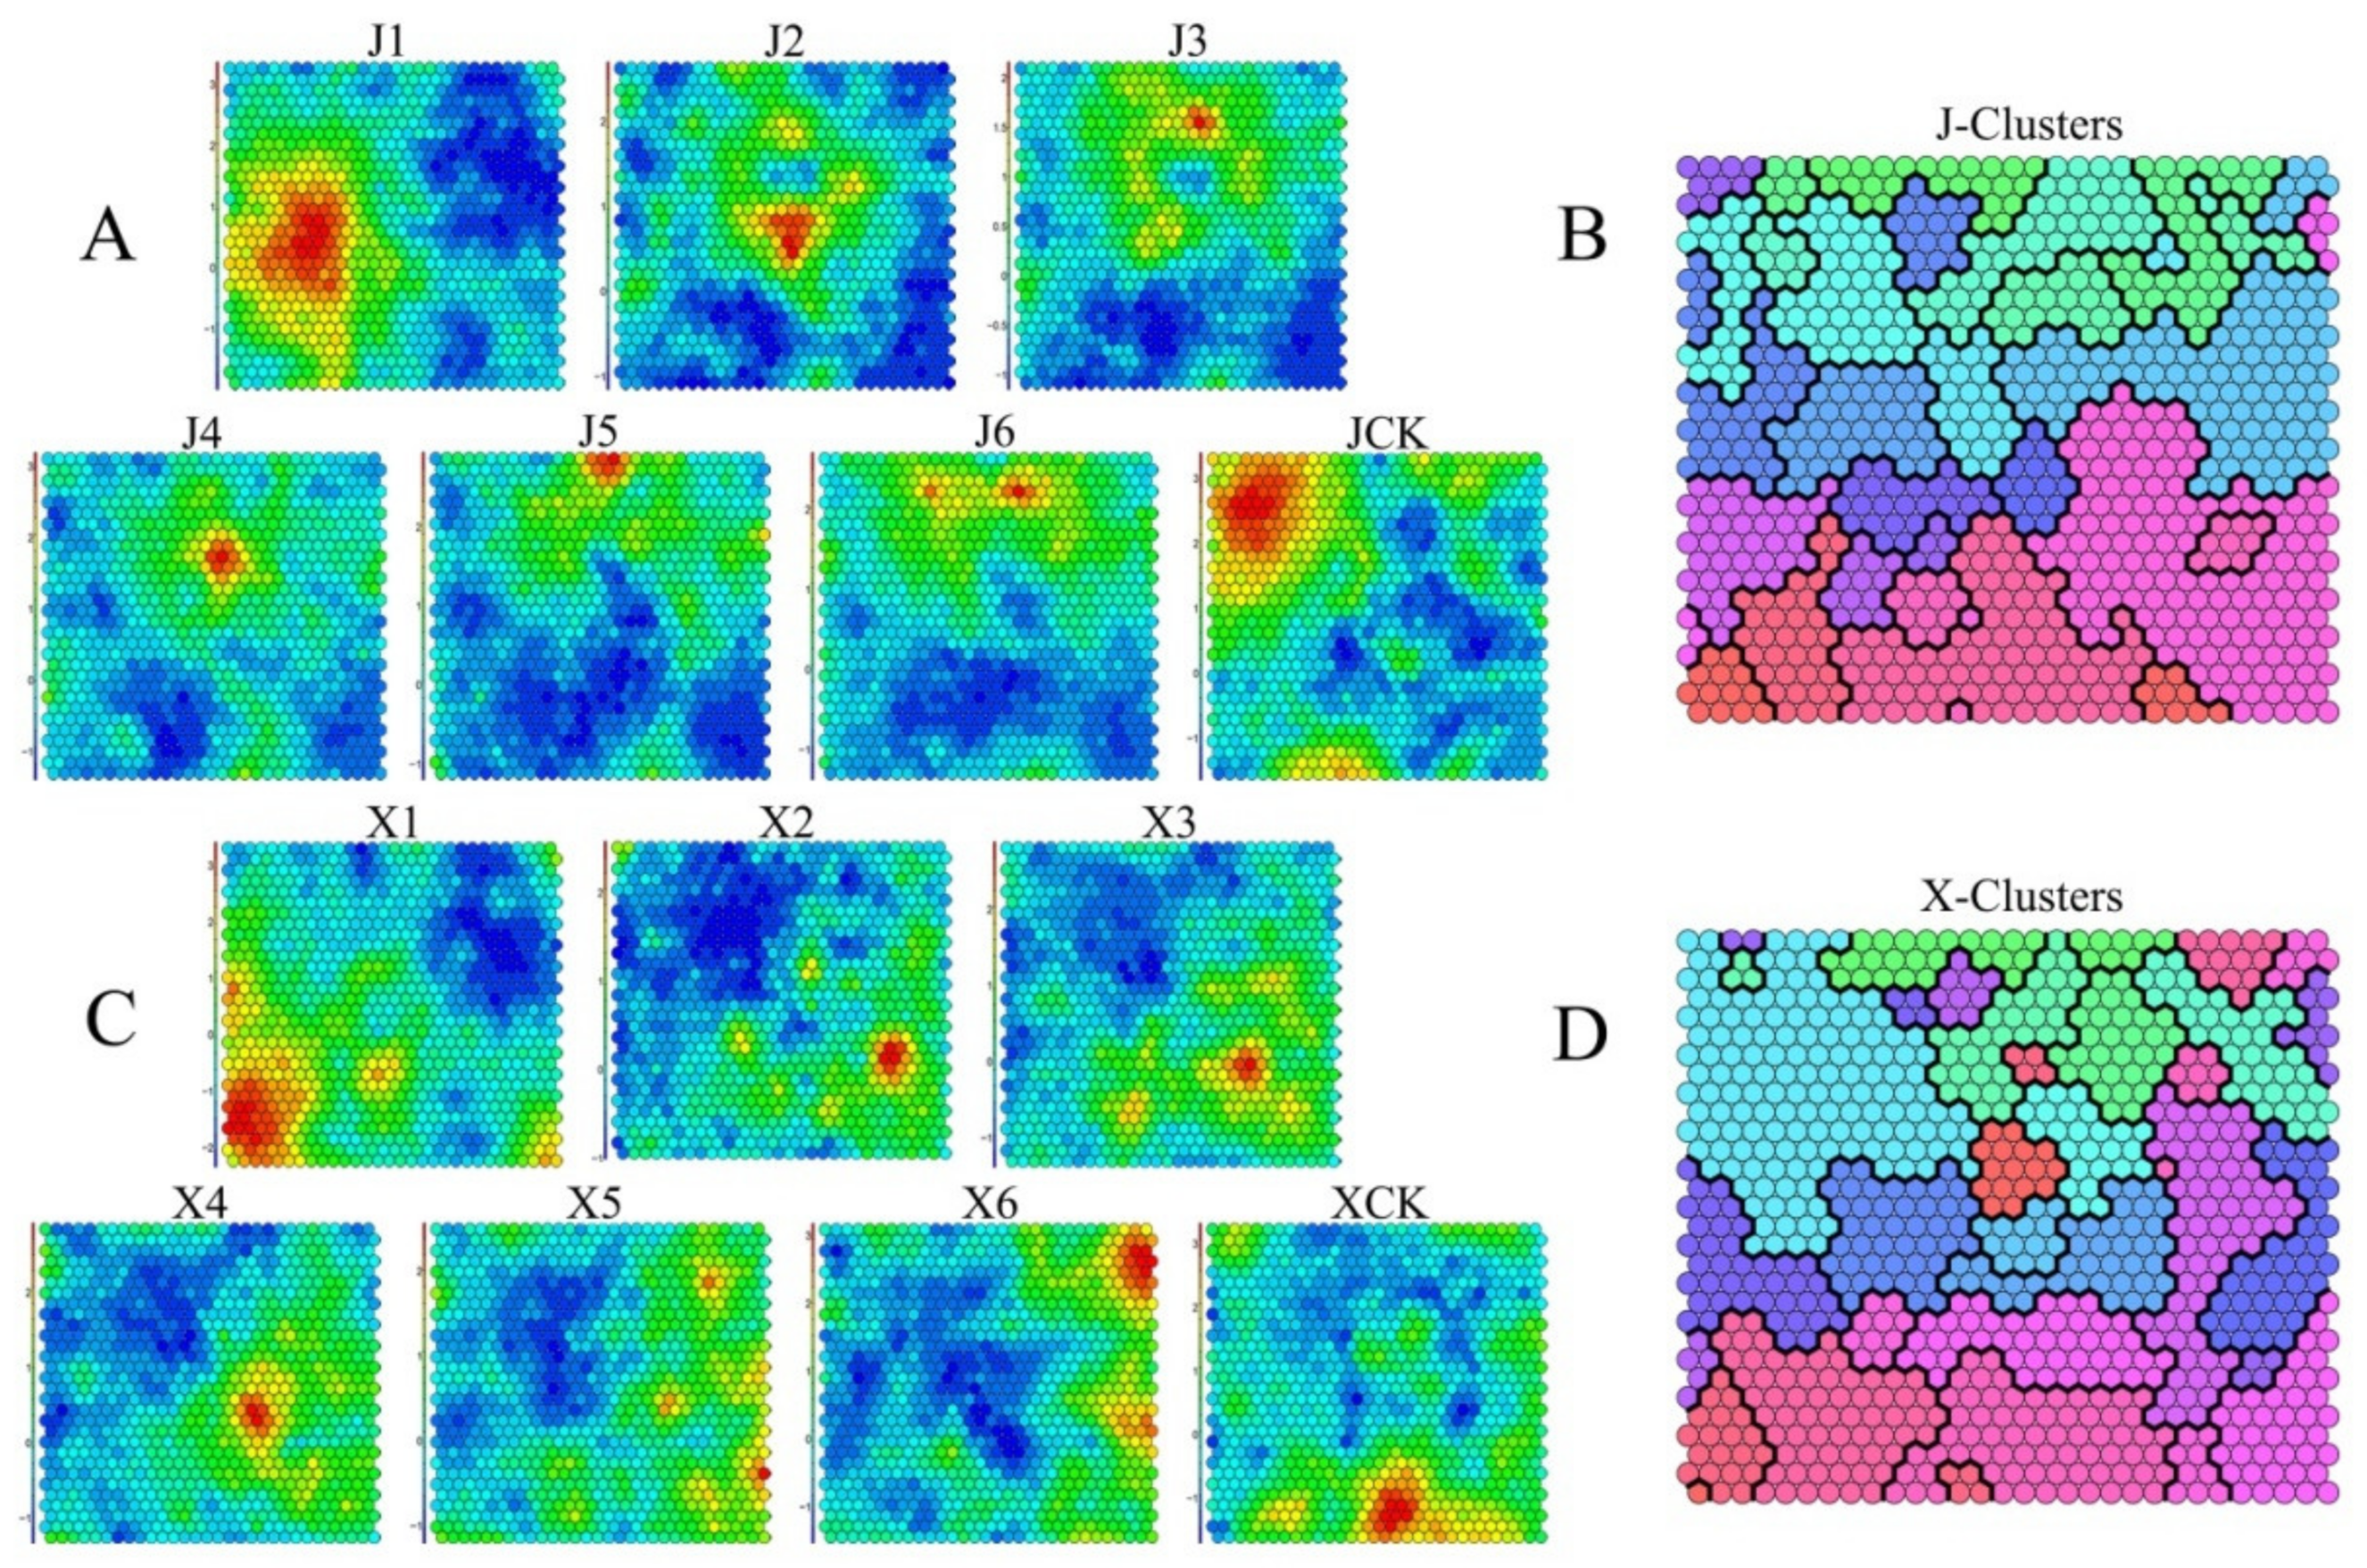
3.3. Analyses of Dynamic Gene Expression Patterns during Vernalization
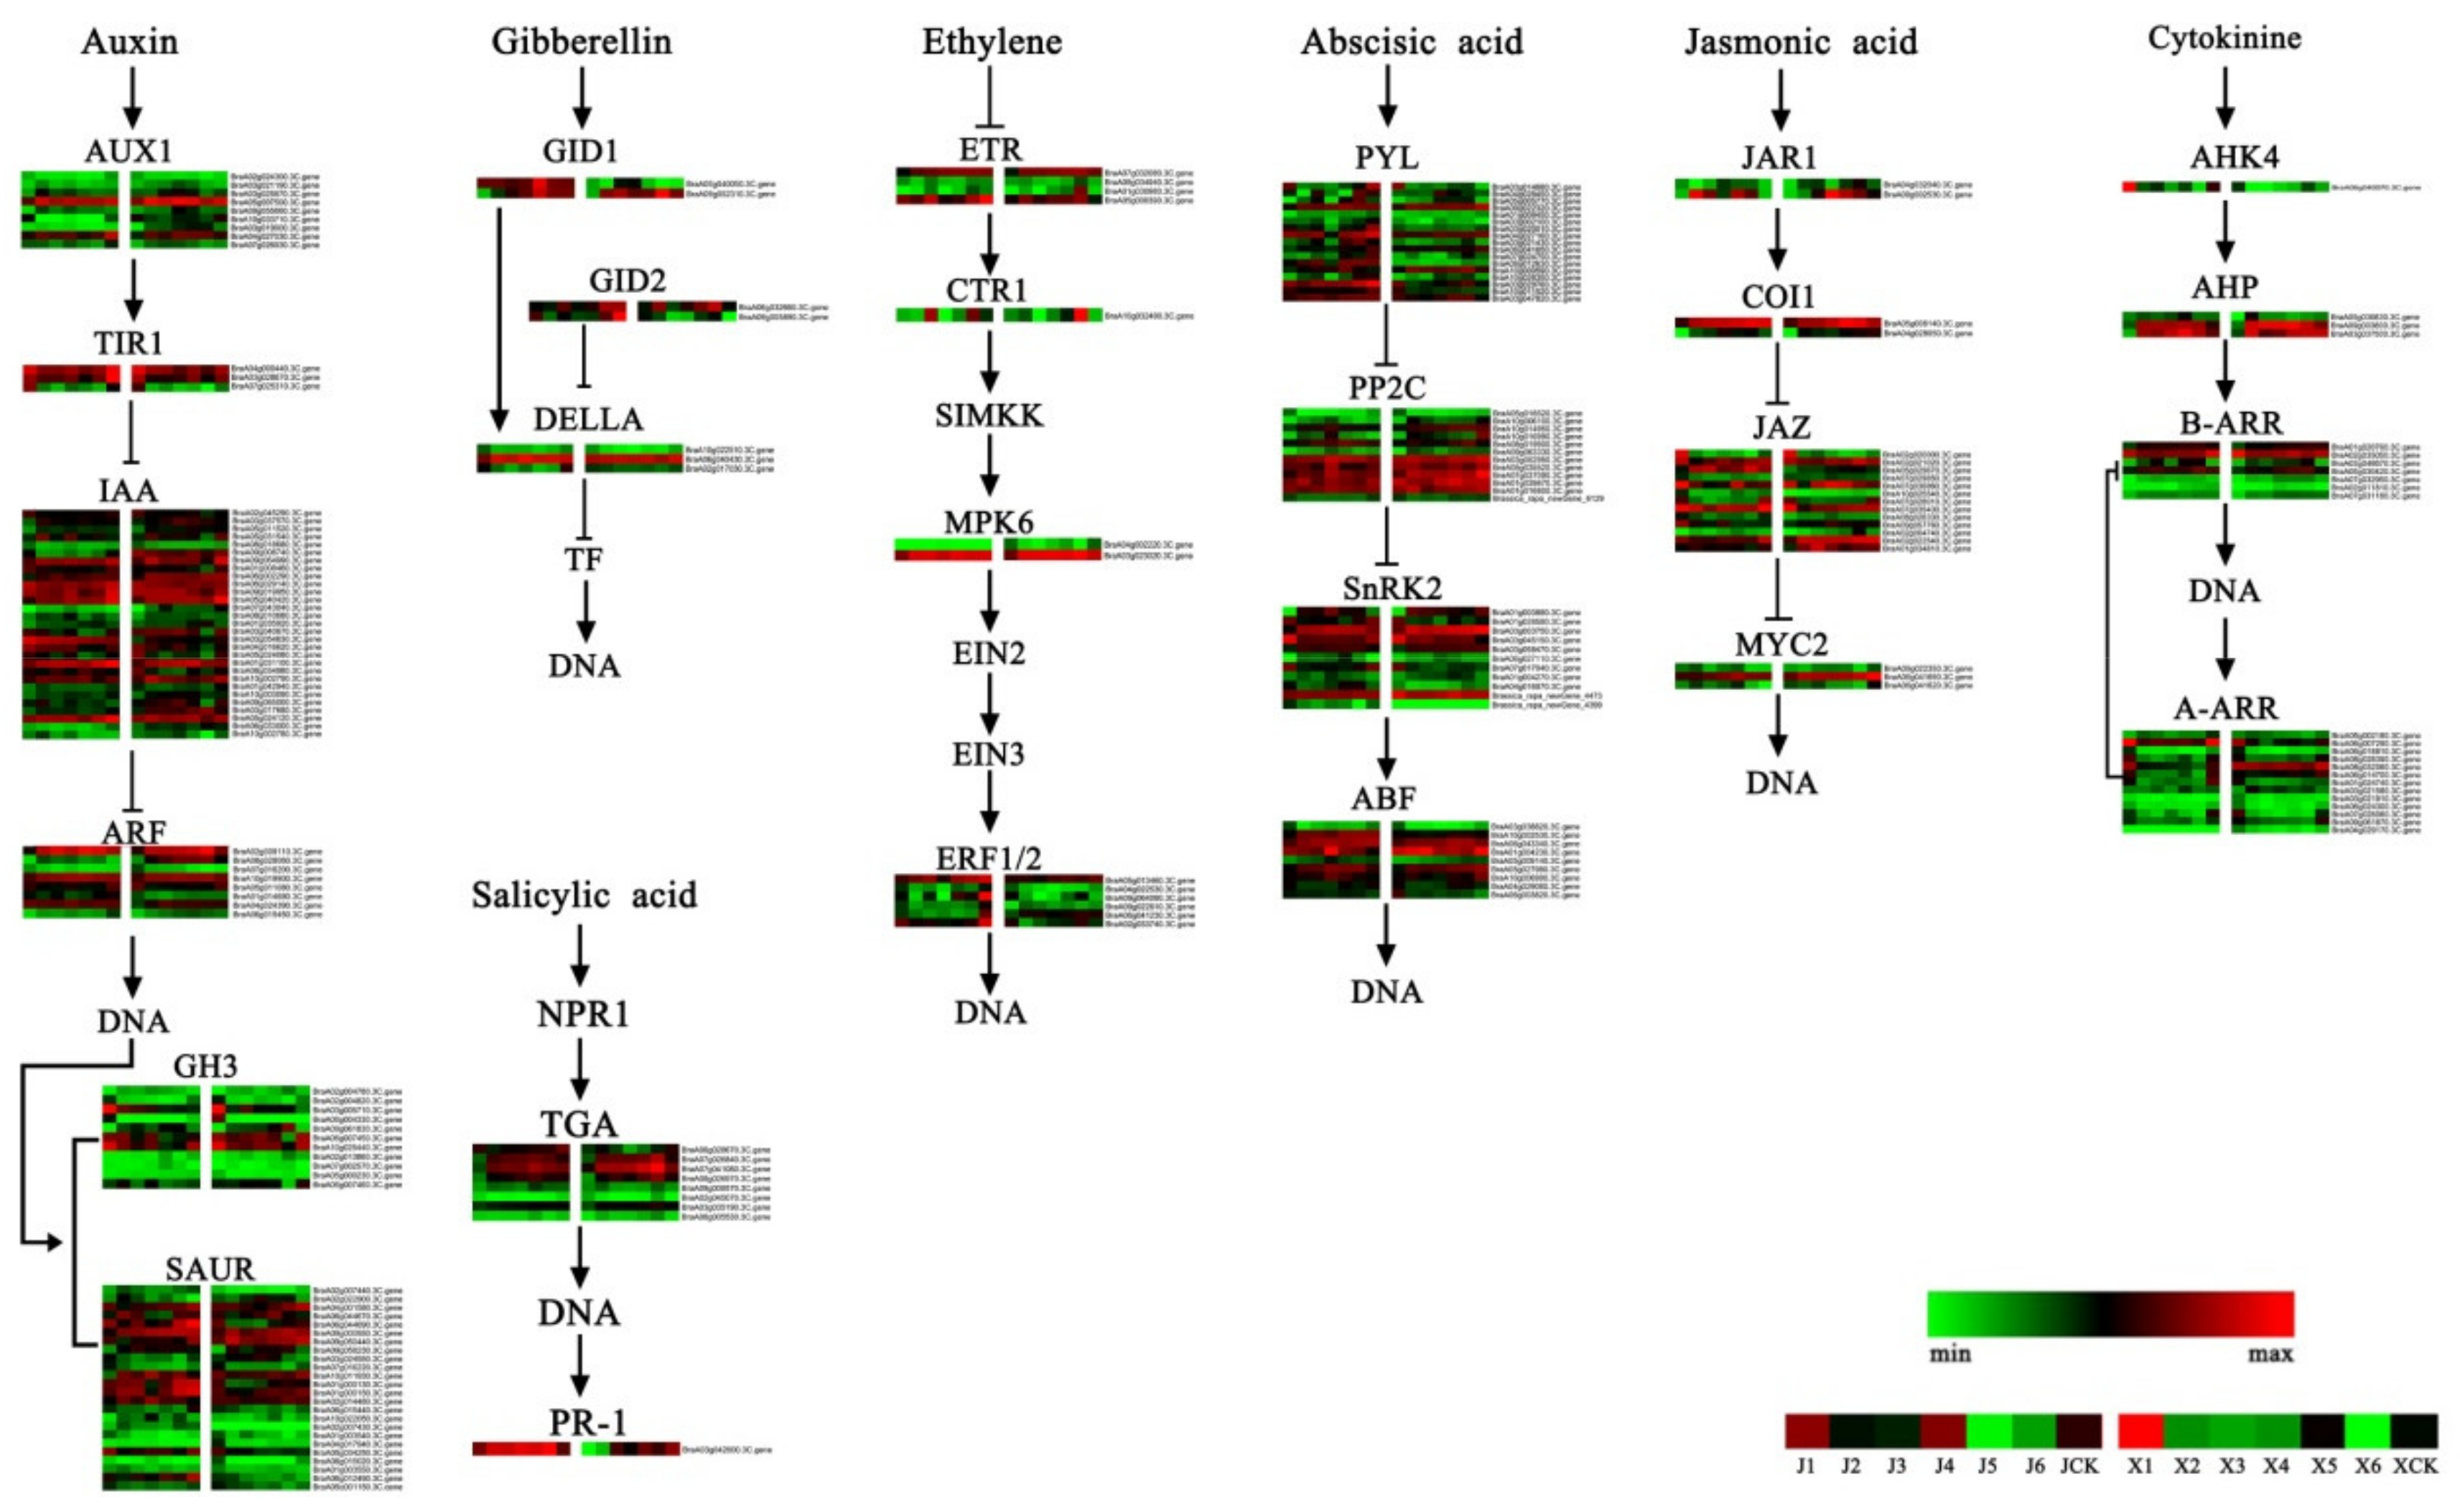
3.4. DEGs of the Plant Hormone-Related Signal Transduction Pathway
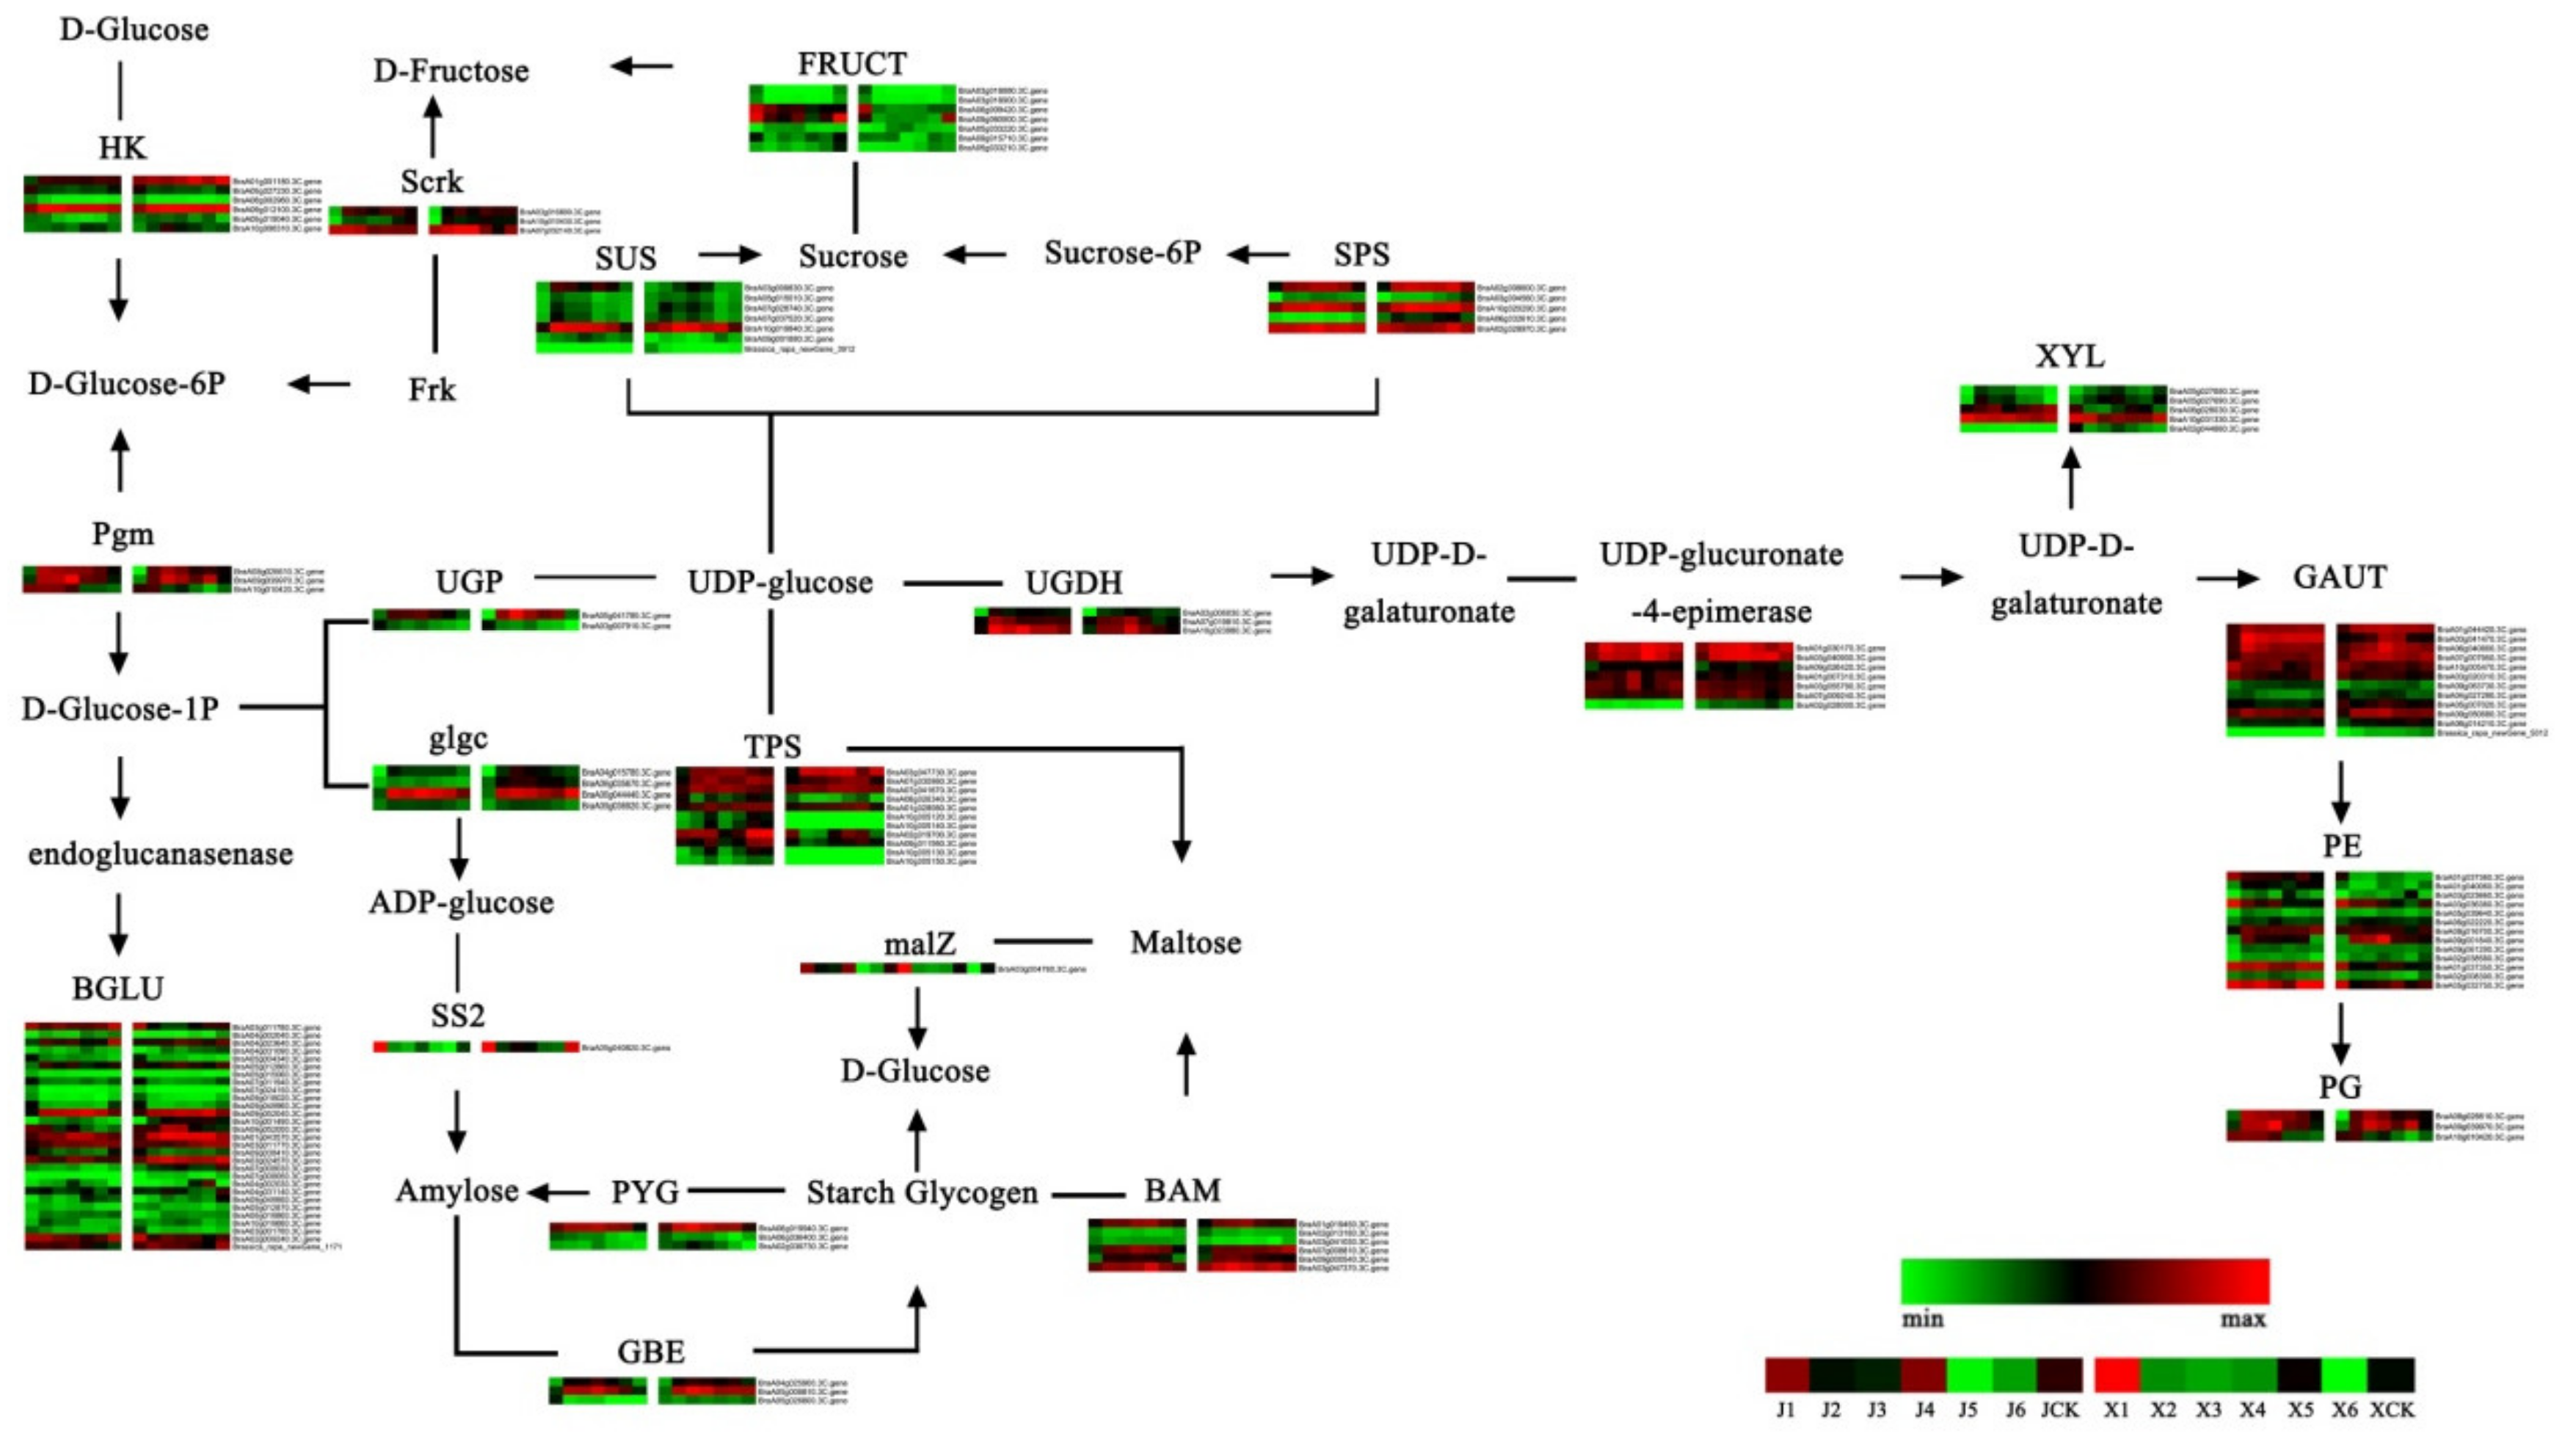
3.5. Analysis of Starch and Sucrose Metabolism Pathways during Vernalization
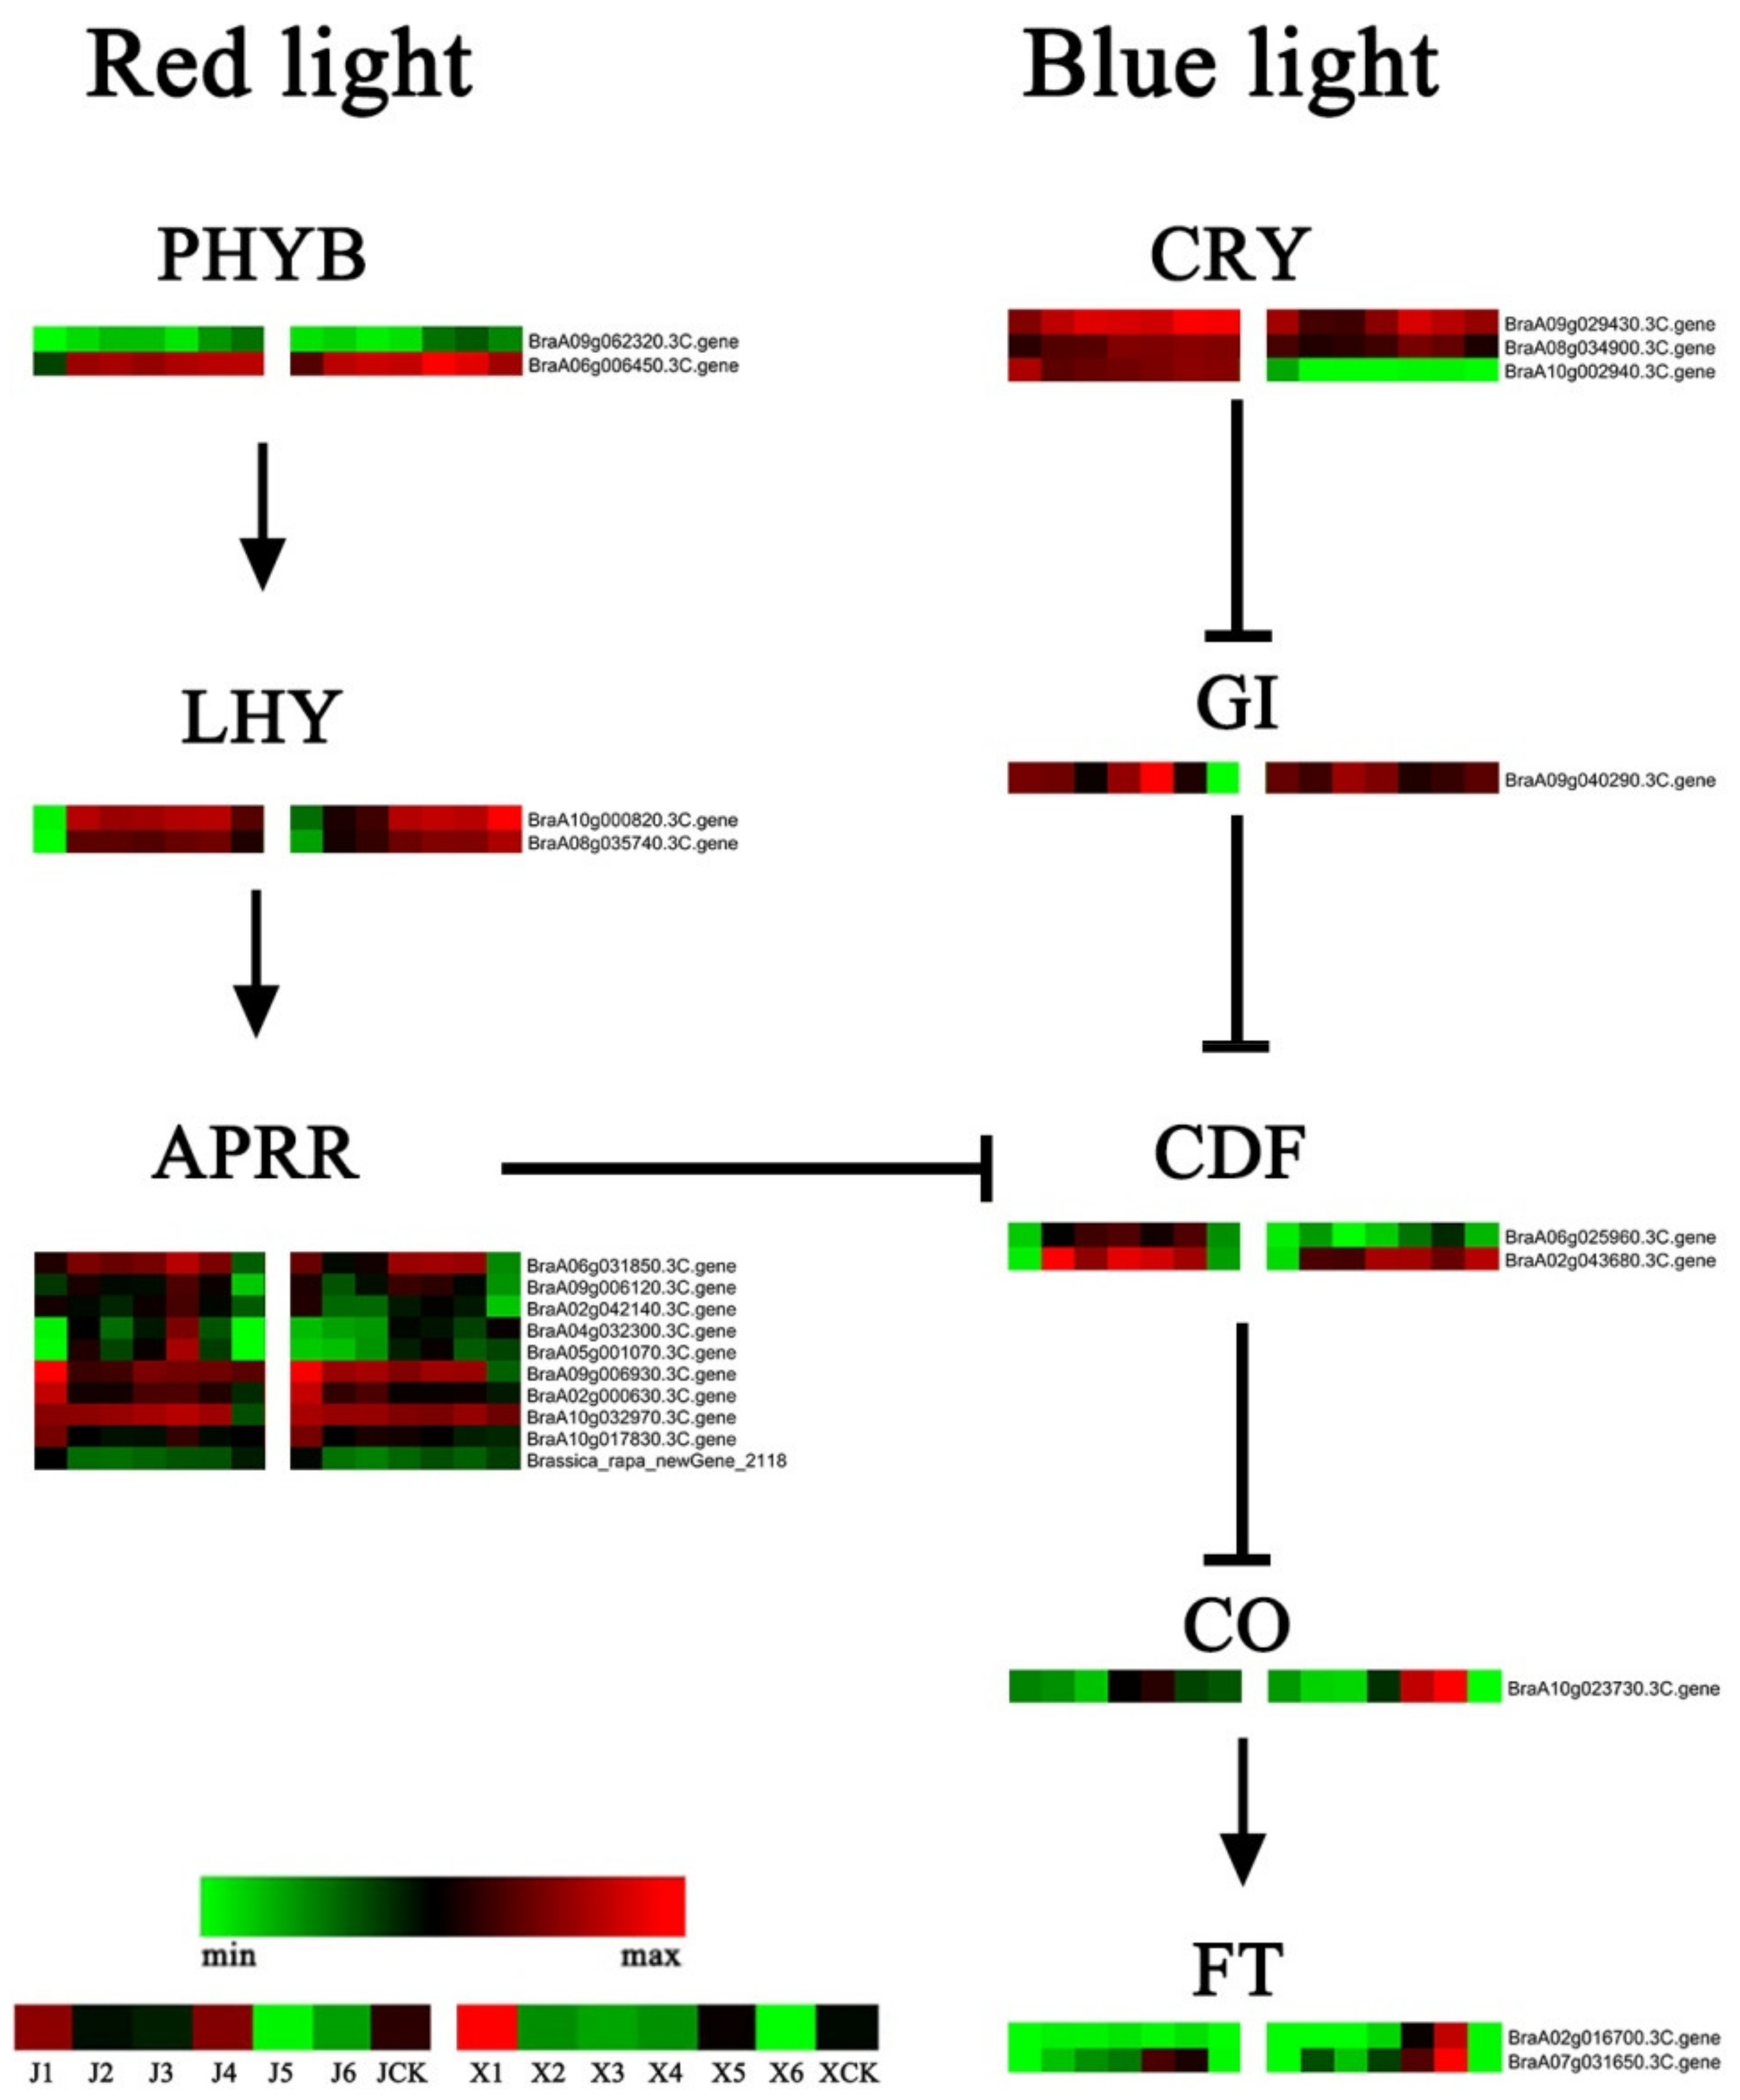
3.6. DEGs of the Photoperiod and Circadian Clock Pathways
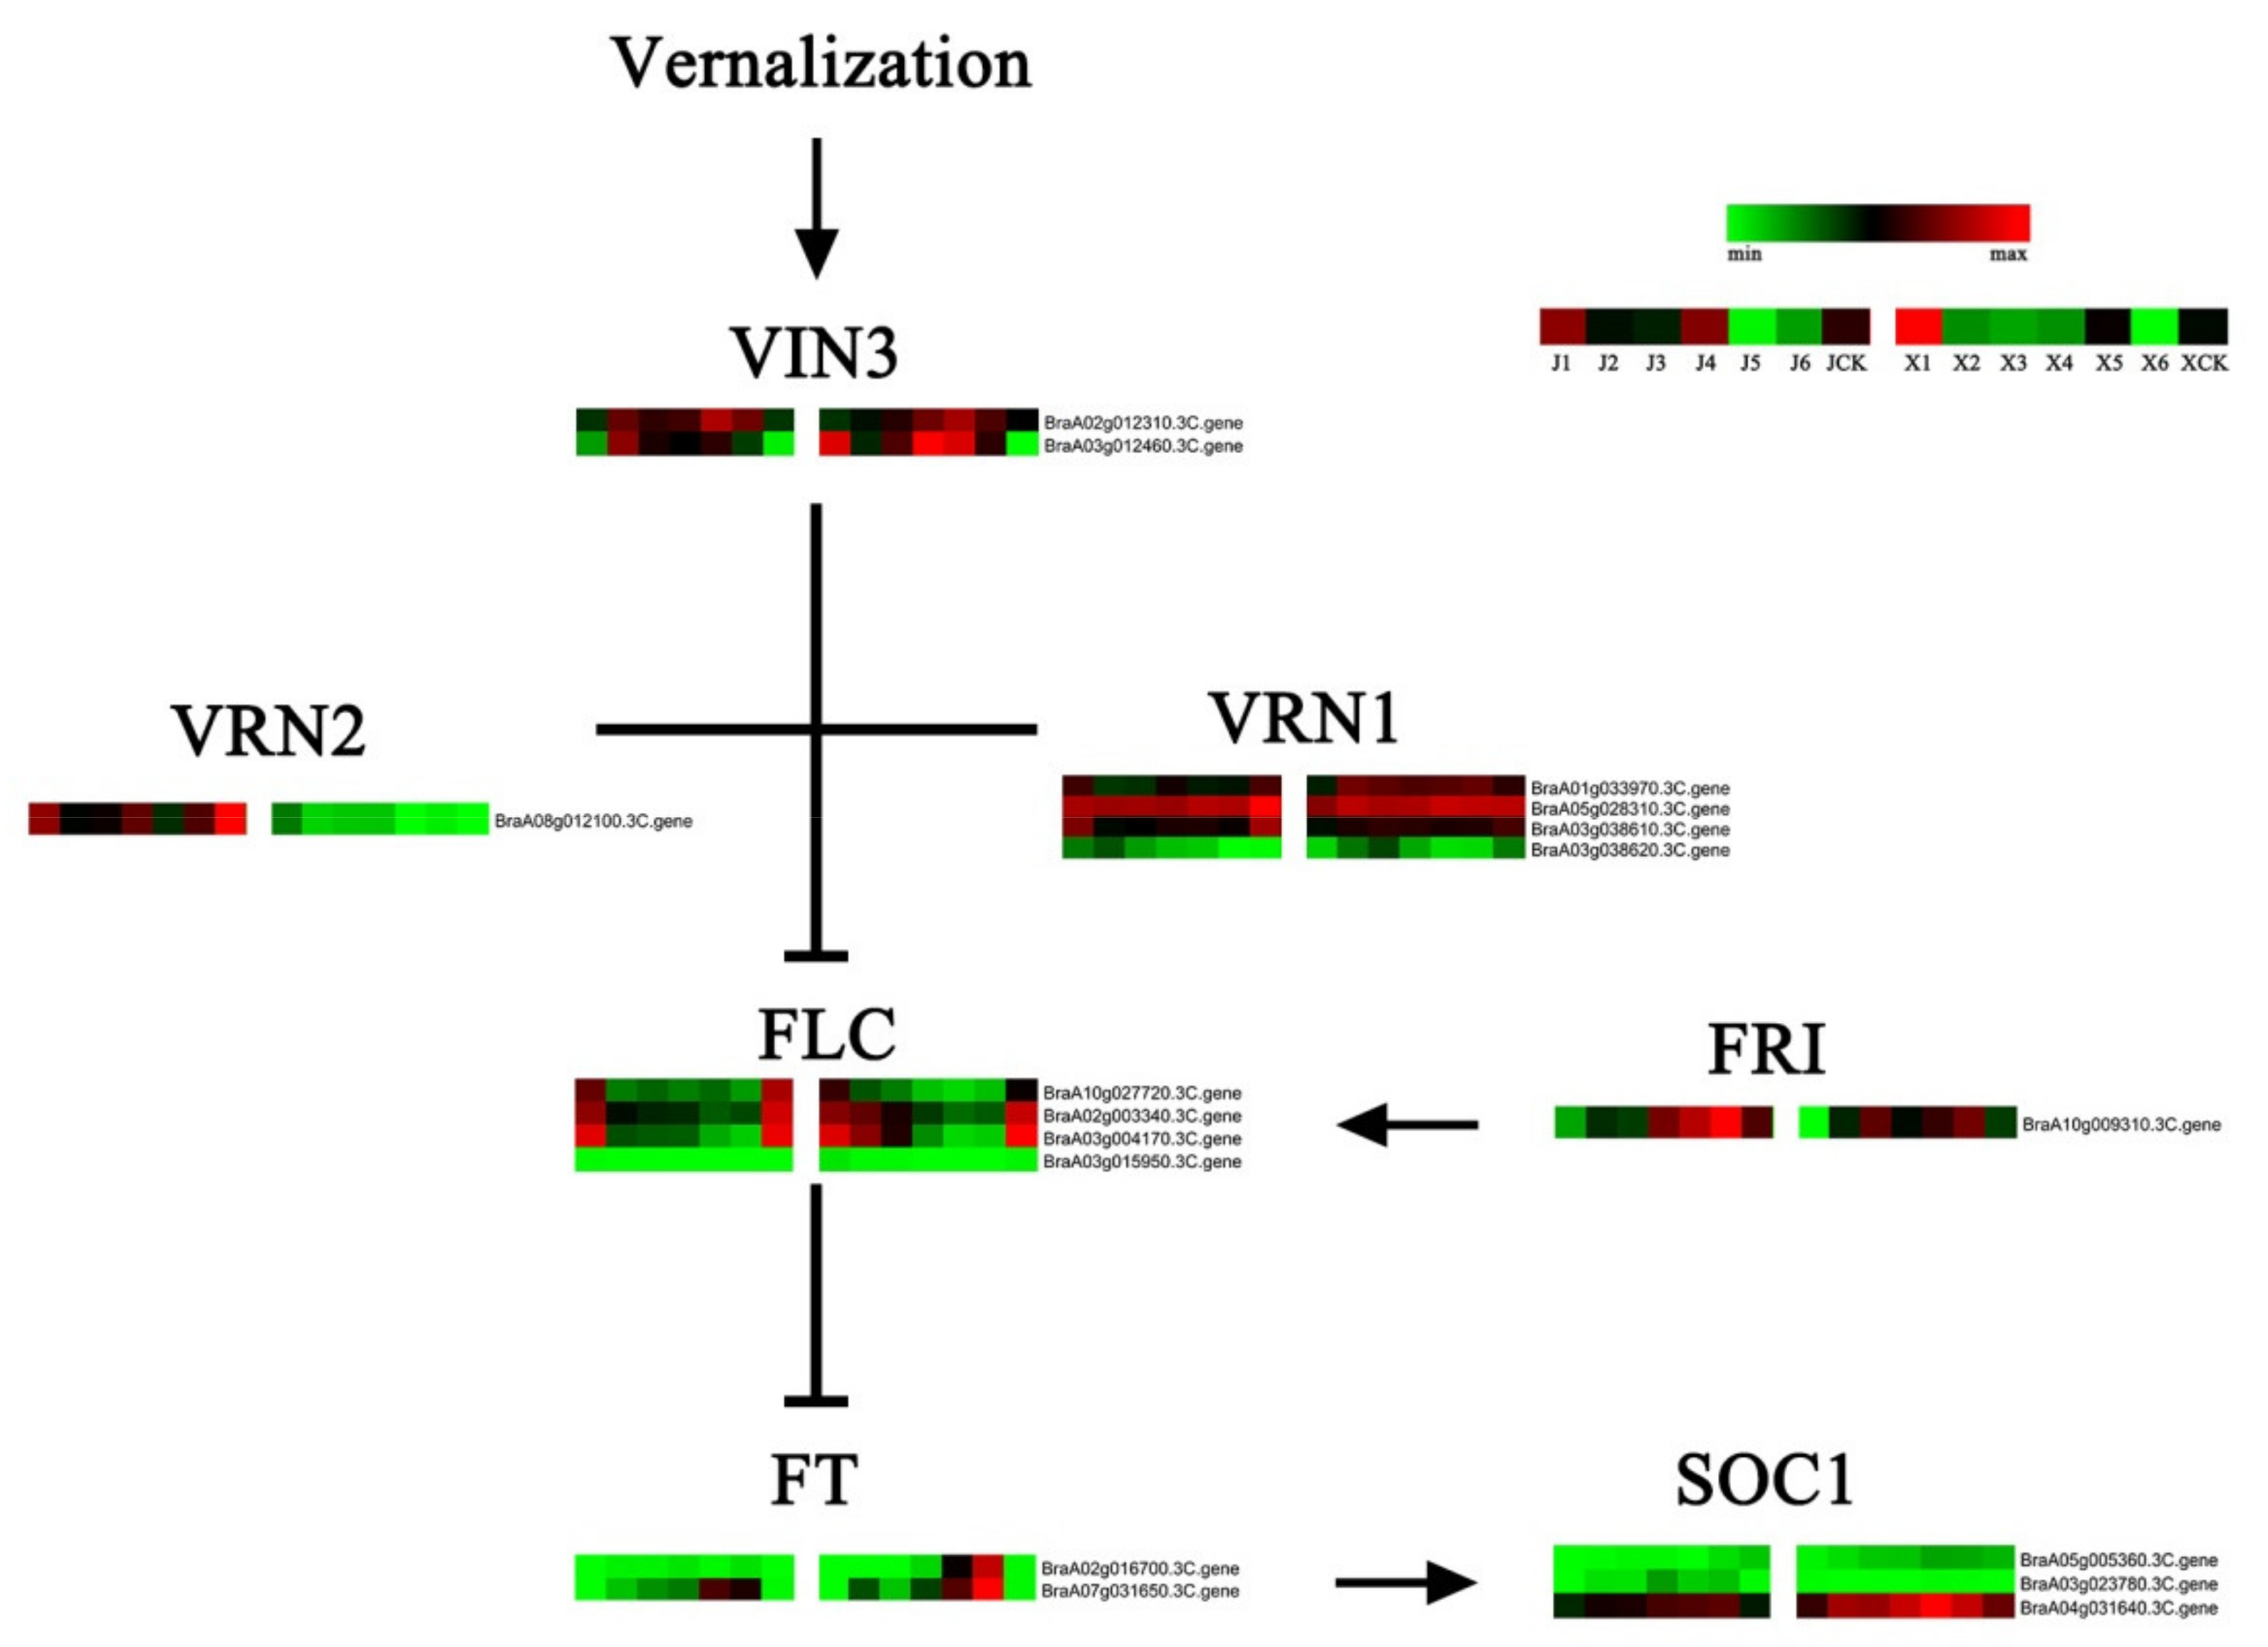
3.7. Identification of VernalizationPathway DEGs
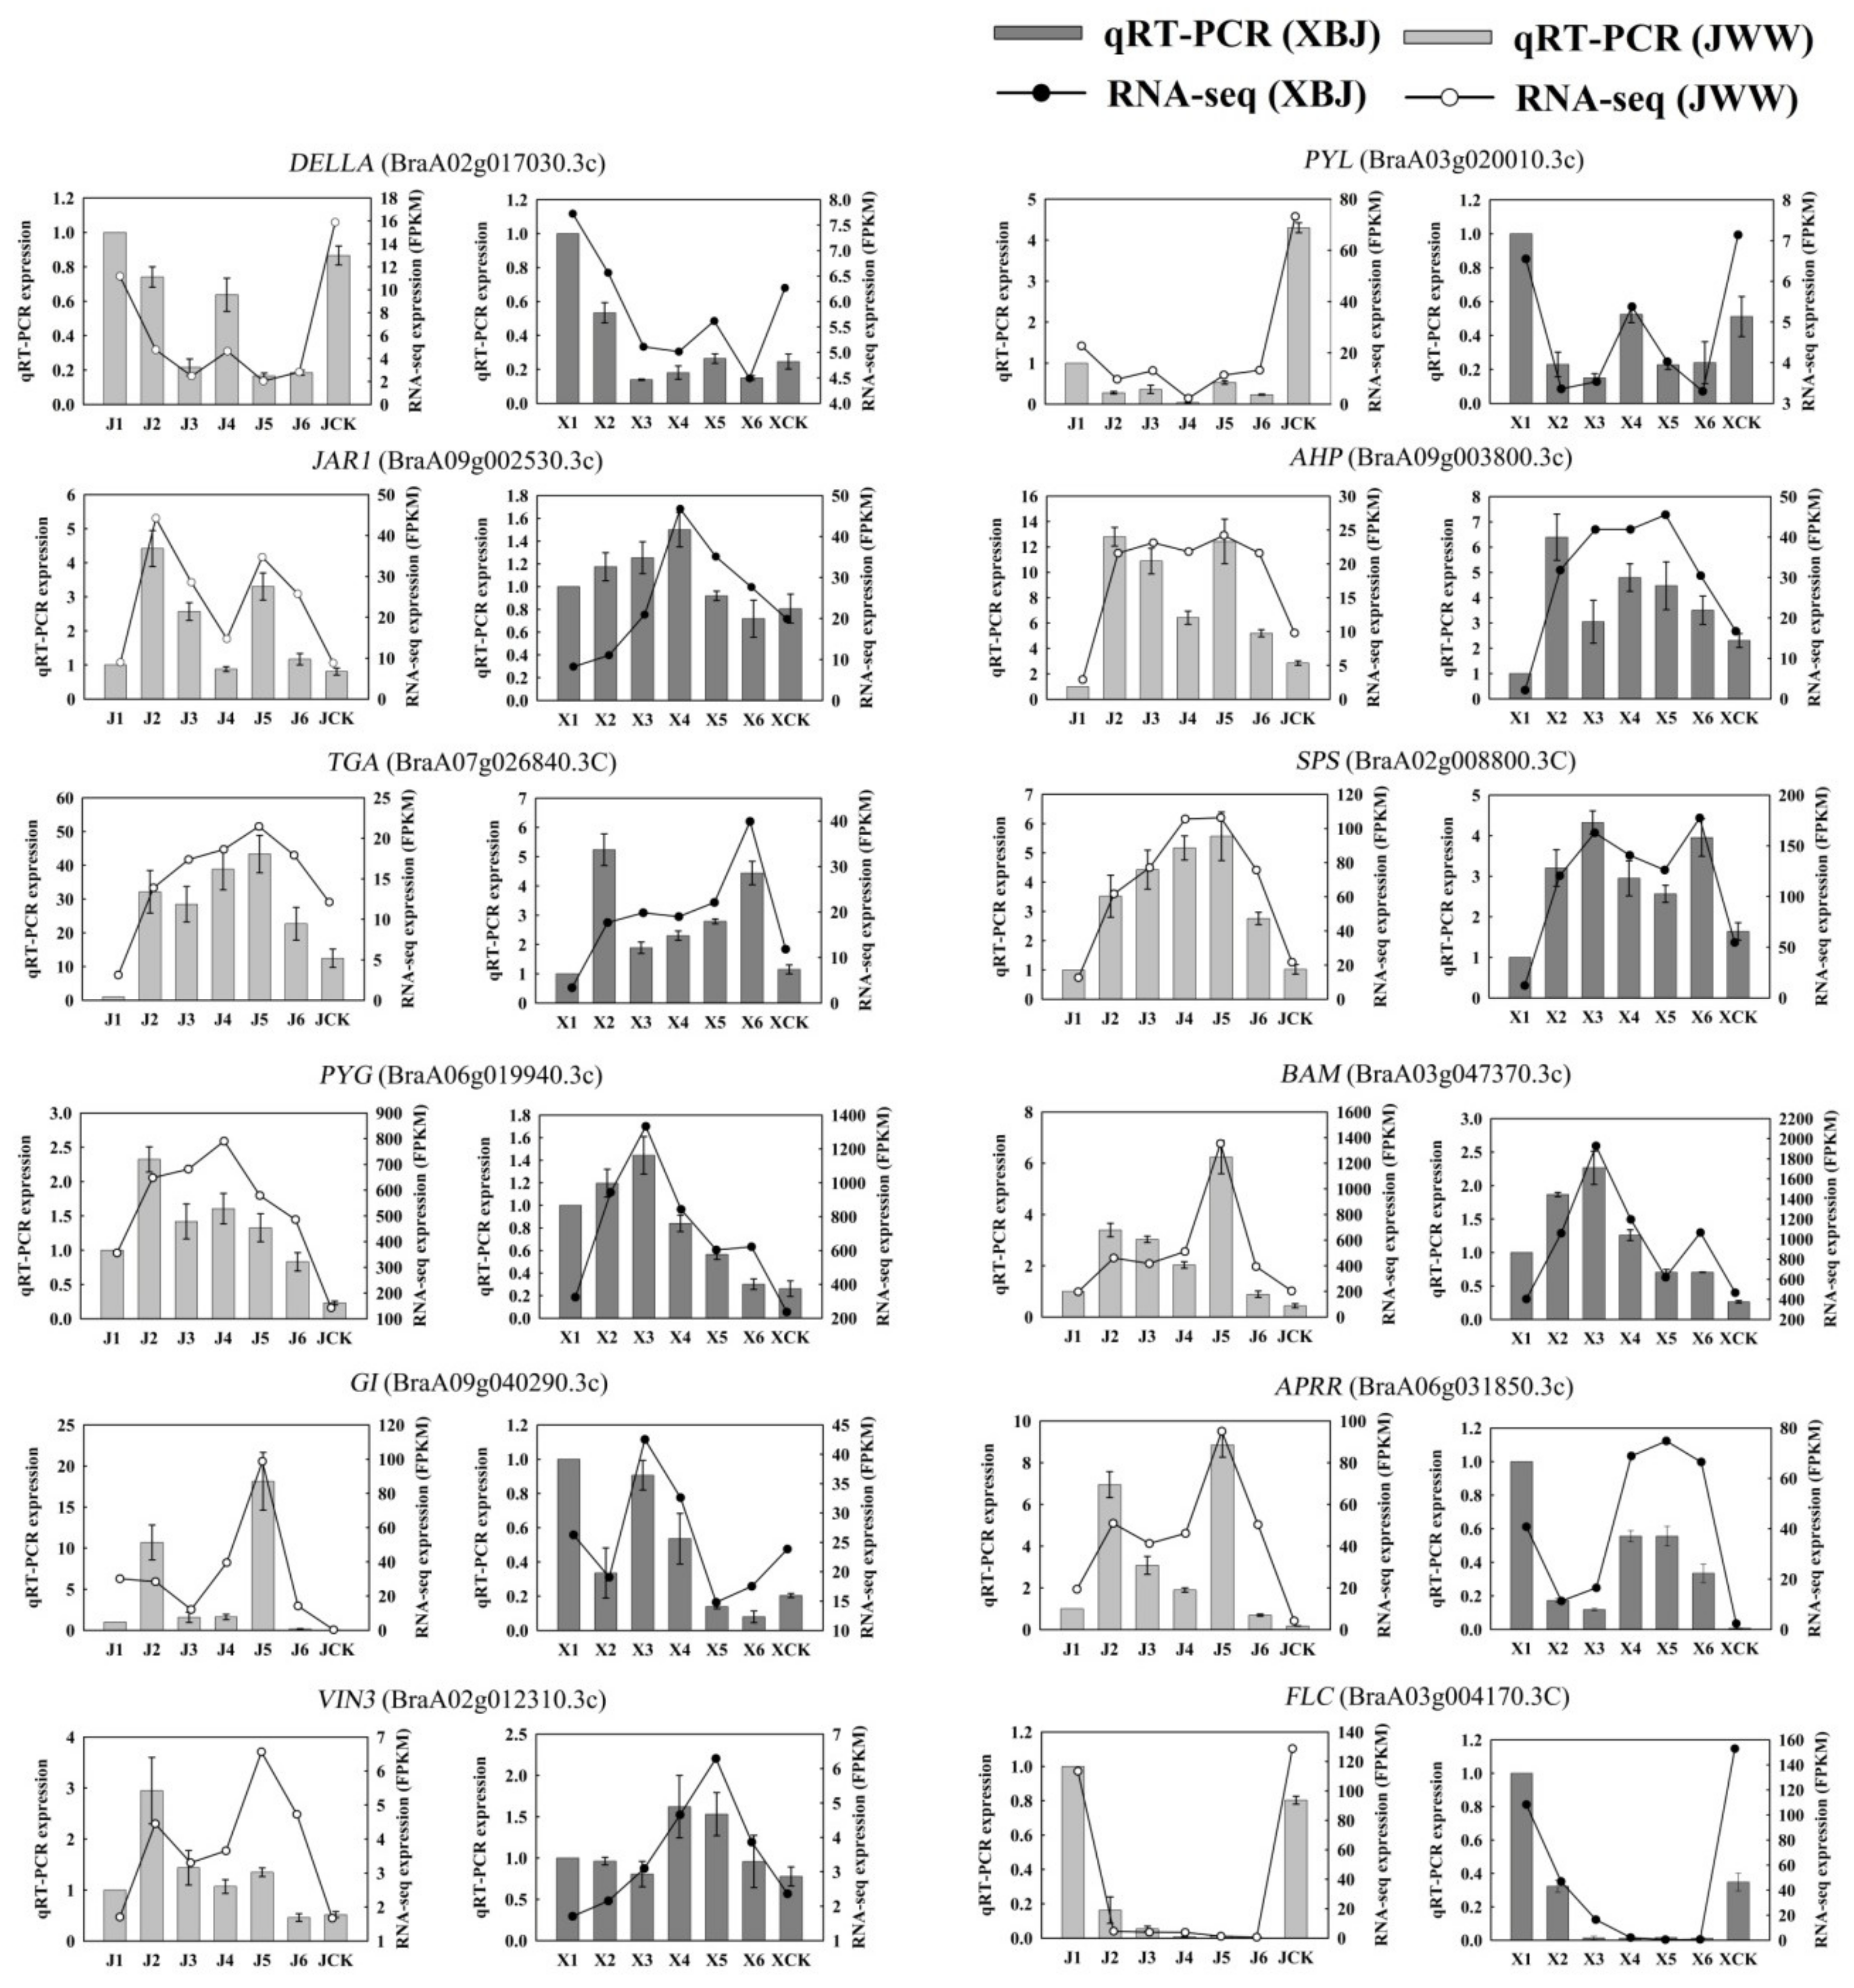
3.8. qRT-PCRValidation of DEGs
4. Discussion
4.1. Changes in the Plant Hormone Signal Transduction Pathway during Vernalization
4.2. Gene Expression Changes in the Starch and Sucrose Metabolism Pathways
4.3. Photoperiod and Circadian Clock Pathways
4.4. DEGs of the Vernalization Pathway
5. Conclusions
Supplementary Materials
Author Contributions
Funding
Acknowledgments
Conflicts of Interest
References
- Amasino, R. Seasonal and developmental timing of flowering. Plant J. 2010, 61, 1001–1013. [Google Scholar] [CrossRef] [PubMed]
- Wilson, R.N.; Heckman, J.W.; Somerville, C.R. Gibberellin Is Required for Flowering in Arabidopsis thaliana under Short Days. Plant Physiol. 1992, 100, 403–408. [Google Scholar] [CrossRef] [PubMed] [Green Version]
- Turck, F.; Fornara, F.; Coupland, G. Regulation and identity of florigen: FLOWERING LOCUS T moves center stage. Annu. Rev. Plant Biol. 2008, 59, 573–594. [Google Scholar] [CrossRef] [PubMed] [Green Version]
- Jung, C.; Muller, A.E. Flowering time control and applications in plant breeding. Trends Plant Sci. 2009, 14, 563–573. [Google Scholar] [CrossRef]
- He, Y. Chromatin regulation of flowering. Trends Plant Sci. 2012, 17, 556–562. [Google Scholar] [CrossRef]
- Wang, J. Regulation of flowering time by the miR156-mediated age pathway. J. Exp. Bot. J. 2014, 65, 4723–4730. [Google Scholar] [CrossRef] [Green Version]
- Srikanth, A.; Schmid, M. Regulation of flowering time: All roads lead to Rome. Cell. Mol. Life Sci. 2011, 68, 2013–2037. [Google Scholar] [CrossRef]
- Han, T.; Wu, C.; Tong, Z.; Mentreddy, R.S.; Tan, K.; Gai, J. Postflowering photoperiod regulates vegetative growth and reproductive development of soybean. Environ. Exp. Bot. 2006, 55, 120–129. [Google Scholar] [CrossRef]
- Xu, F.; Rong, X.; Huang, X.; Cheng, S. Recent advances of flowering locus T gene in higher plants. Int. J. Mol. Sci. 2012, 13, 3773–3781. [Google Scholar] [CrossRef] [Green Version]
- Johanson, U.; West, J.; Lister, C.; Michaels, S.D.; Amasino, R.M.; Dean, C. Molecular Analysis of FRIGIDA, a Major Determinant of Natural Variation in Arabidopsis Flowering Time. Science 2000, 290, 344–347. [Google Scholar] [CrossRef]
- Gendall, A.R.; Levy, Y.Y.; Wilson, A.; Dean, C. The VERNALIZATION 2 Gene Mediates the Epigenetic Regulation of Vernalization in Arabidopsis. Cell 2001, 107, 525–535. [Google Scholar] [CrossRef] [Green Version]
- Levy, Y.Y.; Mesnage, S.; Mylne, J.S.; Gendall, A.R.; Dean, C. Multiple Roles of Arabidopsis VRN1 in Vernalization and Flowering Time Control. Science 2002, 297, 243–246. [Google Scholar] [CrossRef] [PubMed]
- Yan, L.; Loukoianov, A.; Blechl, A.; Tranquilli, G.; Ramakrishna, W.; SanMiguel, P.; Bennetzen, J.L.; Echenique, V.; Dubcovsky, J. The Wheat VRN2 Gene is a Flowering Represser Down-Regulated by Vernalization. Science 2004, 303, 1640–1644. [Google Scholar] [CrossRef] [PubMed] [Green Version]
- Kim, D.H.; Zografos, B.R.; Sung, S. Mechanisms underlying vernalization-mediated VIN3 induction in Arabidopsis. Plant Signal. Behav. 2014, 5, 1457–1459. [Google Scholar] [CrossRef] [PubMed]
- Shitsukawa, N.; Ikari, C.; Shimada, S.; Kitagawa, S.; Sakamoto, K.; Saito, H.; Ryuto, H.; Fukunishi, N.; Abe, T.; Takumi, S.; et al. The einkorn wheat (Triticum monococcum) mutant, maintained vegetative phase, is caused by a deletion in the VRN1 gene. Genes Genet. Syst. 2007, 82, 167–170. [Google Scholar] [CrossRef] [PubMed] [Green Version]
- Kiss, T.; Dixon, L.E.; Soltész, A.; Bányai, J.; Mayer, M.; Balla, K.; Allard, V.; Galiba, G.; Slafer, G.A.; Griffiths, S.; et al. Effects of ambient temperature in association with photoperiod on phenology and on the expressions of major plant developmental genes in wheat (Triticumaestivum L.). Plant Cell Environ. 2017, 40, 1629–1642. [Google Scholar] [CrossRef]
- Yan, L.; Fu, D.; Li, C.; Blechl, A.E.; Tranquilli, G.; Bonafede, M.; Sanchez, A.; Valarik, M.; Yasuda, S.; Dubcovsky, J. The wheat and barley vernalization gene VRN3 is an orthologue of FT. Proc. Natl. Acad. Sci. USA 2006, 103, 19581–19586. [Google Scholar] [CrossRef] [Green Version]
- Li, J.; Zhao, X.; Nishimura, Y.; Fukumoto, Y. Correlation between bolting and physiological properties in Chinese cabbage (Brassica rapa L. pekinensis group). J. Jpn. Soc. Hortic. Sci. 2010, 79, 294–300. [Google Scholar] [CrossRef] [Green Version]
- Zhang, L.; Cai, X.; Wu, J.; Liu, M.; Grob, S.; Cheng, F.; Liang, J.; Cai, C.; Liu, Z.; Liu, B. Improved Brassica rapa reference genome by single-molecule sequencing and chromosome conformation capture technologies. Hortic. Res. 2018, 5, 1–11. [Google Scholar] [CrossRef] [Green Version]
- Trapnell, C.; Pachter, L.; Salzberg, S.L. TopHat: Discovering splice junctions with RNA-Seq. Bioinformatics 2009, 25, 1105–1111. [Google Scholar] [CrossRef]
- Trapnell, C.; Roberts, A.; Goff, L.A.; Pertea, G.; Kim, D.; Kelley, D.R.; Pimentel, H.; Salzberg, S.L.; Rinn, J.L.; Pachter, L. Differential gene and transcript expression analysis of RNA-seq experiments with TopHat and Cufflinks. Nat. Protoc. 2012, 7, 562–578. [Google Scholar] [CrossRef] [PubMed] [Green Version]
- Anders, S.; Huber, W. Differential expression analysis for sequence count data. Genome Biol. 2010, 11, 1–12. [Google Scholar] [CrossRef] [PubMed] [Green Version]
- Gerber, T.; Willscher, E.; Loefflerwirth, H.; Hopp, L.; Schadendorf, D.; Schartl, M.; Anderegg, U.; Camp, G.; Treutlein, B.; Binder, H.; et al. Mapping heterogeneity in patient-derived melanoma cultures by single-cell RNA-seq. Oncotarget 2017, 8, 846–862. [Google Scholar] [CrossRef] [PubMed] [Green Version]
- Chang, R.; Chu, C.; Wu, Y.; Chen, Y. Gene clustering by using query-based self-organizing maps. Expert Syst. Appl. 2010, 37, 6689–6694. [Google Scholar] [CrossRef]
- Young, M.D.; Wakefield, M.J.; Smyth, G.K.; Oshlack, A. Gene ontology analysis for RNA-seq: Accounting for selection bias. Genome Biol. 2010, 11, 1–12. [Google Scholar] [CrossRef] [Green Version]
- Mao, X.; Cai, T.; Olyarchuk, J.G.; Wei, L. Automated genome annotation and pathway identification using the KEGG Orthology (KO) as a controlled vocabulary. Bioinformatics 2005, 21, 3787–3793. [Google Scholar] [CrossRef]
- Xie, L.; Li, F.; Zhang, S.; Zhang, H.; Qian, W.; Li, P.; Zhang, S.; Sun, R. Mining for Candidate Genes in an Introgression Line by Using RNA Sequencing: The Anthocyanin Overaccumulation Phenotype in Brassica. Front. Plant Sci. 2016, 7, 1245. [Google Scholar] [CrossRef] [Green Version]
- Dai, Y.; Yuan, L.; Zhang, S.; Wang, J.; Xie, S.; Zhao, M.; Chen, G.; Sun, R.; Wang, C. Comprehensive Evaluation for Cold Tolerance in Wucai (Brassica campestris L.) by the Performance Index on an Absorption Basis (PIabs). Agronomy 2019, 9, 61. [Google Scholar] [CrossRef] [Green Version]
- Chen, G.; Ye, X.; Zhang, S.; Zhu, S.; Yuan, L.; Hou, J.; Wang, C. Comparative Transcriptome Analysis between Fertile and CMS Flower Buds in Wucai (Brassica campestris L.). BMC Genom. 2018, 19, 908. [Google Scholar] [CrossRef]
- Song, G.Q.; Chen, Q. Comparative transcriptome analysis of nonchilled, chilled, and late-pink bud reveals flowering pathway genes involved in chilling-mediated flowering in blueberry. BMC Plant Biol. 2018, 18, 98. [Google Scholar] [CrossRef]
- Huang, J.; Liu, X.; Wang, J.; Lu, Y. Transcriptomic analysis of Asiatic lily in the process of vernalization via RNA-seq. Mol. Biol. Rep. 2014, 41, 3839–3852. [Google Scholar] [CrossRef] [PubMed]
- Yang, M.; Zhu, L.; Xu, L.; Pan, C.; Liu, Y. Comparative transcriptomic analysis of the regulation of flowering in temperate and tropical lotus (Nelumbo nucifera) by RNA-Seq. Ann. Appl. Biol. 2014, 165, 73–95. [Google Scholar] [CrossRef]
- Wang, X.; Wang, H.; Wang, J.; Sun, R.; Wu, J.; Liu, S.; Bai, Y.; Mun, J.; Bancroft, I.; Cheng, F. The genome of the mesopolyploid crop species Brassica rapa. Nat. Genet. 2011, 43, 1035–1039. [Google Scholar] [CrossRef] [PubMed] [Green Version]
- Cai, C.; Wang, X.; Liu, B.; Wu, J.; Liang, J.; Cui, Y.; Cheng, F.; Wang, X. Brassica rapa Genome 2.0: A Reference Upgrade through Sequence Re-assembly and Gene Re-annotation. Mol. Plant 2016, 10, 649–651. [Google Scholar] [CrossRef] [PubMed] [Green Version]
- Sablowski, R. Flowering and determinacy in Arabidopsis. J. Exp Bot. 2007, 58, 899–907. [Google Scholar] [CrossRef] [PubMed] [Green Version]
- Davis, S.J. Integrating hormones into the floral-transition pathway of Arabidopsis thaliana. Plant Cell Environ. 2009, 32, 1201–1210. [Google Scholar] [CrossRef]
- Alabadi, D.; Blazquez, M.A.; Carbonell, J.; Ferrandiz, C.; Perezamador, M.A. Instructive roles for hormones in plant development. Int. J. Plant Dev. Biol. 2009, 53, 1597–1608. [Google Scholar] [CrossRef]
- Tiwari, S.B.; Wang, X.J.; Guilfoyle, H.T.J. AUX/IAA Proteins Are Active Repressors, and Their Stability and Activity Are Modulated by Auxin. Plant Cell 2001, 13, 2809–2822. [Google Scholar] [CrossRef] [Green Version]
- Dharmasiri, N.; Dharmasiri, S.; Estelle, M. The F-box protein TIR1 is an auxin receptor. Nature 2005, 435, 441–445. [Google Scholar] [CrossRef]
- Hagen, G.; Guilfoyle, T.J. Auxin-responsive gene expression: Genes, promoters and regulatory factors. Plant Mol. Biol. 2002, 49, 373–385. [Google Scholar] [CrossRef]
- Pierrejerome, E.; Moss, B.L.; Nemhauser, J.L. Tuning the auxin transcriptional response. J. Exp. Bot. 2013, 64, 2557–2563. [Google Scholar] [CrossRef]
- Ariizumi, T.; Hauvermale, A.L.; Nelson, S.K.; Hanada, A.; Steber, C.M. Lifting della repression of arabidopsis seed germination by nonproteolytic gibberellin signaling. Plant Physiol. 2013, 162, 2125–2139. [Google Scholar] [CrossRef] [PubMed] [Green Version]
- Benavente, L.M.; Alonso, J.M. Molecular mechanisms of ethylene signaling in Arabidopsis. Mol. BioSyst. 2006, 2, 165–173. [Google Scholar] [CrossRef] [PubMed]
- Sakai, H.; Hua, J.; Chen, Q.G.; Chang, C.; Medrano, L.; Bleecker, A.B.; Meyerowitz, E.M. ETR2 is an ETR1-like gene involved in ethylene signaling in Arabidopsis. Proc. Natl. Acad. Sci. USA 1998, 95, 5812–5817. [Google Scholar] [CrossRef] [PubMed] [Green Version]
- Clark, K.; Larsen, P.B.; Wang, X.; Chang, C. Association of the Arabidopsis CTR1 Raf-like kinase with the ETR1 and ERS ethylene receptors. Proc. Natl. Acad. Sci. USA 1998, 95, 5401–5406. [Google Scholar] [CrossRef] [Green Version]
- Ouaked, F.; Rozhon, W.; Lecourieux, D.; Hirt, H. A MAPK pathway mediates ethylene signaling in plants. EMBO J. 2003, 22, 1282–1288. [Google Scholar] [CrossRef] [Green Version]
- Ecker, J.R. Reentry of the Ethylene MPK6 Module. Plant Cell 2004, 16, 3169–3173. [Google Scholar] [CrossRef] [Green Version]
- EIN2 and EIN3 in Ethylene Signalling. Available online: https://0-onlinelibrary-wiley-com.brum.beds.ac.uk/doi/pdf/10.1002/9781118223086.ch7 (accessed on 14 February 2012).
- Chao, Q.; Rothenberg, M.; Solano, R.; Roman, G.; Terzaghi, W.; Ecker, J.R. Activation of the ethylene gas response pathway in Arabidopsis by the nuclear protein ETHYLENE-INSENSITIVE3 and related proteins. Cell 1997, 89, 1133–1144. [Google Scholar] [CrossRef] [Green Version]
- Mccourt, P.; Creelman, R.A. The ABA receptors—We report you decide. Curr. Opin. Plant Biol. 2008, 11, 474–478. [Google Scholar] [CrossRef]
- Ma, Y.; Szostkiewicz, I.; Korte, A.; Moes, D.; Yang, Y.; Christmann, A.; Grill, E. Regulators of PP2C Phosphatase Activity Function as Abscisic Acid Sensors. Science 2009, 324, 1064–1068. [Google Scholar]
- Park, S.; Fung, P.; Nishimura, N.; Jensen, D.R.; Fujii, H.; Zhao, Y.; Lumba, S.; Santiago, J.; Rodrigues, A.; Chow, T.F.; et al. Abscisic Acid Inhibits Type 2C Protein Phosphatases via the PYR/PYL Family of START Proteins. Science 2009, 324, 1068–1071. [Google Scholar] [CrossRef] [PubMed] [Green Version]
- Umezawa, T.; Sugiyama, N.; Mizoguchi, M.; Hayashi, S.; Myouga, F.; Yamaguchi-shinozaki, K.; Ishihama, Y.; Hirayama, T.; Shinozaki, K. Type 2C protein phosphatases directly regulate abscisic acid-activated protein kinases in Arabidopsis. Proc. Natl. Acad. Sci. USA 2009, 106, 17588–17593. [Google Scholar] [CrossRef] [PubMed] [Green Version]
- Achard, P.; Cheng, H.; De Grauwe, L.; Decat, J.; Schoutteten, H.; Moritz, T.; Van Der Straeten, D.; Peng, J.; Harberd, N.P. Integration of Plant Responses to Environmentally Activated Phytohormonal Signals. Science 2006, 311, 91–94. [Google Scholar] [CrossRef]
- Razem, F.A.; Elkereamy, A.; Abrams, S.R.; Hill, R.D. The RNA-binding protein FCA is an abscisic acid receptor. Nature 2006, 439, 290–294. [Google Scholar] [CrossRef] [PubMed]
- Emilie, W.; Ekaterina, S.; Yann, A.; Laurence, M.; Thierry, H. Dynamics of Jasmonate Metabolism upon Flowering and across Leaf Stress Responses in Arabidopsis thaliana. Plants 2016, 5, 4. [Google Scholar]
- Ferreira, F.J.; Kieber, J.J. Signaling: Cytokinin Signaling. Curr. Opin. Plant Biol. 2005, 8, 518–525. [Google Scholar] [CrossRef]
- Loake, G.J.; Grant, M. Salicylic acid in plant defence--the players and protagonists. Curr. Opin. Plant Biol. 2007, 10, 466–472. [Google Scholar] [CrossRef]
- Staswick, P.E.; Tiryaki, I.; Rowe, M. Jasmonate Response Locus JAR1 and Several Related Arabidopsis Genes Encode Enzymes of the Firefly Luciferase Superfamily That Show Activity on Jasmonic, Salicylic, and Indole-3-Acetic Acids in an Assay for Adenylation. Plant Cell 2002, 14, 1405–1415. [Google Scholar] [CrossRef] [Green Version]
- Diallo, A.; Agharbaoui, Z.; Badawi, M.A.; Alibenali, M.A.; Moheb, A.; Houde, M.; Sarhan, F. Transcriptome analysis of an mvp mutant reveals important changes in global gene expression and a role for methyl jasmonate in vernalization and flowering in wheat. J. Exp. Bot. 2014, 65, 2271–2286. [Google Scholar] [CrossRef]
- Daloia, M.; Bonhomme, D.; Bouche, F.; Tamseddak, K.; Ormenese, S.; Torti, S.; Coupland, G.; Périlleu, C. Cytokinin promotes flowering of Arabidopsis via transcriptional activation of the FT paralogue TSF. Plant J. 2011, 65, 972–979. [Google Scholar] [CrossRef] [Green Version]
- Denay, G.; Chahtane, H.; Tichtinsky, G.; Parcy, F. A flower is born: An update on Arabidopsis floral meristem formation. Curr. Opin. Plant Biol. 2017, 35, 15–22. [Google Scholar] [CrossRef] [PubMed]
- Genoud, T.; Buchala, A.J.; Chua, N.; Metraux, J. Phytochrome signalling modulates the SA-perceptive pathway in Arabidopsis. Plant J. 2002, 31, 87–95. [Google Scholar] [CrossRef] [PubMed]
- Martínez, C.; Pons, E.; Prats, G.; León, J. Salicylic acid regulates flowering time and links defence responses and reproductive development. Plant J. 2003, 37, 209–217. [Google Scholar] [CrossRef] [PubMed]
- Perilleux, C.; Bernier, G. Leaf carbohydrate status in Lolium temulentum during the induction of flowering. New Phytol. 1997, 135, 59–66. [Google Scholar] [CrossRef]
- Arrom, L.; Munnebosch, S. Sucrose accelerates flower opening and delays senescence through a hormonal effect in cut lily flowers. Plant Sci. 2012, 188, 41–47. [Google Scholar] [CrossRef] [PubMed]
- Sturm, A.; Tang, G. The sucrose-cleaving enzymes of plants are crucial for development, growth and carbon partitioning. Trends Plant Sci. 1999, 4, 401–407. [Google Scholar] [CrossRef]
- Sawitri, W.D.; Afidah, S.N.; Nakagawa, A.; Hase, T.; Sugiharto, B. Identification of UDP-glucose binding site in glycosyltransferase domain of sucrose phosphate synthase from sugarcane (Saccharum officinarum) by structure-based site-directed mutagenesis. Biophys. Rev. 2018, 10, 293–298. [Google Scholar] [CrossRef] [Green Version]
- Hedhly, A.; Vogler, H.; Schmid, M.W.; Pazmino, D.; Gagliardini, V.; Santelia, D.; Grossniklaus, U. Starch Turnover and Metabolism during Flower and Early Embryo Development. Plant Physiol. 2016, 172, 2388–2402. [Google Scholar] [CrossRef] [Green Version]
- Dauvillee, D.; Chochois, V.; Steup, M.; Haebel, S.; Eckermann, N.; Ritte, G.; Ral, J.-P.; Colleoni, C.; Hicks, G.; Wattebled, F.; et al. Plastidial phosphorylase is required for normal starch synthesis in Chlamydomonas reinhardtii. Plant J. 2006, 48, 274–285. [Google Scholar] [CrossRef]
- Wang, T.; Wright, D.; Xu, H.; Yang, Y.; Zheng, R.; Shi, J.; Chen, R.; Wang, L. Expression Patterns, Activities and Sugar Metabolism Regulation of Sucrose Phosphate Synthase, Sucrose Synthase, Neutral Invertase and Soluble Acid Invertase in Different Goji Cultivars during Fruit Development. Russ. J. Plant Phys. 2019, 66, 29–40. [Google Scholar] [CrossRef]
- Niittyla, T.; Messerli, G.; Trevisan, M.; Chen, J.; Smith, A.M.; Zeeman, S.C. A Previously Unknown Maltose Transporter Essential for Starch Degradation in Leaves. Science 2004, 303, 87–89. [Google Scholar] [CrossRef] [PubMed]
- Yue, C.; Cao, H.; Lin, H.; Hu, J.; Ye, Y.; Li, J.; Hao, Z.; Hao, X.; Sun, Y.; Yang, J.; et al. Expression patterns of alpha-amylase and beta-amylase genes provide insights into the molecular mechanisms underlying the responses of tea plants (Camellia sinensis) to stress and postharvest processing treatments. Planta 2019, 250, 281–298. [Google Scholar] [CrossRef] [PubMed]
- Weise, S.E.; Weber, A.P.M.; Sharkey, T.D. Maltose is the major form of carbon exported from the chloroplast at night. Planta 2004, 218, 474–482. [Google Scholar] [CrossRef] [PubMed]
- Van Dijken, A.; Schluepmann, H.; Smeekens, S. Arabidopsis Trehalose-6-Phosphate Synthase 1 Is Essential for Normal Vegetative Growth and Transition to Flowering. Plant Physiol. 2004, 135, 969–977. [Google Scholar] [CrossRef] [PubMed] [Green Version]
- Gomez, L.D.; Gilday, A.D.; Feil, R.; Lunn, J.E.; Graham, I.A. AtTPS1-mediated trehalose 6-phosphate synthesis is essential for embryogenic and vegetative growth and responsiveness to ABA in germinating seeds and stomatal guard cells. Plant J. 2010, 64, 1–13. [Google Scholar] [CrossRef] [PubMed]
- Paul, M.J.; Primavesi, L.F.; Jhurreea, D.; Zhang, Y. Trehalose Metabolism and Signaling. Ann. Rev. Plant Biol. 2008, 59, 417–441. [Google Scholar] [CrossRef] [Green Version]
- Ponnu, J.; Wahl, V.; Schmid, M. Trehalose-6-phosphate: Connecting plant metabolism and development. Front. Plant Sci. 2011, 2, 70. [Google Scholar] [CrossRef] [Green Version]
- Wahl, V.; Ponnu, J.; Schlereth, A.; Arrivault, S.; Langenecker, T.; Franke, A.; Feil, R.; Lunn, J.E.; Stitt, M.; Schmid, M. Regulation of Flowering by Trehalose-6-Phosphate Signaling in Arabidopsis thaliana. Science 2013, 339, 704–707. [Google Scholar] [CrossRef]
- Zhou, J.; Bai, Y.; Dai, R.; Guo, X.; Liu, Z.H.; Yuan, S. Improved Polysaccharide Production by Homologous Co-overexpression of Phosphoglucomutase and UDP Glucose Pyrophosphorylase Genes in the Mushroom Coprinopsis cinerea. J. Argic. Food Chem. 2018, 66, 4702–4709. [Google Scholar] [CrossRef]
- Baron, D.; Bravo, J.P.; Maia, I.D.G.; Pina, A.; Ferreira, G. UGP gene expression and UDP-glucose pyrophosphorylase enzymatic activity in grafting annonaceous plants. Acta Physiol. Plant. 2016, 38, 1–8. [Google Scholar] [CrossRef] [Green Version]
- Valverde, F.; Mouradov, A.; Soppe, W.J.; Ravenscroft, D.; Samach, A.; Coupland, G. Photoreceptor Regulation of CONSTANS Protein in Photoperiodic Flowering. Science 2004, 303, 1003–1006. [Google Scholar] [CrossRef] [PubMed] [Green Version]
- Paina, C.; Byrne, S.; Domnisoru, C.; Asp, T. Vernalization mediated changes in the Lolium perenne transcriptome. PLoS ONE 2014, 9, e107365. [Google Scholar] [CrossRef] [PubMed] [Green Version]
- Zheng, Y.; Luo, L.; Liu, Y.; Yang, Y.; Wang, C.; Kong, X.; Yang, Y. Effect of vernalization on tuberization and flowering in the Tibetan turnip is associated with changes in the expression of FLC homologues. Plant Divers. 2018, 40, 50–56. [Google Scholar] [CrossRef] [PubMed]


© 2020 by the authors. Licensee MDPI, Basel, Switzerland. This article is an open access article distributed under the terms and conditions of the Creative Commons Attribution (CC BY) license (http://creativecommons.org/licenses/by/4.0/).
Share and Cite
Dai, Y.; Zhang, S.; Sun, X.; Li, G.; Yuan, L.; Li, F.; Zhang, H.; Zhang, S.; Chen, G.; Wang, C.; et al. Comparative Transcriptome Analysis of Gene Expression and Regulatory Characteristics Associated with Different Vernalization Periods in Brassica rapa. Genes 2020, 11, 392. https://0-doi-org.brum.beds.ac.uk/10.3390/genes11040392
Dai Y, Zhang S, Sun X, Li G, Yuan L, Li F, Zhang H, Zhang S, Chen G, Wang C, et al. Comparative Transcriptome Analysis of Gene Expression and Regulatory Characteristics Associated with Different Vernalization Periods in Brassica rapa. Genes. 2020; 11(4):392. https://0-doi-org.brum.beds.ac.uk/10.3390/genes11040392
Chicago/Turabian StyleDai, Yun, Shujiang Zhang, Xiao Sun, Guoliang Li, Lingyun Yuan, Fei Li, Hui Zhang, Shifan Zhang, Guohu Chen, Chenggang Wang, and et al. 2020. "Comparative Transcriptome Analysis of Gene Expression and Regulatory Characteristics Associated with Different Vernalization Periods in Brassica rapa" Genes 11, no. 4: 392. https://0-doi-org.brum.beds.ac.uk/10.3390/genes11040392