Genome-Wide Analysis Revealed Homozygosity and Demographic History of Five Chinese Sheep Breeds Adapted to Different Environments

 ,
,  , , ,
, , ,
Abstract
:1. Introduction
2. Materials and Methods
2.1. Samples Collection and DNA Extraction
2.2. Genotyping and Quality Control
2.3. Runs of Homozygosity Analysis
2.4. Detection of Common Auto-Zygosity Islands
2.5. Effective Population Size
3. Results
3.1. SNPs Filtration, Minor Alleles Frequency and Linkage Disequilibrium
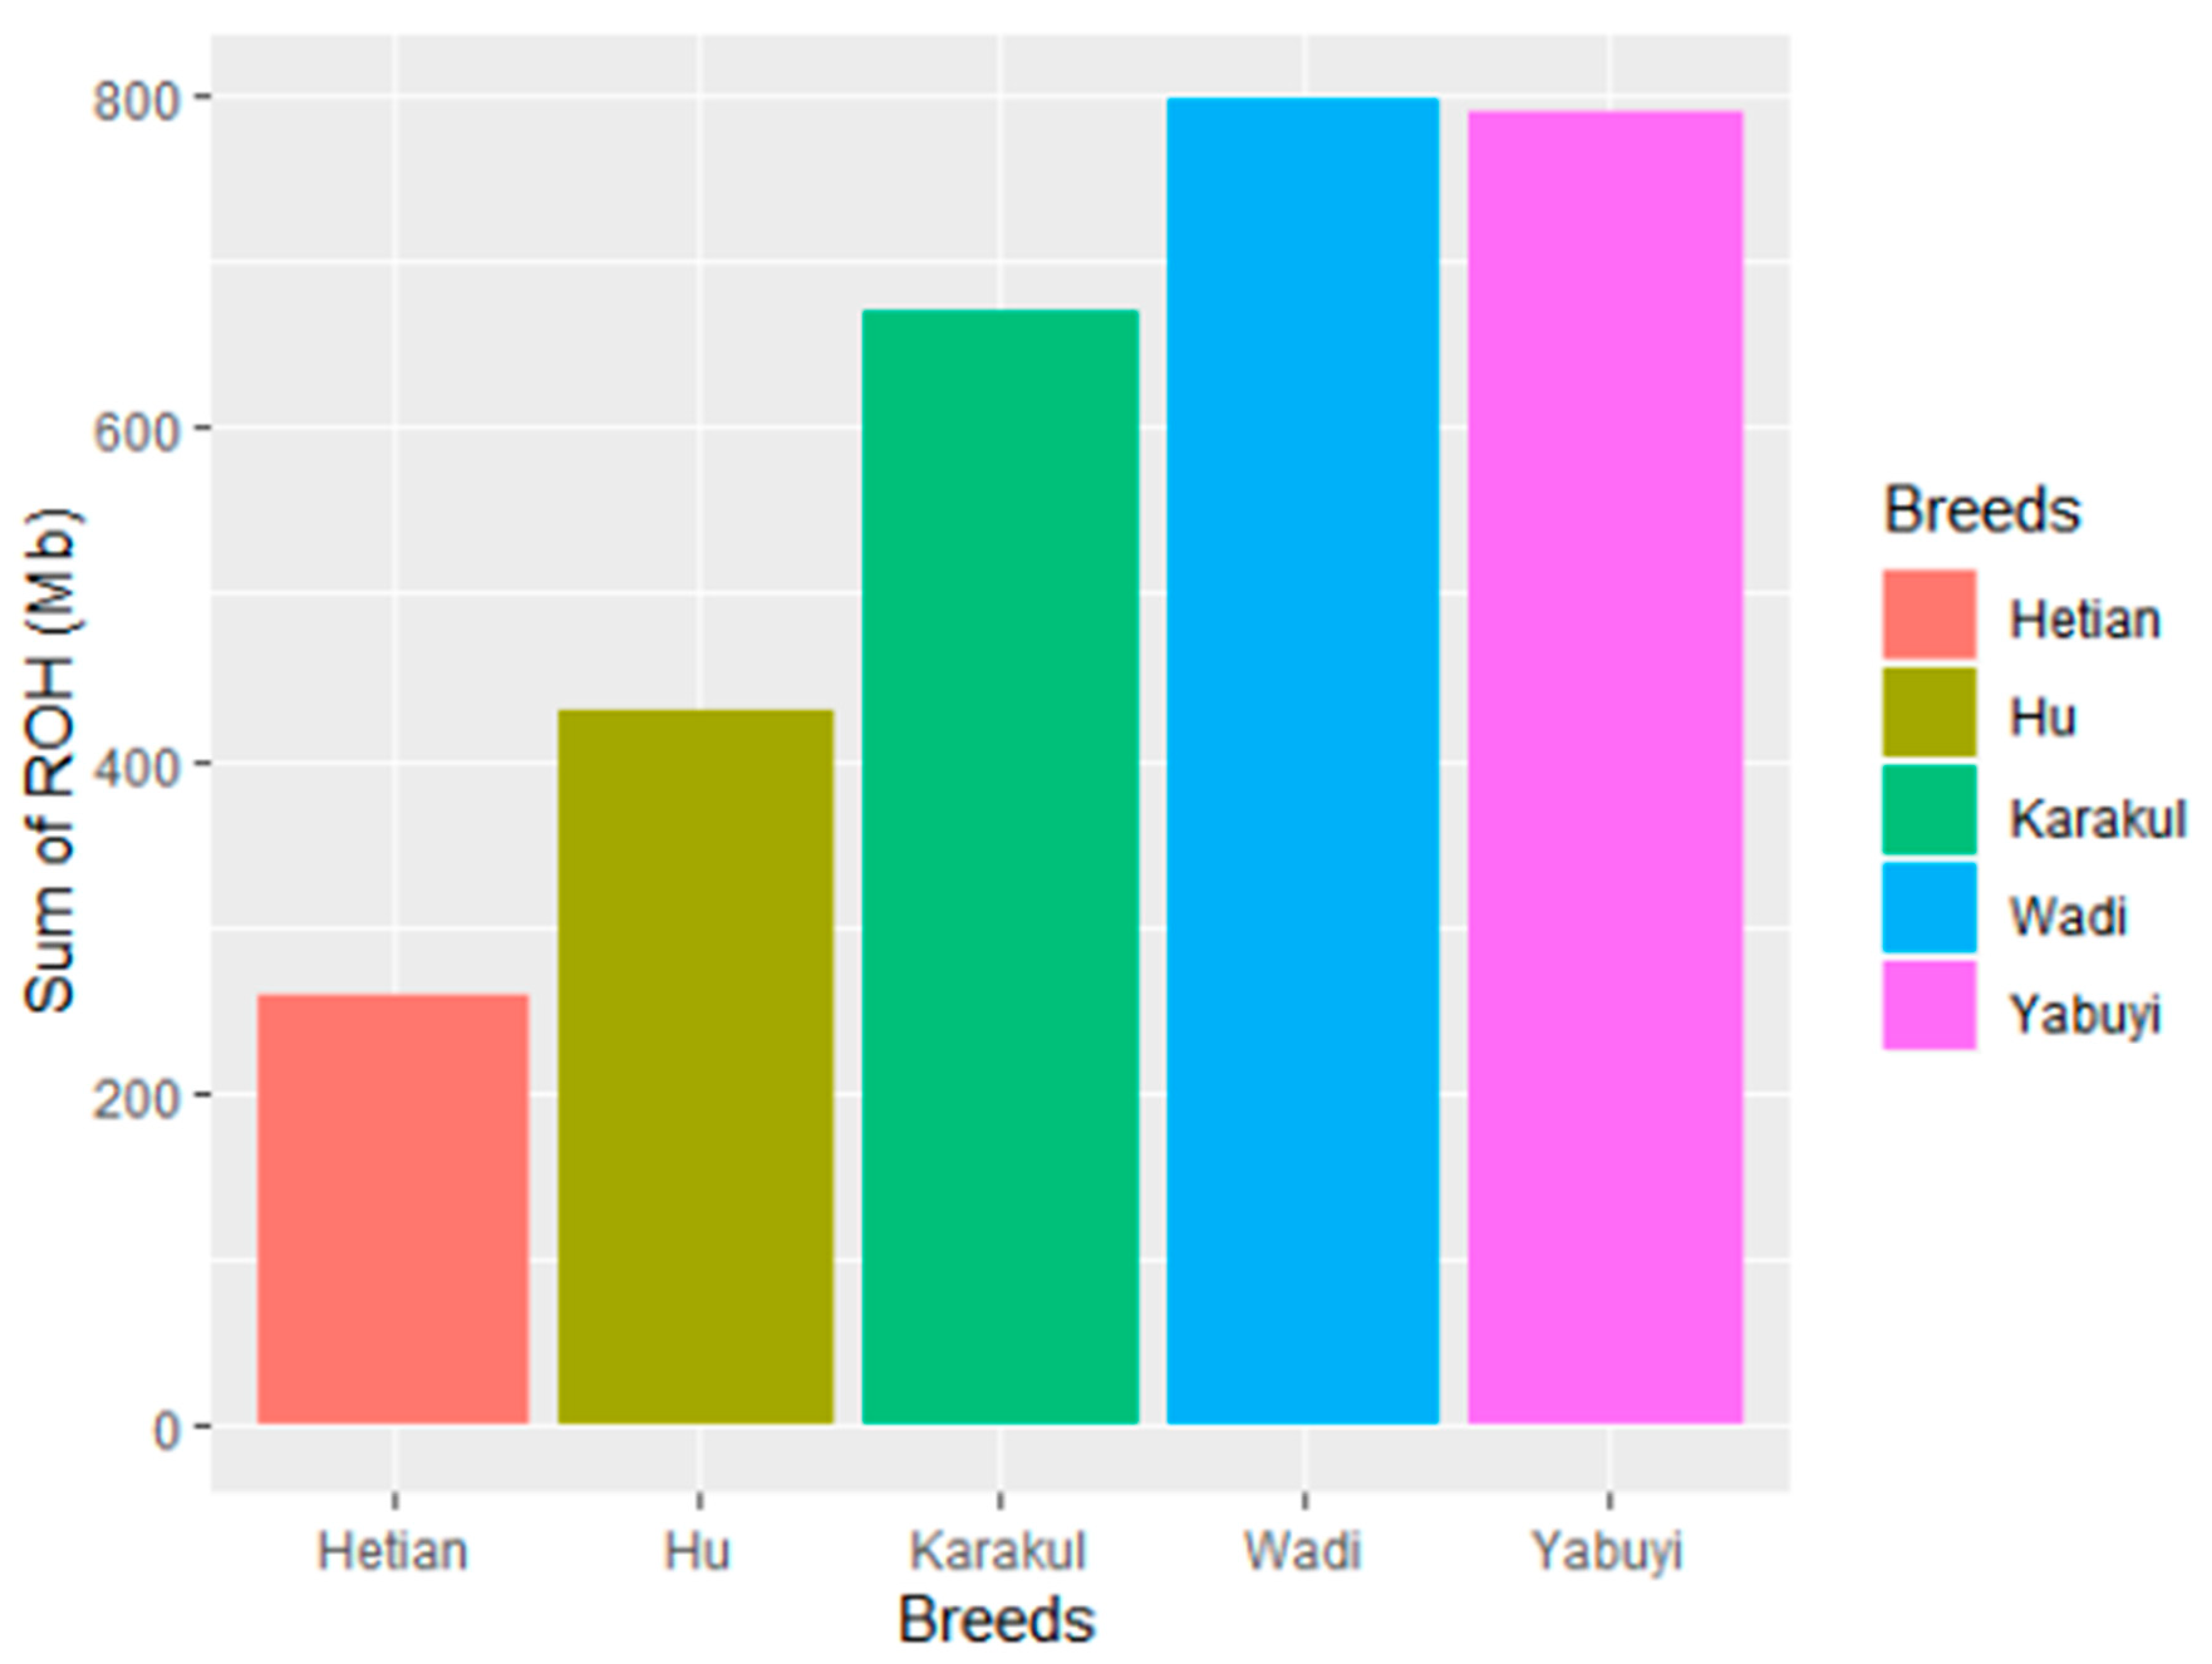
3.2. Runs of Homozygosity (ROH) Patterns
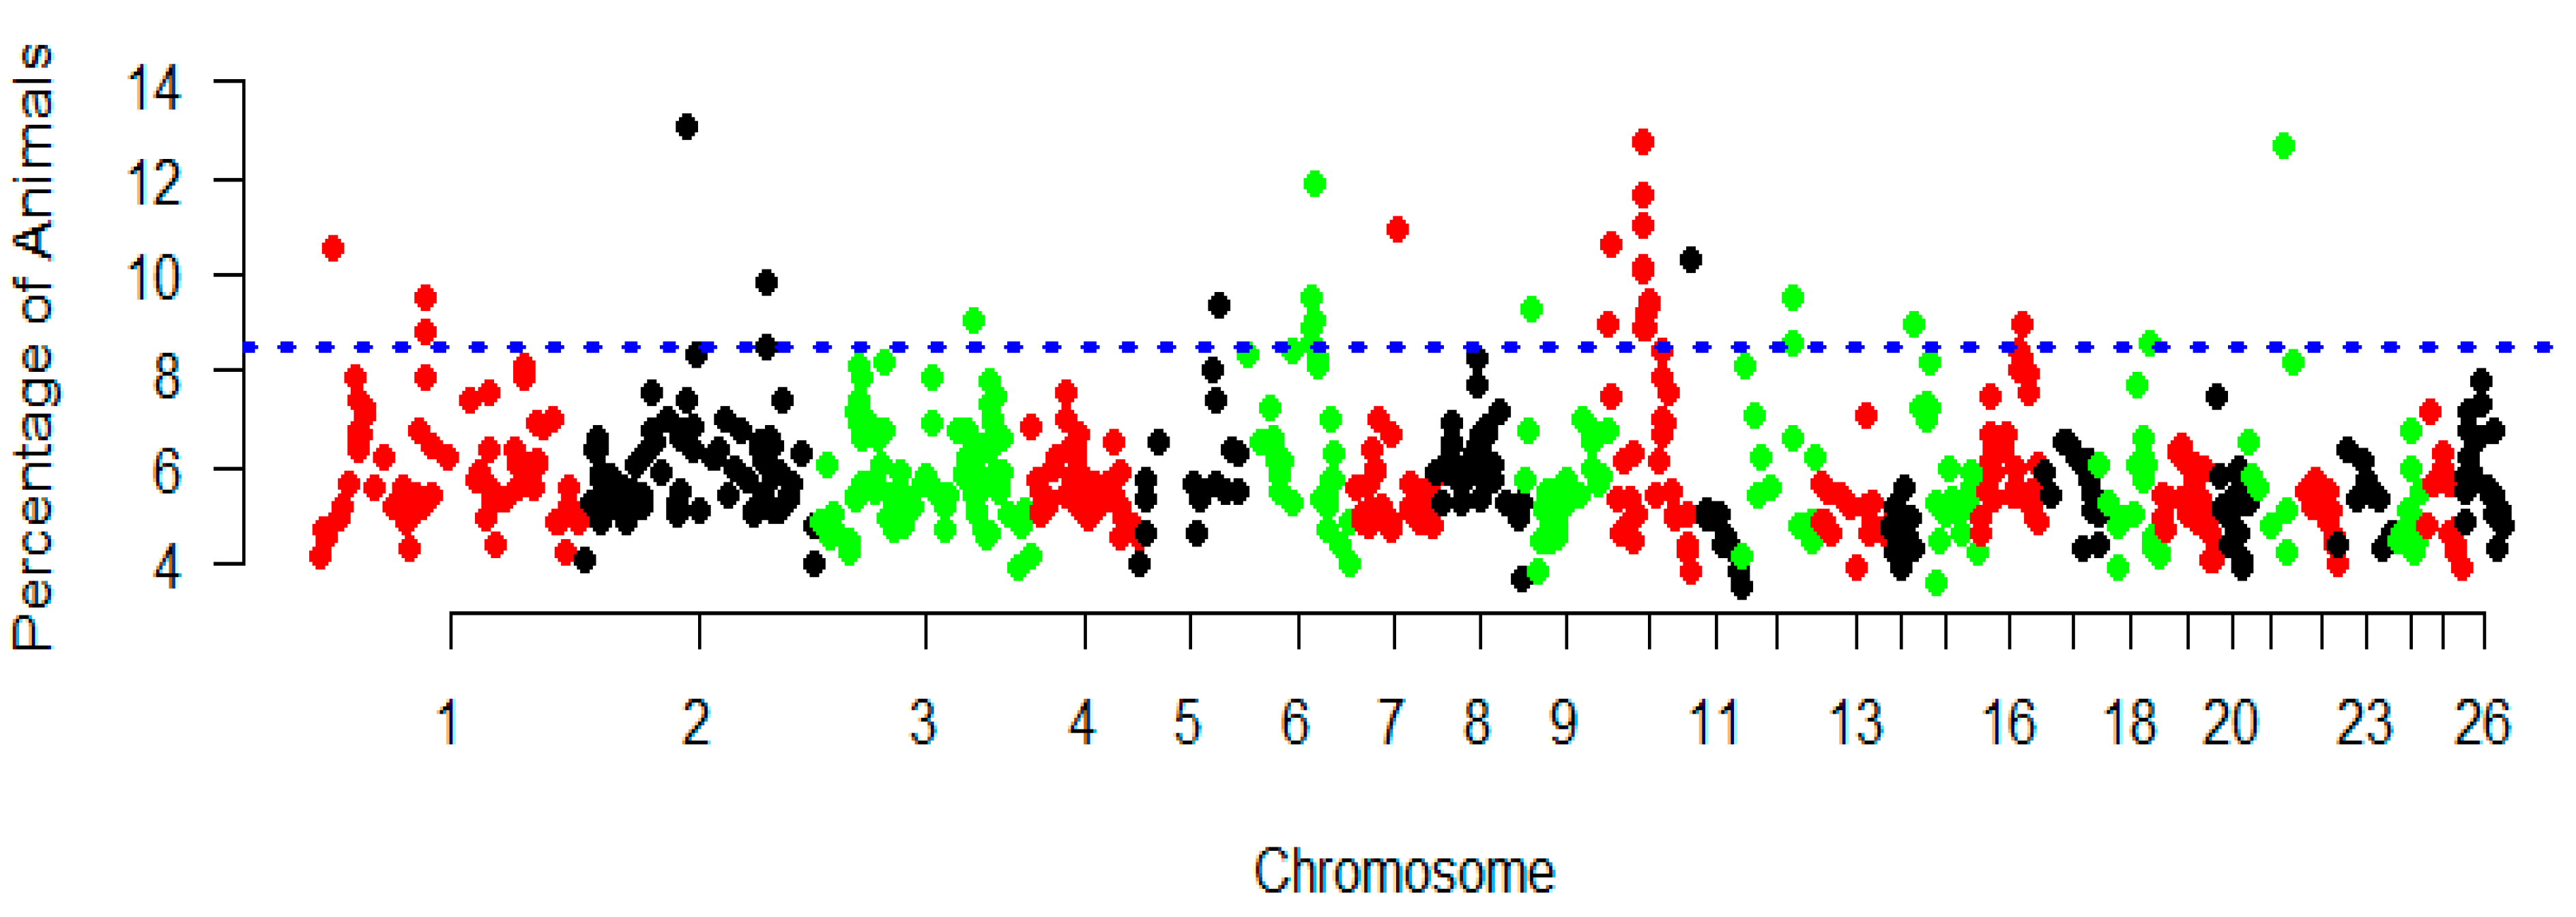
3.3. Genomic Regions with a High ROH Frequency
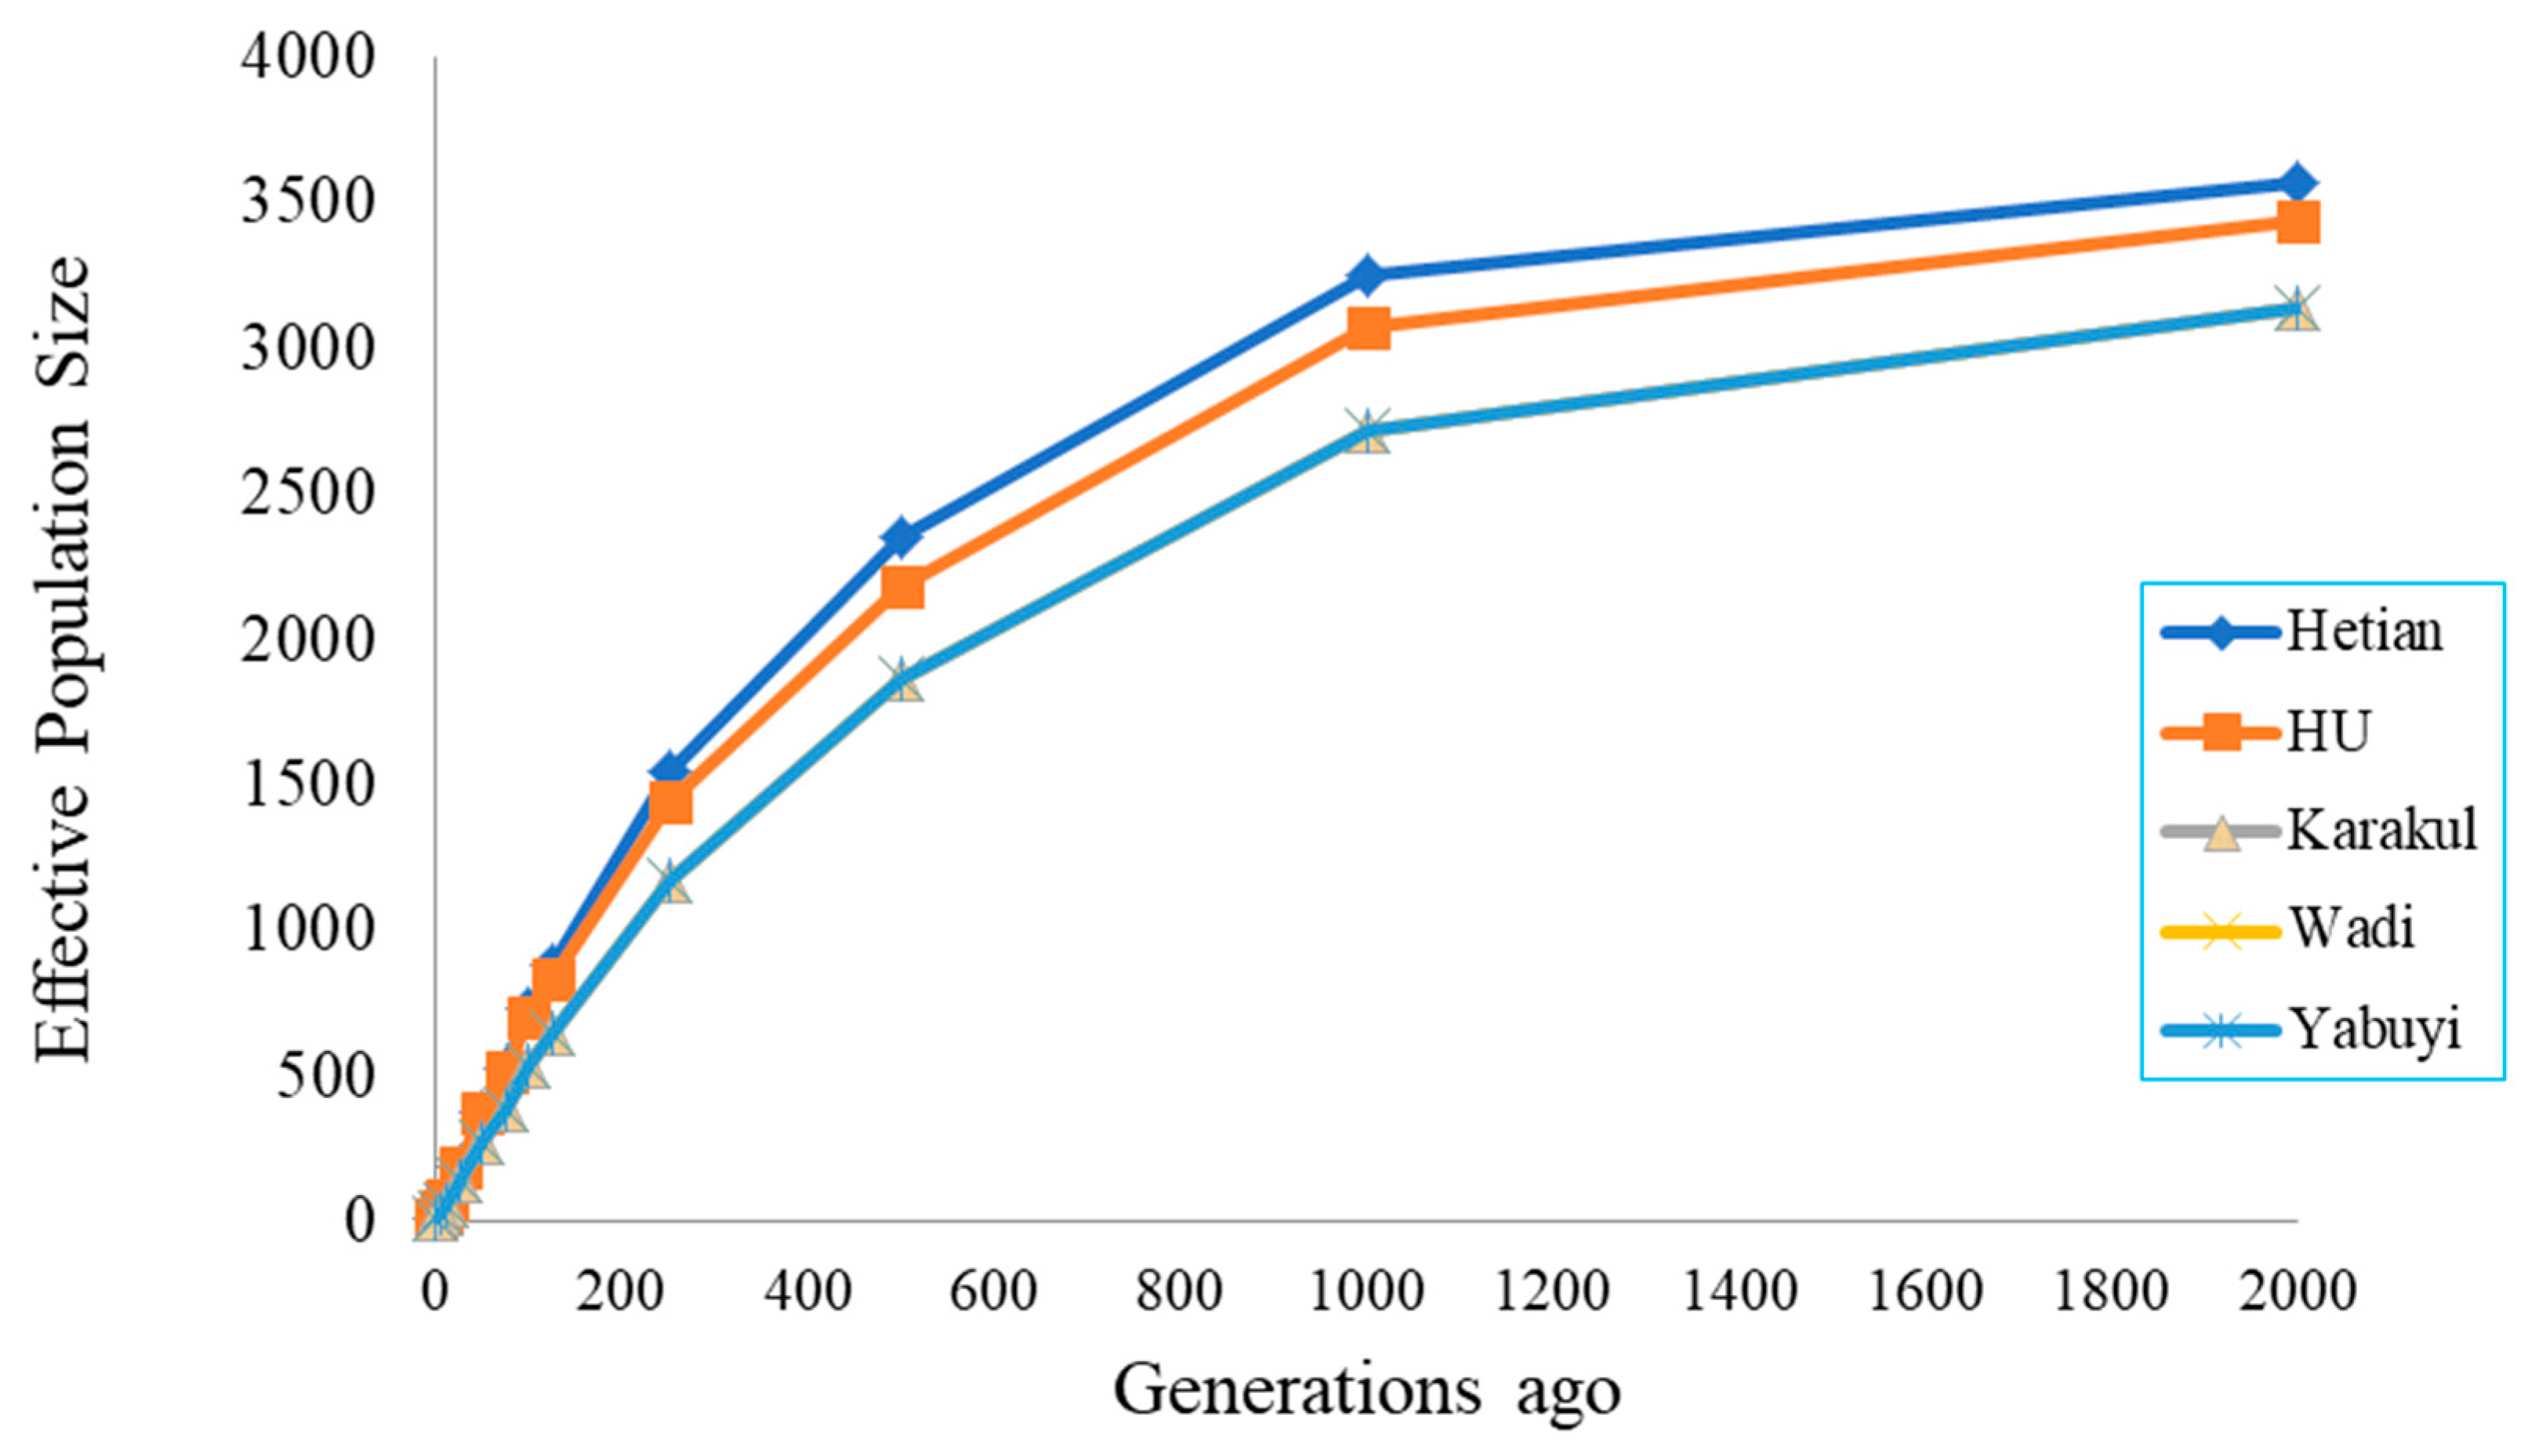
3.4. Effective Population Sizes
4. Discussion
4.1. Linkage Disequilibrium
4.2. Effective Population Size
4.3. ROHs
4.4. ROH Candidate Genes
4.4.1. Genes Related to Adaptive and Innate Immune Response
4.4.2. Genes Associated with Disease Resistance
4.4.3. Genes Associated with Body Weight and Digestive Metabolism Traits
5. Conclusions
Supplementary Materials
Author Contributions
Funding
Acknowledgments
Conflicts of Interest
Data Accessibility
References
- Peripolli, E.; Munari, D.P.; Silva, M.V.G.B.; Lima, A.L.F.; Irgang, R.; Baldi, F. Runs of homozygosity: Current knowledge and applications in livestock. Anim. Genet. 2017, 48, 255–271. [Google Scholar] [CrossRef]
- Ghoreishifar, S.M.; Moradi-Shahrbabak, H.; Fallahi, M.H.; Moradi-Shahrbabak, M.; Abdollahi-Arpanahi, R.; Khansefid, M. Genomic measures of inbreeding coefficients and genome-wide scan for runs of homozygosity islands in Iranian river buffalo, Bubalus bubalis. BMC Genet. 2020, 21, 16. [Google Scholar] [CrossRef] [PubMed] [Green Version]
- Bosse, M.; Megens, H.-J.; Madsen, O.; Paudel, Y.; Frantz, L.A.F.; Schook, L.B.; Crooijmans, R.P.M.A.; Groenen, M.A.M. Regions of Homozygosity in the Porcine Genome: Consequence of Demography and the Recombination Landscape. PLoS Genet. 2012, 8, e1003100. [Google Scholar] [CrossRef] [PubMed] [Green Version]
- Marras, G.; Gaspa, G.; Sorbolini, S.; DiMauro, C.; Ajmone-Marsan, P.; Valentini, A.; Williams, J.L.; Macciotta, N.P.P. Analysis of runs of homozygosity and their relationship with inbreeding in five cattle breeds farmed in Italy. Anim. Genet. 2014, 46, 110–121. [Google Scholar] [CrossRef] [PubMed]
- Qanbari, S.; Simianer, H. Mapping signatures of positive selection in the genome of livestock. Livest. Sci. 2014, 166, 133–143. [Google Scholar] [CrossRef]
- Purfield, D.C.; Berry, D.; McParland, S.; Bradley, D.G. Runs of homozygosity and population history in cattle. BMC Genet. 2012, 13, 70. [Google Scholar] [CrossRef] [Green Version]
- Islam, R.; Li, Y.; Liu, X.; Berihulay, H.; Abied, A.; Gebreselassie, G.; Ma, Q.; Ma, Y. Genome-Wide Runs of Homozygosity, Effective Population Size, and Detection of Positive Selection Signatures in Six Chinese Goat Breeds. Genes 2019, 10, 938. [Google Scholar] [CrossRef] [Green Version]
- Zhao, G.; Zhang, T.; Liu, Y.; Wang, Z.; Xu, L.; Zhu, B.; Gao, X.; Zhang, L.; Gao, H.; Liu, G.E.; et al. Genome-Wide Assessment of Runs of Homozygosity in Chinese Wagyu Beef Cattle. Animals 2020, 10, 1425. [Google Scholar] [CrossRef]
- Howrigan, D.P.; Simonson, M.A.; Keller, M.C. Detecting autozygosity through runs of homozygosity: A comparison of three autozygosity detection algorithms. BMC Genom. 2011, 12, 460. [Google Scholar] [CrossRef] [Green Version]
- Liu, S.; He, S.; Chen, L.; Li, W.; Di, J.; Liu, M. Estimates of linkage disequilibrium and effective population sizes in Chinese Merino (Xinjiang type) sheep by genome-wide SNPs. Genes Genom. 2017, 39, 733–745. [Google Scholar] [CrossRef] [Green Version]
- Shin, D.-H.; Cho, K.-H.; Park, K.-D.; Lee, H.-J.; Kim, H. Accurate Estimation of Effective Population Size in the Korean Dairy Cattle Based on Linkage Disequilibrium Corrected by Genomic Relationship Matrix. Asian Australas. J. Anim. Sci. 2013, 26, 1672–1679. [Google Scholar] [CrossRef] [PubMed] [Green Version]
- Gibson, J.; Morton, N.E.; Collins, A. Extended tracts of homozygosity in outbred human populations. Hum. Mol. Genet. 2006, 15, 789–795. [Google Scholar] [CrossRef] [PubMed] [Green Version]
- Lencz, T.; Lambert, C.; DeRosse, P.; Burdick, K.E.; Morgan, T.V.; Kane, J.M.; Kucherlapati, R.; Malhotra, A.K. Runs of homozygosity reveal highly penetrant recessive loci in schizophrenia. Proc. Natl. Acad. Sci. USA 2007, 104, 19942–19947. [Google Scholar] [CrossRef] [PubMed] [Green Version]
- Megens, H.-J.; Crooijmans, R.P.M.A.; Bastiaansen, J.W.M.; Kerstens, H.H.; Coster, A.; Jalving, R.; Vereijken, A.; Silva, P.; Muir, W.M.; Cheng, H.H.; et al. Comparison of linkage disequilibrium and haplotype diversity on macro-and microchromosomes in chicken. BMC Genet. 2009, 10, 86. [Google Scholar] [CrossRef] [PubMed] [Green Version]
- Curik, I.; Ferenčaković, M.; Sölkner, J. Inbreeding and runs of homozygosity: A possible solution to an old problem. Livest. Sci. 2014, 166, 26–34. [Google Scholar] [CrossRef]
- Kirin, M.; McQuillan, R.; Franklin, C.S.; Campbell, H.; McKeigue, P.M.; Wilson, J.F. Genomic Runs of Homozygosity Record Population History and Consanguinity. PLoS ONE 2010, 5, e13996. [Google Scholar] [CrossRef] [Green Version]
- Herrero-Medrano, J.M.; Megens, H.-J.; Groenen, M.A.M.; Ramis, G.; Bosse, M.; Pérez-Enciso, M.; Crooijmans, R.P.M.A. Conservation genomic analysis of domestic and wild pig populations from the Iberian Peninsula. BMC Genet. 2013, 14, 106. [Google Scholar] [CrossRef] [Green Version]
- Bosse, M.; Megens, H.-J.; Madsen, O.; Crooijmans, R.P.; Ryder, O.A.; Austerlitz, F.; Groenen, M.A.; De Cara, M.A.R. Using genome-wide measures of coancestry to maintain diversity and fitness in endangered and domestic pig populations. Genome Res. 2015, 25, 970–981. [Google Scholar] [CrossRef] [Green Version]
- De Cara, M.A.R.; Ángeles, R.; Villanueva, B.; Toro, M.A.; Fernández, J. Using genomic tools to maintain diversity and fitness in conservation programmes. Mol. Ecol. 2013, 22, 6091–6099. [Google Scholar] [CrossRef]
- Nalls, M.A.; Guerreiro, R.J.; Simón-Sánchez, J.; Bras, J.; Traynor, B.J.; Gibbs, J.R.; Launer, L.; Hardy, J.; Singleton, A.B. Extended tracts of homozygosity identify novel candidate genes associated with late-onset Alzheimer’s disease. Neurogenetics 2009, 10, 183–190. [Google Scholar] [CrossRef] [Green Version]
- Szpiech, Z.A.; Xu, J.; Pemberton, T.J.; Peng, W.; Zöllner, S.; Rosenberg, N.A.; Li, J.Z. Long Runs of Homozygosity Are Enriched for Deleterious Variation. Am. J. Hum. Genet. 2013, 93, 90–102. [Google Scholar] [CrossRef] [PubMed] [Green Version]
- Vine, A.E.; McQuillin, A.; Bass, N.J.; Pereira, A.; Kandaswamy, R.; Robinson, M.; Lawrence, J.; Anjorin, A.; Sklar, P.; Gurling, H.M.; et al. No evidence for excess runs of homozygosity in bipolar disorder. Psychiatr. Genet. 2009, 19, 165–170. [Google Scholar] [CrossRef] [PubMed]
- Peripolli, E.; Stafuzza, N.B.; Munari, D.P.; Lima, A.L.F.; Irgang, R.; Machado, M.A.; Panetto, J.C.D.C.; Ventura, R.V.; Baldi, F.; Da Silva, M.V.G. Assessment of runs of homozygosity islands and estimates of genomic inbreeding in Gyr (Bos indicus) dairy cattle. BMC Genom. 2018, 19, 34. [Google Scholar] [CrossRef] [PubMed]
- Zhang, Q.; Calus, M.P.L.; Guldbrandtsen, B.; Lund, M.S.; Sahana, G. Estimation of inbreeding using pedigree, 50k SNP chip genotypes and full sequence data in three cattle breeds. BMC Genet. 2015, 16, 34. [Google Scholar] [CrossRef] [PubMed] [Green Version]
- Xu, Z.; Sun, H.; Zhang, Z.; Zhao, Q.; Olasege, B.S.; Li, Q.; Yue, Y.; Ma, P.; Zhang, X.; Wang, Q.-S.; et al. Assessment of Autozygosity Derived from Runs of Homozygosity in Jinhua Pigs Disclosed by Sequencing Data. Front. Genet. 2019, 10, 274. [Google Scholar] [CrossRef] [PubMed]
- Zhang, Y.; Young, J.; Wang, C.; Sun, X.; Wolc, A.; Dekkers, J. Inbreeding by pedigree and genomic markers in selection lines of pigs. In Proceedings of the 10th World Congress of Genetics Applied to Livestock Production, Vancouver, BC, Canada, 17–22 August 2014. [Google Scholar]
- Almamun, H.A.; Clark, S.A.; Kwan, P.; Gondro, C. Genome-wide linkage disequilibrium and genetic diversity in five populations of Australian domestic sheep. Genet. Sel. Evol. 2015, 47, 90. [Google Scholar] [CrossRef] [Green Version]
- Ghoreishifar, S.M.; Moradi-Shahrbabak, H.; Parna, N.; Davoudi, P.; Khansefid, M. Linkage disequilibrium and within-breed genetic diversity in Iranian Zandi sheep. Arch. Anim. Breed. 2019, 62, 143–151. [Google Scholar] [CrossRef]
- Kim, E.-S.; Elbeltagy, A.R.; Aboul-Naga, A.M.; Rischkowsky, B.; Sayre, B.; Mwacharo, J.M.; Rothschild, M.F. Multiple genomic signatures of selection in goats and sheep indigenous to a hot arid environment. Heredity 2015, 116, 255–264. [Google Scholar] [CrossRef]
- Mastrangelo, S.; Portolano, B.; Di Gerlando, R.; Ciampolini, R.; Tolone, M.; Sardina, M.T. The International Sheep Genomics Consortium Genome-wide analysis in endangered populations: A case study in Barbaresca sheep. Animals 2017, 11, 1107–1116. [Google Scholar]
- Purfield, D.C.; McParland, S.; Wall, E.; Berry, D.P. The distribution of runs of homozygosity and selection signatures in six commercial meat sheep breeds. PLoS ONE 2017, 12, e0176780. [Google Scholar] [CrossRef] [Green Version]
- Biscarini, F.; Nicolazzi, E.L.; Stella, A.; Boettcher, P.J.; Gandini, G. Challenges and opportunities in genetic improvement of local livestock breeds. Front. Genet. 2015, 6, 33. [Google Scholar] [CrossRef] [PubMed] [Green Version]
- Toro, M.A.; Varona, L. A note on mate allocation for dominance handling in genomic selection. Genet. Sel. Evol. 2010, 42, 33. [Google Scholar] [CrossRef] [PubMed] [Green Version]
- Sambrook, J.; Fritsch, E.F.; Maniatis, T. Molecular Cloning: A Laboratory Manual; Cold Spring Harbor Laboratory Press: New York, NY, USA, 1989. [Google Scholar]
- Purcell, S.; Neale, B.; Todd-Brown, K.; Thomas, L.; Ferreira, M.A.R.; Bender, D.; Maller, J.; Sklar, P.; De Bakker, P.I.W.; Daly, M.J.; et al. PLINK: A Tool Set for Whole-Genome Association and Population-Based Linkage Analyses. Am. J. Hum. Genet. 2007, 81, 559–575. [Google Scholar] [CrossRef] [PubMed] [Green Version]
- Mastrangelo, S.; Ciani, E.; Sardina, M.T.; Sottile, G.; Pilla, F.; Portolano, B.; Italian Sheep Consortium. Runs of homozygosity reveal genome-wide autozygosity in Italian sheep breeds. Anim. Genet. 2018, 49, 71–81. [Google Scholar] [CrossRef] [Green Version]
- McQuillan, R.; Leutenegger, A.-L.; Abdel-Rahman, R.; Franklin, C.S.; Pericic, M.; Barac-Lauc, L.; Smolej-Narancic, N.; Janicijevic, B.; Polasek, O.; Tenesa, A.; et al. Runs of Homozygosity in European Populations. Am. J. Hum. Genet. 2008, 83, 359–372. [Google Scholar] [CrossRef] [Green Version]
- Szmatoła, T.; Gurgul, A.; Ropka-Molik, K.; Jasielczuk, I.; Zabek, T.; Bugno-Poniewierska, M. Characteristics of runs of homozygosity in selected cattle breeds maintained in Poland. Livest. Sci. 2016, 188, 72–80. [Google Scholar] [CrossRef]
- Huang, D.; Sherman, B.; Lempicki, R. Systematic and integrative analysis of large gene lists using DAVID Bioinformatics Resources. Nature Protoc. 2009, 4, 44–57. [Google Scholar] [CrossRef]
- Huang, D.W.; Sherman, B.T.; Lempicki, R.A. Bioinformatics enrichment tools: Paths toward the comprehensive functional analysis of large gene lists. Nucleic Acids Res. 2009, 37, 1–13. [Google Scholar] [CrossRef] [Green Version]
- Sved, J. Linkage disequilibrium and homozygosity of chromosome segments in finite populations. Theor. Popul. Biol. 1971, 2, 125–141. [Google Scholar] [CrossRef]
- Barbato, M.; Orozco-Terwengel, P.; Tapio, M.; Bruford, M.W. SNeP: A tool to estimate trends in recent effective population size trajectories using genome-wide SNP data. Front. Genet. 2015, 6, 109. [Google Scholar] [CrossRef] [Green Version]
- Hayes, B.J.; Visscher, P.M.; McPartlan, H.C.; Goddard, M.E. Novel Multilocus Measure of Linkage Disequilibrium to Estimate Past Effective Population Size. Genome Res. 2003, 13, 635–643. [Google Scholar] [CrossRef] [PubMed] [Green Version]
- Pemberton, T.J.; Absher, D.; Feldman, M.W.; Myers, R.M.; Rosenberg, N.A.; Li, J.Z. Genomic Patterns of Homozygosity in Worldwide Human Populations. Am. J. Hum. Genet. 2012, 91, 275–292. [Google Scholar] [CrossRef] [Green Version]
- Abied, A.; Bagadi, A.; Bordbar, F.; Pu, Y.; Augustino, S.M.; Xue, X.; Xing, F.; Gebreselassie, G.; Han, J.-L.; Mwacharo, J.M.; et al. Genomic Diversity, Population Structure, and Signature of Selection in Five Chinese Native Sheep Breeds Adapted to Extreme Environments. Genes 2020, 11, 494. [Google Scholar] [CrossRef] [PubMed]
- Kijas, J.W.; Townley, D.; Dalrymple, B.P.; Heaton, M.P.; Maddox, J.F.; McGrath, A.; Wilson, P.; Ingersoll, R.G.; McCulloch, R.; McWilliam, S.; et al. A Genome Wide Survey of SNP Variation Reveals the Genetic Structure of Sheep Breeds. PLoS ONE 2009, 4. [Google Scholar] [CrossRef] [PubMed] [Green Version]
- Zapata, C. The D’measure of overall gametic disequilibrium between pairs of multiallelic loci. Evolution 2000, 54, 1809–1812. [Google Scholar] [PubMed] [Green Version]
- Wray, N.R. Allele frequencies and the r2 measure of linkage disequilibrium: Impact on design and interpretation of association studies. Twin Res. Hum. Genet. 2005, 8, 87–94. [Google Scholar] [CrossRef] [PubMed]
- Khatkar, M.S.; Nicholas, F.W.; Collins, A.R.; Zenger, K.R.; Cavanagh, J.A.L.; Barris, W.; Schnabel, R.D.; Taylor, J.F.; Raadsma, H.W. Extent of genome-wide linkage disequilibrium in Australian Holstein-Friesian cattle based on a high-density SNP panel. BMC Genom. 2008, 9, 187. [Google Scholar] [CrossRef] [Green Version]
- Makina, S.O.; Taylor, J.F.; Van Marle-Köster, E.; Muchadeyi, F.C.; Makgahlela, M.L.; MacNeil, M.D.; Maiwashe, A. Extent of Linkage Disequilibrium and Effective Population Size in Four South African Sanga Cattle Breeds. Front. Genet. 2015, 6, 337. [Google Scholar] [CrossRef] [Green Version]
- Townsend, S.M.; Jamieson, I.G. Molecular and pedigree measures of relatedness provide similar estimates of inbreeding depression in a bottlenecked population. J. Evol. Biol. 2013, 26, 889–899. [Google Scholar] [CrossRef]
- Alvarenga, A.B.; Rovadoscki, G.A.; Petrini, J.; Coutinho, L.L.; Morota, G.; Spangler, M.L.; Pinto, L.F.B.; Carvalho, G.G.P.; Mourão, G. Linkage disequilibrium in Brazilian Santa Inês breed, Ovis aries. Sci. Rep. 2018, 8, 8851. [Google Scholar] [CrossRef] [Green Version]
- He, S.; Di, J.; Han, B.; Chen, L.; Liu, M.; Li, W. Genome-Wide Scan for Runs of Homozygosity Identifies Candidate Genes Related to Economically Important Traits in Chinese Merino. Animals 2020, 10, 524. [Google Scholar] [CrossRef] [PubMed] [Green Version]
- Luigi-Sierra, M.G.; Cardoso, T.G.; Martínez, A.; Pons, A.; Bermejo, L.A.; Jordana, J.; Delgado, J.V.; Adán, S.; Ugarte, E.; Arranz, J.J. Low genome-wide homozygosity in 11 Spanish ovine breeds. Anim. Genet. 2019, 50, 501–511. [Google Scholar] [CrossRef] [PubMed]
- Gibbs, R.; Taylor, J.F.; Van Tassell, C.P.; Barendse, W.; Eversole, K.A.; Gill, C.A.; Green, R.D.; Hamernik, D.L.; Kappes, S.M.; Matukumalli, L.K.; et al. Genome-Wide Survey of SNP Variation Uncovers the Genetic Structure of Cattle Breeds. Science 2009, 324, 528–532. [Google Scholar] [PubMed] [Green Version]
- Goddard, M. Genomic selection: Prediction of accuracy and maximization of long term response. Genetica 2009, 136, 245–257. [Google Scholar] [CrossRef]
- Brito, L.F.; Jafarikia, M.; Grossi, D.D.A.; Kijas, J.W.; Porto-Neto, L.R.; Ventura, R.V.; Sargolzaei, M.; Schenkel, F.S. Characterization of linkage disequilibrium, consistency of gametic phase and admixture in Australian and Canadian goats. BMC Genet. 2015, 16, 67. [Google Scholar] [CrossRef] [Green Version]
- Bradley, D.G.; Fries, R.; Bumstead, N.; Nicholas, F.W.; Cothran, E.G.; Ollivier, L.; Crawford, A.M. Secondary Guidelines for Development of National Farm Animal Genetic Resources Management Plans; Food and Agricultural Organization of United Nations (FAO): Rome, Italy, 2004. [Google Scholar]
- Gregory, K.E.; Cundiff, L.V.; Koch, R.M. Composite Breeds to Use Heterosis and Breed Differences to Improve Efficiency of Beef Production; US Department of Agriculture, Agricultural Research Service: Beltsville, MA, USA, 1999.
- Bjelland, D.; Weigel, K.; Vukasinovic, N.; Nkrumah, J. Evaluation of inbreeding depression in Holstein cattle using whole-genome SNP markers and alternative measures of genomic inbreeding. J. Dairy Sci. 2013, 96, 4697–4706. [Google Scholar] [CrossRef]
- Signer-Hasler, H.; Burren, A.; Ammann, P.; Drögemüller, C.; Flury, C. Runs of homozygosity and signatures of selection: A comparison among eight local Swiss sheep breeds. Anim. Genet. 2019, 50, 512–525. [Google Scholar] [CrossRef]
- Manunza, A.; Noce, A.; Serradilla, J.M.; Goyache, F.; Martínez, A.; Capote, J.; Delgado, J.V.; Jordana, J.; Muñoz, E.; Molina, A.; et al. A genome-wide perspective about the diversity and demographic history of seven Spanish goat breeds. Genet. Sel. Evol. 2016, 48, 52. [Google Scholar] [CrossRef] [Green Version]
- Ciani, E.; Crepaldi, P.; Nicoloso, L.; Lasagna, E.; Sarti, F.M.; Moioli, B.; Napolitano, F.; Carta, A.; Usai, G.; D’Andrea, D.M.M.; et al. Genome-wide analysis of Italian sheep diversity reveals a strong geographic pattern and cryptic relationships between breeds. Anim. Genet. 2014, 45, 256–266. [Google Scholar] [CrossRef]
- Brito, L.F.; Kijas, J.W.; Ventura, R.V.; Sargolzaei, M.; Porto-Neto, L.R.; Cánovas, A.; Feng, Z.; Jafarikia, M.; Schenkel, F.S. Genetic diversity and signatures of selection in various goat breeds revealed by genome-wide SNP markers. BMC Genom. 2017, 18, 229. [Google Scholar] [CrossRef] [Green Version]
- Kim, E.-S.; Cole, J.B.; Huson, H.; Wiggans, G.R.; Van Tassell, C.P.; Crooker, B.A.; Liu, G.; Da, Y.; Sonstegard, T.S. Effect of Artificial Selection on Runs of Homozygosity in U.S. Holstein Cattle. PLoS ONE 2013, 8, e80813. [Google Scholar] [CrossRef] [PubMed] [Green Version]
- Mastrangelo, S.; Tolone, M.; Sardina, M.T.; Sottile, G.; Sutera, A.M.; Di Gerlando, R.; Portolano, B. Genome-wide scan for runs of homozygosity identifies potential candidate genes associated with local adaptation in Valle del Belice sheep. Genet. Sel. Evol. 2017, 49, 84. [Google Scholar] [CrossRef] [PubMed] [Green Version]
- Al Kalaldeh, M.; Gibson, J.; Lee, S.H.; Gondro, C.; Van Der Werf, J.H.J. Detection of genomic regions underlying resistance to gastrointestinal parasites in Australian sheep. Genet. Sel. Evol. 2019, 51, 37. [Google Scholar] [CrossRef] [PubMed] [Green Version]
- Hudson, N.J.; Porto-Neto, L.R.; Kijas, J.W.; McWilliam, S.M.; Taft, R.J.; Reverter, A. Information compression exploits patterns of genome composition to discriminate populations and highlight regions of evolutionary interest. BMC Bioinform. 2014, 15, 66. [Google Scholar] [CrossRef] [PubMed] [Green Version]
- Wang, Y.-Z.; Mu, L.-M.; Zhang, K.; Yang, M.-H.; Zhang, L.; Du, J.-Y.; Liu, Z.-Q.; Li, Y.-X.; Lu, W.-H.; Chen, C.-F.; et al. A broad-range survey of ticks from livestock in Northern Xinjiang: Changes in tick distribution and the isolation of Borrelia burgdorferi sensu stricto. Parasites Vectors 2015, 8, 449. [Google Scholar] [CrossRef] [PubMed] [Green Version]
- Niu, Q.; Guan, G.; Yang, J.; Fu, Y.; Xu, Z.; Li, Y.; Ma, M.; Liu, Z.; Liu, J.; Liu, A.; et al. Detection and differentiation of Borrelia burgdorferi sensu lato in ticks collected from sheep and cattle in China. BMC Vet. Res. 2011, 7, 17. [Google Scholar]
- Deshuillers, P.L.; Santos, A.P.; Nascimento, N.C.D.; Hampel, J.A.; Bergin, I.L.; Dyson, M.C.; Messick, J.B. Complete Genome Sequence of Mycoplasma ovis Strain Michigan, a Hemoplasma of Sheep with Two Distinct 16S rRNA Genes. Genome Announc. 2014, 2, e01235-13. [Google Scholar] [CrossRef] [Green Version]
- Mwacharo, J.M.; Kim, E.S.; Elbeltagy, A.R.; Aboul-Naga, A.M.; Rischkowsky, B.A.; Rothschild, M.F. Genomic footprints of dryland stress adaptation in Egyptian fat-tail sheep and their divergence from East African and western Asia cohorts. Sci. Rep. 2017, 7, 1–10. [Google Scholar] [CrossRef] [Green Version]
- Cormier, A.; Clément, M.-J.; Knossow, M.; Lachkar, S.; Savarin, P.; Toma, F.; Sobel, A.; Gigant, B.; A Curmi, P. The PN2-3 Domain of Centrosomal P4.1-associated Protein Implements a Novel Mechanism for Tubulin Sequestration. J. Biol. Chem. 2009, 284, 6909–6917. [Google Scholar] [CrossRef] [Green Version]


| Breeds | Hetian (HT) | Karakul (KK) | Yabuyi (YY) | Wadi (WD) | Hu (HU) |
|---|---|---|---|---|---|
| Coat Color | White with pigmentation | Mainly black or grey | White | white with Pigmentation | White with Pigmentation |
| Body size | Medium | Large | Medium | Medium | Medium |
| Tail types | Short fat-tail | Long fat-tail | short fat-tail | Short fat-tail | Short fat-tail |
| Uses | Meat/Carpet wool | Lamb fur/meat | Meat | Meat/fur | Meat/lamb fur |
| Agro-ecology | Arid, lowland | Arid, semi-desert, Lowland | Arid, low land | Subhumid, lowland | Moist lowland |
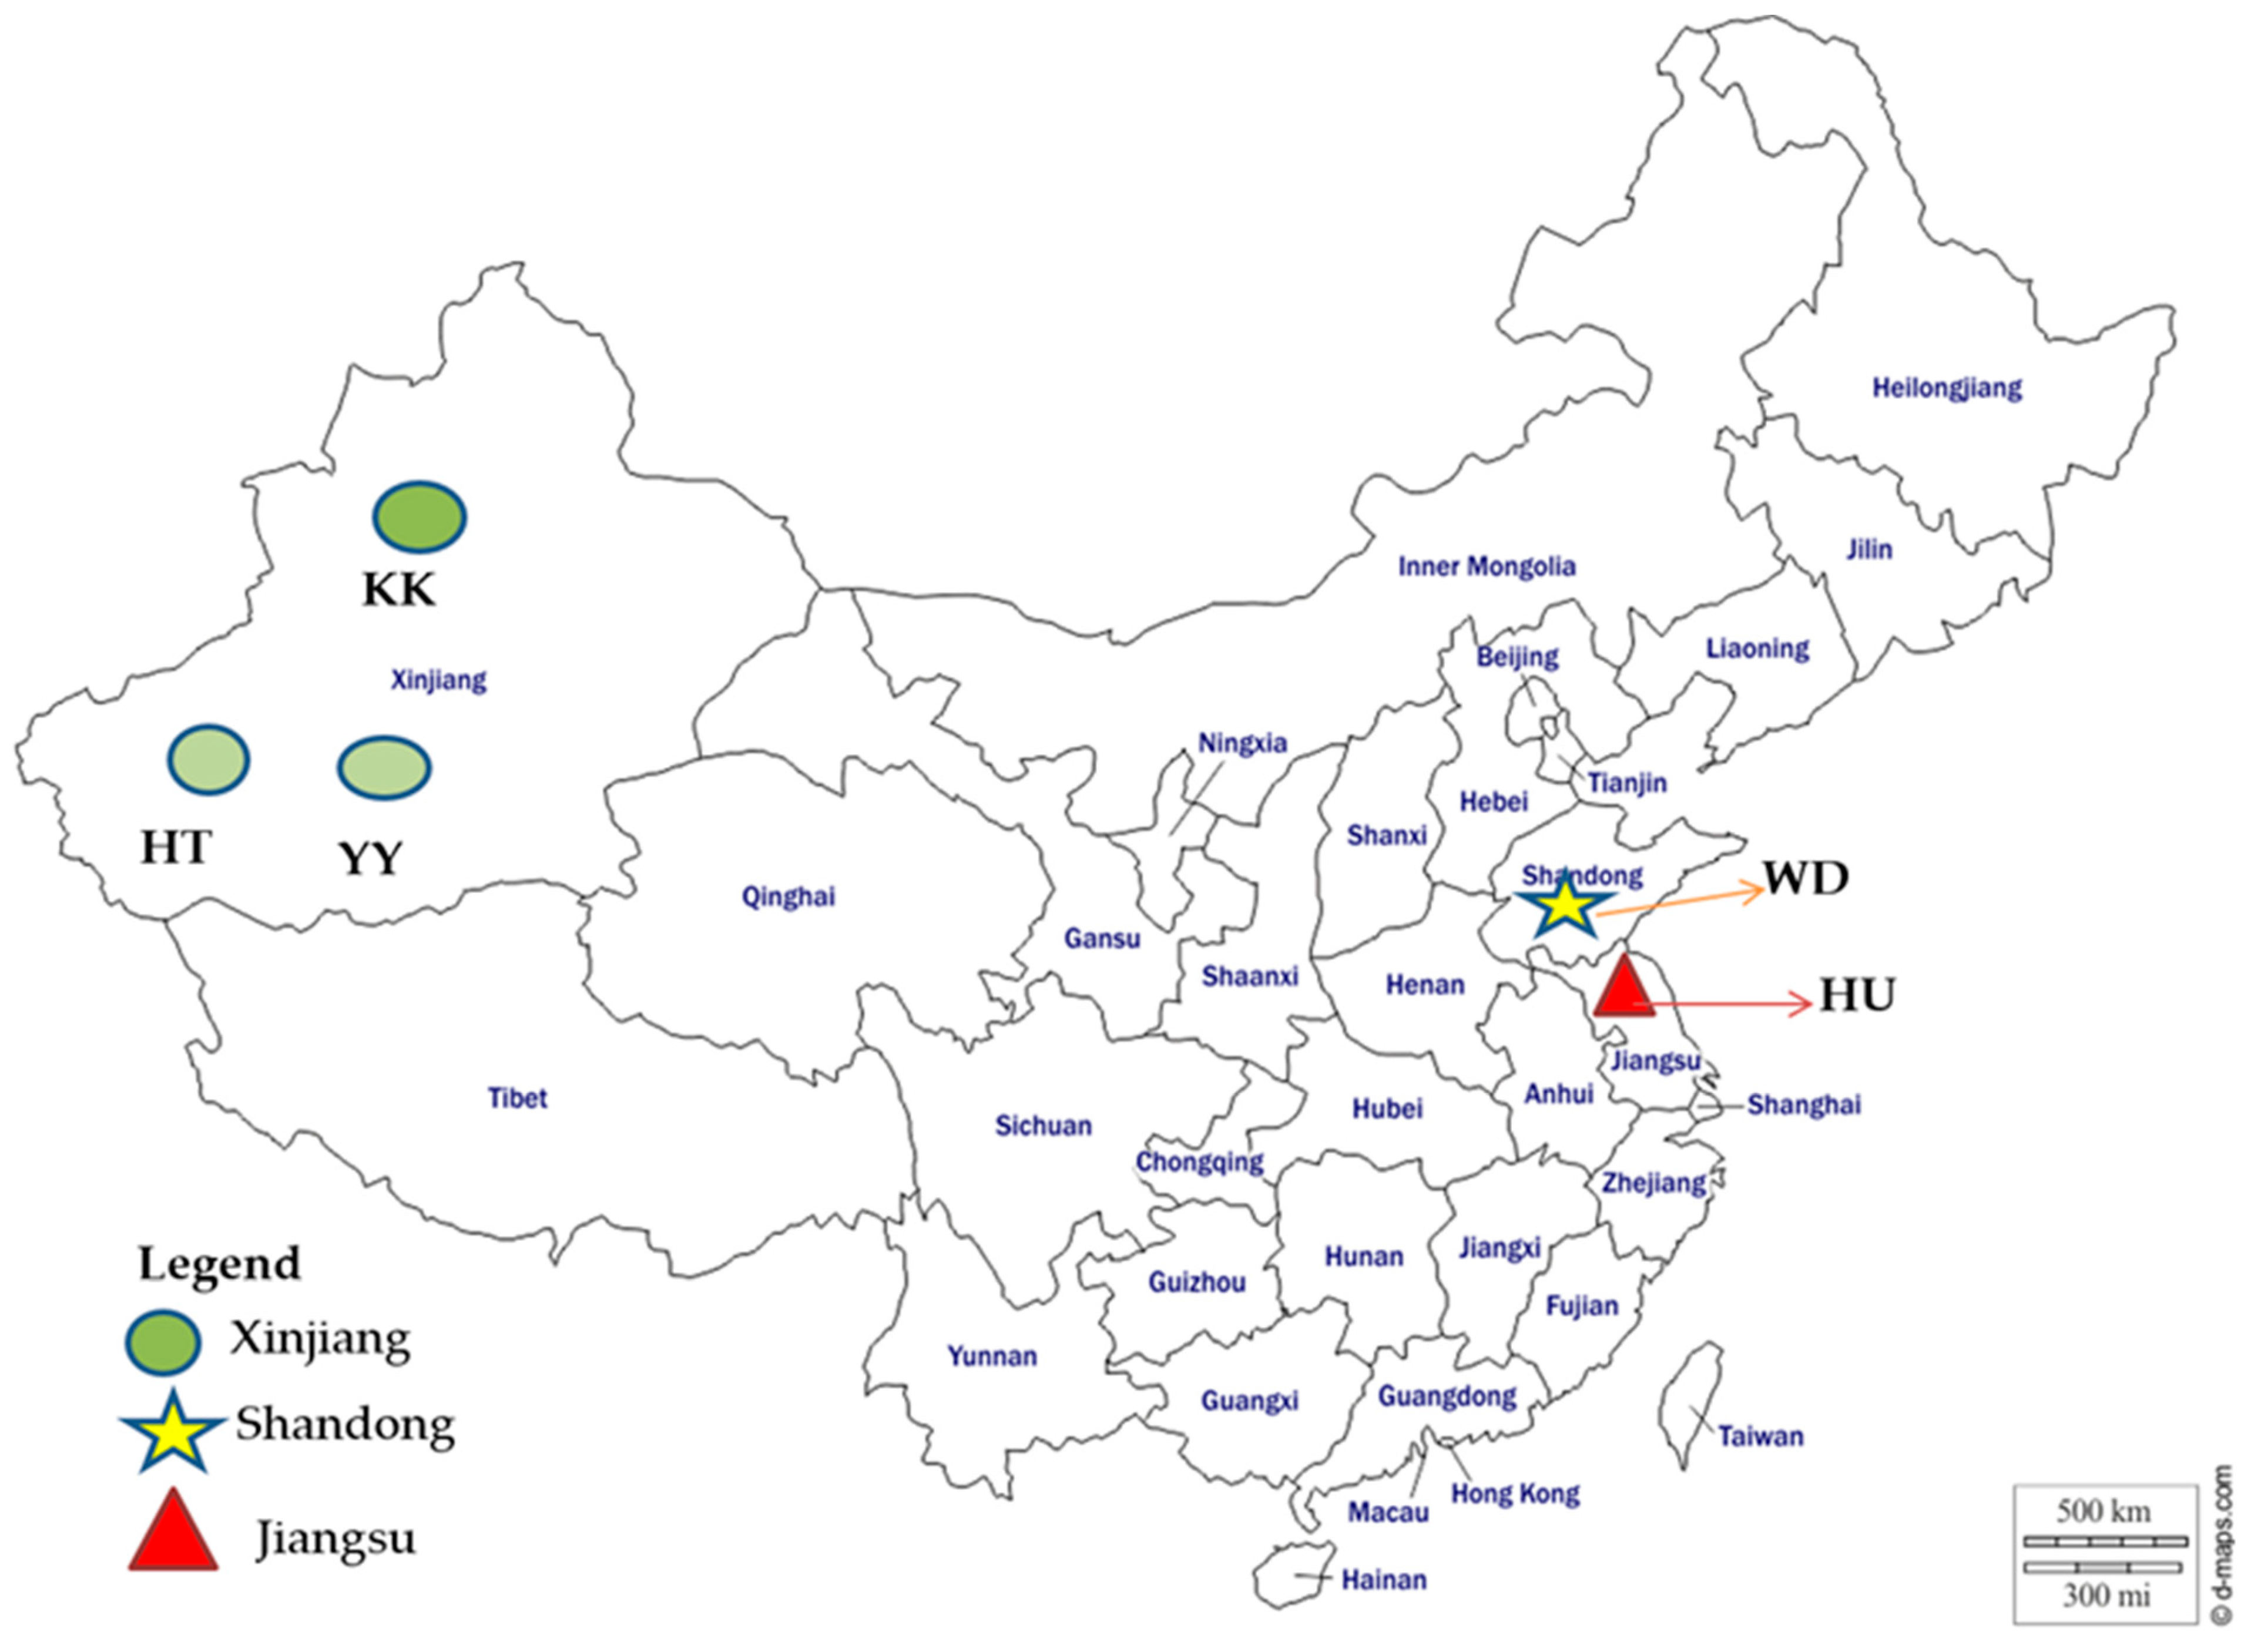
| Community | Xinjiang/Hetian | Xinjiang | Xinjiang | Shandong/Binzhou | Jiangsu /Xuzhou |
| Temperature (°C) | −28.9 to 43.2 | −20 to 33 | −26 to 43 | −16 to 39 | −9.9 to 38.3 |
| Average rainfall (mm) | 150 | 150 | 35 | 592 | 930 |
| Breed Name | Acronym | Location | Sample Size (n) | Ecology | FIS | MAF < 0.05 |
|---|---|---|---|---|---|---|
| Hetian | HT | Xinjiang | 19 | Arid land | −0.02 | 0.269 |
| Karakul | KK | Xinjiang | 20 | Arid/Desert | −0.04 | 0.267 |
| Yabuyi | YY | Xinjiang | 20 | Arid | −0.027 | 0.266 |
| Wadi | WD | Shandong | 17 | Sub-Humid | −0.004 | 0.270 |
| Hu | HU | Jiangsu | 20 | Humid | −0.03 | 0.268 |
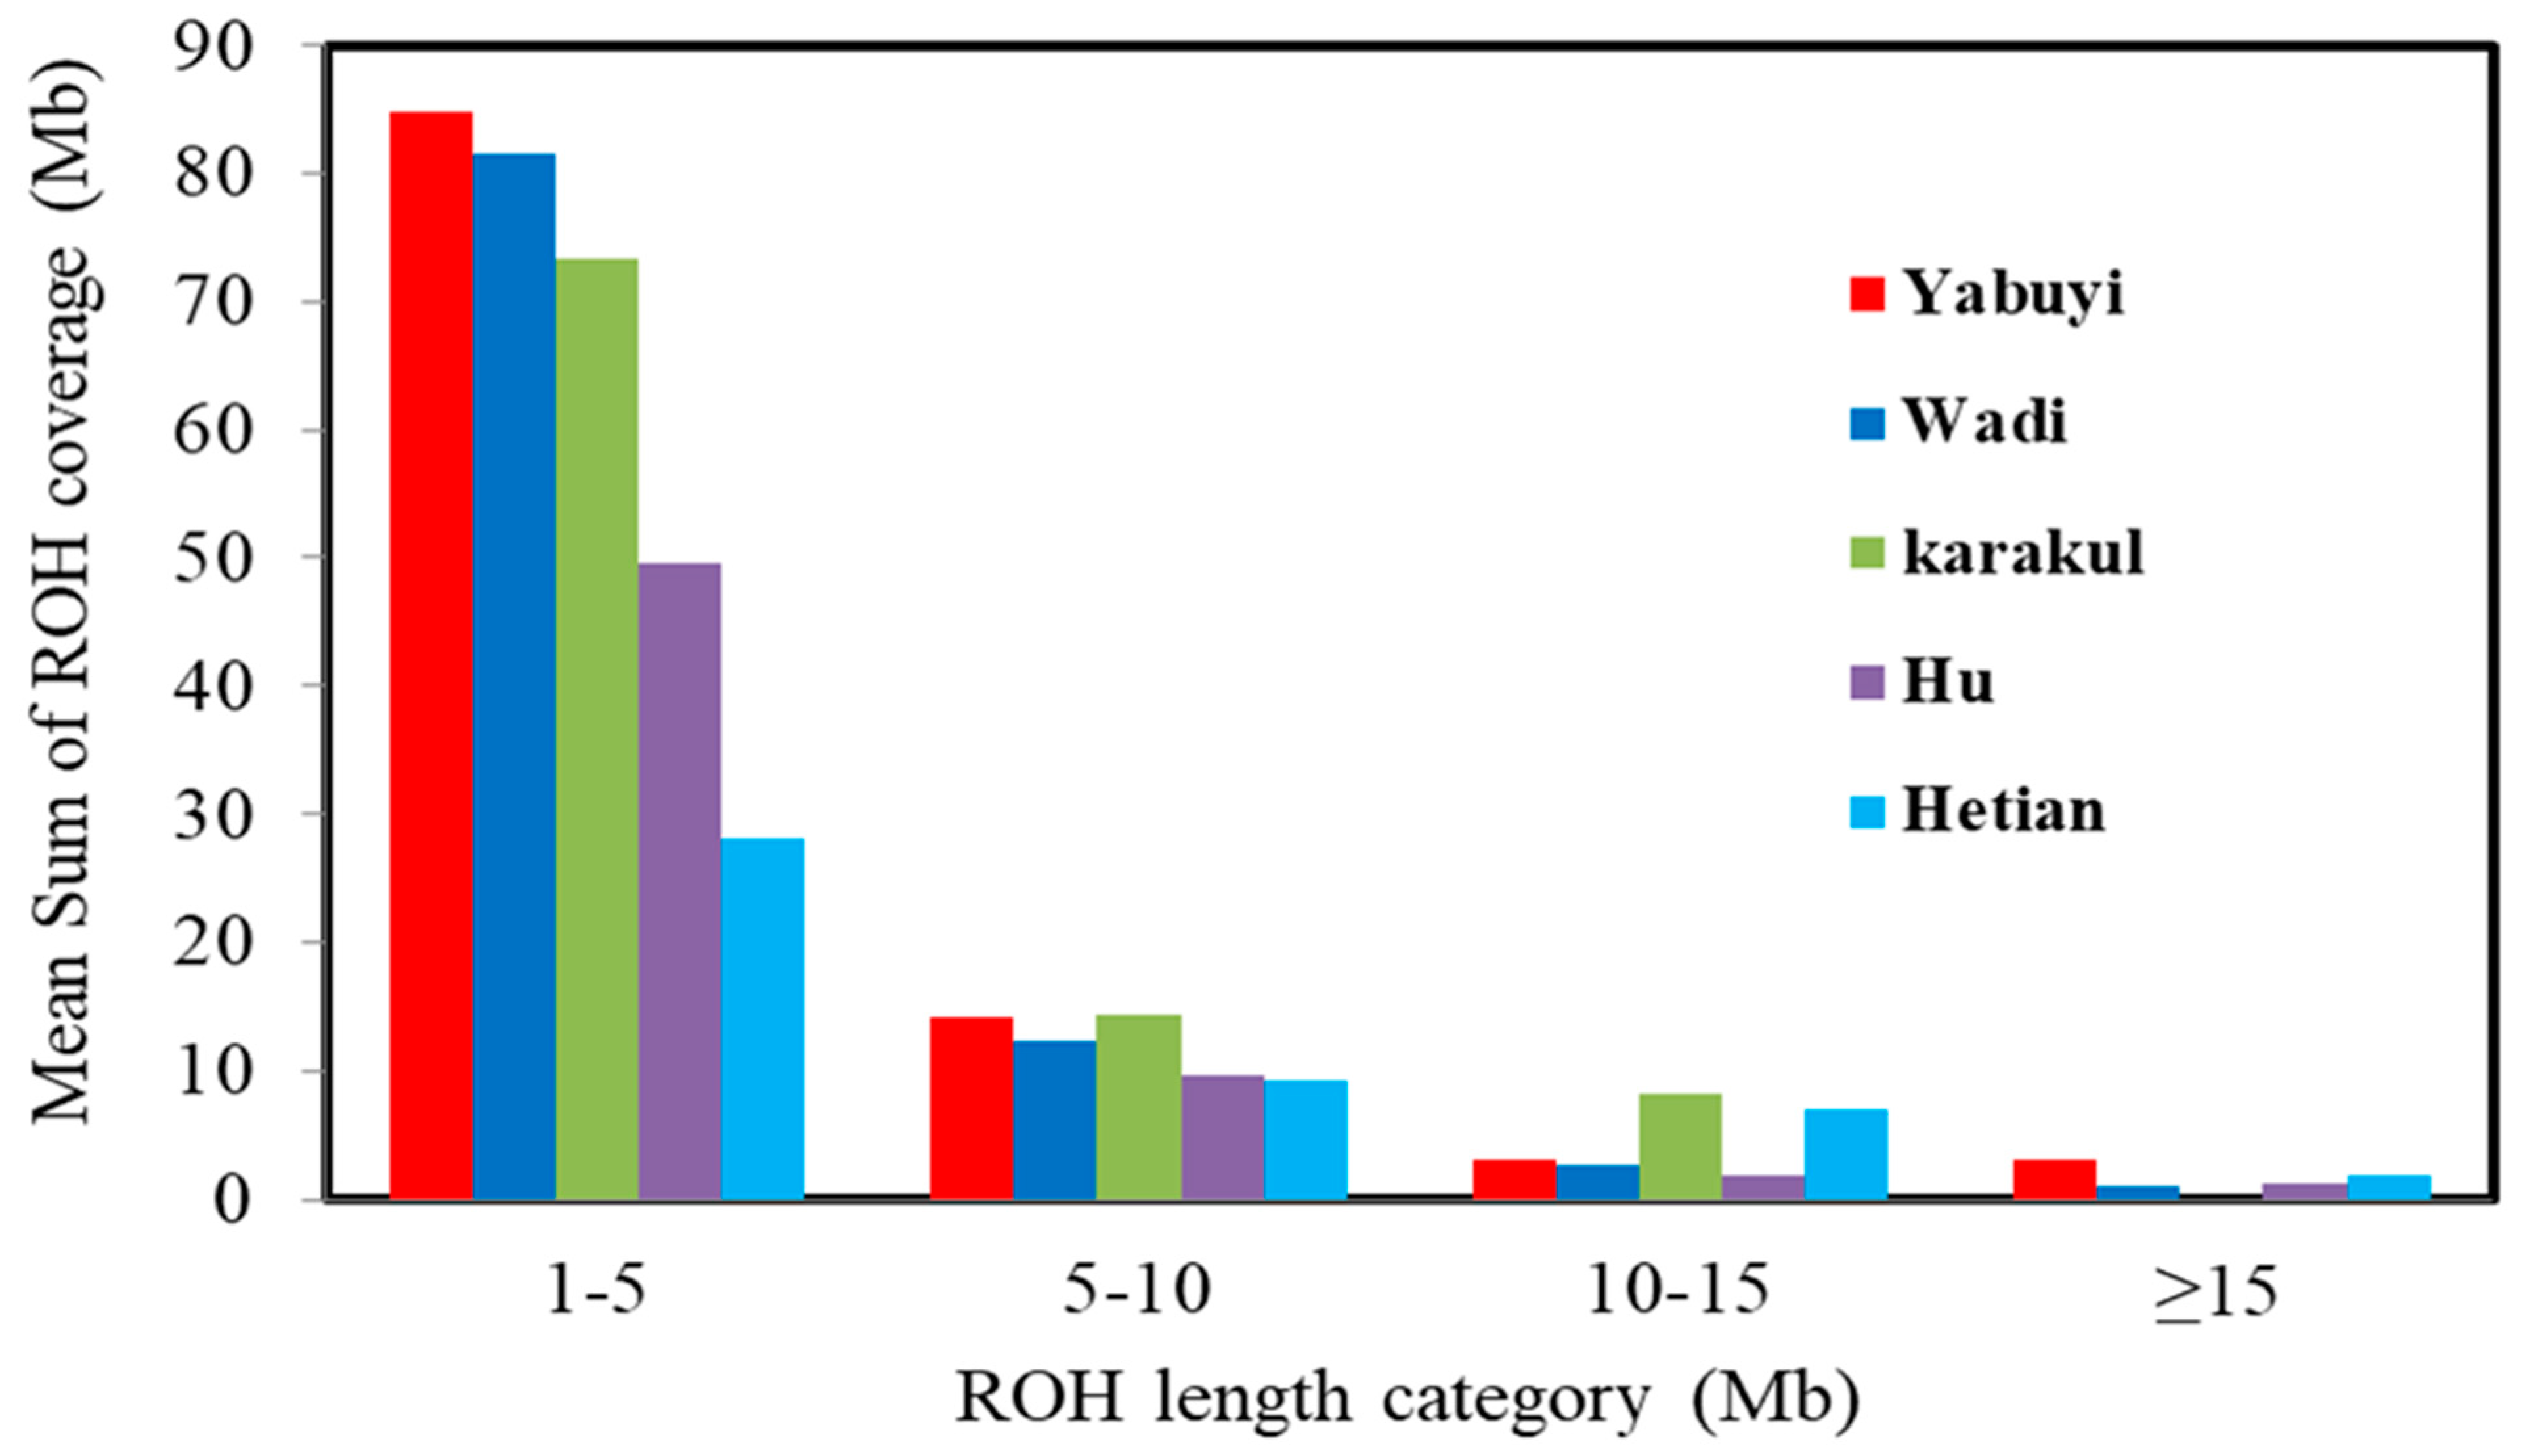
| Length Category (Mb) | Hetian | Karakul | Yabuyi | Wadi | Hu |
|---|---|---|---|---|---|
| FROH (1–5) | 28.14 | 73.27 | 84.82 | 81.53 | 49.66 |
| FROH (5–10) | 9.24 | 14.45 | 14.15 | 12.28 | 9.64 |
| FROH (10–15) | 7.05 | 8.24 | 3.06 | 2.59 | 1.86 |
| FROH ≥ 15 | 1.81 | 0 | 3.12 | 1.03 | 1.21 |
| Average | 11.56 | 23.99 | 26.29 | 24.35 | 15.59 |
| CHR | Positions | Gene Name | Functions | Gene Description |
|---|---|---|---|---|
| 10 | 36,271,774–36,272,454 | GJB2 | Body size/development | gap junction protein beta 2 |
| 10 | 36,304,573–36,305,769 | GJA3 | Body size/development | gap junction protein alpha 3 |
| 10 | 36,669,829–36,713,175 | CENPJ | Protein implements | centromere protein J |
| 2 | 11,175,0152–11,175,0269 | 5S_Rrna | Disease resistance | 5S ribosomal RNA |
| 2 | 11,247,8388–11,272,0769 | HERC2 | Innate immune response | HECT and RLD domain containing E3 ubiquitin protein ligase 2 |
| 2 | 11,283,9853–11,294,4326 | CYFIP1 | Innate immune response | cytoplasmic FMR1 interacting protein1 |
| 6 | 79,425,129–79,425,234 | 5S_rRNA | Disease resistance | 5S ribosomal RNA |
Publisher’s Note: MDPI stays neutral with regard to jurisdictional claims in published maps and institutional affiliations. |
© 2020 by the authors. Licensee MDPI, Basel, Switzerland. This article is an open access article distributed under the terms and conditions of the Creative Commons Attribution (CC BY) license (http://creativecommons.org/licenses/by/4.0/).
Share and Cite
Abied, A.; Xu, L.; Sahlu, B.W.; Xing, F.; Ahbara, A.; Pu, Y.; Lin, J.; Berihulay, H.; Islam, R.; He, X.; et al. Genome-Wide Analysis Revealed Homozygosity and Demographic History of Five Chinese Sheep Breeds Adapted to Different Environments. Genes 2020, 11, 1480. https://0-doi-org.brum.beds.ac.uk/10.3390/genes11121480
Abied A, Xu L, Sahlu BW, Xing F, Ahbara A, Pu Y, Lin J, Berihulay H, Islam R, He X, et al. Genome-Wide Analysis Revealed Homozygosity and Demographic History of Five Chinese Sheep Breeds Adapted to Different Environments. Genes. 2020; 11(12):1480. https://0-doi-org.brum.beds.ac.uk/10.3390/genes11121480
Chicago/Turabian StyleAbied, Adam, Lei Xu, Bahlibi W. Sahlu, Feng Xing, Abulgasim Ahbara, Yabin Pu, Jiang Lin, Haile Berihulay, Rabiul Islam, Xiaohong He, and et al. 2020. "Genome-Wide Analysis Revealed Homozygosity and Demographic History of Five Chinese Sheep Breeds Adapted to Different Environments" Genes 11, no. 12: 1480. https://0-doi-org.brum.beds.ac.uk/10.3390/genes11121480