Article

Identification of Candidate Genes for Seed Glucosinolate Content Using Association Mapping in Brassica napus L.

1
Chongqing Engineering Research Center for Rapeseed, College of Agronomy and Biotechnology, Southwest University, Tiansheng Road 2, Beibei, Chongqing 400716, China
2
Engineering Research Center of South Upland Agriculture of Ministry of Education, Southwest University, Beibei, Chongqing 400716, China
3
Food and Bioproduct Science, University of Saskatchewan, 51 Campus Drive, Saskatoon, SK S7N 5A8, Canada
*
Author to whom correspondence should be addressed.
These authors contributed equally to this work.
Submission received: 22 September 2015 / Revised: 22 October 2015 / Accepted: 6 November 2015 / Published: 18 November 2015
(This article belongs to the Special Issue Genetic Diversity for Crop Improvement)

Abstract

:
Rapeseed contains glucosinolates, a toxic group of sulfur-containing glucosides, which play critical roles in defense against herbivores and microbes. However, the presence of glucosinolates in rapeseed reduces the value of the meal as feed for livestock. We performed association mapping of seed glucosinolate (GS) content using the 60K Brassica Infinium single nucleotide polymorphism (SNP) array in 520 oilseed rape accessions. A total of 11 peak SNPs significantly associated with GS content were detected in growing seasons of 2013 and 2014 and were located on B. napus chromosomes A08, A09, C03, and C09, respectively. Two associated regions of GS content covered by these markers were further verified, and three B. napus homologous genes involved in the biosynthesis and accumulation of GS were identified. These genes were multigene family members and were distributed on different chromosomes. Moreover, two genes (BnGRT2 and BnMYB28) associated with GS content were validated by the qRT-PCR analysis of their expression profiles. The further identification and functionalization of these genes will provide useful insight into the mechanism underlying GS biosynthesis and allocation in B. napus, and the associated SNPs markers could be helpful for molecular maker-assisted breeding for low seed GS in B. napus.

1. Introduction

Glucosinolates, a group of sulfur-containing glucosides, are secondary metabolites uniquely detected in Brassicaceae and provide protection against plant pest and pathogens. However, Glucosinolates also impart a pungent flavor and inhibit thyroid function, resulting in liver and kidney abnormalities if consumed in excess in higher animals [1]. Therefore, it is desirable to reduce the glucosinolate content of seeds, but to maintain a high level of glucosinolates in other tissues to prevent herbivore damage and pathogenic microbes. Rapeseed (Brassica napus L., genome AACC, 2n = 38) is an important source of edible oil for humans and protein for live-stock [2]. Therefore, selecting double-low rapeseed, i.e., with seeds lacking erucic acid (another toxic compound produced by rapeseed) and containing only low levels of glucosinolate in seeds, has been an important objective of rapeseed breeding programs globally.
To date, quantitative trait locus (QTL) mapping based on molecular markers is an effective method for identifying candidate alleles involved in a complex trait, by which method numerous markers associated with total GS content have been mapped using different populations of B. napus [3,4,5,6,7]. QTLs associated with total GS content were identified on B. napus chromosomes N9, N12, and N19 [3,4,5,8,9]. Recently, association mapping, which uses diverse populations to identify associations between allele frequencies and phenotypic variation, has also been used to pinpoint specific genes associated with a trait of interest in plants [10,11,12,13], and has significantly increased the precision of QTL mapping [14]. Using association mapping, 52 simple sequence repeat (SSR) markers were linked to genes involved in the production of phenolic compounds, of these SSRs five were QTL-linked markers in rapeseed [15]. Additionally, 27 SSR markers were found to be associated with variation in seed oil content in both traditional and new-type B. napus populations [16]. Although some clusters of single-nucleotide polymorphisms (SNPs) highly associated with the GS content has also been identified in rapeseed in recent years [17,18,19], they need to be verified by the further research.
Recently, the multinational Brassica Genome Project [20] has made considerable progress in re-sequencing the Brassica genome using next-generation high-throughput DNA sequencing techniques and has developed the Brassica 60K SNP BeadChip Array with 52,157 Infinium Type II SNP loci (Isobel Parkin, Agriculture and AgriFood Canada). In this study, we used a panel of 520 rapeseed lines for association mapping of total GS content using the 60k Brassica Infinium SNP array. The objective of our study was to identify the consensus association peaked SNP markers, which could be used for molecular marker assisted breeding of low GS content. Meanwhile, we also conducted comparative association mapping with A. thaliana to identify candidate genes for GS content in Brassica species. This work would lay the foundation for understanding the biosynthesis and accumulation of seed glucosinolate in rapeseed.

2. Results

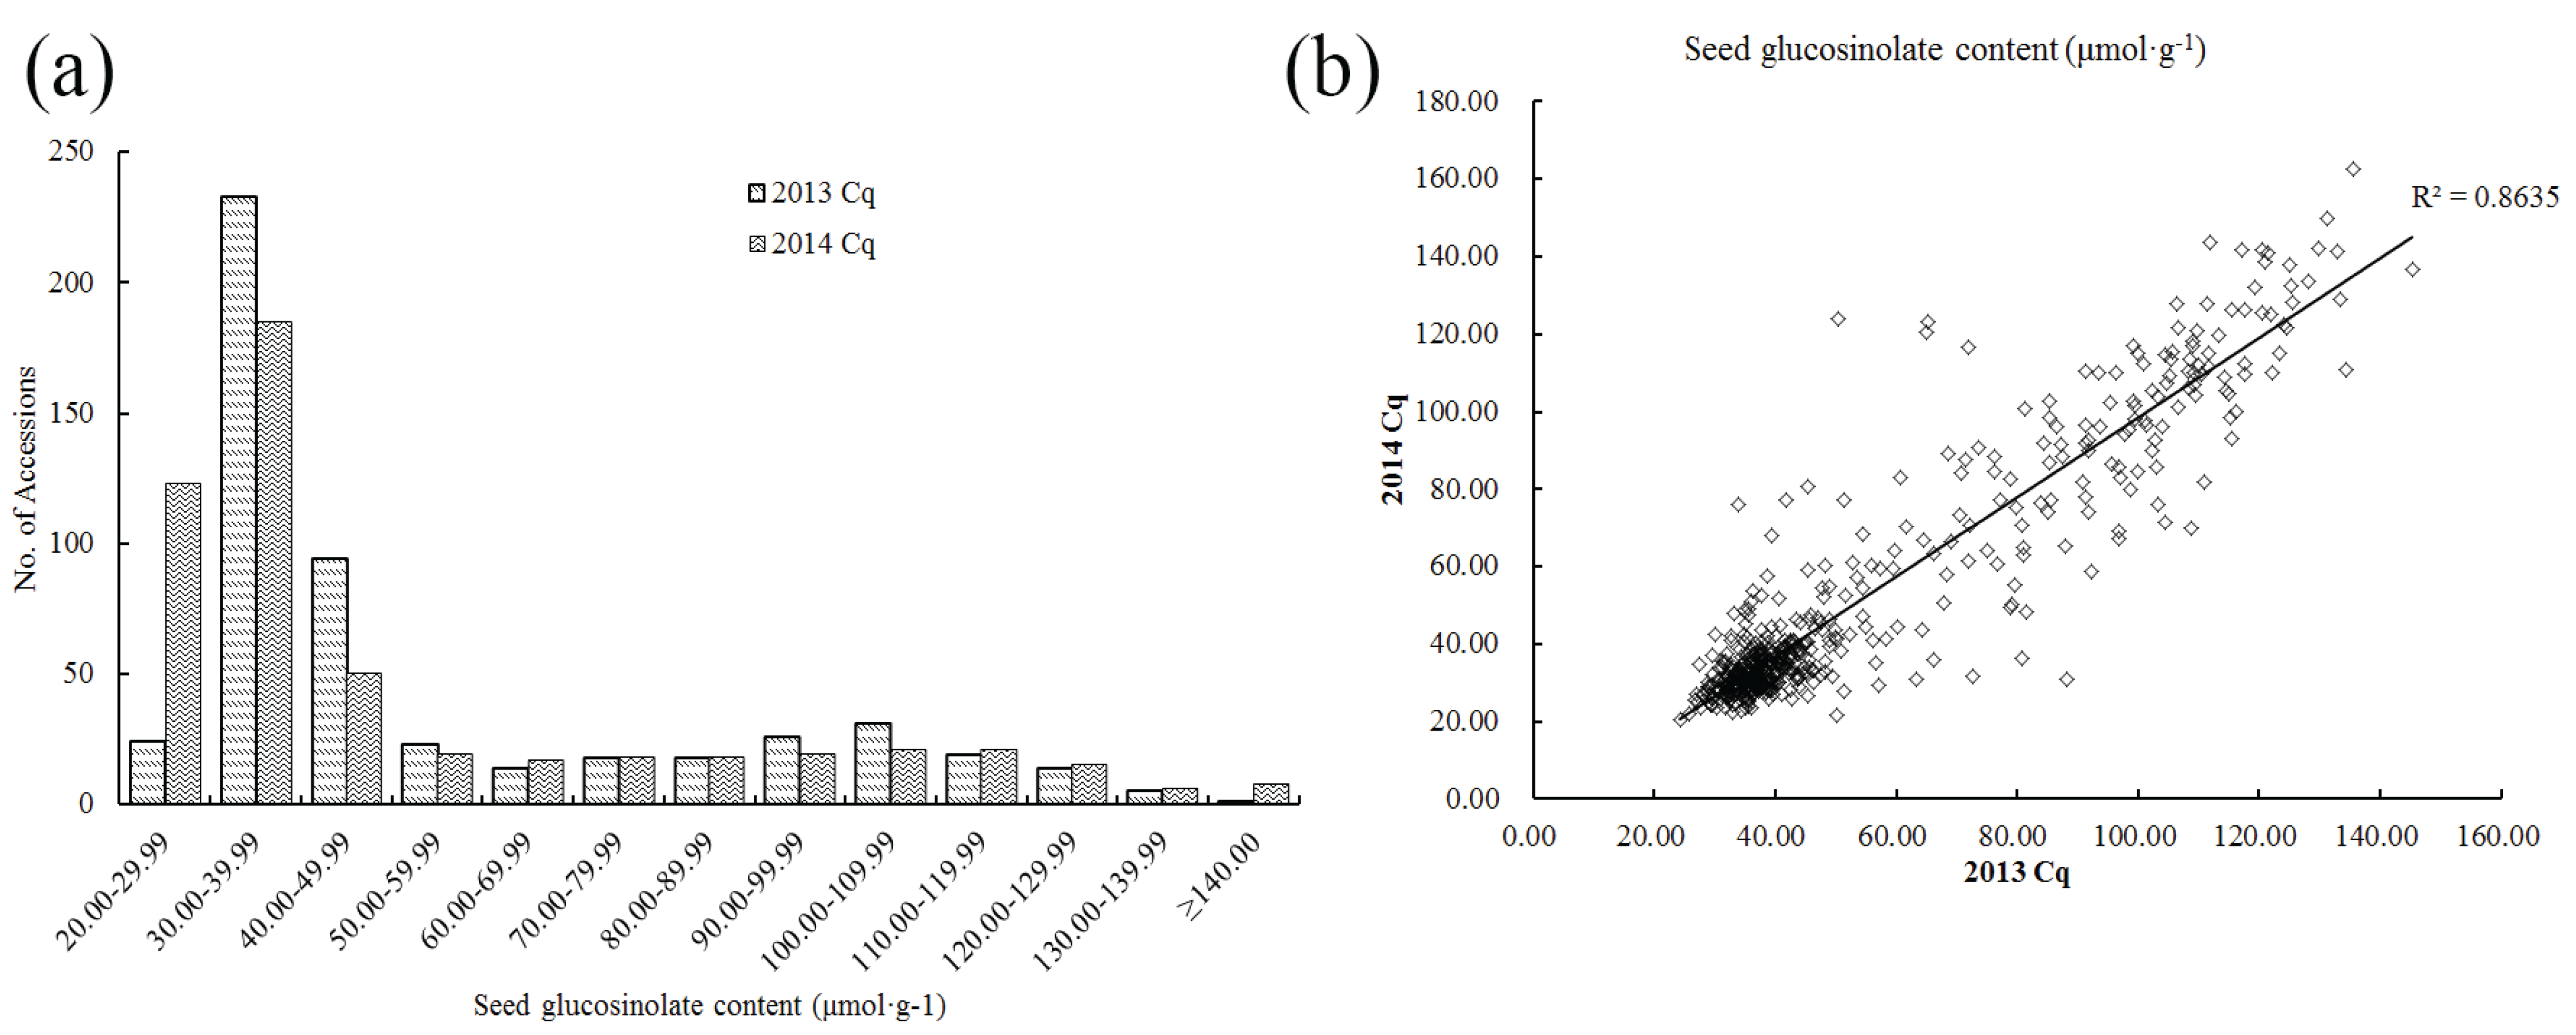
2.1. Phenotypic Variations of GS Content

The total GS content of 520 rapeseed accessions (see Supplementary Material, Table S1 on the journal’s website) were measured with three repeats using near infrared reflectance spectroscopy (NIRS), and the phenotypic variation recorded were observed (Figure 1 and Table 1). In 2013, the GS content ranged from 24.22 to 145.24 μmol·g−1 with an average of 54.90 μmol·g−1, while in 2014, it ranged from 20.53 to 162.51 μmol·g−1 with an average of 52.12 μmol·g−1. The high coefficient of variation (Table 1) indicates that there is wide variation in glucosinolate content in this panel of accessions. In addition, approximately 70% of the seeds had low GS content (20.00 to 50.00 μmol·g−1, Figure 1a) with a correlation coefficient of 0.8635 in both years (Figure 1b), suggesting that breeding new accessions with a low GS content has long since been a prerequisite for rapeseed cultivation.
Figure 1. Variations of total seed glucosinolate content of the population (consisting of 520 accessions) in 2013 and 2014. (a) Frequency distribution of total seed glucosinolate content; (b) Comparison of seed glucosinolate content in 2013 and 2014. Cq refers to the growing region, Chongqing, China.
Genes 06 01215 g001
Table 1. Statistical analysis of seed glucosinolate content in 520 rapeseed accessions.
YearRange (μmol·g−1)Average (μmol·g−1)Standard DeviationCoefficient of Variation (%)SkewnessKurtosis
2013 Cq (Chongqing)24.22–145.2454.90 ± 1.2829.1153.021.240.15
2014 Cq (Chongqing)20.53–162.5152.12 ± 1.4132.2461.861.340.56

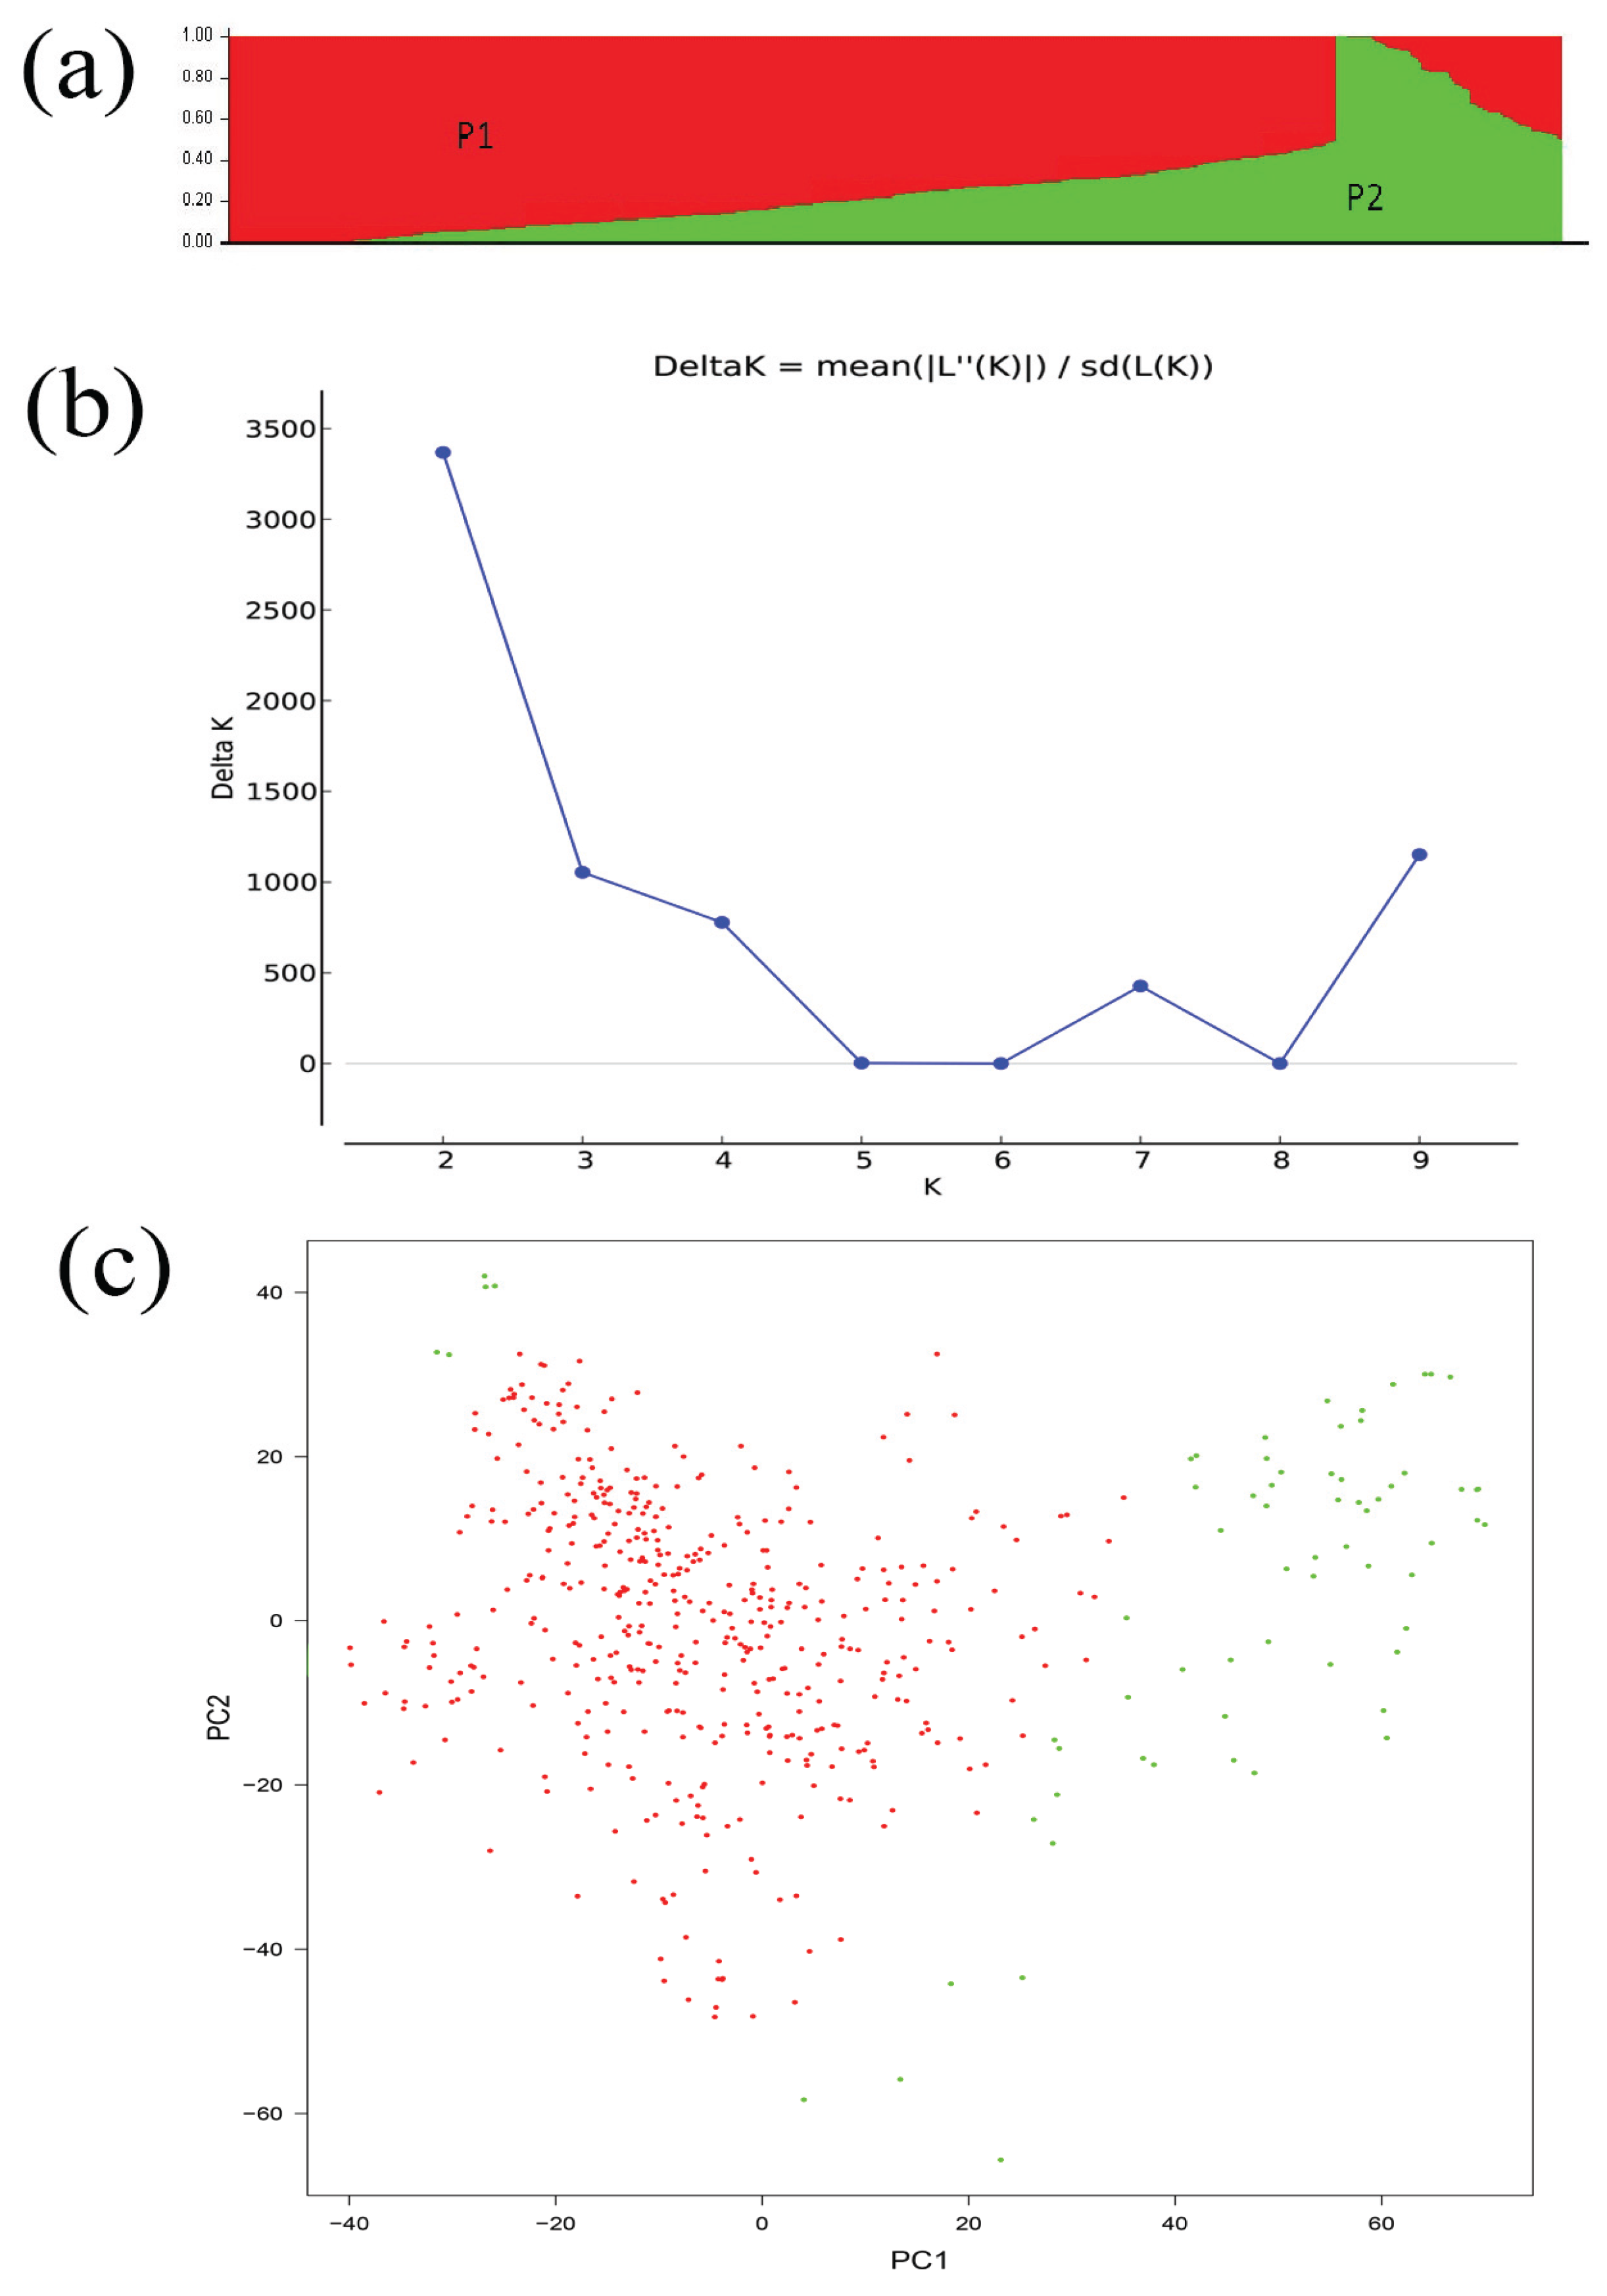
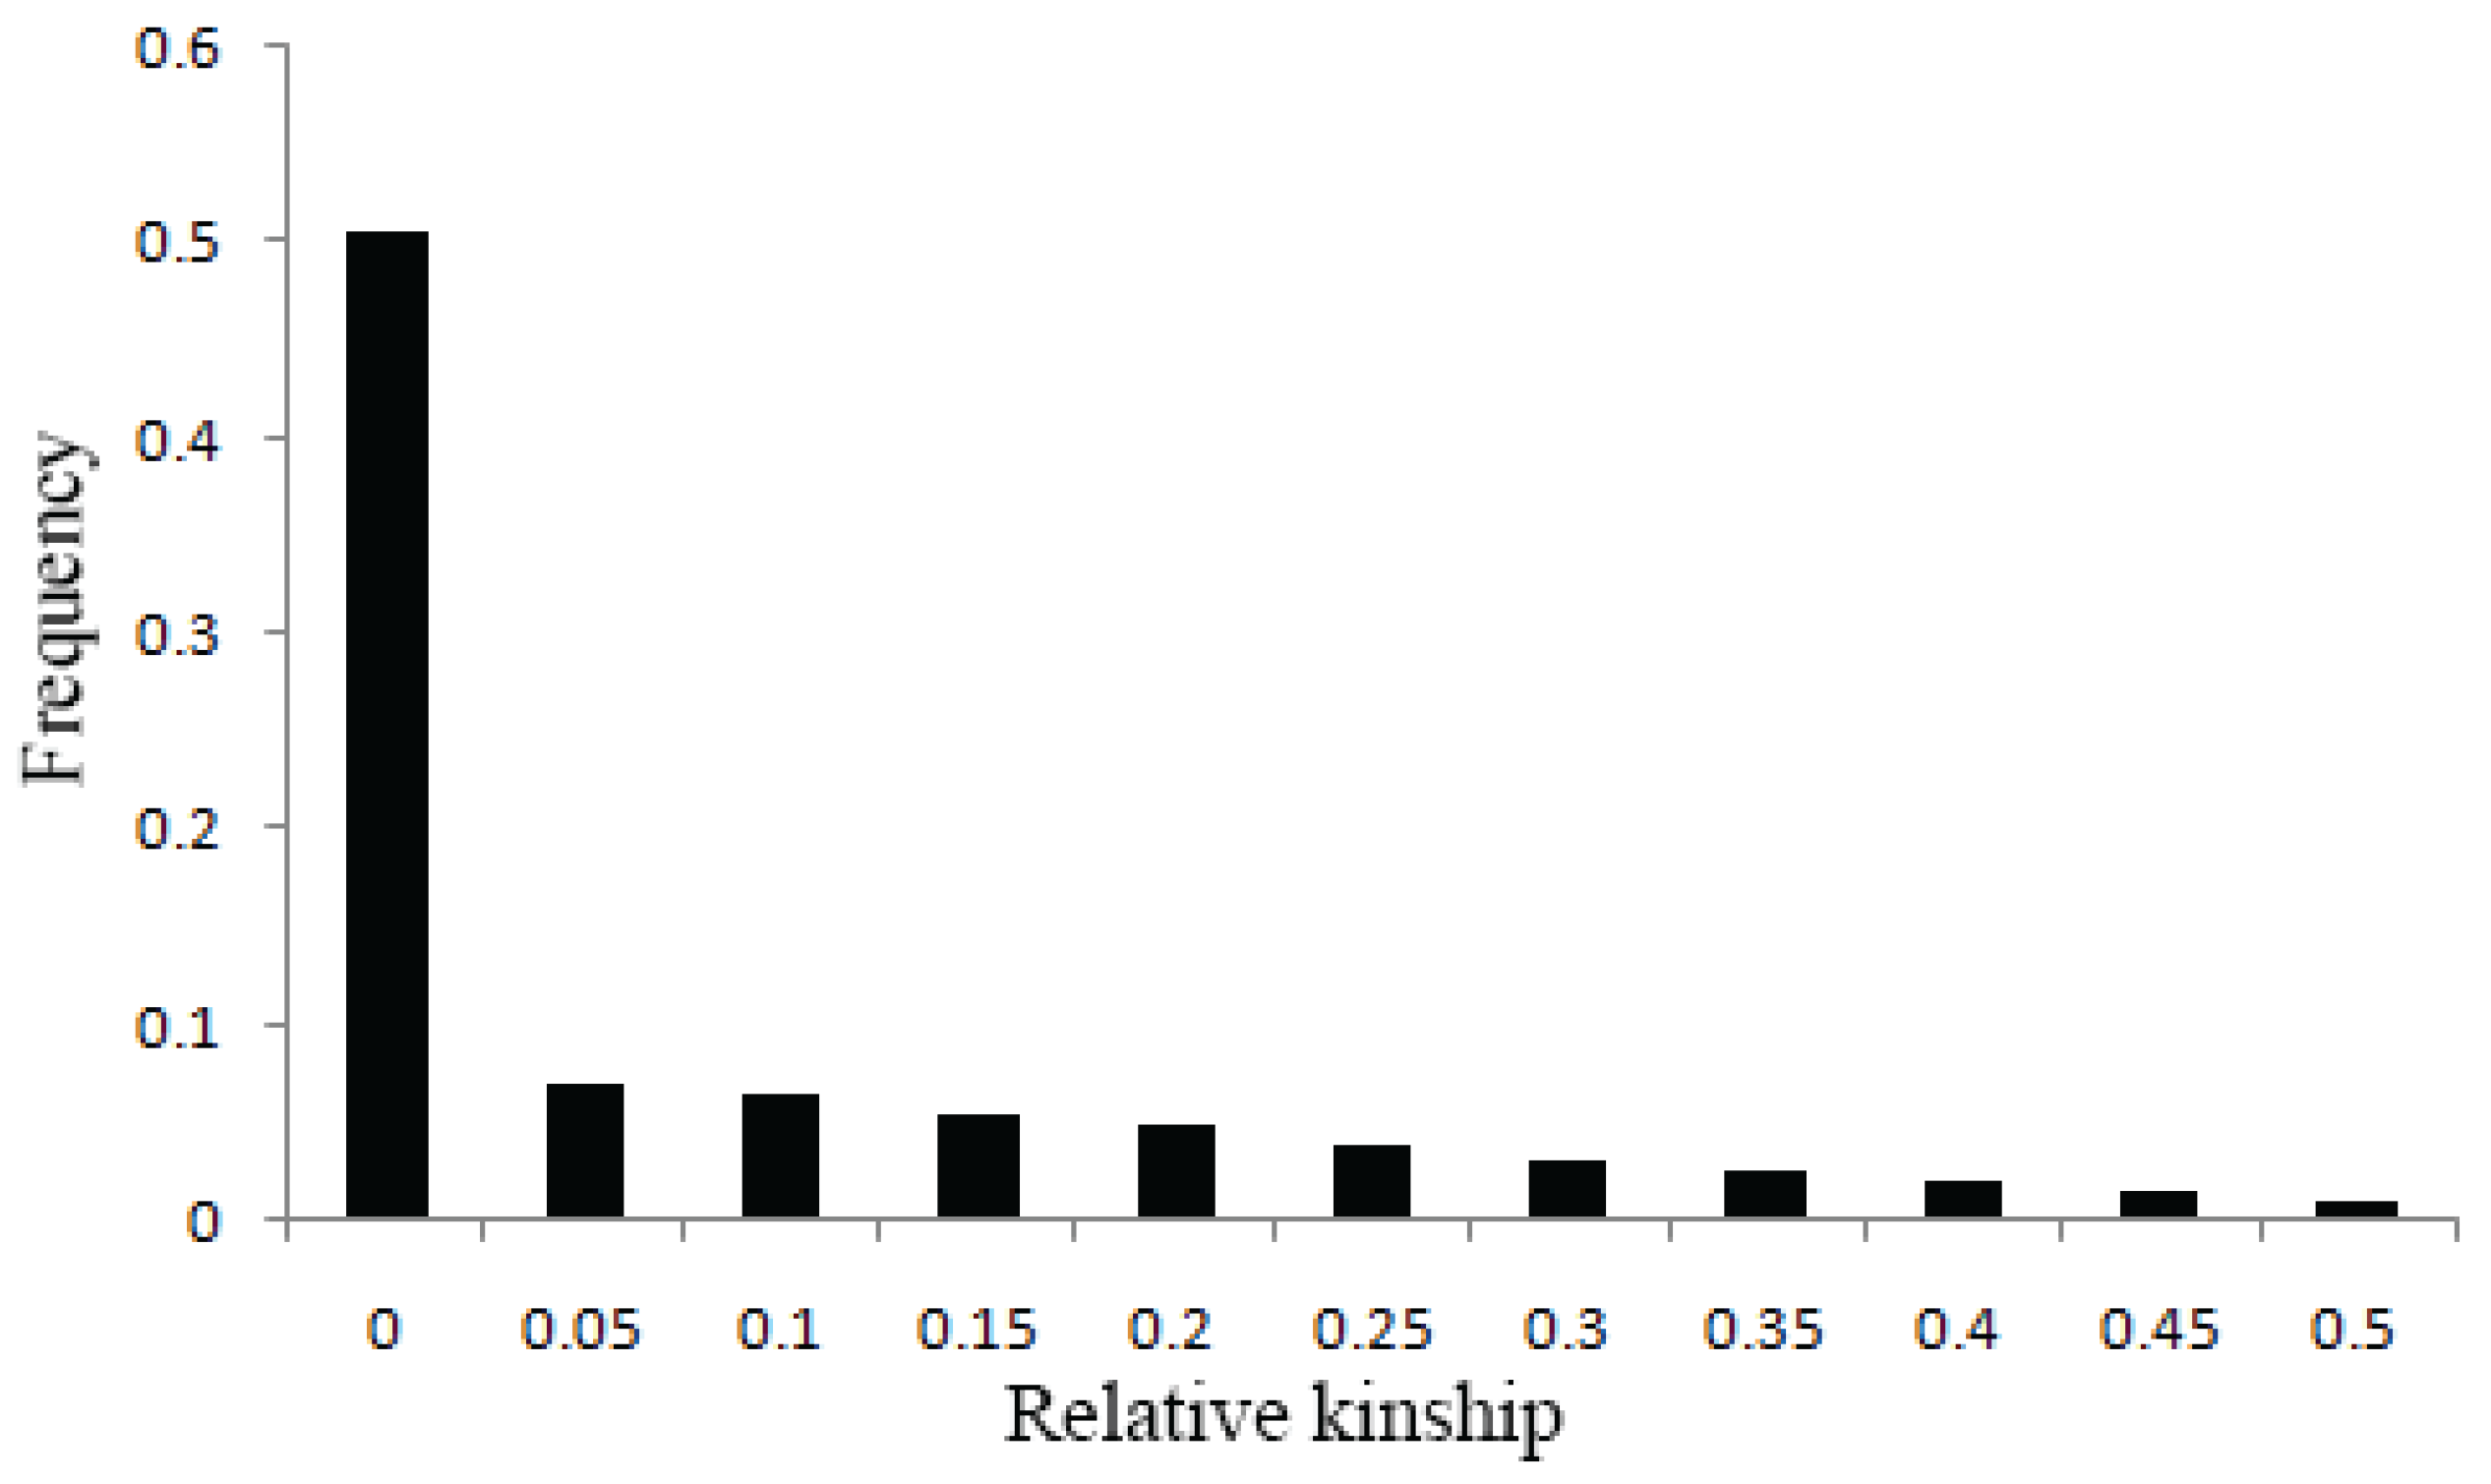
2.2. Population Structure, Relative Kinship and Diversity Panel Analysis

A set of SNP markers developed from the Brassica 60 K SNP BeadChip Array covering the B. napus genome were used to perform association analysis of seed glucosinolate content. Out of a total of 51,264 SNPs to the B. napus genome obtained from the blast analysis, 17,131 SNPs were excluded with the call frequency < 90% and an minor allele frequency (MAF) < 0.05, with 34,103 polymorphic SNPs were used for the association analysis. The population structure of 520 rapeseed accessions were classified using by STRUCTURE 2.1 with the optimal value of K = 2 (Figure 2a,b) and Ln P (D) = −5,240,293.4 (Table 2). However, subpopulation 1, accounting for 89% accession lines, is mainly composed of those from China, whereas subpopulation 2 included the rest of the accessions from a more diverse origin (Figure 2c).
Figure 2. Analysis of the population structure of 520 rapeseed accessions. (a), Model-based Bayesian clustering performed by STRUCTURE 2.1 for K = 2 subpopulations (Red indicates subpopulation P1 genotypes and green represent subpopulation P2); (b), ΔK based on rate of change of LnP (K) between successive K values; (c), The sub-populations in a population of 520 B. napus accessions, suggested by Principal Coordinate Analysis (PCA).
Genes 06 01215 g002
Table 2. Average logarithm of the probability of data likelihoods (LnP(D)), their standard deviations, and Delta K for simulations of different K-values of the 520 B. napus accessions.
KMean LnP(K)Stdev LnP(K)Delta K
1−5591550.23314.608331
2−5240293.449.5960683368.547254
3−5056103.26748.0668631053.798744
4−4922565.93357.973902777.935099
5−4834128.5333719.9341362.630127
6−4755475.0338254.8544590.036322
7−4677121.36790.730884427.251798
8−4637532.6332440.4071220.025228
9−4597882.3331000.0431311151.624163
10−5709905.8671989293.383
Additionally, relative kinships among 520 accessions were estimated using TASSEL 5.2.1 [21], and the results showed that 74.53% of kinship coefficients between lines ranging from 0 to 0.05, and 50.55% were equal to 0 (Figure 3), suggesting that most lines have no kinship or a relatively weak kinship and that spurious associations were controlled.
Figure 3. Distribution of relative kinship coefficient across the 520 accessions. Only kinship coefficients of 0 to 0.5 are shown.
Genes 06 01215 g003

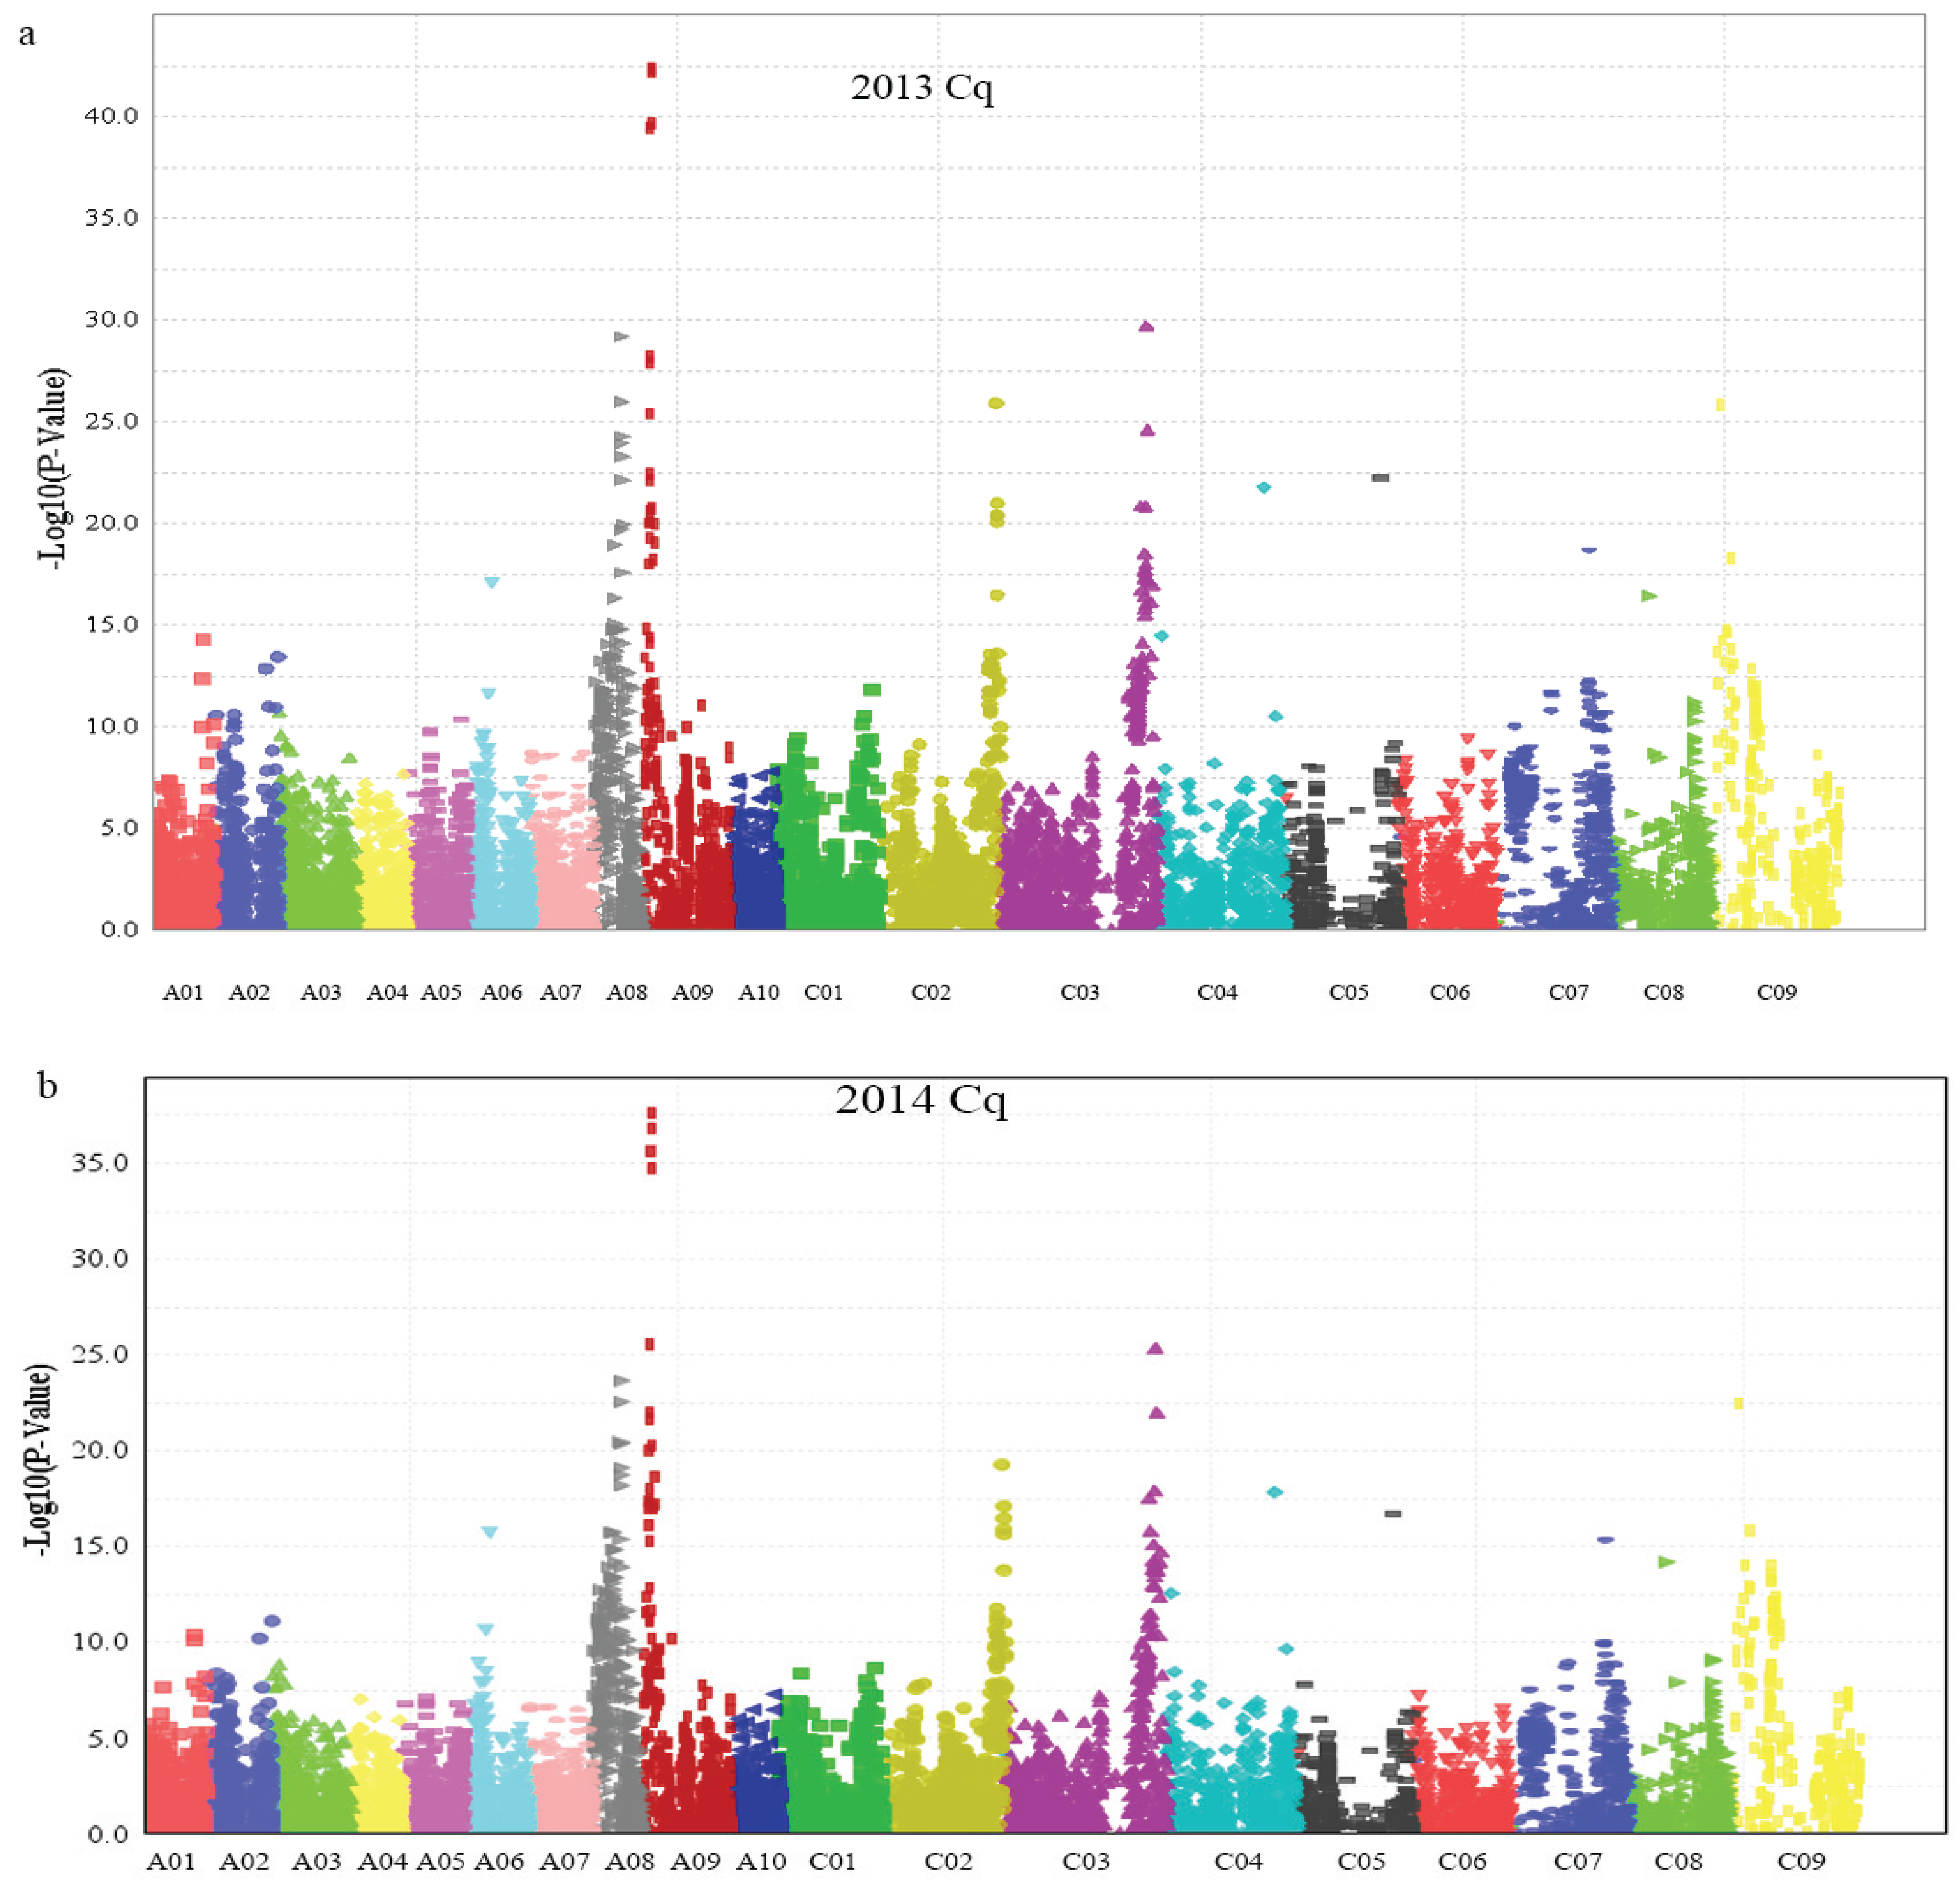
2.3. Association Mapping Analysis

After filtering all of the SNP data, we performed genome wide association analysis using the mixed-linear model (MLM) (Q + K) model, and the QQ plot as shown in Figure 4. A total of 15 SNP markers showed significant association with glucosinolate content in the seeds of plants grown in 2013 and 2014 (Table 3), which were significantly associated with the Best Linear Unbiased Prediction (BLUP) value by the PCA model (Figure 5a,b). All markers associated with each trait and the determined phenotypic variation of these markers are listed in Table 3. Interestingly, 11 of the 15 SNP markers were detected in the seeds of plants grown both in 2013 and 2014. Moreover, these 11 SNP markers were located on chromosomes A08, A09, C03, and C09, which had two, six, two, and one SNP marker, respectively. Meanwhile, we detected seven SNP markers with significant associations with glucosinolate content, which were mapped on chromosomes A09 and C09, respectively (Figure 5 and Table 3), indicating that existing homologous loci in this region influenced GS content in B. napus. Moreover, the Bn-A09-p3029767 marker, which showed the most significant association with glucosinolate content and which was mapped on chromosome A09, accounted for 33.50% and 31.59% of the phenotypic variance in GS content in samples obtained in 2013 and 2014, respectively (Table 3). Hence, we supposed that the flanking regions of seven peak SNP markers should be associated with candidate genes of GS content in B. napus chromosomes A09 and C09, which could be the loci homologous with those of the previous research reports [4].
Table 3. Genome-wide significant association signals of seed glucosinolate content.
SNPp-ValuePhenotypic Variation (%)Chr.Physical Interval (bp)
2013201420132014
Bn-A09-p30297677.76 × 10−378.16 × 10−3333.5031.59A092,949,846–3,135,091
Bn-A09-p31167382.61 × 10−364.05 × 10−3232.9430.82A09
Bn-A09-p30535321.79 × 10−334.94 × 10−3029.9628.54A09
Bn-A09-p32343233.15 × 10−1815.19A09
Bn-A01-p91258192.86 × 10−329.68 × 10−3028.7328.23A092,450,781–2,472,858
Bn-A01-p91496014.04 × 10−223.93 × 10−2018.7818.27A09
Bn-A08-p126602083.41 × 10−235.80 × 10−2118.9518.22C0356,050,681–56,466,188
Bn-A08-p129058486.81 × 10−204.05 × 10−1816.7116.28C03
Bn-A09-p18327608.94 × 10−211.89 × 10−2017.5218.58A092,101,520–2,206,660
Bn-A09-p17279155.27 × 10−2016.81A09
Bn-scaff_19783_1-p3277751.91 × 10−203.39 × 10−1917.2217.34C092,815,377–2,815,426
Bn-A08-p129139491.31 × 10−201.08 × 10−1816.5716.01A0810,587,677–10,694,560
Bn-A08-p128207861.46 × 10−211.99 × 10−1818.2616.58A08
Bn-scaff_17119_1-p849866.12 × 10−2015.96A08
Bn-scaff_17177_1-p5461846.61 × 10−1915.81C0244,655,688–44,655,731
Figure 4. Quantile–quantile plots of evaluated −log10(P) from association analysis of seed glucosinolate content using the Q + K model. (a) Quantile–quantile plots of evaluated −log10(P) from association analysis of seed glucosinolate content in 2013; (b) Quantile–quantile plots of evaluated −log10(P) from association analysis of seed glucosinolate content in 2014. Cq refers to the growing region, Chongqing, China.
Genes 06 01215 g004
Figure 5. Manhattan plot describing marker-trait associations for the total seed glucosinolate content of the population (consisting of 520 accessions) in 2013 and 2014. (a) Manhattan plot describing marker-trait associations for the total seed glucosinolate content in 2013; (b) Manhattan plot describing marker-trait associations for the total seed glucosinolate content in 2014. Cq refers to the growing region, Chongqing, China.
Genes 06 01215 g005

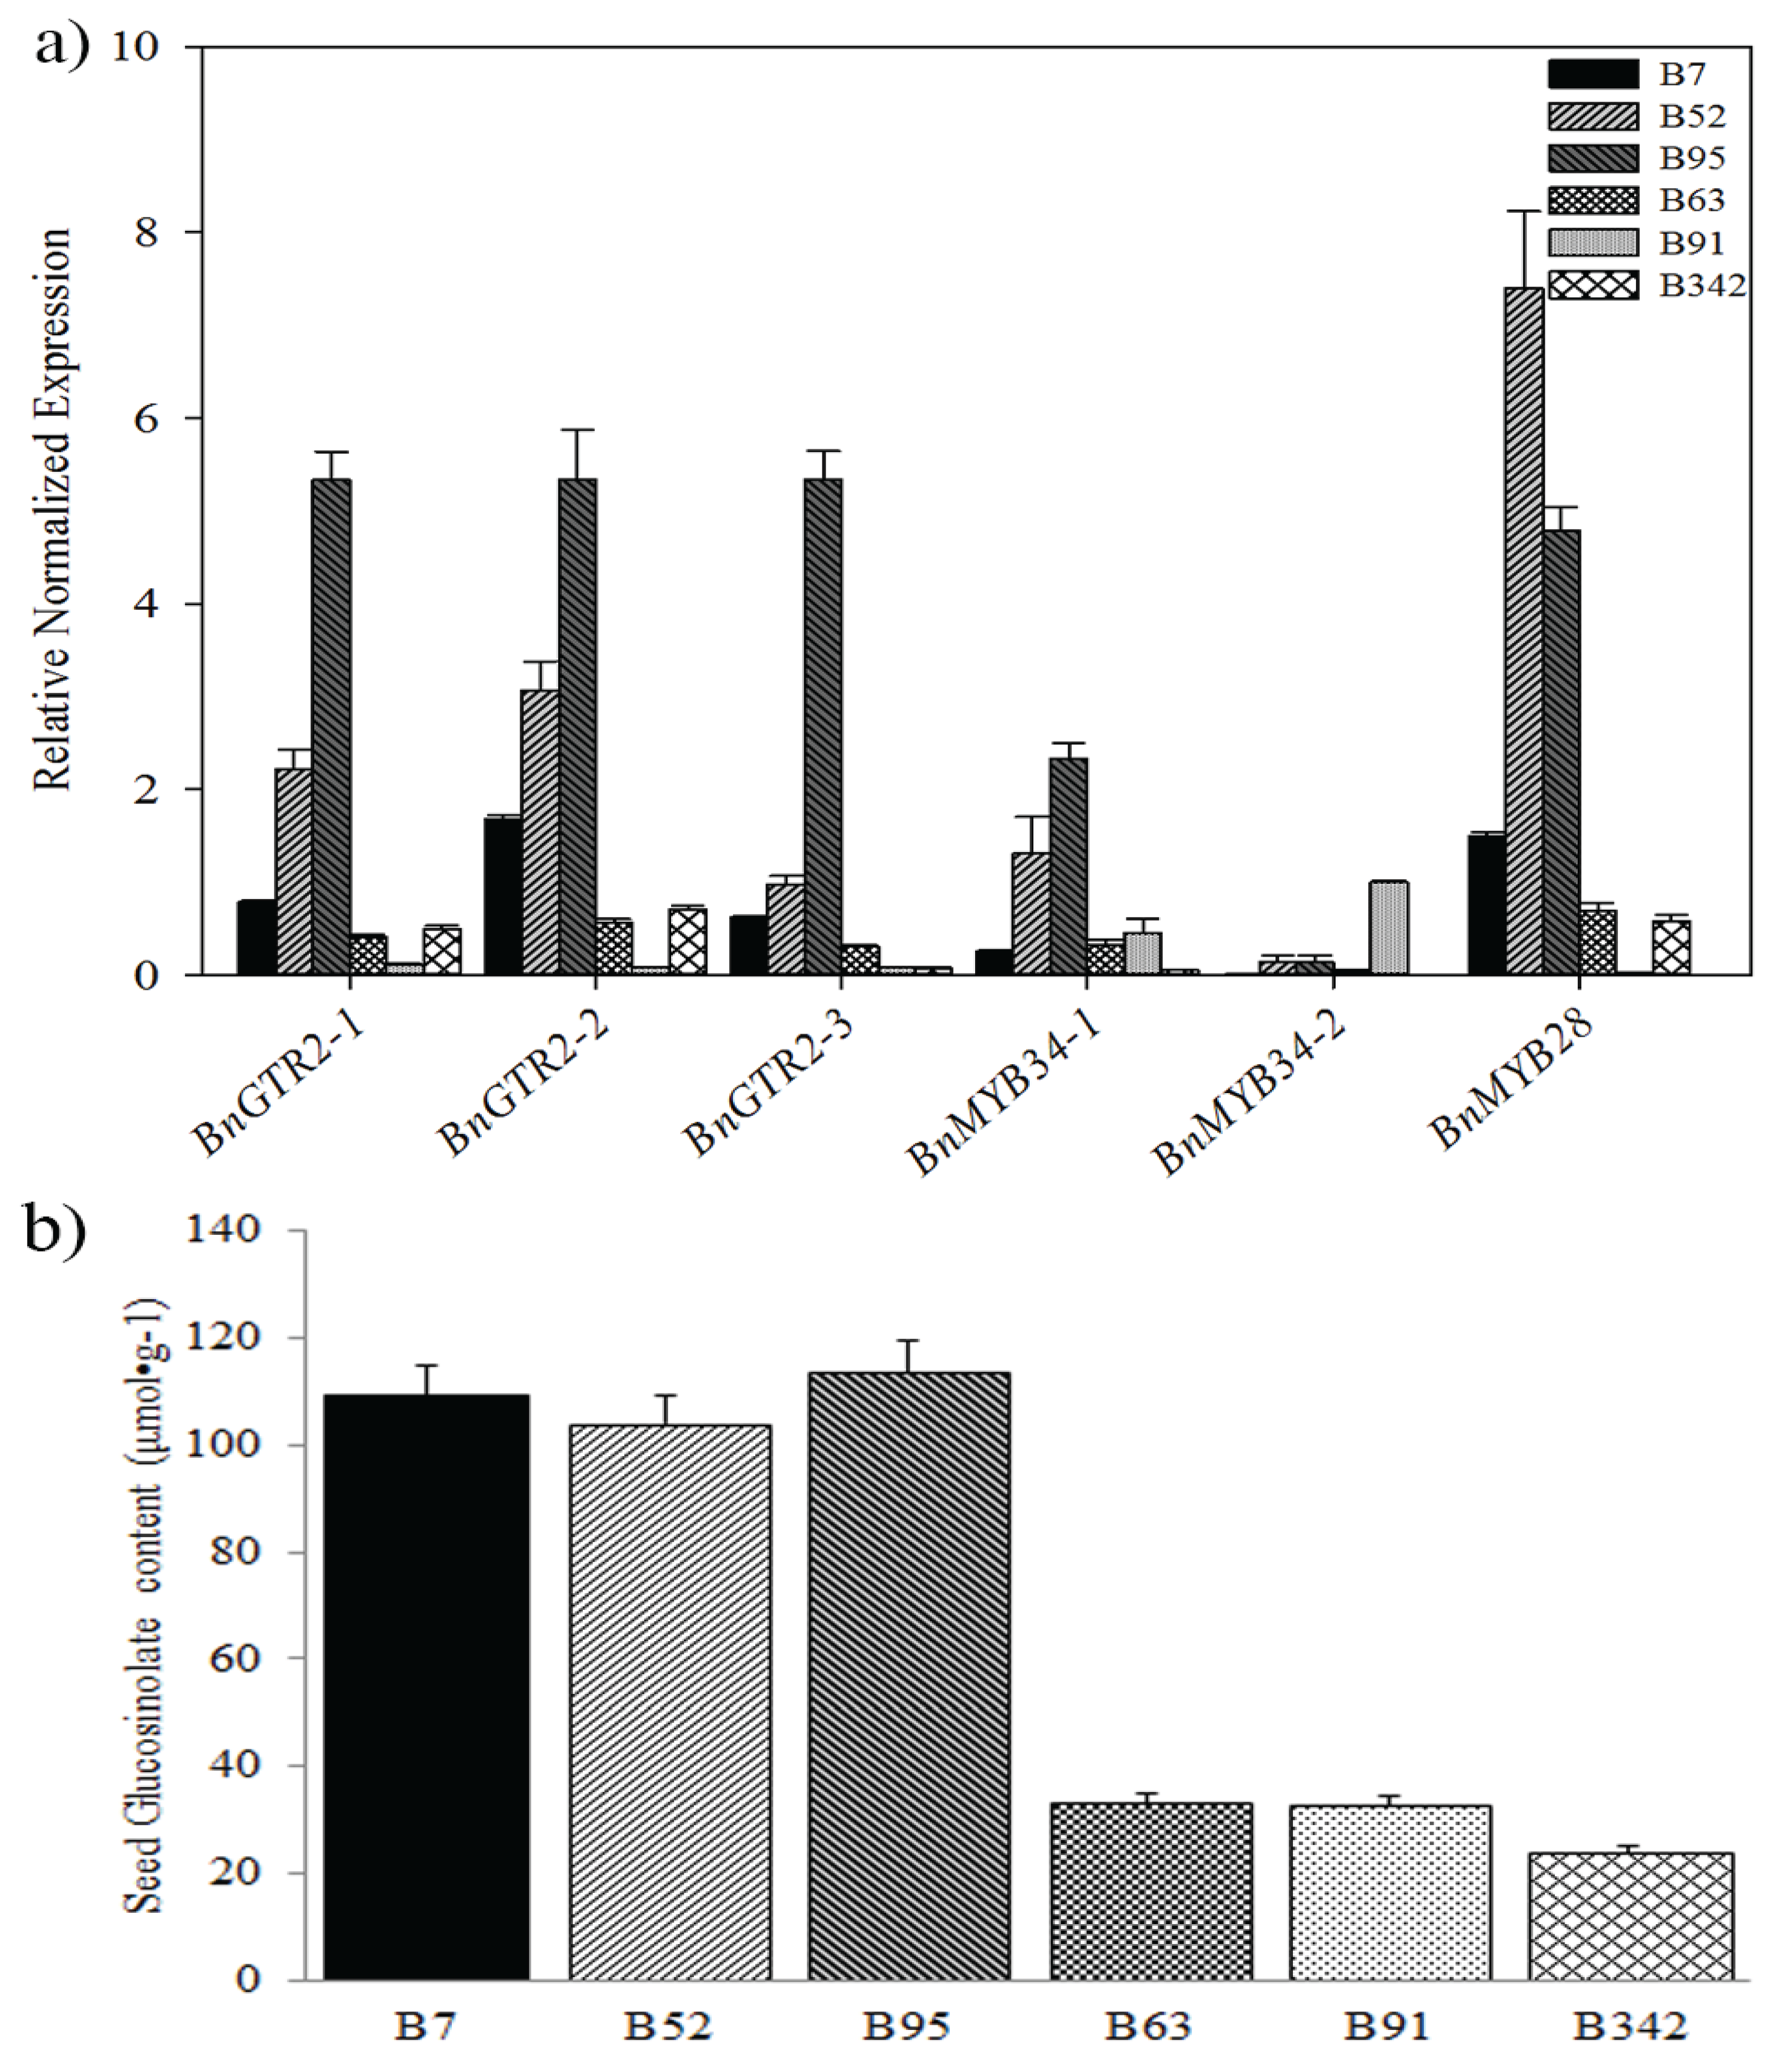
2.4. Identification and Validation of Candidate Genes

To identify the candidate genes, the B. napus genomic sequences between the adjacent peak SNPs were extracted. As a result, the associated regions with glucosinolate content on chromosome A09 and C09 included three Arabidopsis homologous genes (AT5G62680, AT5G60890, and AT5G61420) that were involved in the glucosinolate metabolic pathway (Table 4). Homologous genes AT5G62680 (GRT2) and AT5G60890 (MYB34) were approximately 0.2 and 0.1 Mb away from the significant SNP, Bn-A09-p3116738 and Bn-A09-p3029767 on chromosome A09, respectively; and the homologous gene AT5G61420 (MYB28) was 0.3 Mb away from the significant SNPs, Bn-scaff_19783_1-p327775, on chromosome C09 (Table 3). In addition, the association region of GS content was also detected on chromosome A08, maybe in accordance with Xu et al. [7]. These results suggested that association analysis is effective for identifying candidate genes by comparing the genomic sequences of the peak SNPs. B. napus was derived from interspecific hybridization of B. rapa and B. oleracea to form an allotetraploid species, and major gene loss is typical after polyploidy formation in eukaryotes [22]. Each of the orthologous blocks corresponding to ancestral blocks could be identified using collinearity between orthologues on the genome of B. rapa, B. oleracea, B. napus, and A. thaliana genome. The copies of each gene were identified and distributed in LF, MF1, MF2 and non-genome of B. rapa, B. oleracea and B.napus (Table 4). These results provide a chance to study gene retention in triplicated genomes.
Figure 6. Relative expression of the candidate genes and seed glucosinolate content of B. napus accessions. (a) Relative expressions of the candidate genes detected by qRT-PCR. The expression levels were normalized with BnActin7 and BnUBC21 genes. Error bars indicated the SE for three independent experiments. The primers are listed in Supplementary Material, Table S2 on the journal’s website. (b) Means and standard error of seed glucosinolate content of six B. napus accessions in 2013 and 2014.
Genes 06 01215 g006
Table 4. The different copies of candidate genes in the B. rapa, B. oleracea and B. napus genome.
SpeciesLf aMF1 bMF2 cNon-Genome Triplication dAGI NO.Description
BraBra010111Bra029248Bra035886Bra035885AT5G62680GLUCOSINOLATE TRANSPORTER-2
BolBol019440Bol020699Bol019185
BnaABnaA06g22160DBnaA02g33530DBnaA09g06190D
BnaCBnaC03g51560DBnaC02g42260DBnaC09g05810DBnaC02g42280D
BraBra013000Bra029350Bra035954AT5G60890myb domain protein 34 (MYB34)
BolBol017062Bol007760Bol036264
BnaABnaA03g39790DBnaA09g05480DBnaAnng06630D
BnaCBnaC02g41860DBnaC09g05060DBnaCnng21270D
BraBra012961Bra029311Bra035929AT5G61420myb domain protein 28 (MYB28)
BolBol017019Bol007795Bol036286
BnaABnaA03g40190D
BnaCBnaC09g05300DBnaCnng43220D
a LF indicates the least fractionated blocks; b MF1 indicates the medium fractionated blocks; c MF2 indicated the most fractionated blocks; d Non-genome triplication indicates that these copies are not triplicated genome segments; Bra: B. rapa; Bol: B. oleracea; BnaA: B. napus A genome; BnaC: B. napus C genome.
The qRT-PCR analysis showed that BnGTR2 and BnMYB28 had higher expression levels in relatively high GS content than in relative low GS content lines (Figure 6a,b). This result confirms strong association of BnGTR2 and BnMYB28 with GS content in B. napus, suggesting that they could play an important role in the glucosinolate biosynthesis in B. napus. Therefore, functional characterization of candidate genes will provide more clues so as to illuminate the molecular mechanism of glucosinolate in B. napus.

3. Discussion

In B. napus, selecting double-low seed lines with zero seed erucic acid and low GS content is an important breeding goal. QTL mapping has been used to map genes involved in rapeseed glucosinolate content, and the substantial evidence showed that total GS content is controlled by at least 4 to 5 gene loci in B. napus [3,4,5,6,8,9]. Association analysis has become a popular method for QTL mapping, as it offers a high throughput and high resolution means of identifying novel and superior alleles [23], and has been successfully used in B. napus in past two years [18,19,24,25,26]. In addition, high density SNPs identified in B. napus facilitating linkage disequilibrium (LD) studies can be used to identify rapeseed genes underlying seed glucosinolate content by comparing the genomics datasets of Brassica and Arabidopsis [17].
In this study, we identified 15 SNP markers with significant associations to GS content using the Brassica 60 K SNP BeadChip Array. Of which, 11 showed high LD to this trait in both years which were distributed on chromosomes A08, A09, C03, and C09, respectively (Table 3). Several previous studies detected major QTLs for seed glucosinolate content on chromosomes A09 and C09 [3,4,5,6,7,8,9]. For example, one QTL region for GS was mapped between the markers SNP19550A09 and SNP20943A09 [6], while other QTLs for GS content were mapped to a 3.2-Mb region of chromosome A09, a 50.0-Mb region of chromosome C02, a 39.9-Mb region of chromosome C07, and a 2.8-Mb region of chromosome C09 [18]. We identified two homologous regions that closely resemble the reported intervals on chromosomes A09 and C09, suggesting that they may belong to the same loci. In addition, studies using different rapeseed crosses have mapped the QTLs for GS content on chromosome C02 [4,6,18]. Similarly, the Bn-scaff_17177_1-p546184 marker showing high LD for GS content in 2013 was also found to be located on chromosome C02 in this study. Additionally, the association region close to peak SNPs on A08 is also consistent with the results reported by Xu et al. [7]. These results indicate that association mapping is a reliable technique for identifying candidate genes that control the GS content in B. napus.
Previous reports have shown that the total GS content is controlled by several genes involved in the GS biosynthesis and transport, and numerous QTLs associated with GS content have been mapped using different populations of B. napus [3,4,6,9]. However, candidate genes associated with these major QTLs for GS content in B. napus remain to be identified. Recently, the biosynthesis pathways for different glucosinolate compounds were well characterized in A. thaliana. These pathways include GTR1 (AT3G47960) and GTR2 (AT5G62680), which are essential for accumulation and allocation of glucosinolates in mature leaves [27] or in the bidirectional distribution of glucosinolates between the roots and rosettes [28,29]. In addition, MYB34 (AT5G60890), MYB51, and MYB122 are reported to coordinately control the suite of enzymes that synthesize indolic glucosinolates [30,31,32,33], but with low transcript levels among different organs of B. rapa [34]. HAG1 (also known as MYB28, AT5G61420) has been reported to control aliphatic glucosinolate biosynthesis in A. thaliana [35]. MYB28-1 (an isoform of MYB28) was involved in aliphatic glucosinolate biosynthesis in Brassica rapa (Chinese cabbage) seeds, and the glucosinolate content could be reduced by silencing orthologs of HAG1 in B. juncea [36]. Moreover, both MYB28 and MYB34 have been reported to regulate glucosinolate biosynthesis [37]. Here, three B. napus homologous of GRT2, MYB28 and MYB34 were identified according to the reference genome of B. napus [38]. Two annotated gene homologues (AT5G60890, MYB34 and AT5G62680, GRT2) were located within the 2.7–3.0 Mb physical region of B. napus chromosome A09, and AT5G60890 (MYB34) was 0.2 Mb away from the SNP Bn-A09-p3029767 and AT5G62680 was 20 kb away from the significant SNP Bn-A09-p3116738 on chromosome A09, respectively (Table 3). Meanwhile, the candidate gene, AT5G61420 (referred to as MYB28 or HAG1) was located 0.3 Mb away from the significant SNP Bn-scaff_19783_1-p327775 (Table 3). Therefore, we concluded that BnGRT2 and BnMYB28 could be associated with the GS content of B. napus (Figure 6). However, these candidate genes are characterized by multigene family members (Table 4). A clear understanding of the relationships among them is necessary for interpreting the functional mechanism of glucosinolate biosynthesis in B. napus. Further research will help us to reveal the function of these members of candidate genes in B. napus, and these tightly associated SNPs may be used to develop a breeding strategy to improve GS content of oilseed.

4. Materials and Methods

4.1. Plant Materials and Phenotypic Data

A panel of 520 rapeseed accessions including a wide range of morphological types of various geographical origins were used for association mapping (see Supplementary Material, Table S1 on the journal’s website). All rapeseed accessions were grown in field trials in Beibei (Chongqing, China) in the growing seasons of 2013 and 2014. Each accession was grown at three randomized blocks with three rows and 10–12 plants in each row. Field management essentially followed normal agronomic procedures. Then seeds collected from self-pollinated plants were used for analysis. In brief, the seeds (approximately 3 g seeds per accession) were cleaned of impurity and incased in the circular vessels. Then the glucosinolate content was scanned and calculated by near infrared reflectance spectroscopy (NIRS, FOSS, Hillerød, Denmark) using standard methods. Finally, the mean value from three replicates per accession was calculated for association analysis.

4.2. DNA Extraction and SNP Analysis

Genomic DNA was extracted from 100 mg of leaf tissue from 3 young seedlings for each of the 520 rapeseed accessions using the Cetyltrimethylam-monium bromide (CTAB) method. The SNP analysis was performed in the National Key Laboratory of Crop Genetic Improvement, National Subcenter of Rapeseed Improvement in Wuhan, Huazhong Agricultural University, Wuhan, China, according to the manufacture’s protocol [39]. The SNP data were analyzed according to the previous used protocols [18] by Illumina BeadStudio genotyping software.

4.3. Population Structure and Relative Kinship Analysis

Population structure, which refers to the non-random distribution of genotypes among individuals within a population, is a key factor affecting the accuracy of association analysis [40]. In this study, population structure evaluation was performed on the 520 accessions using the Bayesian model-based clustering method implemented in STRUCTURE 2.1 [41], and allelic data from the Brassica 60K SNP BeadChip Array with 52,157 Infinium Type II SNP loci. The K-value (The putative number of genetic groups) best representing the data set was determined according to the method of Evanno et al. [42]. In short, three independent runs were performed with a K-value varying from K = 1 to K = 10, with the length of the burn-in period and the number of MCMC (Markov Chain Monte Carlo algorithm) repetitions after burn-in set to 100,000 and 1,000,000, for each of these. Then based on the rate of change in the log probability of data (Ln P (D)) between successive K-values, the most likely K-value was determined by the log probability of data (LnP(D)) and an ad hoc statistic ∆K as proposed by Evanno et al. [42]. TASSEL 5.2.1 [21] was used to estimate the relative kinship coefficients among all pairs of the 520 accessions based on the SNP marker data. Coefficients less than zero were replaced by zero [21].

4.4. Genome-Wide Association Study (GWAS) and Candidate Genes Identification

The mixed-model method was developed to account for multiple levels of relatedness simultaneously as detected by random genetic markers [21], and the Q + K model was used to identify the association signals [18]. Therefore, GWAS between SNP markers and seed glucosinolate content of B. napus was performed using the mixed-linear model (MLM, Q + K model) implemented in TASSEL 5.2.1, as described by Yu et al. [21]. The minimum frequency was set to 0.05, so that only SNP markers with a minor allele frequency (MAF) of 5% or greater were included in the association analysis. The p-value, which was determined by the formula p = 1/N (where N refers to the total number of SNP markers in study) [18], was used to determine whether SNP markers were significantly associated with the target traits.
In order to identify the candidate genes, the flanking sequences between the adjacent peak SNPs were mapped onto a B. napus “Darmor-Bzh” reference genome [38] by a homology search approach via a BLAST analysis. Finally, the B. napus genomic sequences centered by the peak SNPs were aligned to the Arabidopsis Information Resource [43], and the candidate genes were predicted by BLASTN analysis.

4.5. Real-time Quantitative PCR (qRT-PCR) Verification of Candidate Genes

To confirm the association between candidate gene and seed GS contents, total RNA of leaves was extracted from B7, B52 and B95 with relative high GS content and B63, B91 and B342 with low GS content, respectively (see Supplementary Material, Table S1 on the journal’s website). The first cDNA were synthesized using the AMV reverse transcriptase (Takara, Dalian, China). The primers were designed by software Primer Premier 5.0 (see Supplementary Material, Table S2 on the journal’s website) according to the alignment results of candidate gene sequences. Then real-time PCR was performed according to our previous research methods [22]. Relative expressions of candidate genes were calculated with the 2−ΔΔCt method using BnACTIN7 (At5g09810, EV116054) and BnUBC21 (At5g25760, EV086936) as internal controls [44]. All samples were amplified in triplicate and the mean value was used for further analysis. All qRT-PCR assays were repeated three times.

5. Conclusions

We used association mapping to identify SNP markers linked to glucosinolate content in a population of 520 rapeseed accessions. In total, 11 peak SNPs were repeatedly detected with two years of field data, including four significant association regions distributed on chromosome A08, A09, C03, and C09 of B. napus, respectively. Three B. napus orthologs of the Arabidopsis thaliana genes involved in seed glucosinolate content were identified by comparison of the genomic sequences of adjacent peak SNPs, and BnGRT2 and BnMYB28 are the candidate genes involved in the glucosinolate biosynthesis. These results will help us to well understand the molecular mechanism of the glucosinolate biosynthesis and allocation in B. napus, and improve the breeding efficiency by molecular marker-assisted selection in the future.

Supplementary Files

Supplementary File 1

Acknowledgments

This work was supported by grants from the National Science Foundation of China (31401412, U1302266, 31171619), the “111” Project (B12006); the earmarked fund for Modern Agro-industry Technology Research System (CARS-13); Chongqing Improved strains Innovation Project of China (cstc2012ggB80008), and support from the China Scholarship Council (CSC).

Author Contributions

Cun-Min Qu, Xin-Fu Xu and Rui Wang conceived and designed the experiments; Shi-Meng Li, Xiu-Jian Duan, Le-Dong Jia, Hui-Yan Zhao and Jin-Hua Fan performed research and analyzed the data; Cun-Min Qu and Kun Lu wrote the paper; Cun-Min Qu, Kun Lu and Jia-Na Li edited and commented on the manuscript. All authors read and approved the final manuscript.

Conflicts of Interest

The authors declare no conflict of interest.

References

  1. Walker, K.C.; Booth, E.J. Agricultural aspects of rape and other Brassica products. Eur. J. Lipid Sci. Technol. 2001, 103, 441–446. [Google Scholar] [CrossRef]
  2. Naczk, M.; Amarowicz, R.; Sullivan, A.; Shahidi, F. Current research developments on polyphenolics of rapeseed/canola: A review. Food Chem. 1998, 62, 489–502. [Google Scholar] [CrossRef]
  3. Zhao, J.; Meng, J. Detection of loci controlling seed glucosinolate content and their association with Sclerotinia resistance in Brassica napus. Plant Breed. 2003, 122, 19–23. [Google Scholar] [CrossRef]
  4. Howell, P.; Sharpe, A.; Lydiate, D. Homoeologous loci control the accumulation of seed glucosinolates in oilseed rape (Brassica napus). Genome 2003, 46, 454–460. [Google Scholar] [CrossRef] [PubMed]
  5. Uzunova, M.; Ecke, W.; Weissleder, K.; R bbelen, G. Mapping the genome of rapeseed (Brassica napus L.). I. Construction of an RFLP linkage map and localization of QTLs for seed glucosinolate content. Theor. Appl. Genet. 1995, 90, 194–204. [Google Scholar] [CrossRef] [PubMed]
  6. Jian, H.J.; Wei, L.J.; Li, J.N.; Xu, X.F.; Chen, L.; Liu, L.Z. Quantitative traits loci analysis of seed glucosinolate content in Brassica napus using high-density SNP map (In Chinese). Acta Agron. Sin. 2014, 40, 1386–1391. [Google Scholar]
  7. Xu, J.; Long, Y.; Wu, J.; Xu, H.; Zhao, Z.; Wen, J.; Meng, J.; Shi, C. QTL identification on two genetic systems for rapeseed glucosinolate and erucic acid contents over two seasons. Euphytica 2015, 205, 647–657. [Google Scholar] [CrossRef]
  8. Basunanda, P.; Spiller, T.; Hasan, M.; Gehringer, A.; Schondelmaier, J.; Lühs, W.; Friedt, W.; Snowdon, R. Marker-assisted increase of genetic diversity in a double-low seed quality winter oilseed rape genetic background. Plant Breed. 2007, 126, 581–587. [Google Scholar] [CrossRef]
  9. Quijada, P.A.; Udall, J.A.; Lambert, B.; Osborn, T.C. Quantitative trait analysis of seed yield and other complex traits in hybrid spring rapeseed (Brassica napus L.): 1. Identification of genomic regions from winter germplasm. Theor. Appl. Genet. 2006, 113, 549–561. [Google Scholar] [CrossRef] [PubMed]
  10. Kraakman, A.T.W.; Niks, R.E.; van den Berg, P.M.M.M.; Stam, P.; van Eeuwijk, F.A. Linkage disequilibrium mapping of yield and yield stability in modern spring barley cultivars. Genetics 2004, 168, 435–446. [Google Scholar] [CrossRef] [PubMed]
  11. Yan, J.; Warburton, M.; Crouch, J. Association mapping for enhancing maize (Zea mays L.) genetic improvement. Crop Sci. 2011, 51, 433–449. [Google Scholar] [CrossRef]
  12. Yan, J.B.; Shah, T.; Warburton, M.L.; Buckler, E.S.; McMullen, M.D.; Crouch, J. Genetic characterization and linkage disequilibrium estimation of a global maize collection using SNP markers. PLoS ONE 2009, 4, e8451. [Google Scholar] [CrossRef] [PubMed] [Green Version]
  13. Agrama, H.; Eizenga, G.; Yan, W. Association mapping of yield and its components in rice cultivars. Mol. Breed. 2007, 19, 341–356. [Google Scholar] [CrossRef]
  14. Meuwissen, T.; Goddard, M. Fine mapping of quantitative trait loci using linkage disequilibria with closely linked marker loci. Genetics 2000, 155, 421–430. [Google Scholar] [PubMed]
  15. Rezaeizad, A.; Wittkop, B.; Snowdon, R.; Hasan, M.; Mohammadi, V.; Zali, A.; Friedt, W. Identification of QTLs for phenolic compounds in oilseed rape (Brassica napus L.) by association mapping using SSR markers. Euphytica 2011, 177, 335–342. [Google Scholar] [CrossRef]
  16. Zou, J.; Jiang, C.; Cao, Z.; Li, R.; Long, Y.; Chen, S.; Meng, J. Association mapping of seed oil content in Brassica napus and comparison with quantitative trait loci identified from linkage mapping. Genome 2010, 53, 908–916. [Google Scholar] [PubMed]
  17. Lu, G.; Harper, A.L.; Trick, M.; Morgan, C.; Fraser, F.; O’Neill, C.; Bancroft, I. Associative transcriptomics study dissects the genetic architecture of seed glucosinolate content in Brassica napus. DNA Res. 2014, 21, 613–625. [Google Scholar] [CrossRef] [PubMed]
  18. Li, F.; Chen, B.; Xu, K.; Wu, J.; Song, W.; Bancroft, I.; Harper, A.L.; Trick, M.; Liu, S.; Gao, G. Genome-wide association study dissects the genetic architecture of seed weight and seed quality in rapeseed (Brassica napus L.). DNA Res. 2014, 21, 355–367. [Google Scholar] [CrossRef] [PubMed]
  19. Gajardo, H.A.; Wittkop, B.; Soto-Cerda, B.; Higgins, E.E.; Parkin, I.A.; Snowdon, R.J.; Federico, M.L.; Iniguez-Luy, F.L. Association mapping of seed quality traits in Brassica napus L. using GWAS and candidate QTL approaches. Mol. Breed. 2015, 35, 1–19. [Google Scholar] [CrossRef]
  20. The Multinational Brassica Genome Project. Available online: http://www.brassica.info/ (accessed on 22 September 2015).
  21. Yu, J.; Pressoir, G.; Briggs, W.H.; Bi, I.V.; Yamasaki, M.; Doebley, J.F.; McMullen, M.D.; Gaut, B.S.; Nielsen, D.M.; Holland, J.B. A unified mixed-model method for association mapping that accounts for multiple levels of relatedness. Nat. Genet. 2006, 38, 203–208. [Google Scholar] [CrossRef] [PubMed]
  22. Qu, C.; Fu, F.; Lu, K.; Zhang, K.; Wang, R.; Xu, X.; Wang, M.; Lu, J.; Wan, H.; Zhanglin, T.; et al. Differential accumulation of phenolic compounds and expression of related genes in black-and yellow-seeded Brassica napus. J. Exp. Bot. 2013, 64, 2885–2898. [Google Scholar] [CrossRef] [PubMed]
  23. Duran, C.; Eales, D.; Marshall, D.; Imelfort, M.; Stiller, J.; Berkman, P.J.; Clark, T.; McKenzie, M.; Appleby, N.; Batley, J. Future tools for association mapping in crop plants. Genome 2010, 53, 1017–1023. [Google Scholar] [PubMed]
  24. Li, F.; Chen, B.; Xu, K.; Gao, G.; Yan, G.; Qiao, J.; Li, J.; Li, H.; Li, L.; Xiao, X. A genome-wide association study of plant height and primary branch number in Rapeseed (Brassica napus). Plant Sci. 2015. [Google Scholar] [CrossRef]
  25. Luo, X.; Ma, C.; Yue, Y.; Hu, K.; Li, Y.; Duan, Z.; Wu, M.; Tu, J.; Shen, J.; Yi, B. Unravelling the complex trait of harvest index in rapeseed (Brassica napus L.) with association mapping. BMC Genomics 2015. [Google Scholar] [CrossRef] [PubMed]
  26. Hatzig, S.V.; Frisch, M.; Breuer, F.; Nesi, N.; Ducournau, S.; Wagner, M.-H.; Leckband, G.; Abbadi, A.; Snowdon, R.J. Genome-wide association mapping unravels the genetic control of seed germination and vigor in Brassica napus. Front. Plant sci. 2015. [Google Scholar] [CrossRef] [PubMed]
  27. Nour-Eldin, H.H.; Andersen, T.G.; Burow, M.; Madsen, S.R.; Jørgensen, M.E.; Olsen, C.E.; Dreyer, I.; Hedrich, R.; Geiger, D.; Halkier, B.A. NRT/PTR transporters are essential for translocation of glucosinolate defence compounds to seeds. Nature 2012, 488, 531–534. [Google Scholar] [CrossRef] [PubMed]
  28. Madsen, S.R.; Olsen, C.E.; Nour-Eldin, H.H.; Halkier, B.A. Elucidating the role of transport processes in leaf glucosinolate distribution. Plant Physiol. 2014, 166, 1450–1462. [Google Scholar] [CrossRef] [PubMed]
  29. Andersen, T.G.; Nour-Eldin, H.H.; Fuller, V.L.; Olsen, C.E.; Burow, M.; Halkier, B.A. Integration of biosynthesis and long-distance transport establish organ-specific glucosinolate profiles in vegetative Arabidopsis. Plant Cell Online 2013, 25, 3133–3145. [Google Scholar] [CrossRef] [PubMed]
  30. Celenza, J.L.; Quiel, J.A.; Smolen, G.A.; Merrikh, H.; Silvestro, A.R.; Normanly, J.; Bender, J. The Arabidopsis ATR1 Myb transcription factor controls indolic glucosinolate homeostasis. Plant Physiol. 2005, 137, 253–262. [Google Scholar] [CrossRef] [PubMed]
  31. Gigolashvili, T.; Berger, B.; Mock, H.P.; Müller, C.; Weisshaar, B.; Flügge, U.I. The transcription factor HIG1/MYB51 regulates indolic glucosinolate biosynthesis in Arabidopsis thaliana. Plant J. 2007, 50, 886–901. [Google Scholar] [CrossRef] [PubMed]
  32. Skirycz, A.; Reichelt, M.; Burow, M.; Birkemeyer, C.; Rolcik, J.; Kopka, J.; Zanor, M.I.; Gershenzon, J.; Strnad, M.; Szopa, J. DOF transcription factor AtDof1.1 (OBP2) is part of a regulatory network controlling glucosinolate biosynthesis in Arabidopsis. Plant J. 2006, 47, 10–24. [Google Scholar] [CrossRef] [PubMed]
  33. Frerigmann, H.; Gigolashvili, T. MYB34, MYB51, and MYB122 distinctly regulate indolic glucosinolate biosynthesis in Arabidopsis thaliana. Mol. Plant 2014, 7, 814–828. [Google Scholar] [CrossRef] [PubMed]
  34. Kim, Y.B.; Li, X.; Kim, S.-J.; Kim, H.H.; Lee, J.; Kim, H.; Park, S.U. MYB transcription factors regulate glucosinolate biosynthesis in different organs of Chinese cabbage (Brassica rapa ssp. pekinensis). Molecules 2013, 18, 8682–8695. [Google Scholar] [CrossRef] [PubMed]
  35. Hirai, M.Y.; Sugiyama, K.; Sawada, Y.; Tohge, T.; Obayashi, T.; Suzuki, A.; Araki, R.; Sakurai, N.; Suzuki, H.; Aoki, K. Omics-based identification of Arabidopsis Myb transcription factors regulating aliphatic glucosinolate biosynthesis. Proc. Natl. Acad. Sci. 2007, 104, 6478–6483. [Google Scholar] [CrossRef] [PubMed]
  36. Augustine, R.; Mukhopadhyay, A.; Bisht, N.C. Targeted silencing of BjMYB28 transcription factor gene directs development of low glucosinolate lines in oilseed Brassica juncea. Plant Biotechnol. J. 2013, 11, 855–866. [Google Scholar] [CrossRef] [PubMed]
  37. Guo, R.; Qian, H.; Shen, W.; Liu, L.; Zhang, M.; Cai, C.; Zhao, Y.; Qiao, J.; Wang, Q. BZR1 and BES1 participate in regulation of glucosinolate biosynthesis by brassinosteroids in Arabidopsis. J. Exp. Bot. 2013, 64, 2401–2412. [Google Scholar] [CrossRef] [PubMed]
  38. Chalhoub, B.; Denoeud, F.; Liu, S.; Parkin, I.A.; Tang, H.; Wang, X.; Chiquet, J.; Belcram, H.; Tong, C.; Samans, B.; et al. Early allopolyploid evolution in the post-Neolithic Brassica napus oilseed genome. Science 2014, 345, 950–953. [Google Scholar] [CrossRef] [PubMed]
  39. The Manufacture’s Protocol of BeadChips. Available online: http://www.illumina.com/technology/infinium_hd_assay.ilmn (accessed on 22 September 2015).
  40. Mackay, I.; Powell, W. Methods for linkage disequilibrium mapping in crops. Trends Plant Sci. 2007, 12, 57–63. [Google Scholar] [CrossRef] [PubMed]
  41. Pritchard, J.K.; Stephens, M.; Donnelly, P. Inference of population structure using multilocus genotype data. Genetics 2000, 155, 945–959. [Google Scholar] [PubMed]
  42. Evanno, G.; Regnaut, S.; Goudet, J. Detecting the number of clusters of individuals using the software STRUCTURE: A simulation study. Mol. Ecol. 2005, 14, 2611–2620. [Google Scholar] [CrossRef] [PubMed]
  43. The Arabidopsis Information Resource (TAIR). Available online: http://www.arabidopsis.org/index.jsp (accessed on 22 September 2015).
  44. Wu, G.; Li, Z.; Yuhua, W.; Yinglong, C.; Changming, L. Comparison of five endogenous reference genes for specific PCR detection and quantification of Brassica napus. J. Agric. Food Chem. 2010, 58, 2812–2817. [Google Scholar] [CrossRef] [PubMed]

