Genetic Diversity, Population Structure, and Linkage Disequilibrium in a Spanish Common Bean Diversity Panel Revealed through Genotyping-by-Sequencing


Abstract
:Highlights
- -
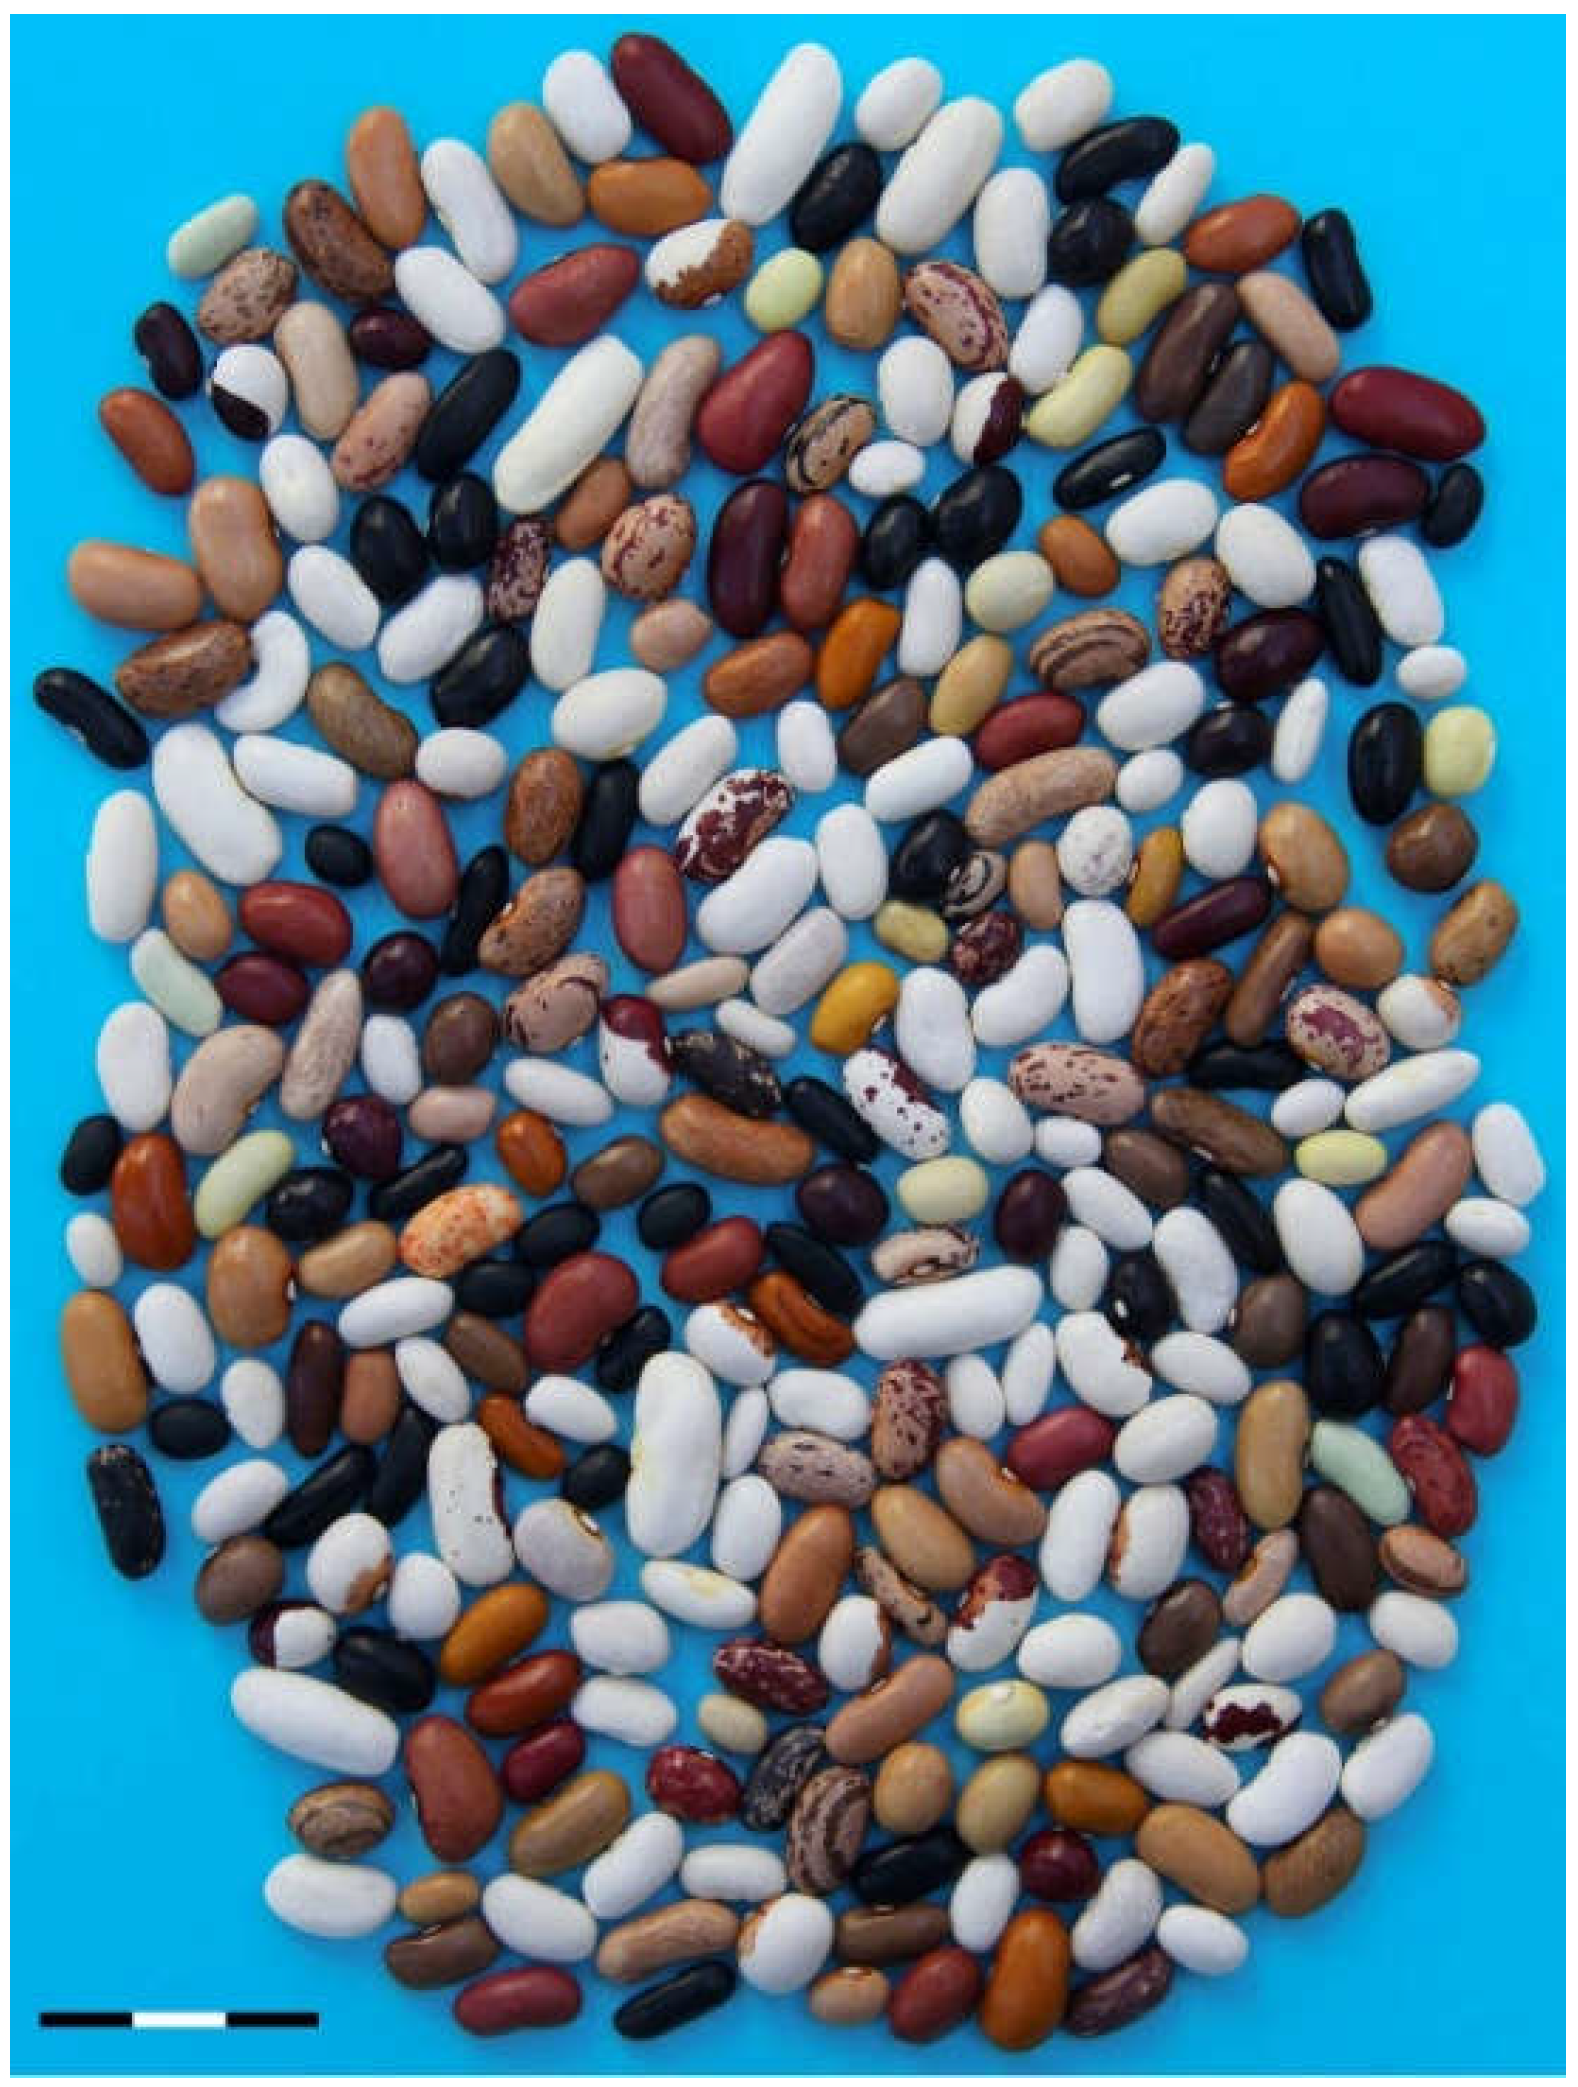
- A diversity panel (SDP) of 308 common bean lines was established for GWAS
- -
- SDP gathered a wide genetic common bean diversity
- -
- The main Spanish local diversity is represented in the SDP
- -
- SDP is appropriate for the study of pod traits related to snap consumption
1. Introduction
2. Material and Methods
2.1. Plant Material
2.2. DNA Isolation
2.3. Genotyping by Sequencing
2.4. Linkage Disequilibrium
2.5. Data Analysis
2.6. Genome-Wide Association Study for Determinacy
3. Results
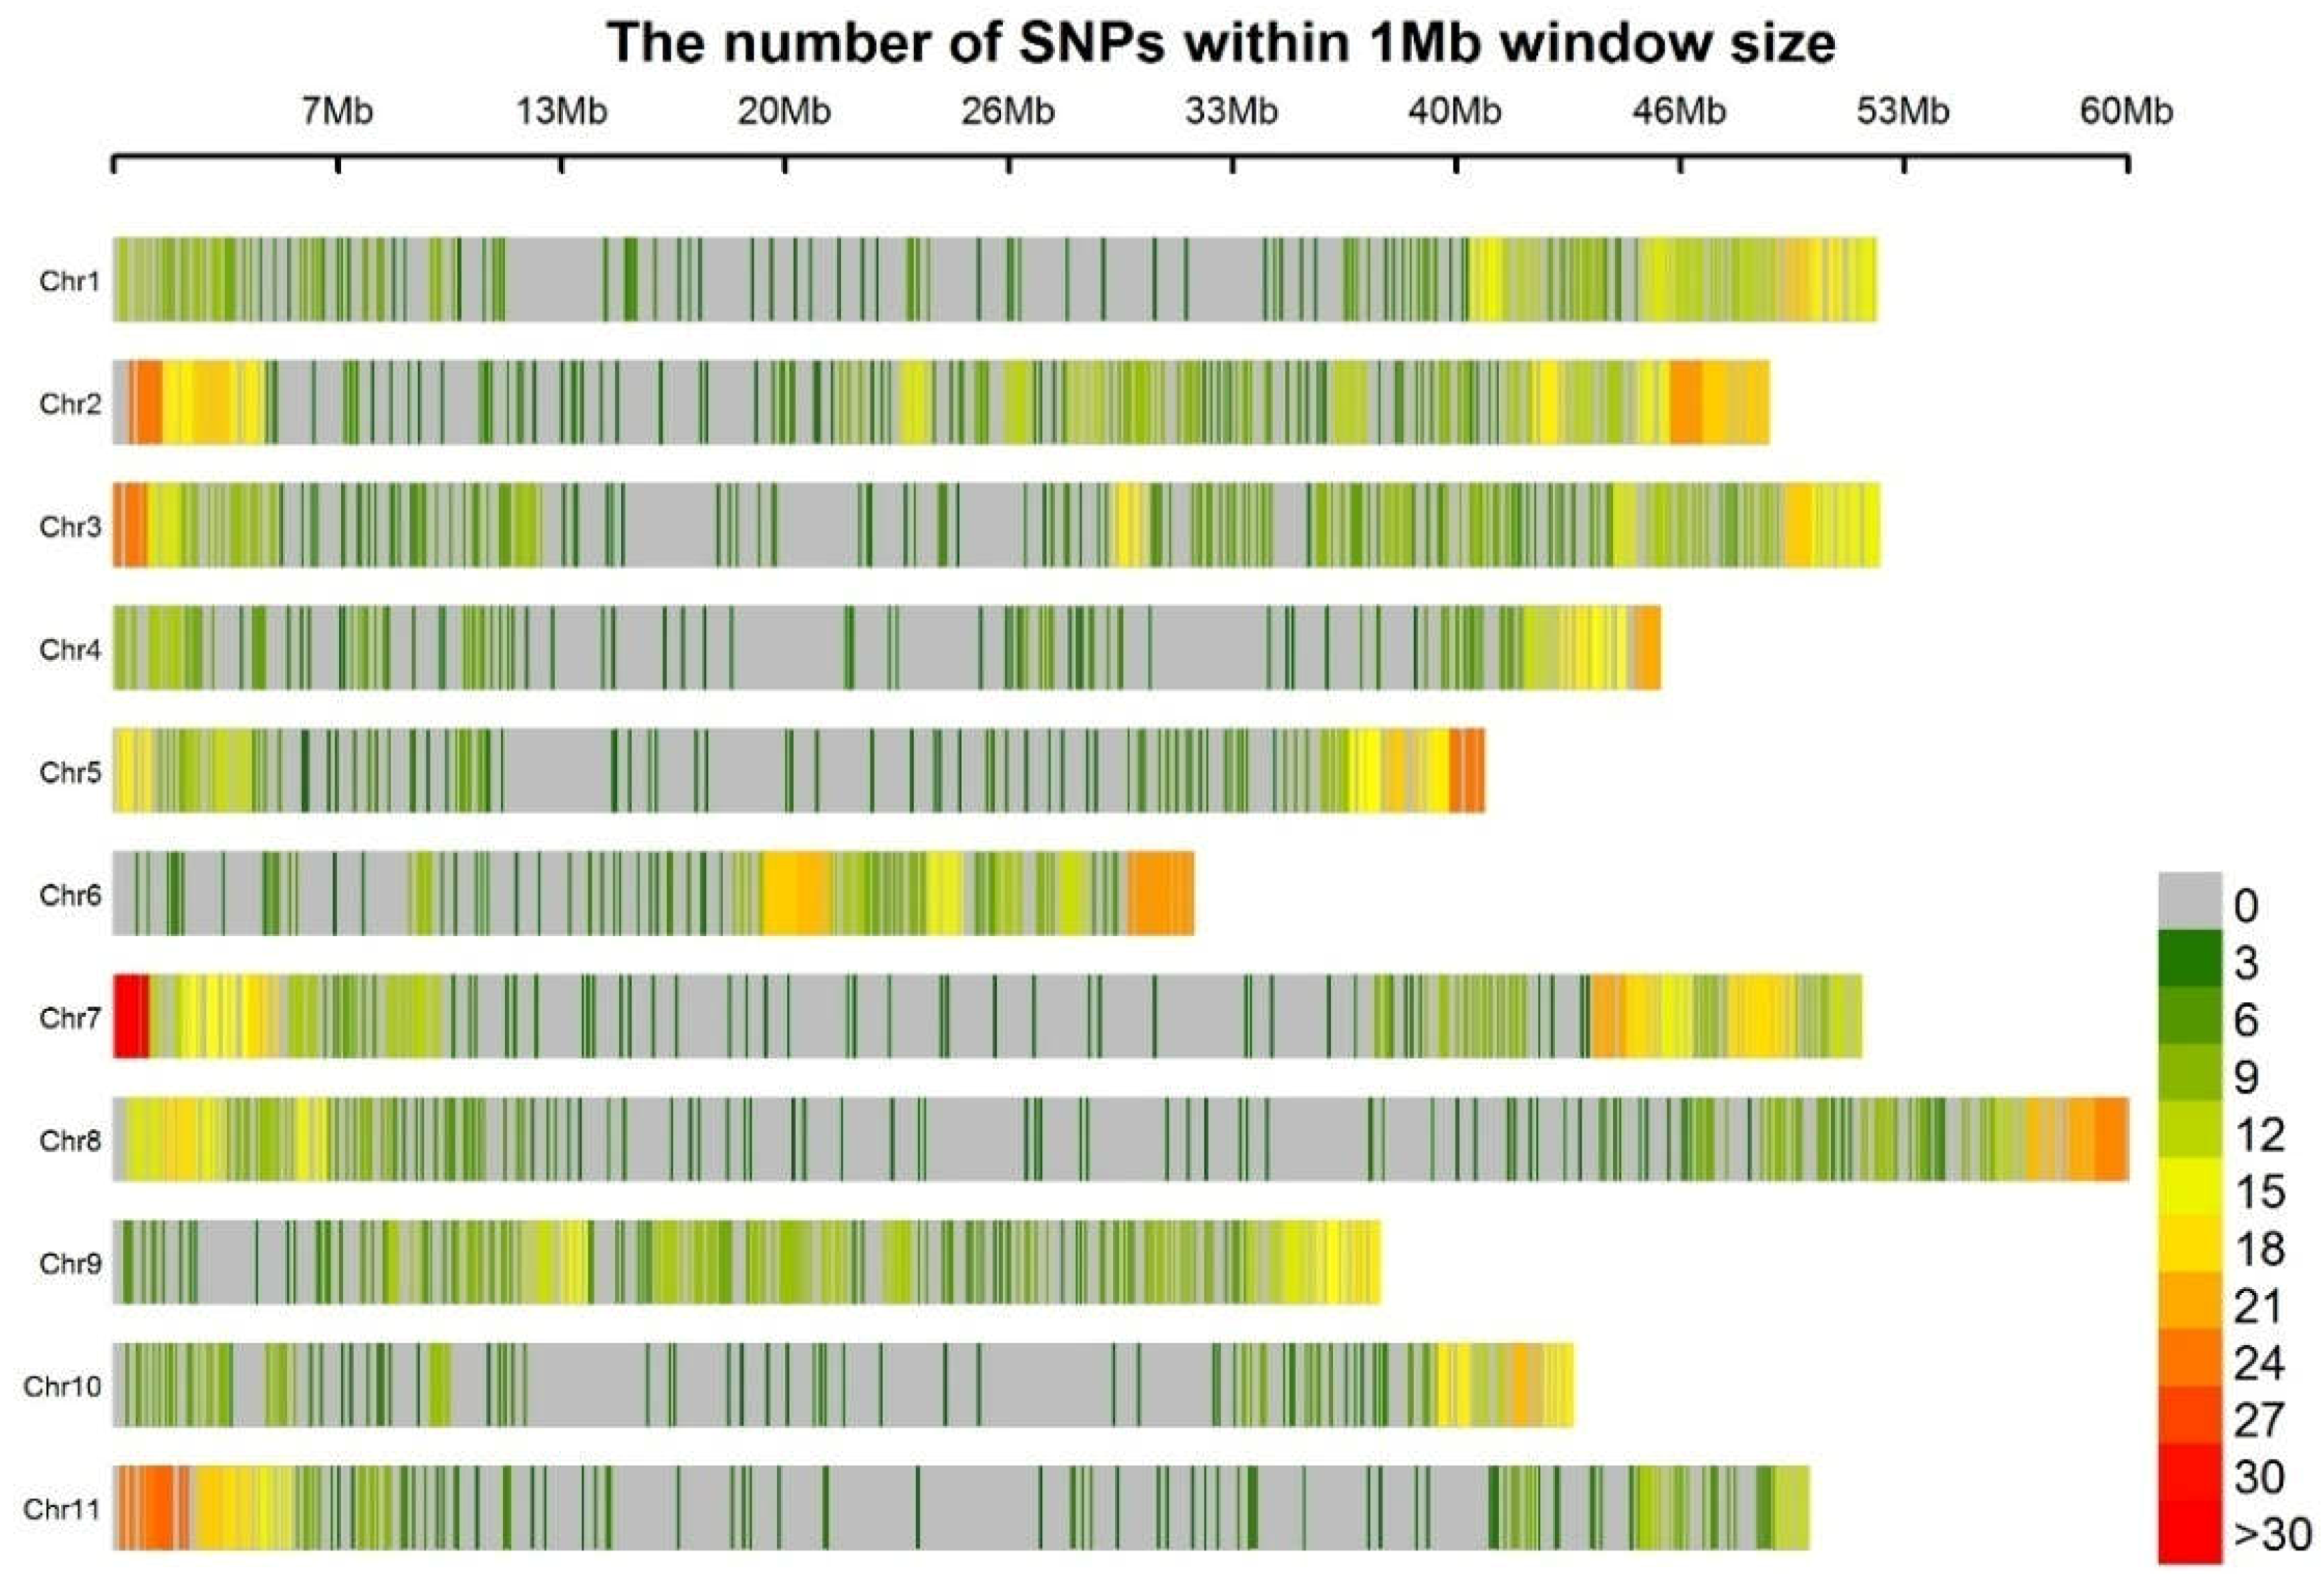
3.1. Genotyping
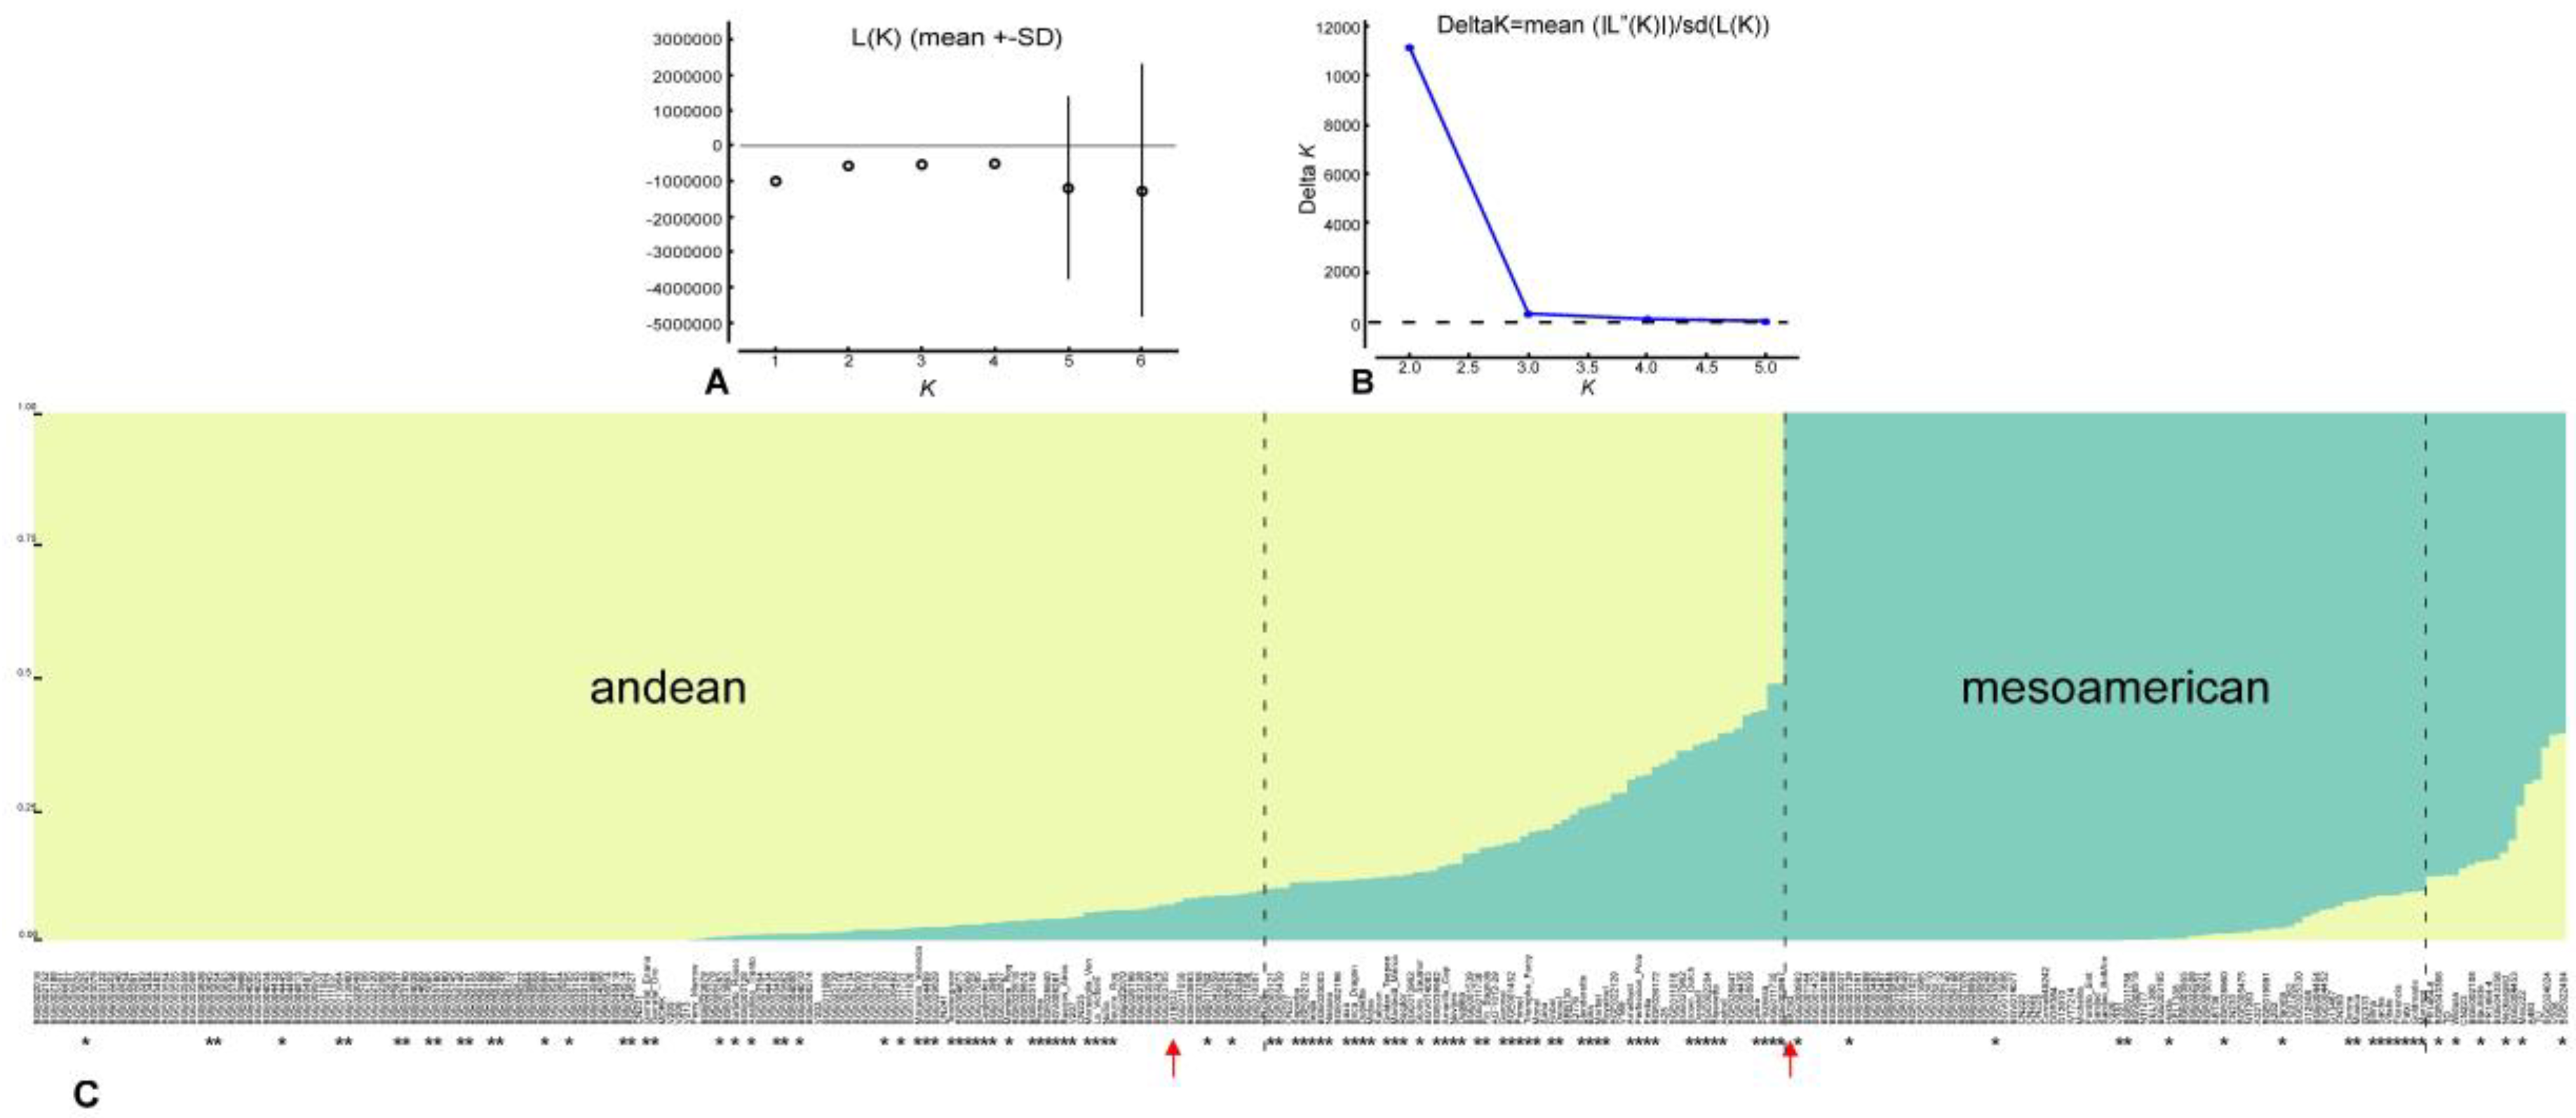
3.2. Population Structure
3.3. Linkage Disequilibrium
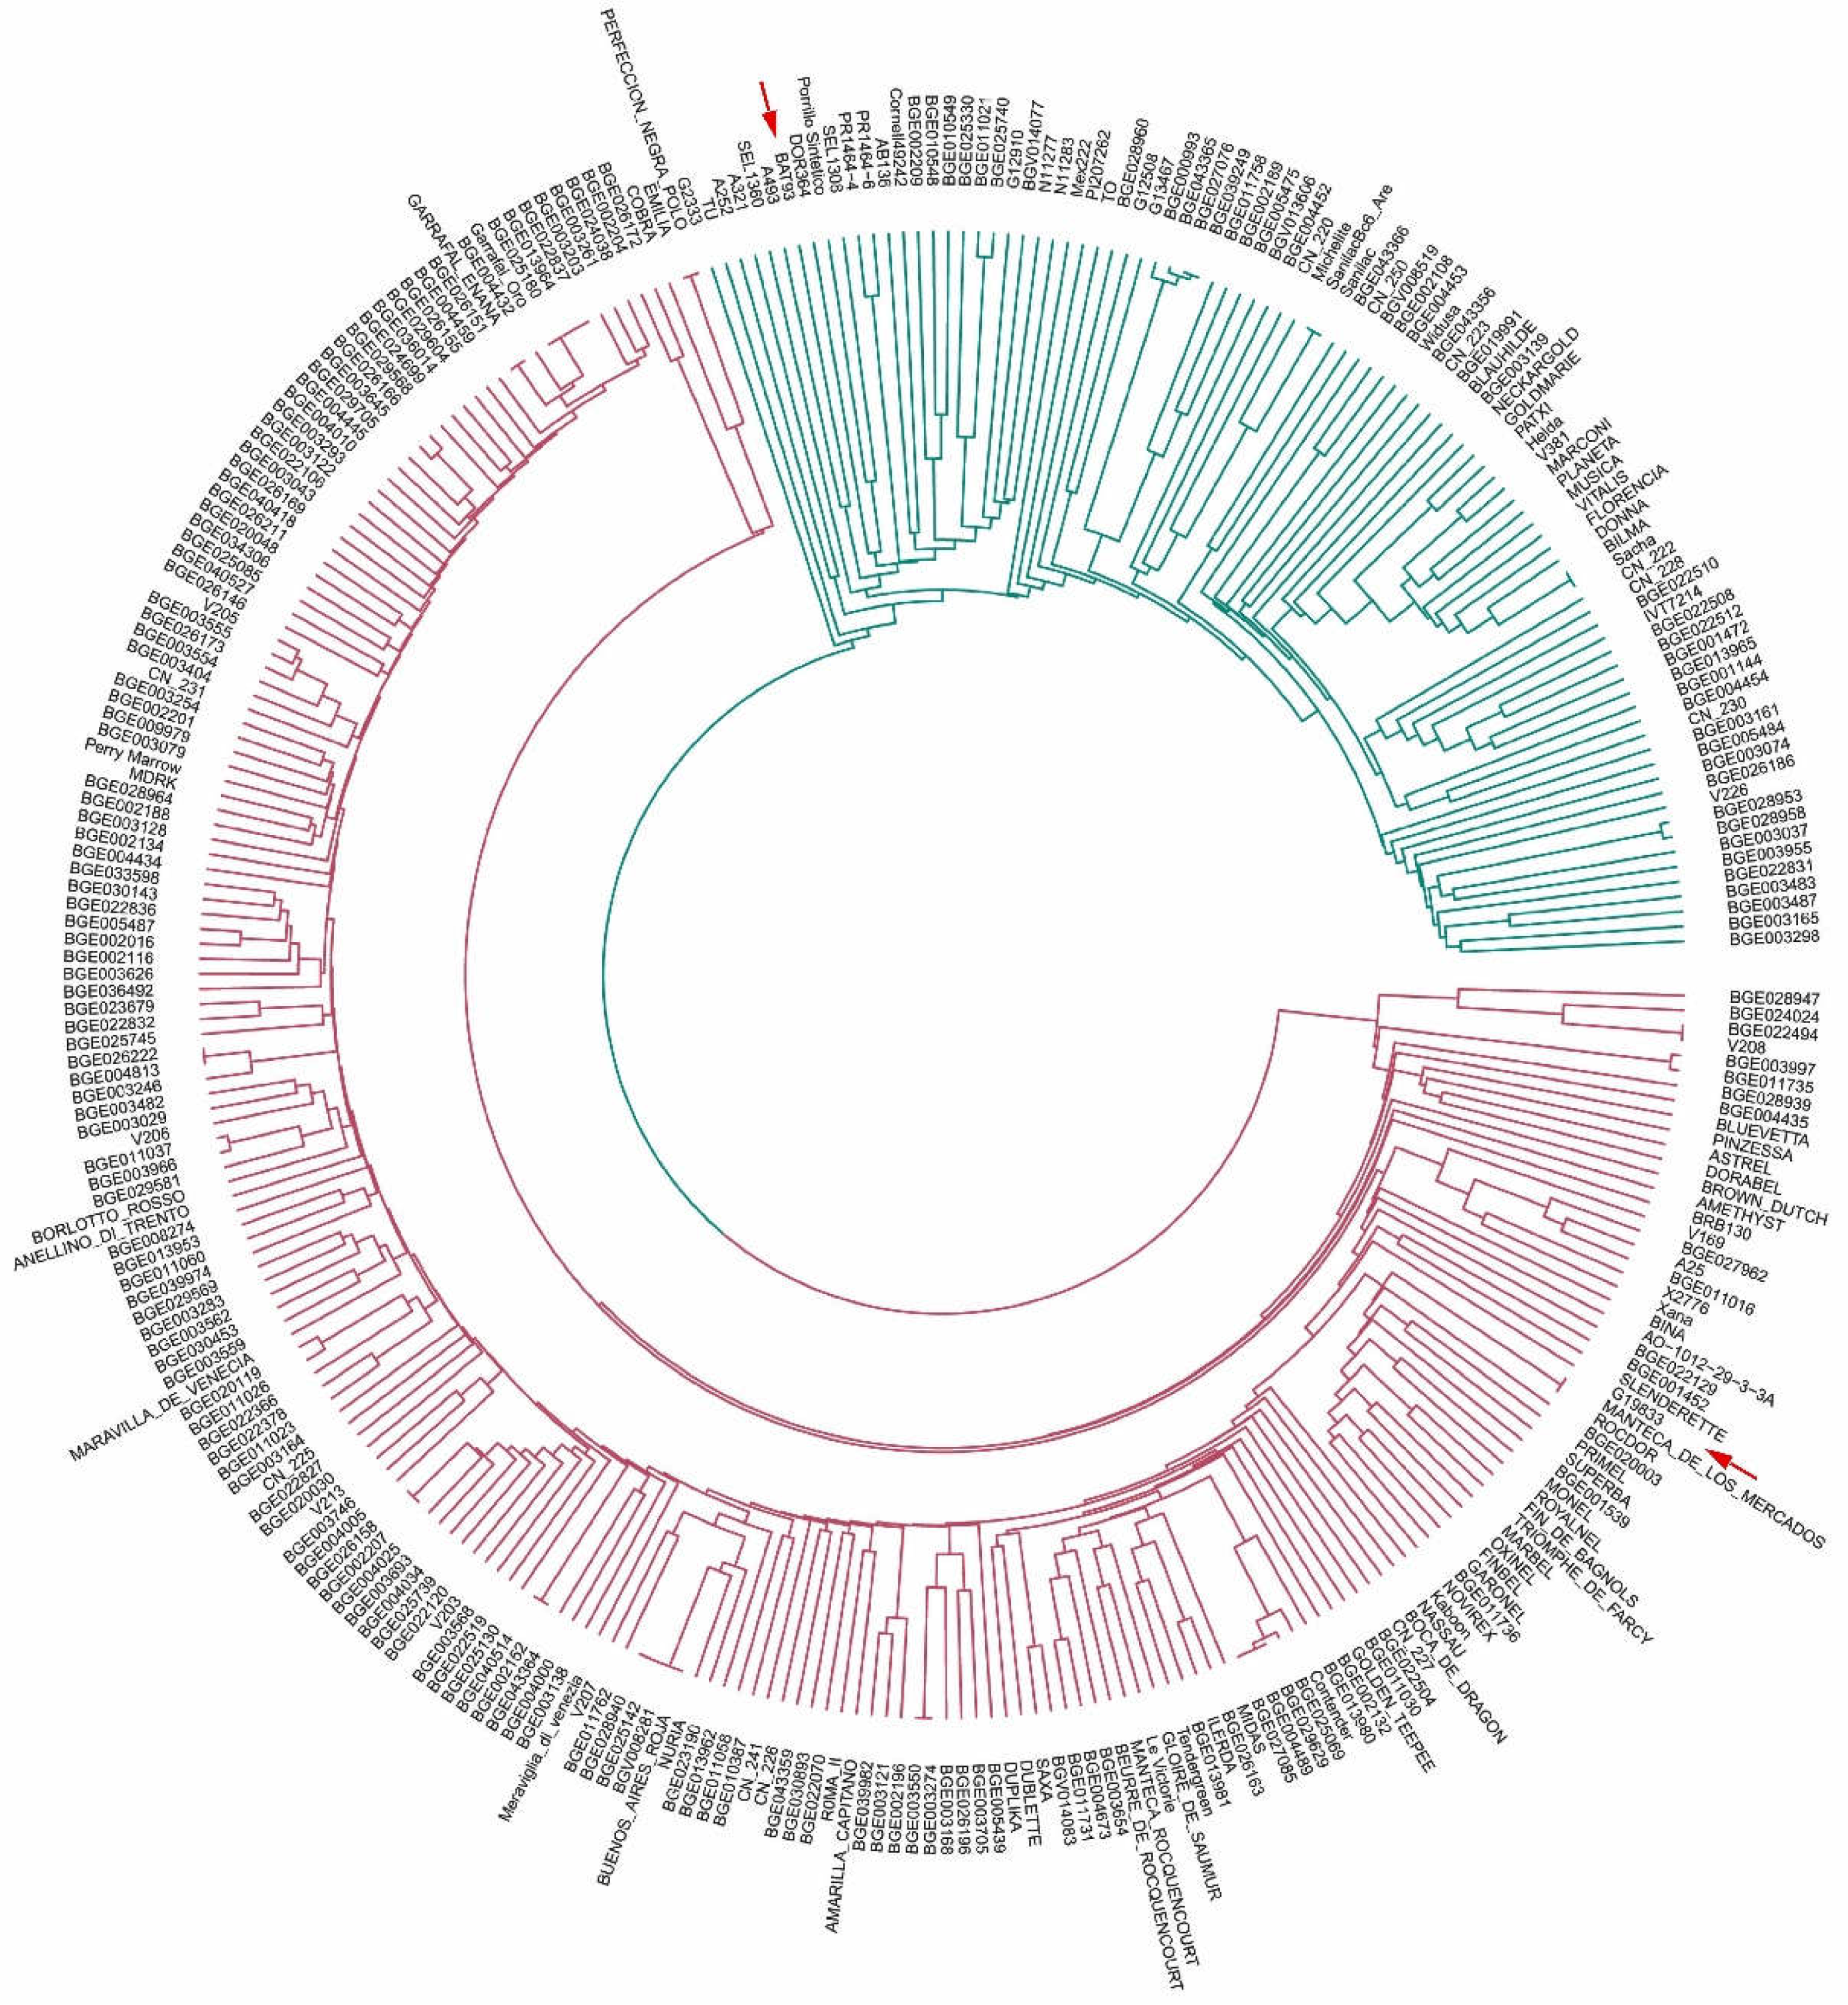
3.4. Unweighted Pair Group Method with Arithmetic Mean Clustering
- (i)
- Lines derived from commercial elite cultivars for snap bean consumption: ‘Perfeccion Negra Polo’ and ‘Emilia’, ‘Manteca de los Mercados’, and ‘Rocdor’;
- (ii)
- lines derived from accessions included in the SCC: BG026222-BGE004813, BGE026158-BGE002207, BGE040514-BGE002152, BGE003550-BGE003274, and BGE029629-BGE004489-BGE027085, BGE022494-V208;
- (iii)
- lines derived from commercial elite cultivars for snap bean consumption were included in the SCC, ‘Garrafal enana’-BGE026151, ‘Garrafal Oro’-BGE025180-BGE013964-BGE022837, and ‘Buenos Aires Roja’-BGE028940-BGE025142-BGV008281.
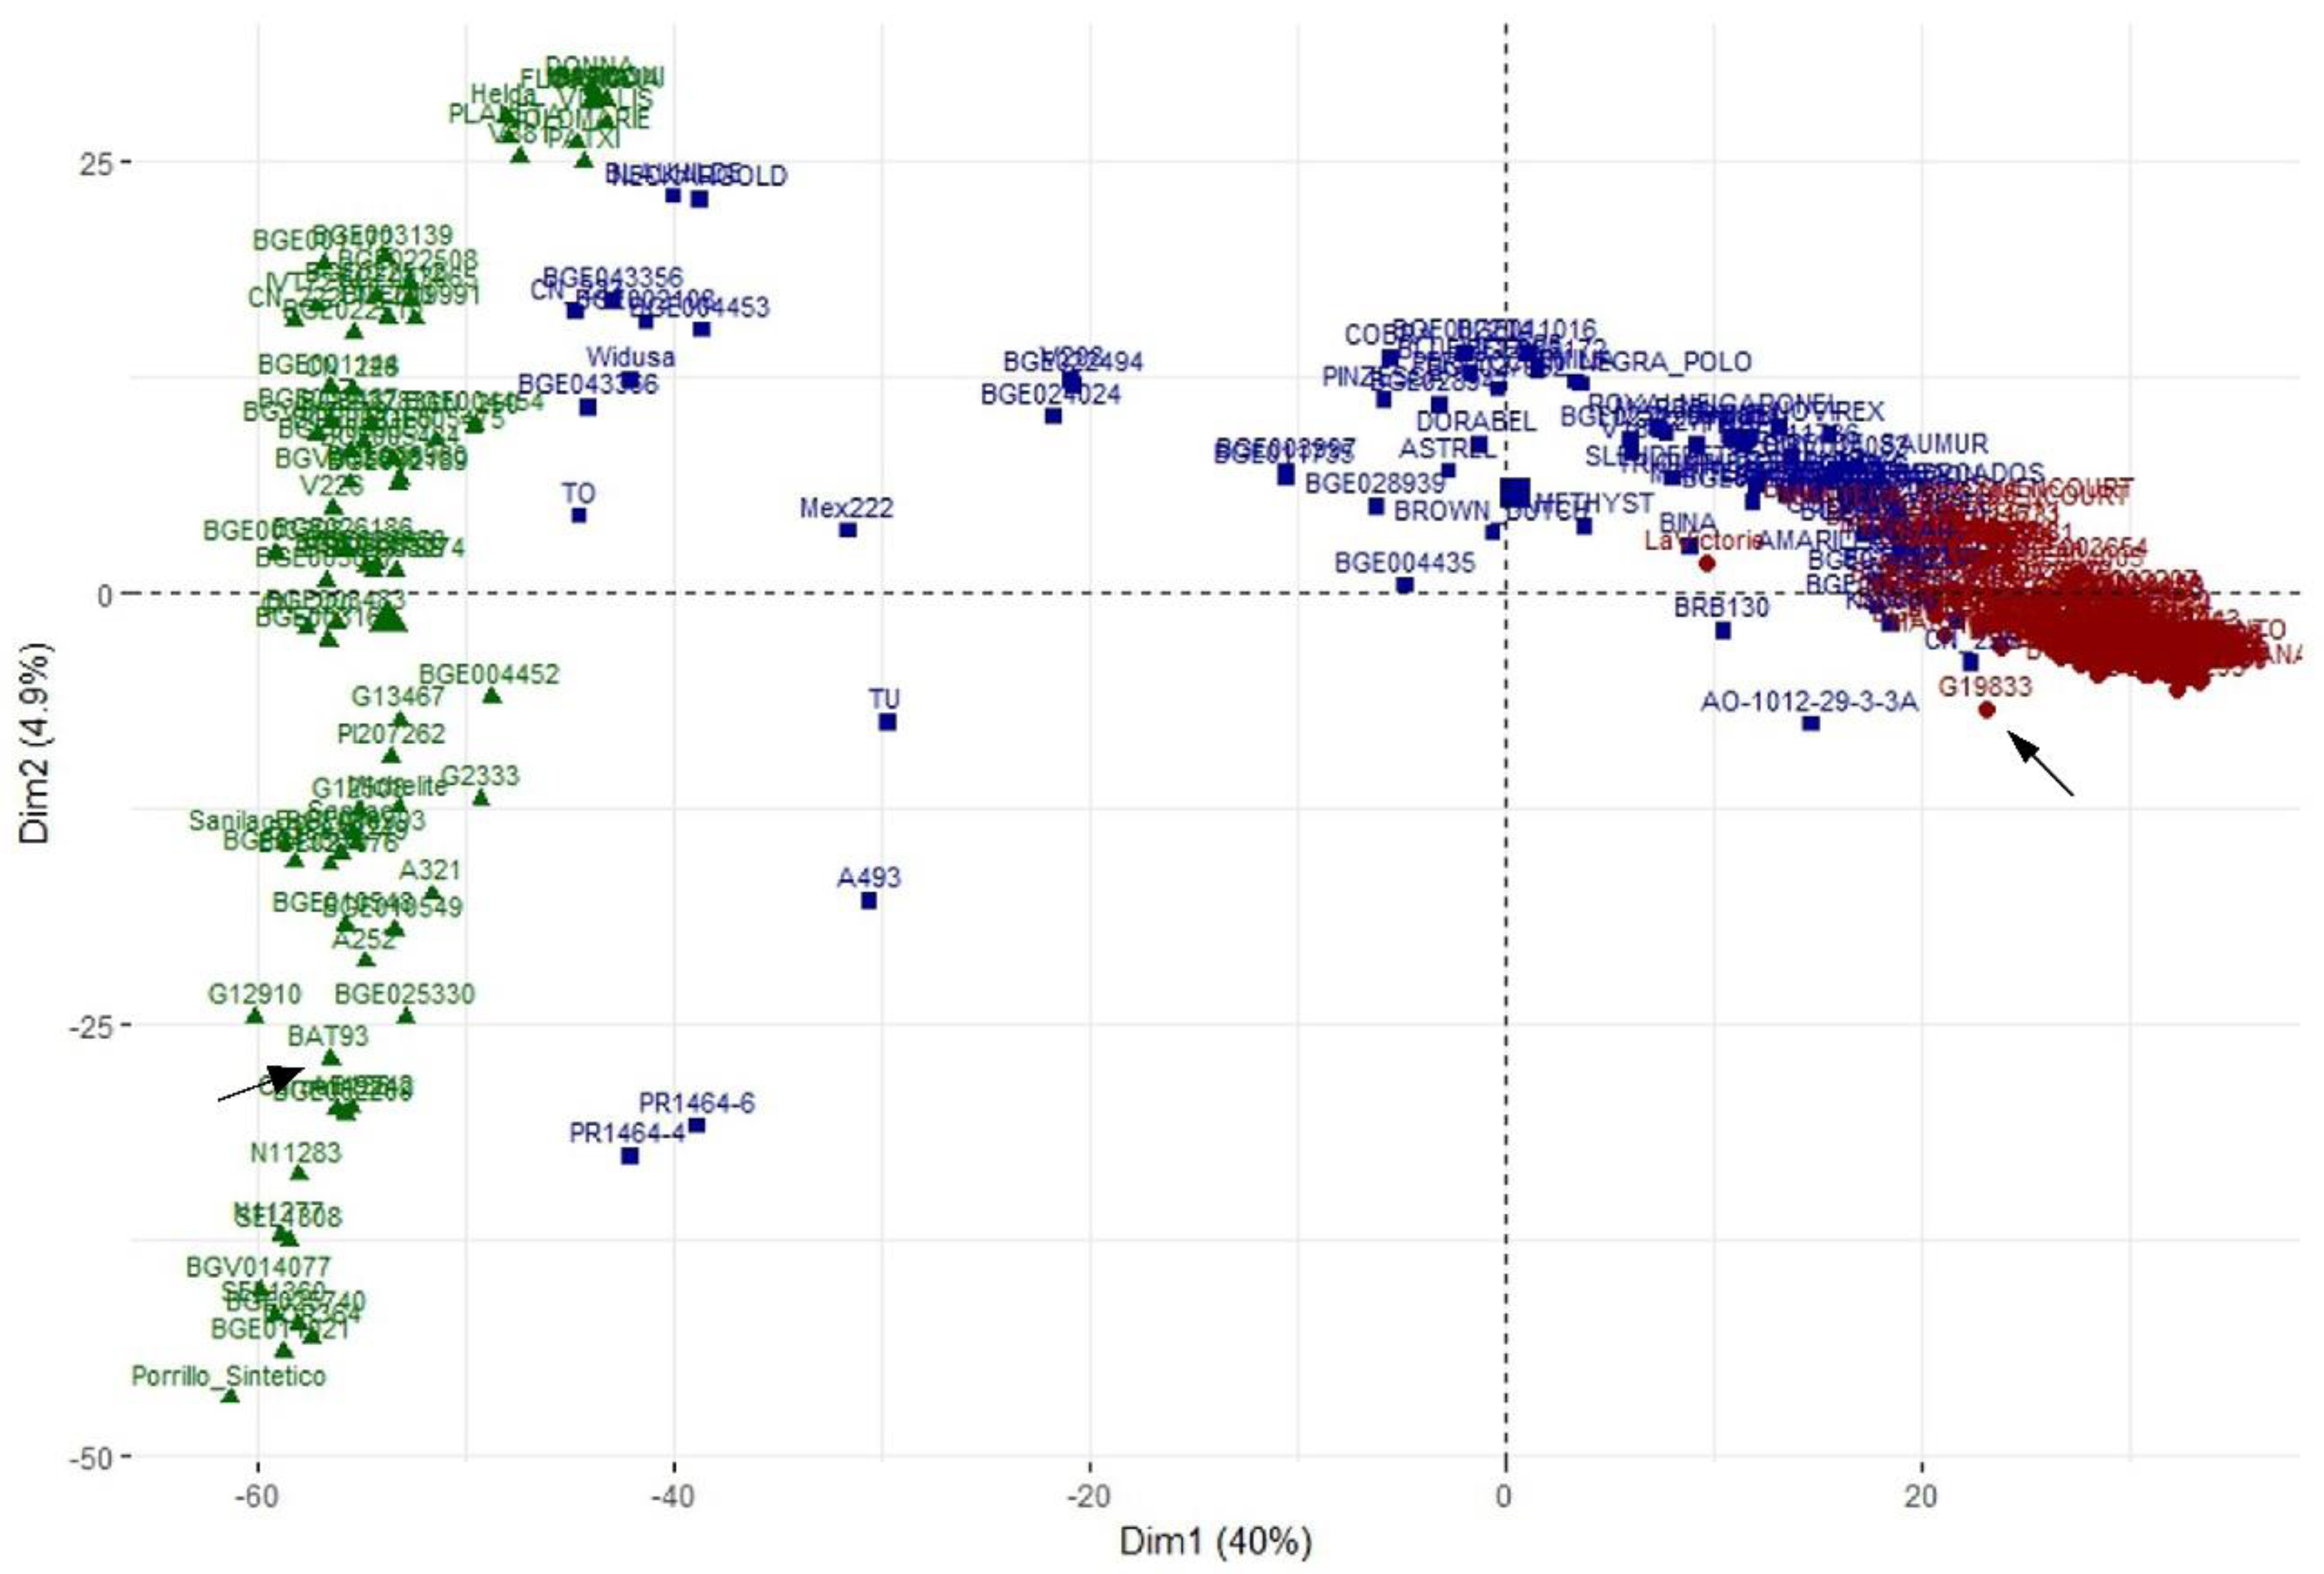
3.5. Principal Component Analysis
3.6. Utility of the Spanish Diversity Panel for Genome-Wide Association Study
4. Discussion
4.1. Genetic Diversity and Origin
4.2. Population Structure
4.3. Linkage Disequilibrium
4.4. Genome-Wide Association Study
5. Conclusions
Supplementary Materials
Author Contributions
Funding
Acknowledgments
Conflicts of Interest
References
- Food and Agriculture Organization of the United Nations. FAOSTAT Statistics Database; FAO: Rome, Italy, 1998. [Google Scholar]
- Toro, O.; Tohme, J.; Debouck, D.G. Wild Bean (Phaseolus vulgaris L.): Description and Distribution; IBPGR and CIAT: Cali, Colombia, 1990; ISBN 958-9183-22-0. [Google Scholar]
- Rossi, M.; Bitocchi, E.; Bellucci, E.; Nanni, L.; Rau, D.; Attene, G.; Papa, R. Linkage disequilibrium and population structure in wild and domesticated populations of Phaseolus vulgaris L. Evol. Appl. 2009, 2, 504–522. [Google Scholar] [CrossRef] [PubMed]
- Bitocchi, E.; Nanni, L.; Belluci, E.; Rossi, M.; Giardini, A.; Zeuli, P.S.; Logozzo, G.; Stougaard, J.; McClean, P.; Attene, G.; et al. Mesoamerican origin of the common bean (Phaseolus vulgaris L.) is revealed by sequence data. Proc. Natl. Acad. Sci USA 2012, 109, 788–796. [Google Scholar] [CrossRef] [PubMed]
- Gepts, P.; Osborne, T.C.; Rashka, K.; Bliss, F.A. Phaseolin protein variability in wild forms and landraces of the common bean (Phaseolus vulgaris L.): Evidence for multiple centers of domestication. Econ. Bot. 1986, 40, 451–468. [Google Scholar] [CrossRef]
- Beebe, S.; Skroch, P.; Tohme, J.; Duque, M.; Pedraza, F.; Nienhuis, J. Structure of genetic diversity among common bean landraces of middle-American origin based on correspondence analysis of RAPD. Crop Sci. 2000, 40, 264–273. [Google Scholar] [CrossRef]
- Papa, R.; Gepts, P. Asymmetry of gene flow and differential geographical structure of molecular diversity in wild and domesticated common bean (Phaseolus vulgaris L.) from Mesoamerica. Theor. Appl. Genet. 2003, 106, 239–250. [Google Scholar] [CrossRef] [PubMed]
- Chacón, S.M.I.; Pickersgill, B.; Debouck, D.G. Domestication patterns in common bean (Phaseolus vulgaris L.) and the origin of the Mesoamerican and Andean cultivated races. Theor. Appl. Genet. 2005, 110, 432–444. [Google Scholar] [CrossRef] [PubMed]
- Papa, R.; Acosta, J.; Delgado-Salinas, A.; Gepts, P. A genome-wide analysis of differentiation between wild and domesticated Phaseolus vulgaris from Mesoamerica. Theor. Appl. Genet. 2005, 111, 1147–1158. [Google Scholar] [CrossRef] [PubMed]
- Kwak, M.; Gepts, P. Structure of genetic diversity in the two major gene pools of common bean (Phaseolus vulgaris L., Fabaceae). Theor. Appl. Genet. 2009, 118, 979–992. [Google Scholar] [CrossRef] [PubMed]
- Mamidi, S.; Rossi, M.; Annam, D.; Moghaddam, S.; Lee, R.; Papa, R.; McClean, P. Investigation of the domestication of common bean (Phaseolus vulgaris) using multilocus sequence data. Funct. Plant. Biol. 2011, 38, 953–967. [Google Scholar] [CrossRef]
- Bitocchi, E.; Belluci, E.; Giardini, A.; Rau, D.; Rodriguez, M.; Biagetti, E.; Santilocchi, R.; Spagnoletti Zeuli, P.; Gioia, T.; Logozzo, G.; et al. Molecular analysis of the parallel domestication of the common bean (Phaseolus vulgaris) in Mesoamerica and the Andes. New Phytol. 2013, 197, 300–313. [Google Scholar] [CrossRef] [PubMed]
- Delgado Salinas, A.O.; Bonet, A.; Gepts, P. The wild relative of Phaseolus vulgaris in Middle America. In Genetic Resources in Phaseolus Beans; Gepts, P., Ed.; Kluwer Academic Publishers: Dordrecht, The Netherlands, 1988; pp. 163–184. ISBN 978-94-010-7753-8. [Google Scholar]
- Debouck, D.G.; Tohme, J. Implications for bean breeders of studies on the origins of common beans. Phaseolus vulgaris L. In Current Topics in Breeding of Common Bean; Working Document No. 47; Beebe, S., Ed.; Centro Internacional de Agricultura Tropical: Cali, Colombia, 1989; pp. 3–42. [Google Scholar]
- Gepts, P.; Debouck, D.G. Origin, domestication and evolution of common bean, Phaseolus vulgaris. In Common Beans: Research for Crop Improvement; Schoonhoven, A., Voysest, O., Eds.; CAB International: Wallingford, UK, 1991; pp. 4–54, ISBN 085198679X, ISBN 9780851986791. [Google Scholar]
- Singh, S.P.; Nodari, R.; Gepts, P. Genetic diversity in cultivated common bean: I. Allozymes. Crop Sci. 1991, 31, 19–23. [Google Scholar] [CrossRef]
- Singh, S.P.; Gepts, P.; Debouck, D.G. Races of common bean (Phaseolus vulgaris, Fabaceae). Econ. Bot. 1991, 45, 379–396. [Google Scholar] [CrossRef]
- Koenig, R.L.; Gepts, P. Allozyme diversity in wild Phaseolus vulgaris: Further evidence for two major centers of genetic diversity. Theor. Appl. Genet. 1989, 78, 809–817. [Google Scholar] [CrossRef] [PubMed]
- Ortwin-Sauer, C. The Early Spanish Man; University of California Press: Berkeley/Los Angeles, CA, USA, 1966; pp. 51–298. ISBN 978-0521088480. [Google Scholar]
- Gepts, P.; Bliss, F.A. Dissemination pathways of common bean (Phaseolus vulgaris, Fabaceae) deduced from phaseolin electrophoretic variability. II Europe and Africa. Econ. Bot. 1988, 42, 86–104. [Google Scholar] [CrossRef]
- Lioi, L. Geographical variation of phaseolin patterns in an Old World collection of Phaseolus vulgaris. Seed Sci. Technol. 1989, 17, 317–324. [Google Scholar]
- Piergiovanni, A.R.; Taranto, G.; Losavio, F.P.; Pignone, D. Common bean (Phaseolus vulgaris L.) landraces from Abruzzo and Lazio regions (Central Italy). Genet. Res. Crop Evol. 2006, 53, 313–322. [Google Scholar] [CrossRef]
- Logozzo, G.; Donnoli, R.; Macaluso, L.; Papa, R.; Knupffer, H.; Spagnoletti Zeuli, P.L. Analysis of the contribution of Mesoamerican and Andean gene pools to European common bean (Phaseolus vulgaris L.) germplasm and strategies to establish a core collection. Genet. Resour. Crop Evol. 2007, 54, 1763–1779. [Google Scholar] [CrossRef]
- Pérez-Vega, E.; Campa, A.; De la Rosa, L.; Giraldez, R.; Ferreira, J.J. Genetic diversity in a core collection established from the main bean Genebank in Spain. Crop Sci. 2009, 49, 1377–1386. [Google Scholar] [CrossRef]
- Angioi, S.A.; Rau, D.; Attene, G.; Nanni, L.; Belluci, E.; Logozzo, G.; Negri, V.; Spagnoletti Zeuli, P.L.; Papa, R. Beans in Europe: Origin and structure of the European landraces of Phaseolus vulgaris L. Theor. Appl. Genet. 2010, 121, 829–843. [Google Scholar] [CrossRef] [PubMed]
- Puerta Romero, J. Variedades de Judías Cultivadas en España; Monogr. Inst. Nacional de Investigación y Tecnología Agraria y Alimentaria, Ministerio de Agricultura: Madrid, Spain, 1961; p. 11. [Google Scholar]
- De la Rosa, L.; Lázaro, A.; Varela, F. Racionalización de la colección española de Phaseolus vulgaris L. In II Seminario de Judía de la Península Ibérica; Asociación Española de Leguminosas: Villaviciosa, Spain, 2000; pp. 55–62. ISBN 84-7847-532-X. [Google Scholar]
- Colección Nuclear de Judías Española. Available online: http://www.crf.inia.es/judias/ (accessed on 1 July 2018).
- Pascual, A.; Campa, A.; Pérez-Vega, E.; Giraldez, R.; Miklas, P.N.; Ferreira, J.J. Screening common bean for resistance to four Sclerotinia sclerotiorum isolates collected in northern Spain. Plant Dis. 2010, 94, 885–890. [Google Scholar] [CrossRef]
- Trabanco, N.; Perez-Vega, E.; Campa, A.; Rubiales, D.; Ferreira, J.J. Genetic resistance to powdery mildew in common bean. Euphytica 2012, 186, 875–882. [Google Scholar] [CrossRef] [Green Version]
- Ferreira, J.J.; Campa, A.; Perez-Vega, E. Variation in the response to ascochyta blight in common bean germplasm. Eur. J. Plant. Pathol. 2016, 146, 977–985. [Google Scholar] [CrossRef]
- Elshire, R.J.; Glaubitz, J.C.; Sun, Q.; Poland, J.A.; Kawamoto, K.; Buckler, E.S.; Mitchell, S.E. A robust, simple genotyping-by-sequencing (GBS) approach for high diversity species. PLoS ONE 2011, 6, e19379. [Google Scholar] [CrossRef] [PubMed]
- Schmutz, J.; McClean, P.E.; Mamidi, S.; Wu, G.A.; Cannon, S.B.; Grimwood, J.; Jenkins, J.; Shu, S.; Song, Q.; Chavarro, C.; et al. A reference genome for common bean and genome-wide analysis of dual domestications. Nat. Genet. 2014, 46, 707–713. [Google Scholar] [CrossRef] [PubMed] [Green Version]
- Hart, J.P.; Griffiths, P.D. Genotyping-by-sequencing enabled mapping and marker development for the By-2 potyvirus resistance allele in common bean. Plant Genome 2015, 8, 1–14. [Google Scholar] [CrossRef]
- Cichy, K.A.; Porch, T.G.; Beaver, J.S.; Cregan, P.; Fourie, D.; Glahn, R.P.; Grusak, M.A.; Kamfwa, K.; Katuutamu, D.N.; McClean, P.; et al. A Phaseolus vulgaris diversity Panel for Andean bean improvement. Crop Sci. 2015, 55, 2149–2160. [Google Scholar] [CrossRef]
- Ariani, A.; Teran, J.C.B.M.; Gepts, P. Genome-wide identification of SNPs and copy number variation in common bean (Phaseolus vulgaris L.) using genotyping-by-sequencing (GBS). Mol. Breed. 2016, 36, 87. [Google Scholar] [CrossRef]
- Ferreira, J.J.; Murube, E.; Campa, A. Introgressed genomic regions in a set of near-isogenic lines of common bean revealed by genotyping-by-sequencing. Plant Genome 2017, 10. [Google Scholar] [CrossRef] [PubMed]
- Katuuramu, D.N.; Hart, J.P.; Porch, T.G.; Grusak, M.A.; Glahn, R.P.; Cichy, K.A. Genome-wide association analysis of nutritional composition-related traits and iron bioavailability in cooked dry beans (Phaseolus vulgaris L.). Mol. Breed. 2018, 38, 44. [Google Scholar] [CrossRef]
- Moghaddam, S.M.; Mamidi, S.; Osorno, J.M.; Lee, R.; Brick, M.; Kelly, J.; Miklas, P.; Urrea, C.; Song, Q.; Cregan, P.; et al. Genome-Wide association study identifies candidate loci underlying agronomic traits in a middle American diversity panel of common bean. Plant Genome 2016, 9, 1–21. [Google Scholar] [CrossRef] [PubMed]
- Korte, A.; Farlow, A. The advantages and limitations of trait analysis with GWAS: A review. Plant Methods 2013, 9, 29. [Google Scholar] [CrossRef] [PubMed]
- Burghardt, L.T.; Young, N.D.; Tiffin, P. A guide to genome-wide association mapping in plants. Curr. Prot. Plant. Biol. 2017, 2, 22–38. [Google Scholar] [CrossRef]
- Vlasova, A.; Capella-Gutiérrez, S.; Rendón-Anaya, M.; Hernández-Oñate, M.; Minoche, A.E.; Erb, I.; Câmara, F.; Prieto-Barja, P.; Corvelo, A.; Sanseverino, W.; et al. Genome and transcriptome analysis of the Mesoamerican common bean and the role of gene duplications in establishing tissue and temporal specialization of genes. Genome Biol. 2016, 17, 32. [Google Scholar] [CrossRef] [PubMed] [Green Version]
- Doyle, J.J.; Doyle, L.H. Isolation of plant DAN frem fresh tissue. Focus 1990, 12, 13–15. [Google Scholar]
- Li, H.; Durbin, R. Fast and accurate short read alignment with Burrows-Wheeler transform. Bioinformatics 2009, 25, 1754–1760. [Google Scholar] [CrossRef] [PubMed] [Green Version]
- Bradbury, P.J.; Zhang, Z.; Kroon, D.E.; Casstevens, T.M.; Ramdoss, Y.; Buckler, E.S. TASSEL: Software for association mapping of complex traits in diverse samples. Bioinformatics 2007, 23, 2633–2635. [Google Scholar] [CrossRef] [PubMed]
- Turner, S.D. qqman: An R Package for Visualizing GWAS Results Using Q-Q and Manhattan Plots. 2014. Available online: https://cran.r-project.org/web/packages/qqman/index.html (accessed on 1 July 2018).
- R Development Core Team. R: A Language and Environment for Statistical Computing; R Foundation for Statistical Computing: Vienna, Austria, 2016; ISBN 3-900051-07-0. Available online: http://www.R-project.org (accessed on 1 July 2018).
- Hill, W.G.; Robertson, A. Linkage disequilibrium in finite populations. Theor. Appl. Genet. 1968, 38, 226–231. [Google Scholar] [CrossRef] [PubMed]
- Pritchard, J.; Stephens, M.; Donnelly, P. Inference of population structure using multilocus genotype data. Genetics 2000, 155, 945–959. [Google Scholar] [PubMed]
- Ramasamy, R.K.; Ramasamy, S.; Bindroo, B.B.; Naik, V.G. STRUCTURE PLOT: A program for drawing elegant STRUCTURE bar plots in user friendly interface. Springeplus 2014, 13, 431. [Google Scholar] [CrossRef] [PubMed]
- Evanno, G.; Regnaut, S.; Goudet, J. Detecting the number of clusters of individuals using the software STRUCTURE: A simulation study. Mol. Ecol. 2005, 14, 2611–2620. [Google Scholar] [CrossRef] [PubMed]
- Lê, S.; Josse, J.; Husson, F. FactoMineR: An R Package for Multivariate. J Stat. Softw. 2008, 25, 1–18. [Google Scholar] [CrossRef]
- Kassambara, A.; Mundt, F. Extract and Visualize the Results of Multivariate Data Analyses, v 1.0.5. 2017. Available online: http://www.sthda.com/english/rpkgs/factoextra (accessed on 1 July 2018).
- Bolser, D.; Staines, D.M.; Pritchard, E.; Kersey, P. Ensembl Plants: Integrating tools for visualizing, mining, and analyzing plant genomics data. Methods Mol. Biol. 2016, 1374, 115–140. [Google Scholar] [CrossRef] [PubMed]
- Huang, D.W.; Sherman, B.T.; Lempicki, R.A. Bioinformatics enrichment tools: Paths toward the comprehensive functional analysis of large gene lists. Nucleic Acids Res. 2009, 37, 1–13. [Google Scholar] [CrossRef] [PubMed]
- Huang, D.W.; Sherman, B.T.; Lempicki, R.A. Systematic and integrative analysis of large gene lists using DAVID Bioinformatics Resources. Nat. Protoc. 2009, 4, 44–57. [Google Scholar] [CrossRef] [PubMed]
- Brodie, A.; Azaria, J.R.; Ofran, Y. How far from the SNP may the causative genes be? Nucleic Acids Res. 2016, 44, 6046–6054. [Google Scholar] [CrossRef] [PubMed] [Green Version]
- Doré, C.; Varoquaux, F. Le haricot: Histoire des varieties cultiveés en France. In Histoire et amélioration de cinquante plantes cultivées; Collection Savoir-Faire; Institut Scientifi que de Recherche Agronomique: Paris, France, 2006; pp. 338–339. [Google Scholar]
- McClean, P.; Terpstra, J.; McConnell, M.; White, C.; Lee, R.; Mamidi, S. Population structure and genetic differentiation among the USDA common bean (Phaseolus vulgaris L.) core collection. Genet. Resour. Crop Evol. 2012, 59, 499–515. [Google Scholar] [CrossRef]
- Mamidi, S.; Rossi, M.; Moghaddam, S.M.; Annam, D.; Lee, R.; Papa, R.; McClean, P. Demographic factors shaped diversity in the two gene pools of wild common bean Phaseolus vulgaris L. Heredity 2013, 110, 267–276. [Google Scholar] [CrossRef] [PubMed]
- Bitocchi, E.; Rau, D.; Belluci, E.; Rodríguez, M.; Murgia, M.L.; Gioia, T.; Santo, D.; Nanni, L.; Attene, G.; Papa, R. Beans (Phaseolus ssp.) as a model for understanding crop evolution. Front. Plant Sci. 2017, 8, 722. [Google Scholar] [CrossRef] [PubMed]
- Myers, J.R.; Baggett, J.R. Improvement of snap bean. In Common Bean Improvement in the Twenty-First Century; Sing, S., Ed.; Springer: Dordrecht, The Netherlands, 1999; Volume 7, pp. 289–329. ISBN 978-90-481-5293-3. [Google Scholar]
- Brown, J.W.S.; McFerson, J.R.; Bliss, F.A.; Hall, T.C. Genetic divergence among commercial classes of Phaseolus vulgaris in relation to phaseolin pattern. HortScience 1982, 17, 752–754. [Google Scholar]
- Blair, W.B.; Chaves, A.; Tofiño, A.; Calderón, J.F.; Palacio, J.D. Extensive diversity and inter-pool introgression in a world-wide collection of indeterminate snap bean accessions. Theor. Appl. Genet. 2010, 120, 1381–1391. [Google Scholar] [CrossRef] [PubMed]
- Smith, A.V.; Thomas, D.J.; Munro, H.M.; Abecasis, G.R. Sequence features in regions of weak and strong linkage disequilibrium. Genome Res. 2005, 15, 1519–1534. [Google Scholar] [CrossRef] [PubMed] [Green Version]
- Kwak, M.; Velasco, D.; Gepts, P. Mapping homologous sequences for determinacy and photoperiod sensitivity in common bean (Phaseolus vulgaris). J. Hered. 2008, 99, 283–291. [Google Scholar] [CrossRef] [PubMed]
- Repinski, S.L.; Kwak, M.; Gepts, P. The common bean growth habit gene PvTFL1y is a functional homolog of Arabidopsis TFL1. Theor. Appl. Genet. 2012, 124, 1539–1547. [Google Scholar] [CrossRef] [PubMed]
- Li, S.; Ding, Y.; Zhang, D.; Wang, X.; Tang, X.; Dai, D.; Jin, H.; Lee, S.H.; Cai, C.; Ma, J. Parallel domestication with a broad mutational spectrum of determinate stem growth habit in leguminous crops. Plant J. 2018. [Google Scholar] [CrossRef] [PubMed]
- Kwak, M.; Toro, O.; Debouck, D.G.; Gepts, P. Multiple origins of the determinate growth habit in domesticated common bean (Phaseolus vulgaris). Ann. Bot. 2012, 110, 1573–1580. [Google Scholar] [CrossRef] [PubMed]


| Group | n | No Polymorphic SNPs | Pairwase LD | ||
|---|---|---|---|---|---|
| Average r2 | %LD | %Significant LD | |||
| Total Panel | 308 | 3099 | 0.18 | 10.11 | 100 |
| Andean | 148 | 2152 | 0.03 | 0.95 | 92.61 |
| Mesoamerican | 78 | 2596 | 0.05 | 0.92 | 90.2 |
| Recombinants | 82 | 2994 | 0.06 | 1.08 | 89.2 |
| Chr Pv01 | Chr Pv02 | Chr Pv03 | Chr Pv04 | Chr Pv05 | Chr Pv06 | Chr Pv07 | Chr Pv08 | Chr Pv09 | Chr Pv10 | Chr Pv11 | ||
|---|---|---|---|---|---|---|---|---|---|---|---|---|
| Chr Pv01 | r2 | 0.3 | ||||||||||
| %LD | 29.4% | |||||||||||
| Chr Pv02 | r2 | 0.15 | 0.18 | |||||||||
| %LD | 4% | 9.30% | ||||||||||
| Chr Pv03 | r2 | 0.23 | 0.15 | 0.24 | ||||||||
| %LD | 18.7% | 3.3% | 20.3% | |||||||||
| Chr Pv04 | r2 | 0.15 | 0.13 | 0.15 | 0.16 | |||||||
| %LD | 6.4% | 3.3% | 5.7% | 10% | ||||||||
| Chr Pv05 | r2 | 0.19 | 0.13 | 0.17 | 0.13 | 0.19 | ||||||
| %LD | 12.3% | 2.7% | 8.2 | 3.1% | 11.7% | |||||||
| Chr Pv06 | r2 | 0.21 | 0.14 | 0.19 | 0.13 | 0.17 | 0.24 | |||||
| %LD | 13.3% | 2% | 10.9% | 3.4% | 6.2% | 16.4% | ||||||
| Chr Pv07 | r2 | 0.2 | 0.14 | 0.19 | 0.14 | 0.15 | 0.18 | 0.21 | ||||
| %LD | 15.5% | 3.1% | 13.4% | 4.5% | 6.7% | 10.3 | 16% | |||||
| Chr Pv08 | r2 | 0.18 | 0.14 | 0.18 | 0.14 | 0.15 | 0.17 | 0.17 | 0.19 | |||
| %LD | 11.7% | 4.10% | 10.1% | 6.4% | 6.5% | 7.50% | 8.7% | 13.1% | ||||
| Chr Pv09 | r2 | 0.26 | 0.18 | 0.24 | 0.17 | 0.19 | 0.22 | 0.24 | 0.21 | 0.35 | ||
| %LD | 24.7% | 6.4% | 21.6% | 6.7% | 10.4% | 16.4% | 21.2% | 14% | 35.4% | |||
| Chr Pv10 | r2 | 0.13 | 0.10 | 0.14 | 0.09 | 0.11 | 0.13 | 0.13 | 0.11 | 0.17 | 0.14 | |
| %LD | 5.5% | 0.9% | 5.9% | 0.01% | 0.02% | 3.5% | 4.8% | 2.2% | 8.4% | 7% | ||
| Chr Pv11 | r2 | 0.22 | 0.15 | 0.20 | 0.15 | 0.17 | 0.18 | 0.19 | 0.18 | 0.24 | 0.13 | 0.25 |
| %LD | 19.4% | 3.8% | 15.1% | 6.2% | 9.5% | 10.6% | 13.7% | 11.7% | 22.1% | 4.2% | 21.4% |
© 2018 by the authors. Licensee MDPI, Basel, Switzerland. This article is an open access article distributed under the terms and conditions of the Creative Commons Attribution (CC BY) license (http://creativecommons.org/licenses/by/4.0/).
Share and Cite
Campa, A.; Murube, E.; Ferreira, J.J. Genetic Diversity, Population Structure, and Linkage Disequilibrium in a Spanish Common Bean Diversity Panel Revealed through Genotyping-by-Sequencing. Genes 2018, 9, 518. https://0-doi-org.brum.beds.ac.uk/10.3390/genes9110518
Campa A, Murube E, Ferreira JJ. Genetic Diversity, Population Structure, and Linkage Disequilibrium in a Spanish Common Bean Diversity Panel Revealed through Genotyping-by-Sequencing. Genes. 2018; 9(11):518. https://0-doi-org.brum.beds.ac.uk/10.3390/genes9110518
Chicago/Turabian StyleCampa, Ana, Ester Murube, and Juan José Ferreira. 2018. "Genetic Diversity, Population Structure, and Linkage Disequilibrium in a Spanish Common Bean Diversity Panel Revealed through Genotyping-by-Sequencing" Genes 9, no. 11: 518. https://0-doi-org.brum.beds.ac.uk/10.3390/genes9110518