
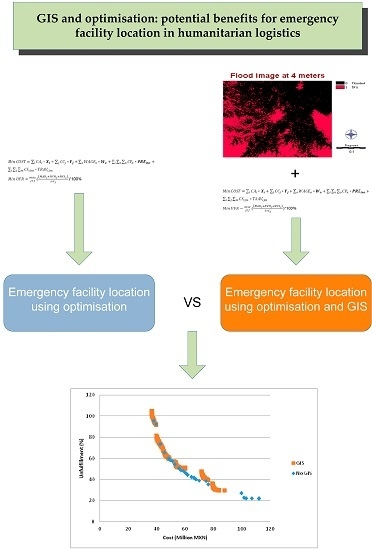
GIS and Optimisation: Potential Benefits for Emergency Facility Location in Humanitarian Logistics


Abstract
:
1. Introduction
2. Literature Review
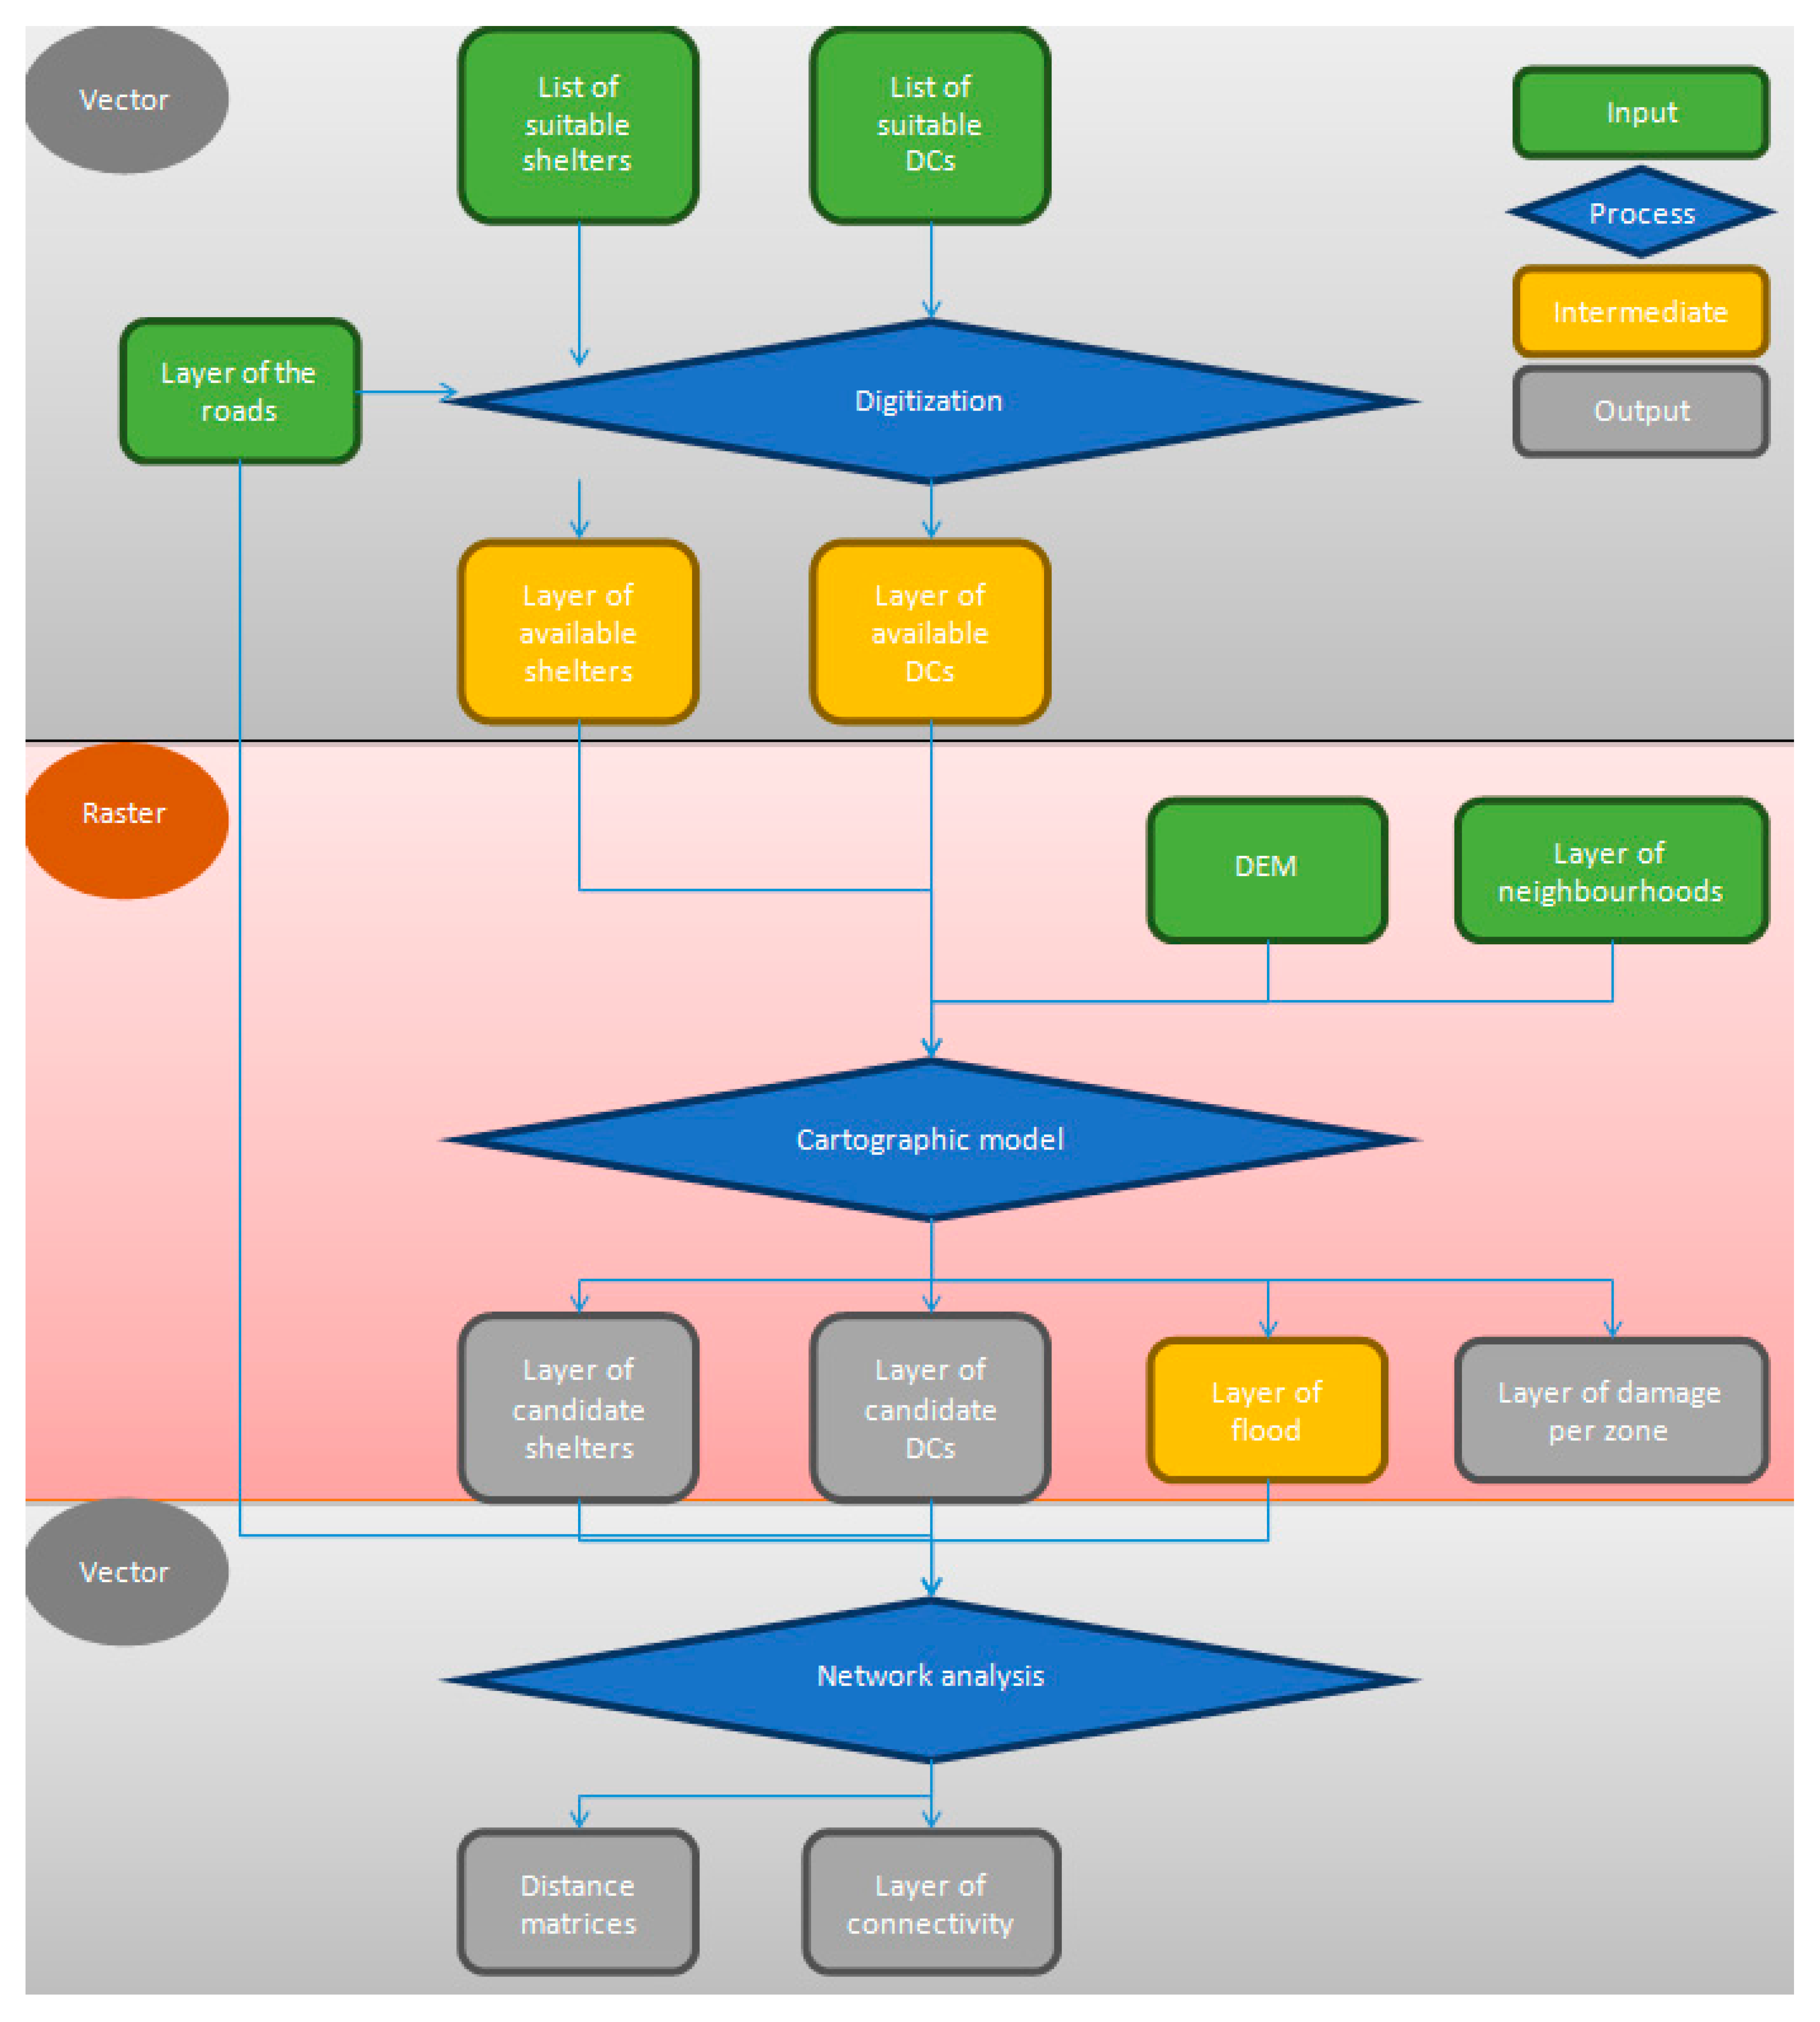
3. Geographical Procedure
3.1. Identification of Suitable Facilities
3.1.1. Shelter Standards
3.1.2. Standards for Distribution Centres
3.2. Digitization
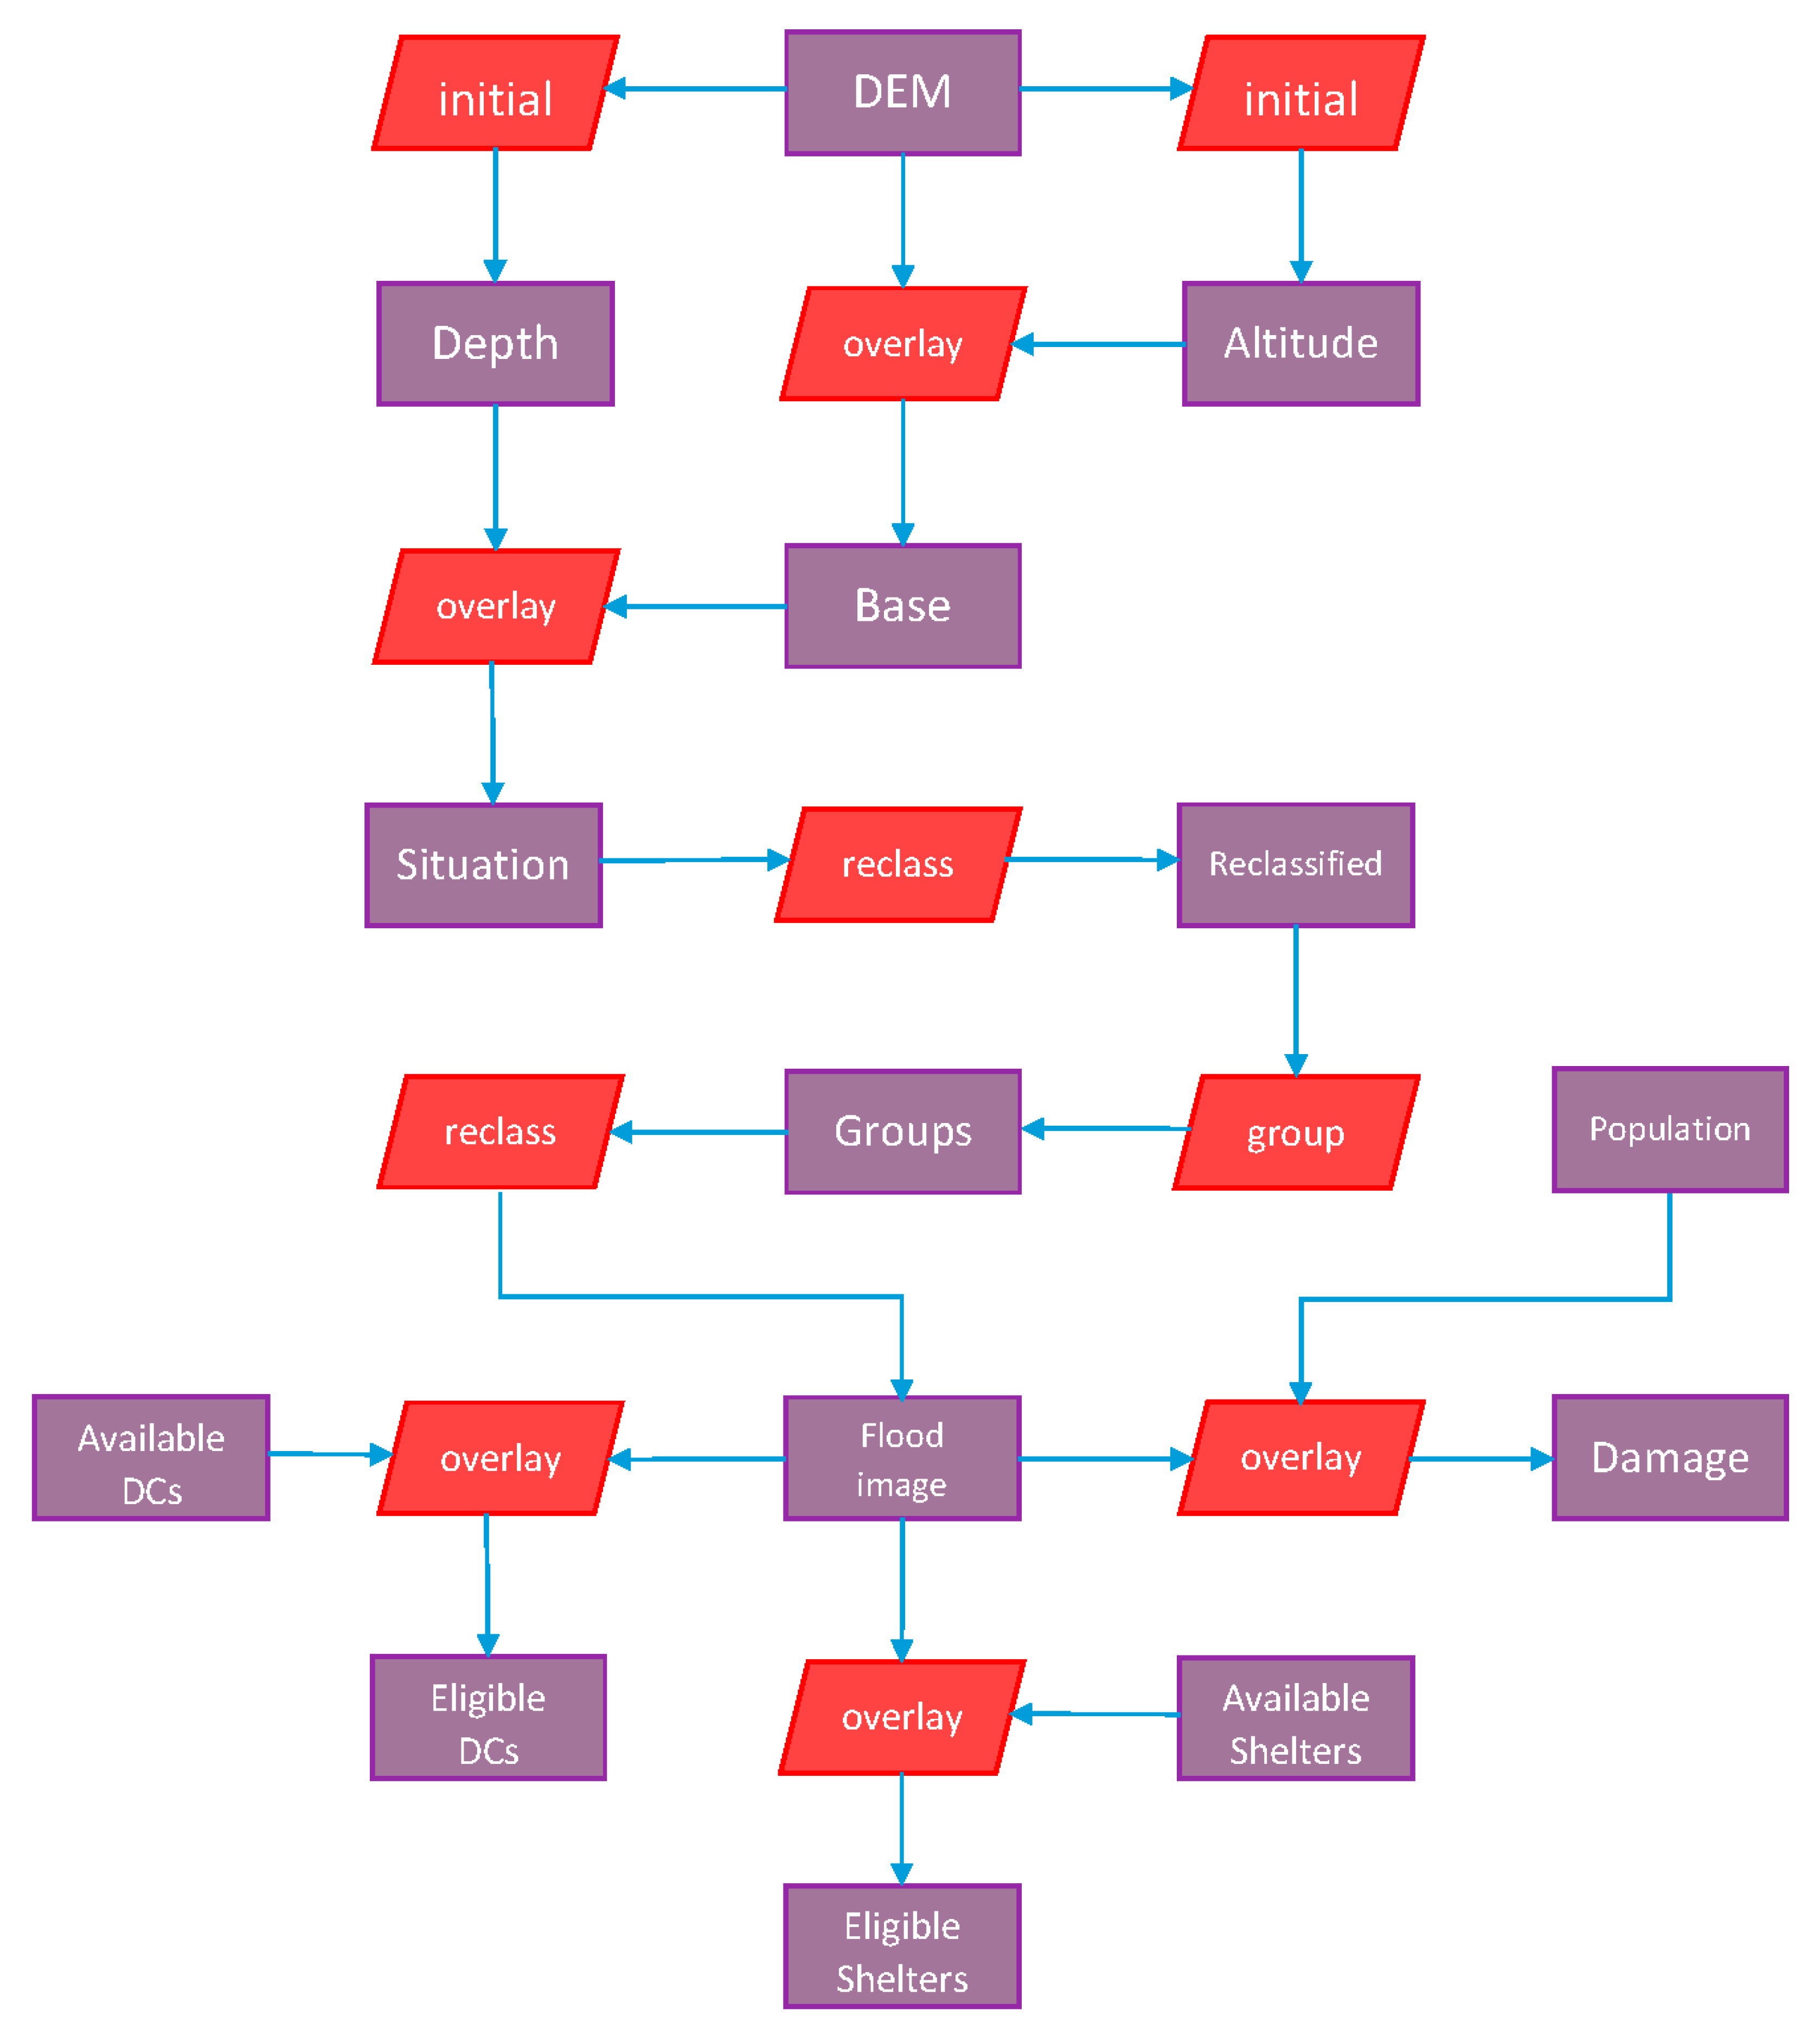
3.3. Cartographic Model
3.3.1. Data Pre-Processing
- The layer of available DCs, obtained from authorities or elaborated by the analyst.
- The layer of available shelters, obtained from authorities or elaborated by the analyst.
- The DEM of the area under study, obtained from online sources or from authorities.
- The demand unit of the region (e.g., neighbourhoods) obtained from authorities.
3.3.2. Macro on IDRISI®
3.4. Network Analysis
4. Case Studies
- The events are two of the most notable floods lived in the country over the last 15 years, providing extreme conditions for the analysis.
- The characteristics among cases vary considerably in terms of damage, duration and number of people affected.
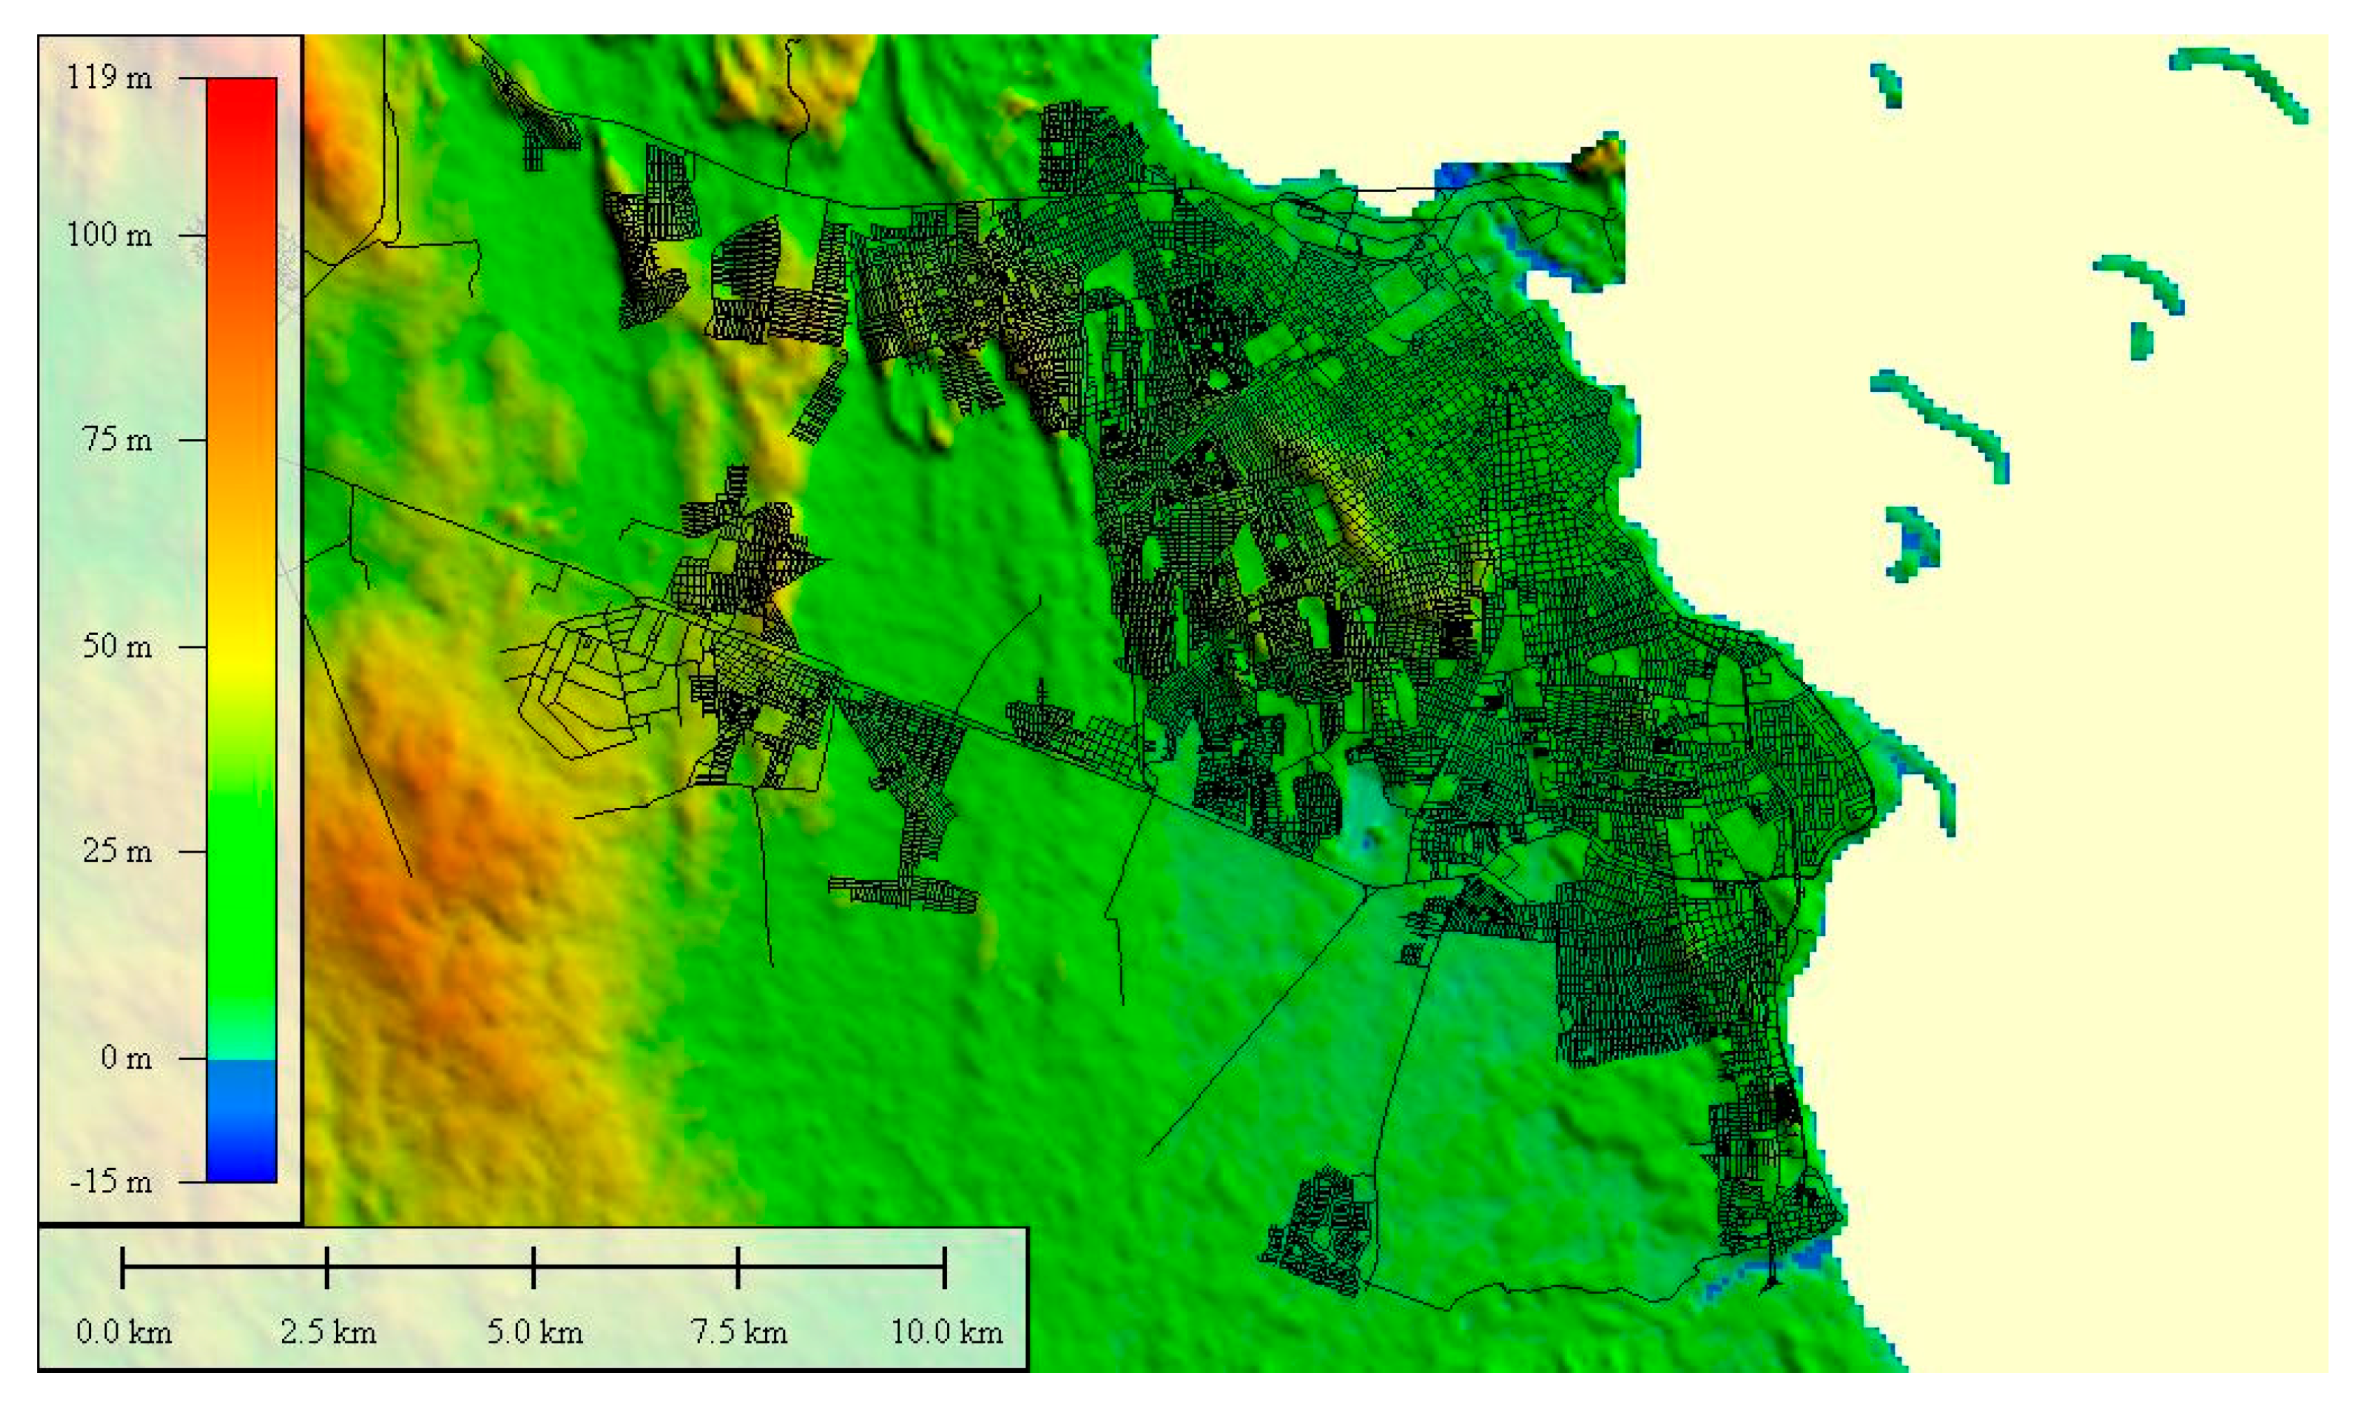
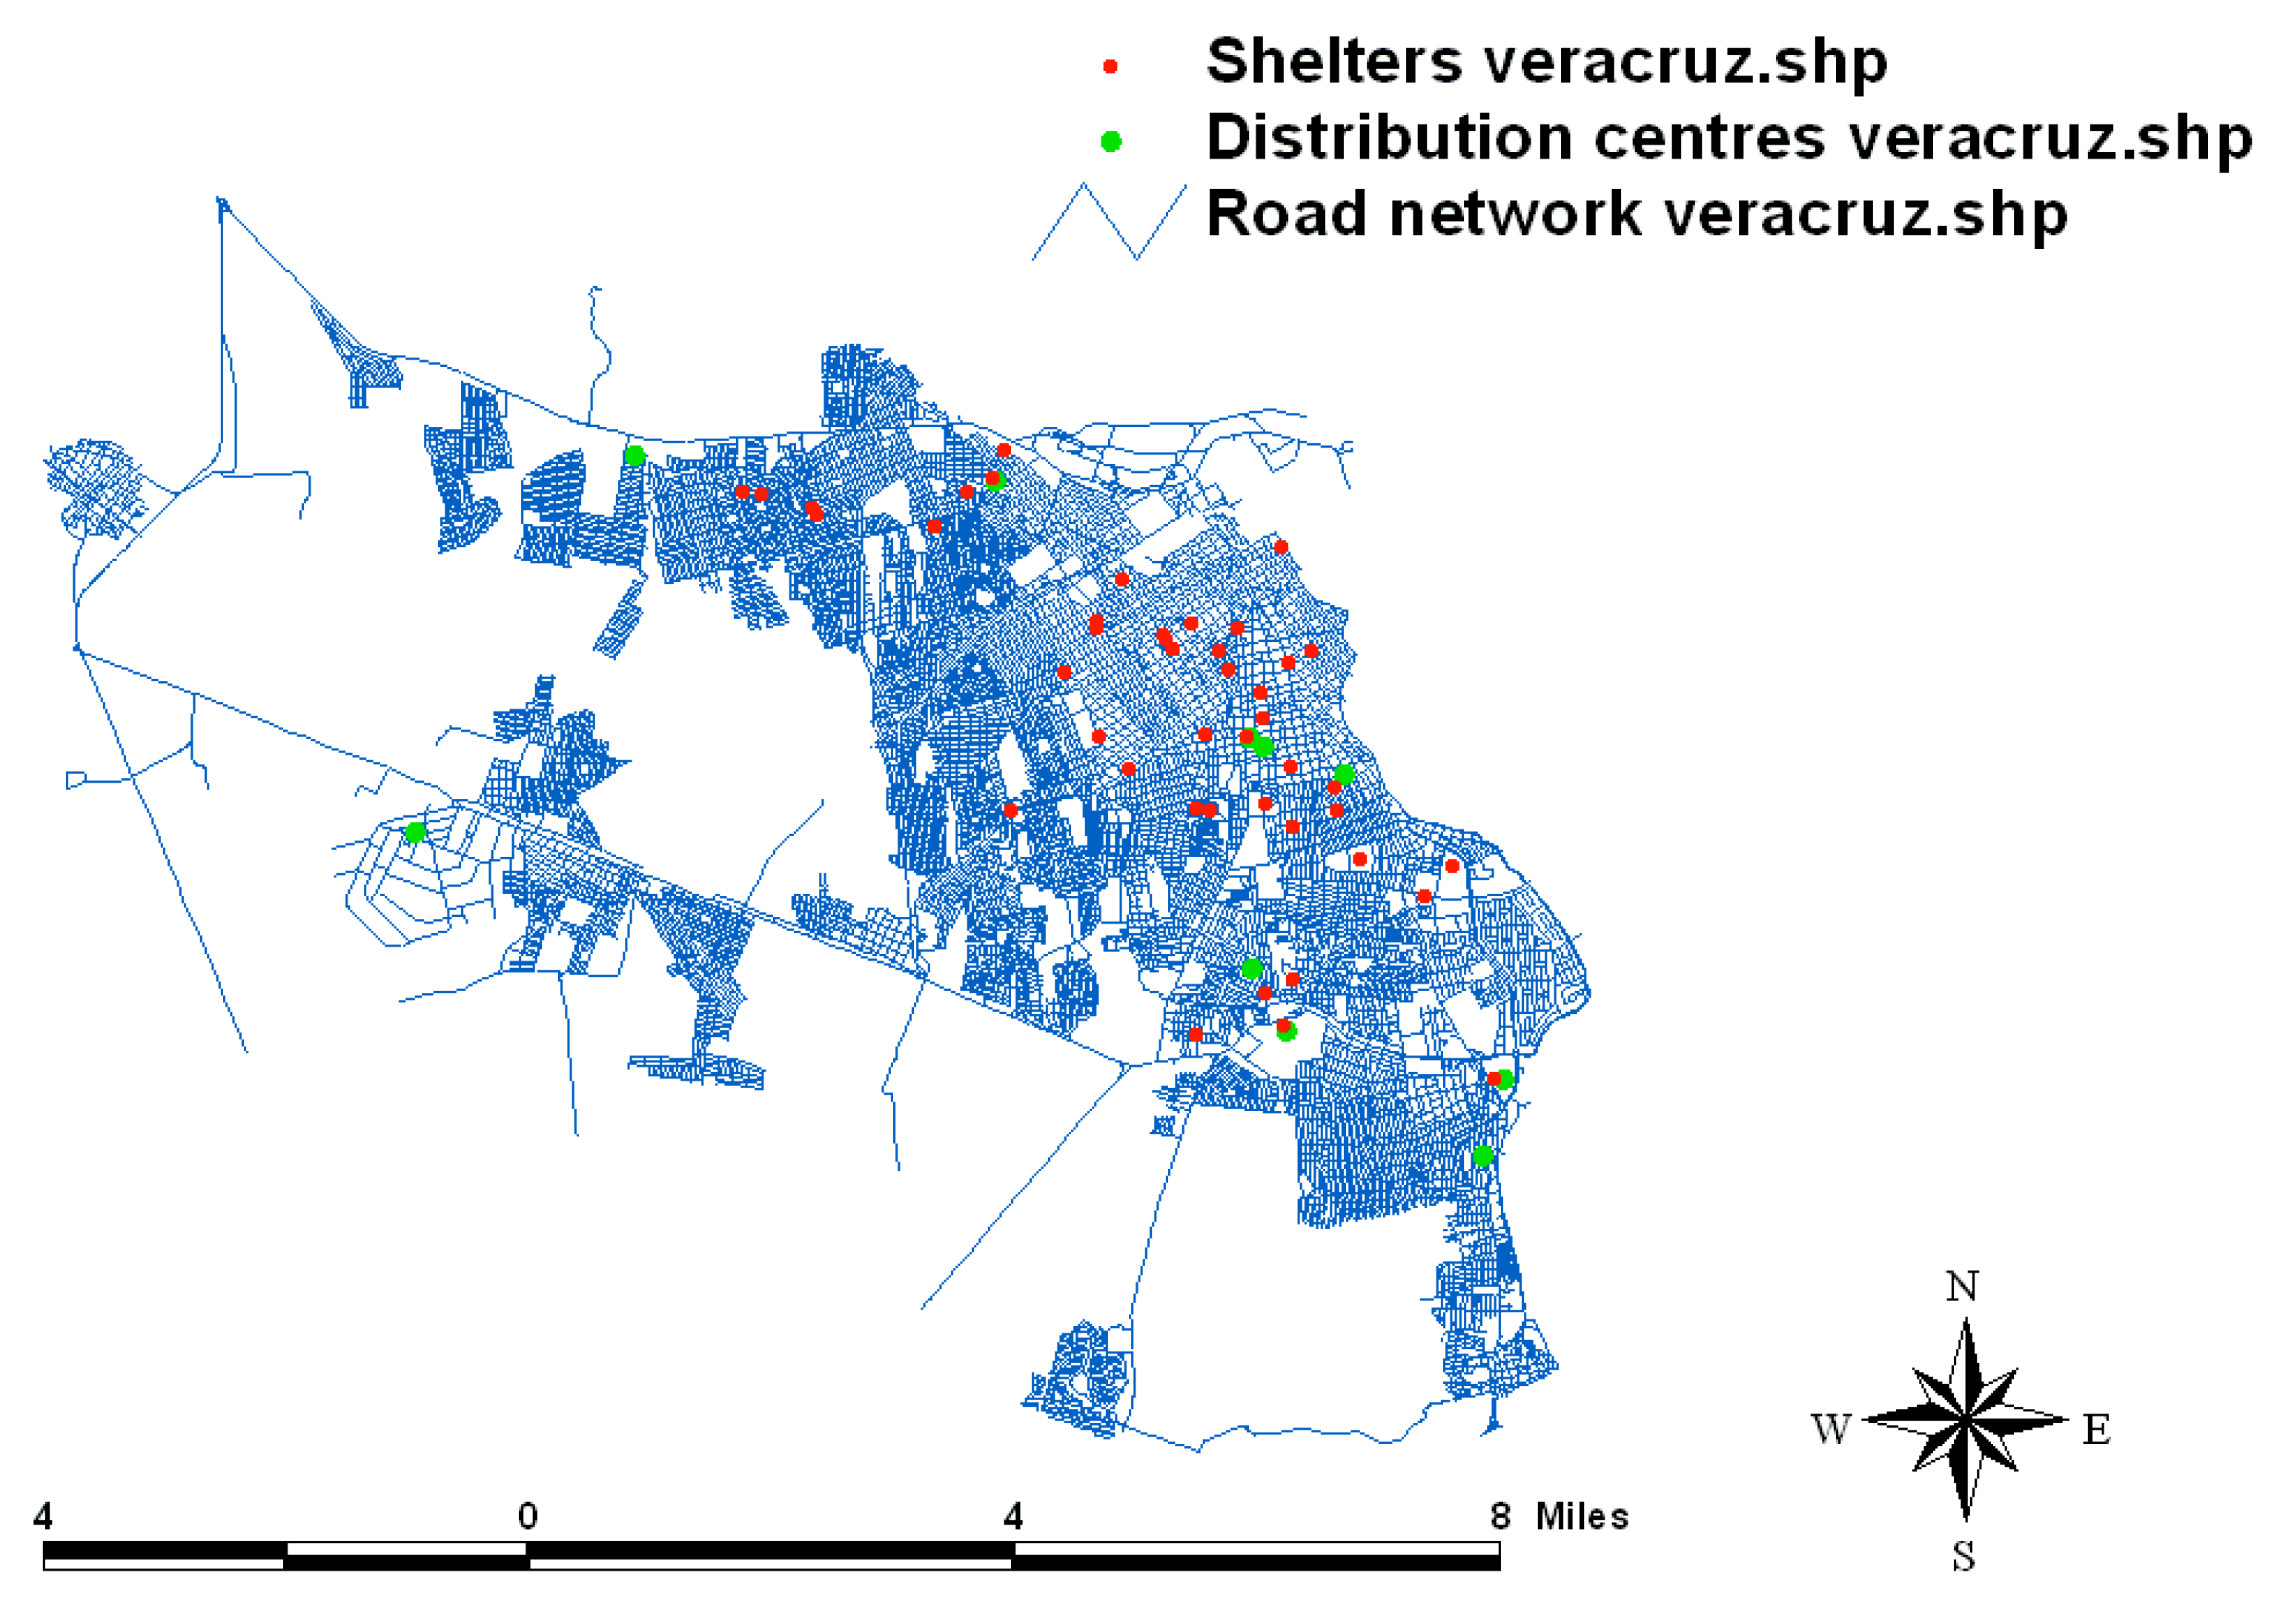
4.1. Veracruz, Mexico
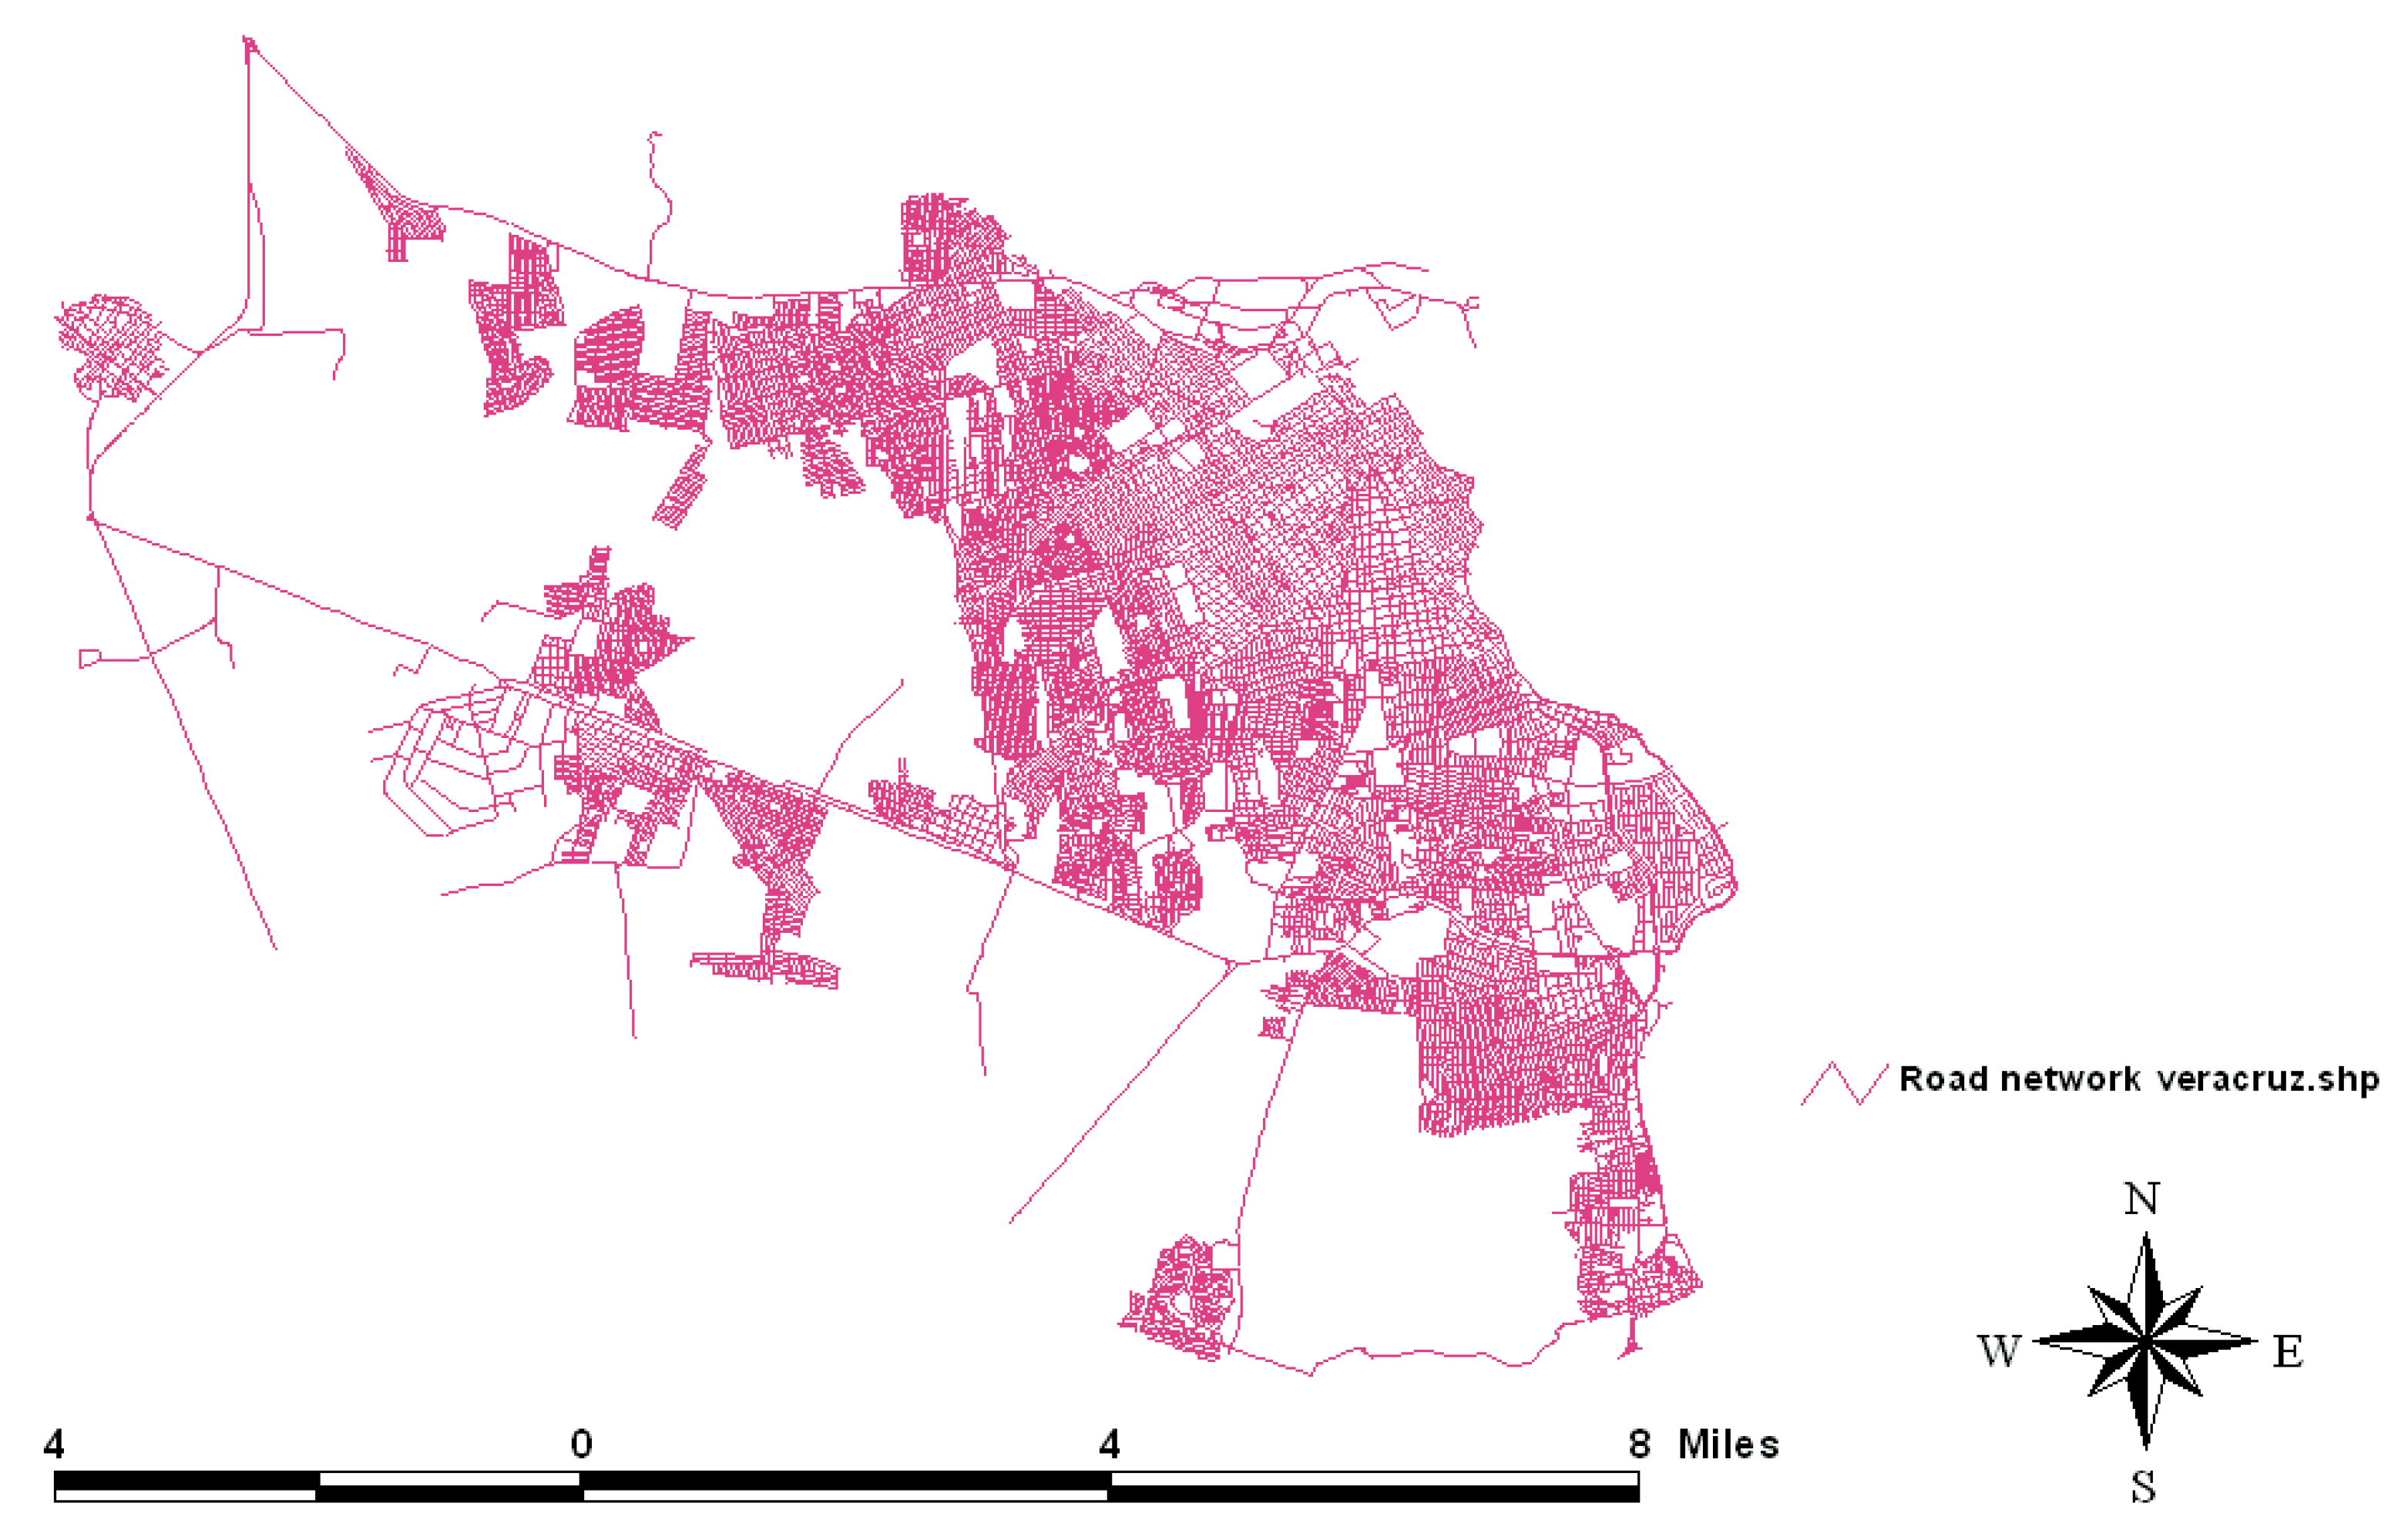
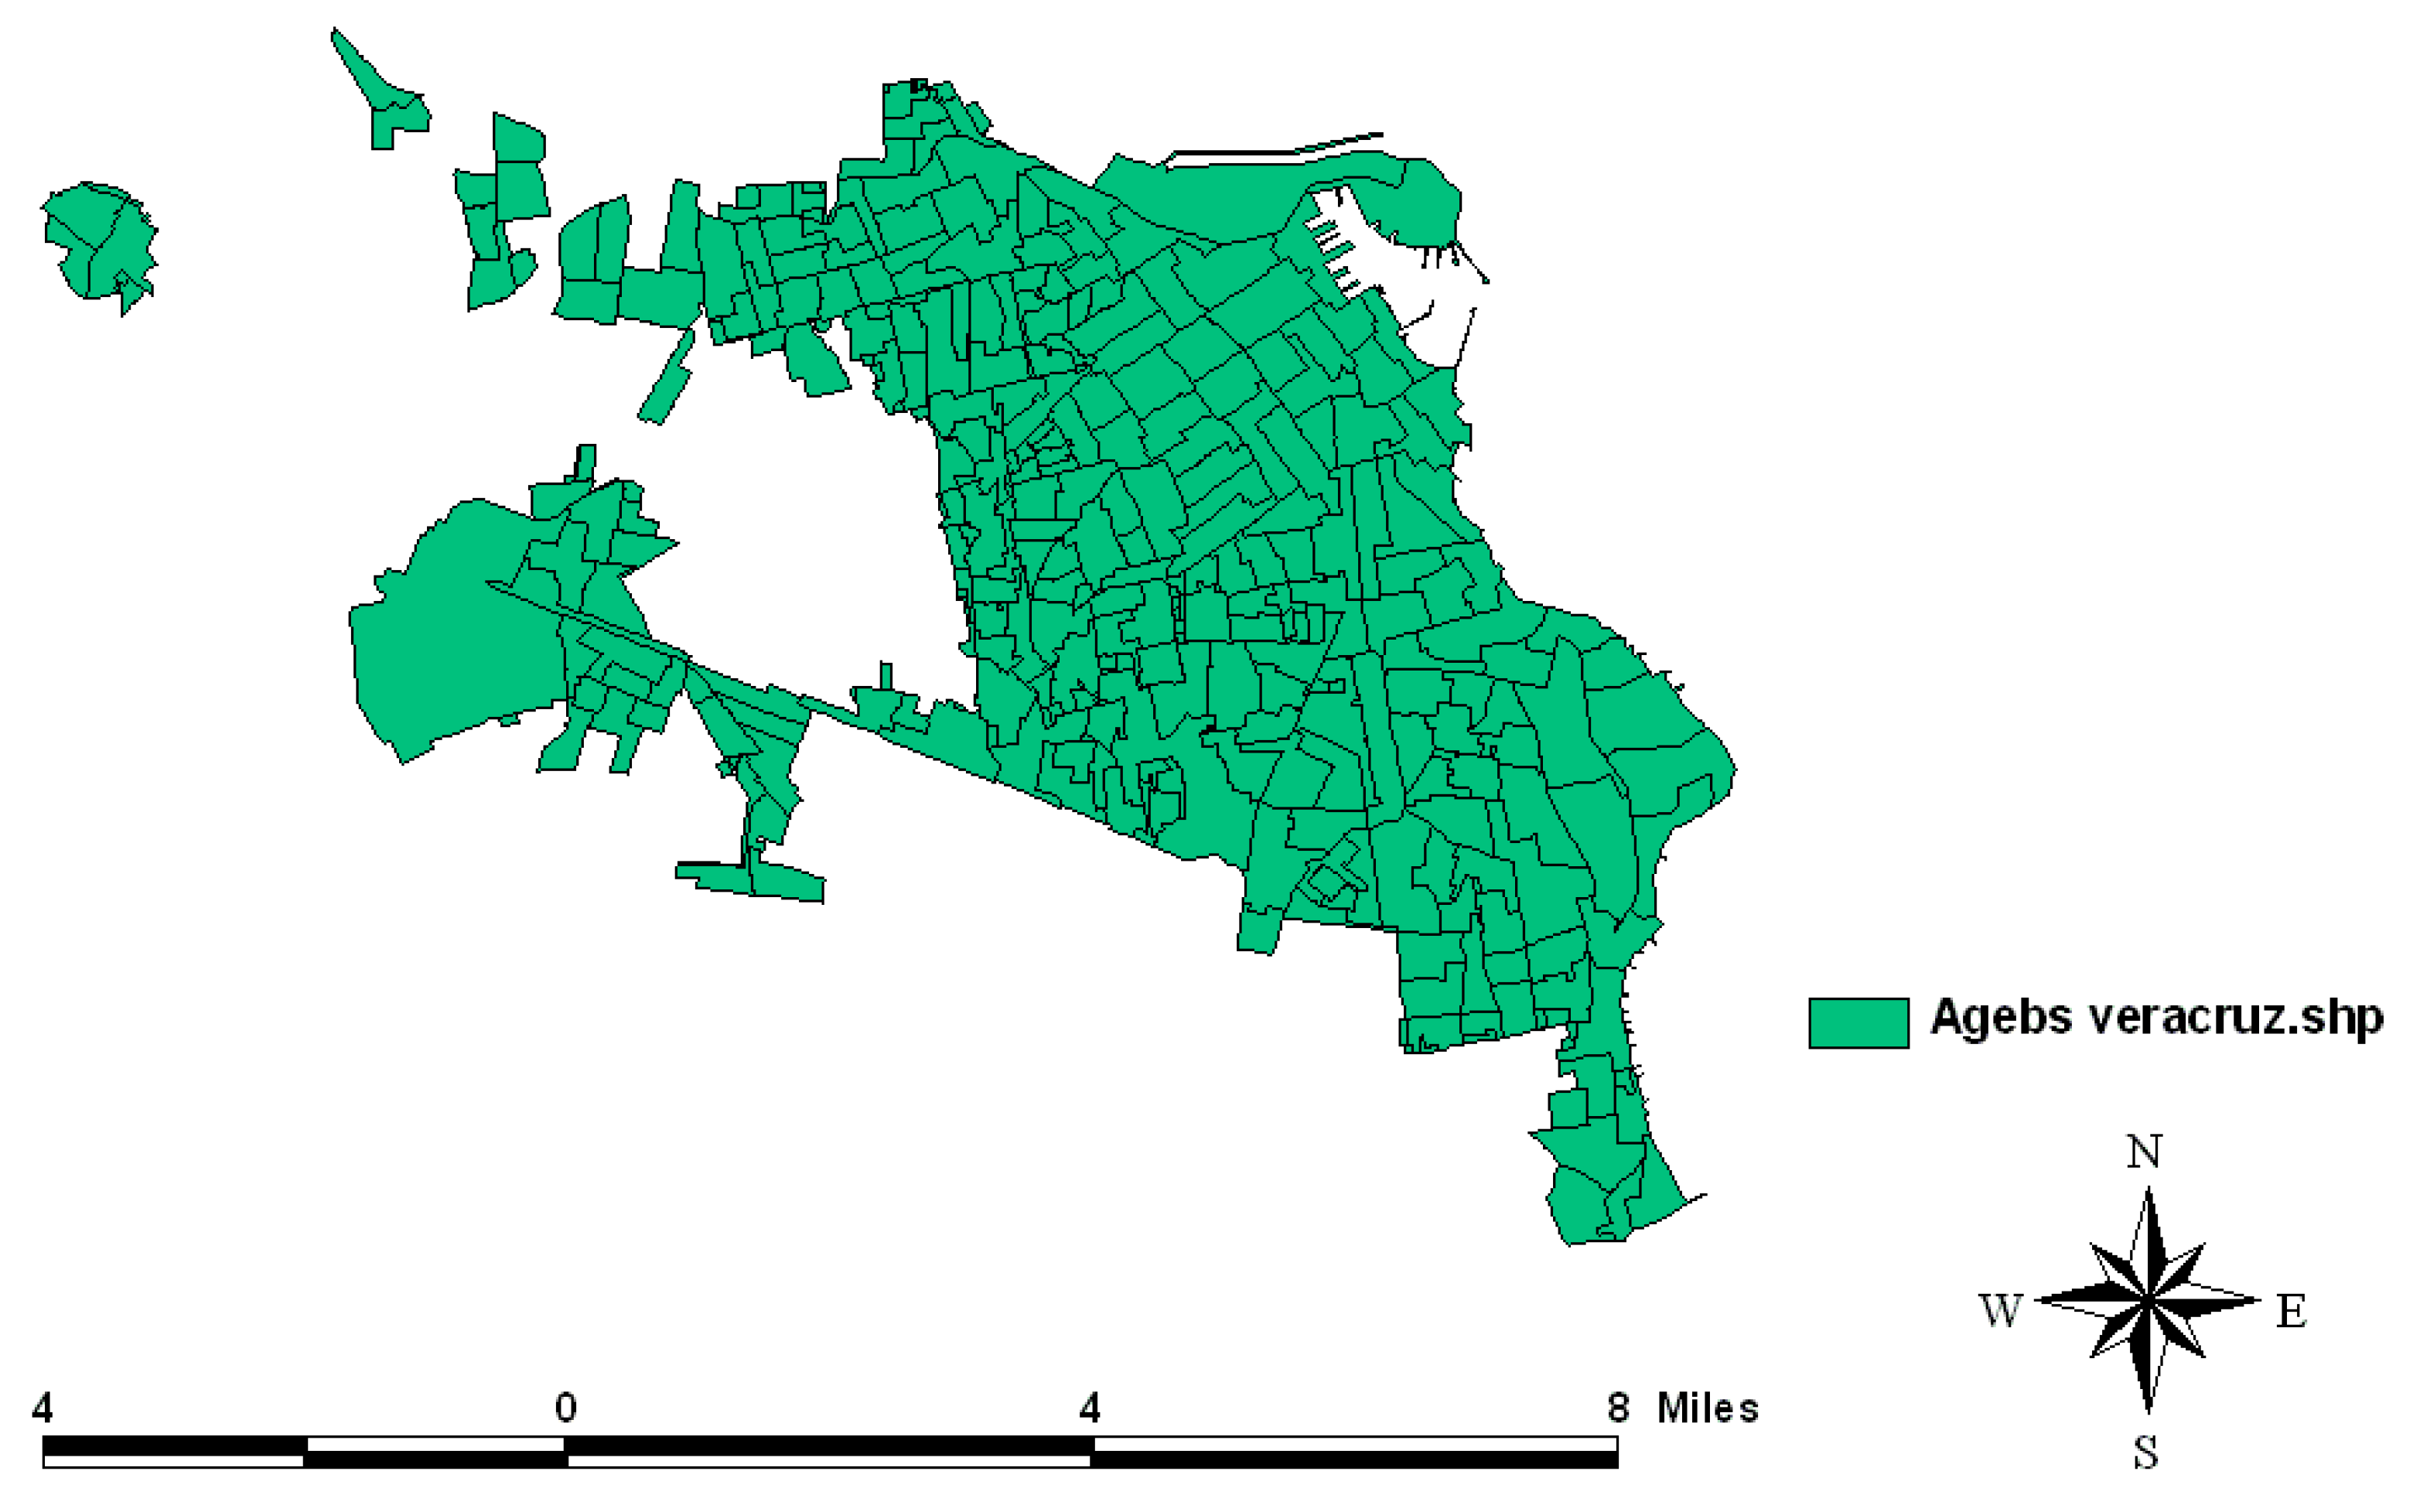
4.1.1. Layers Used for the Case of Veracruz
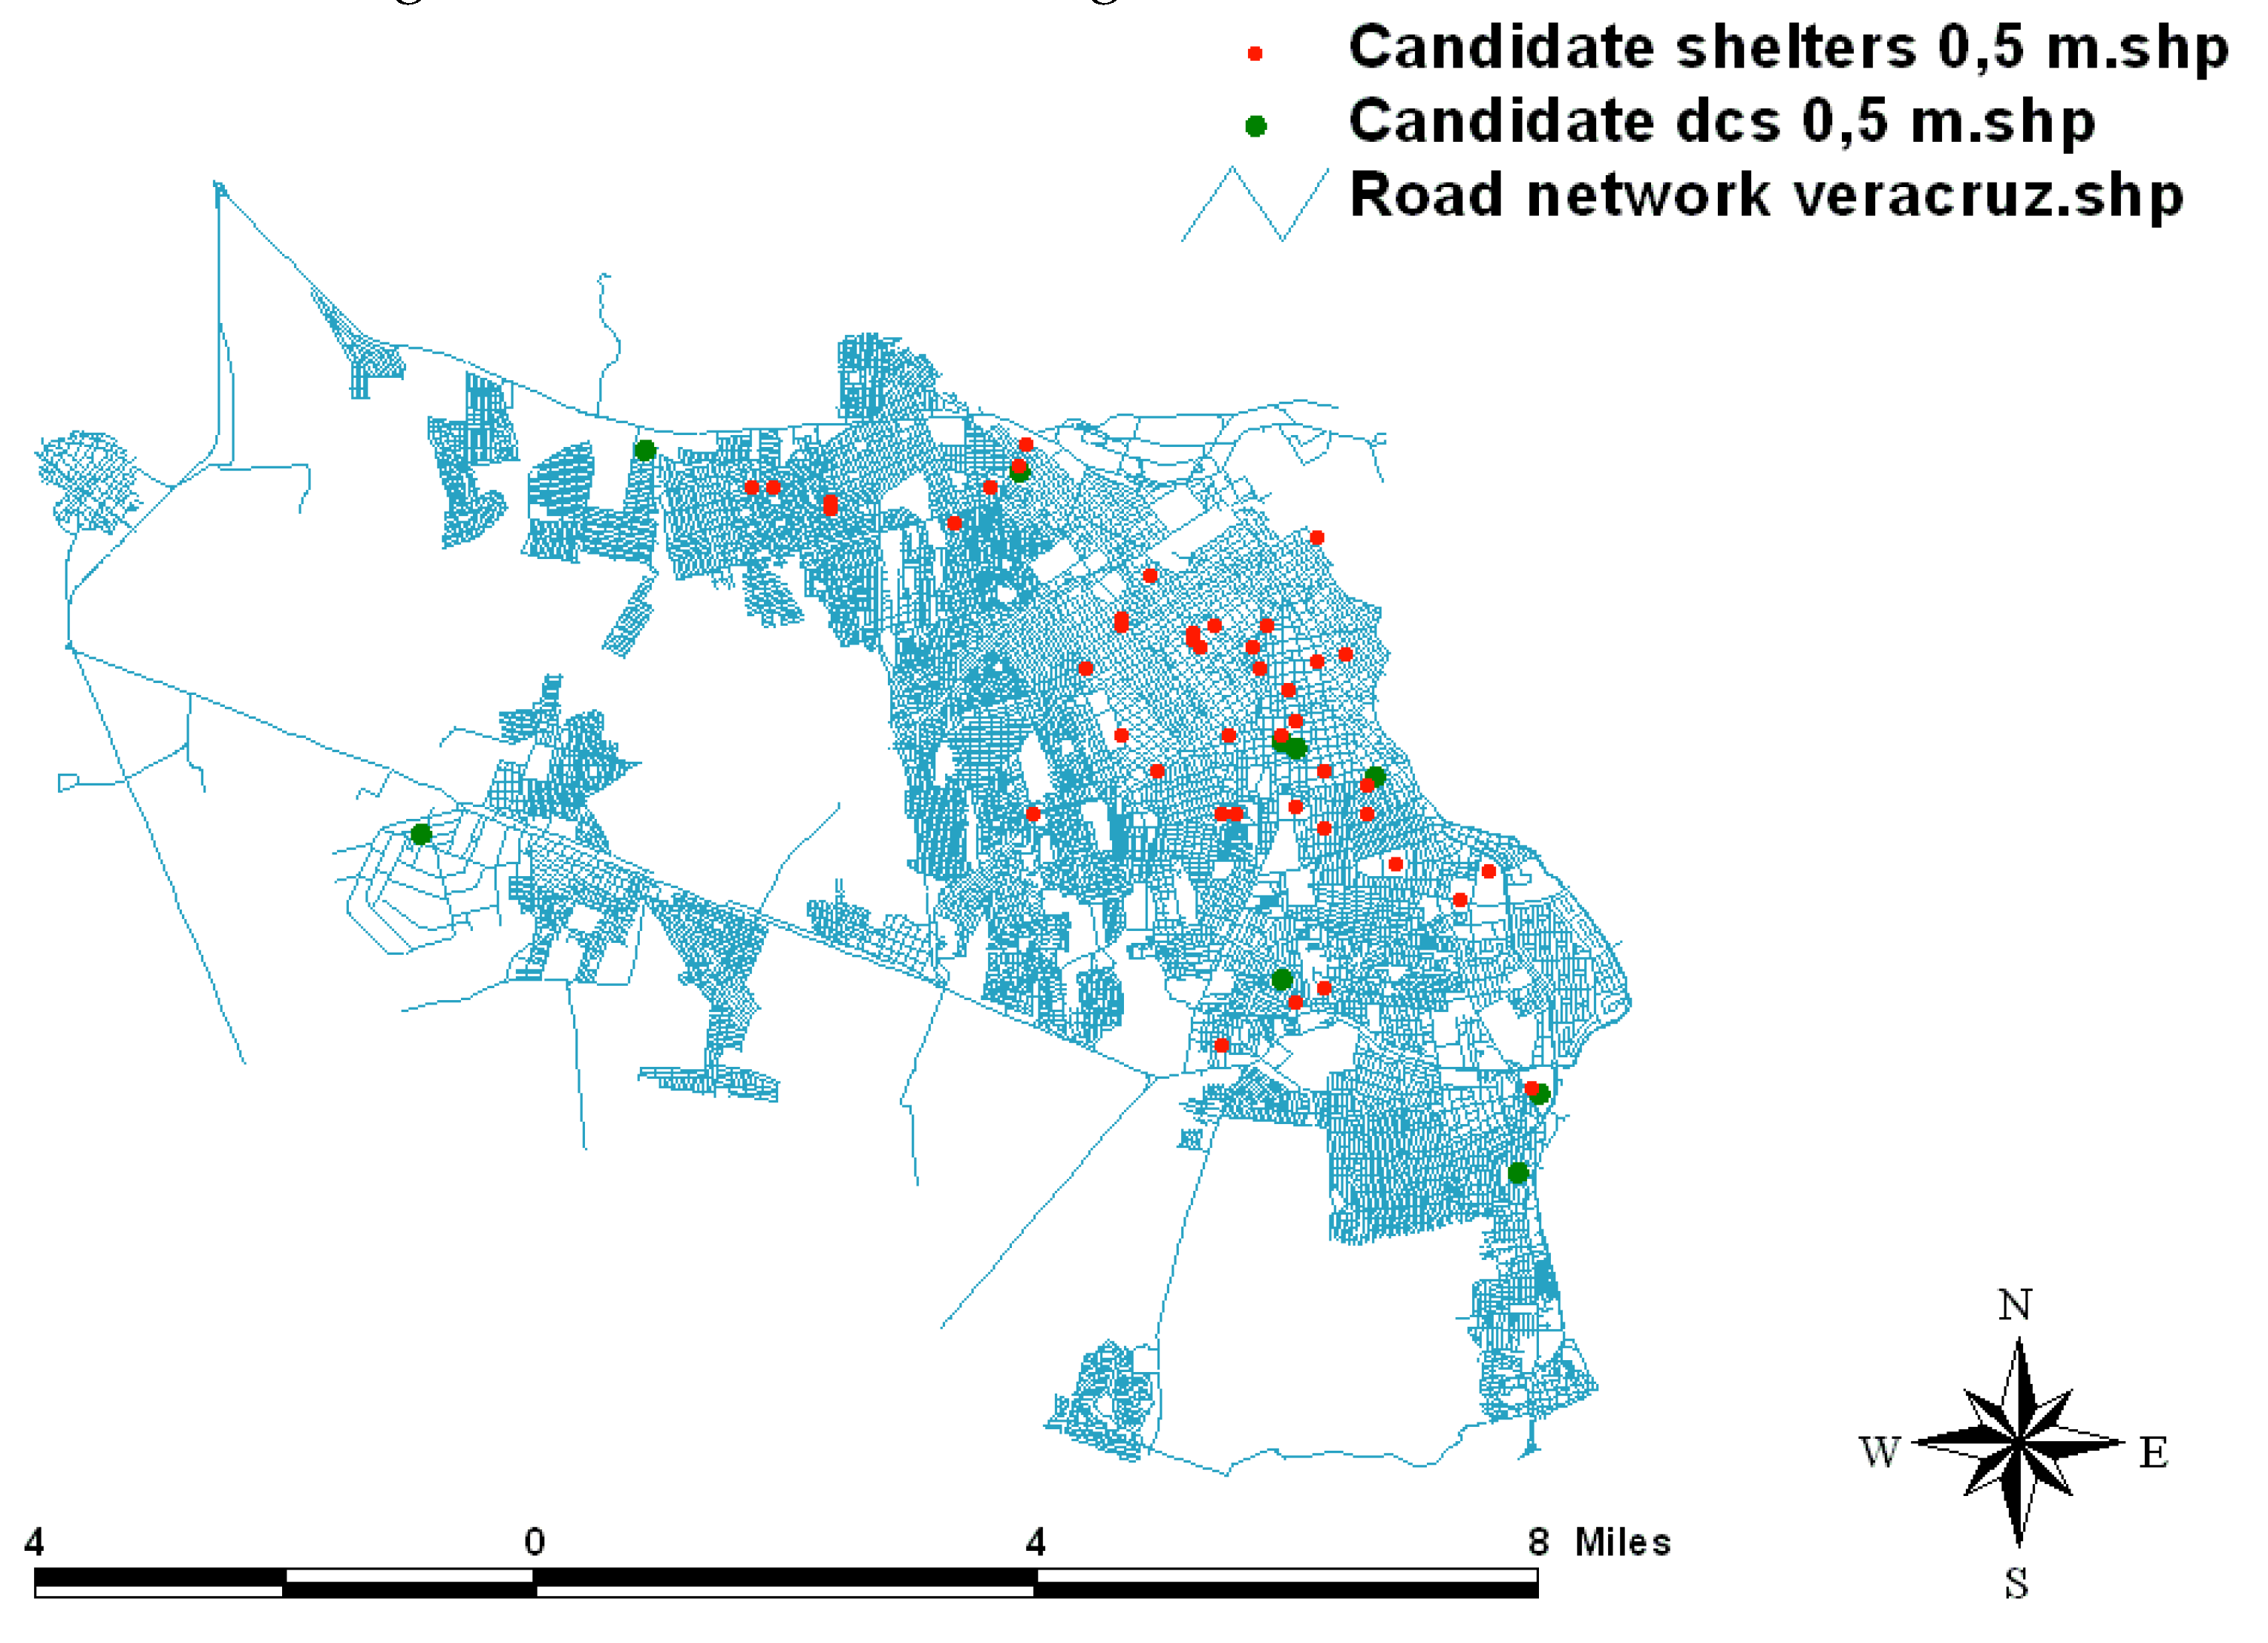
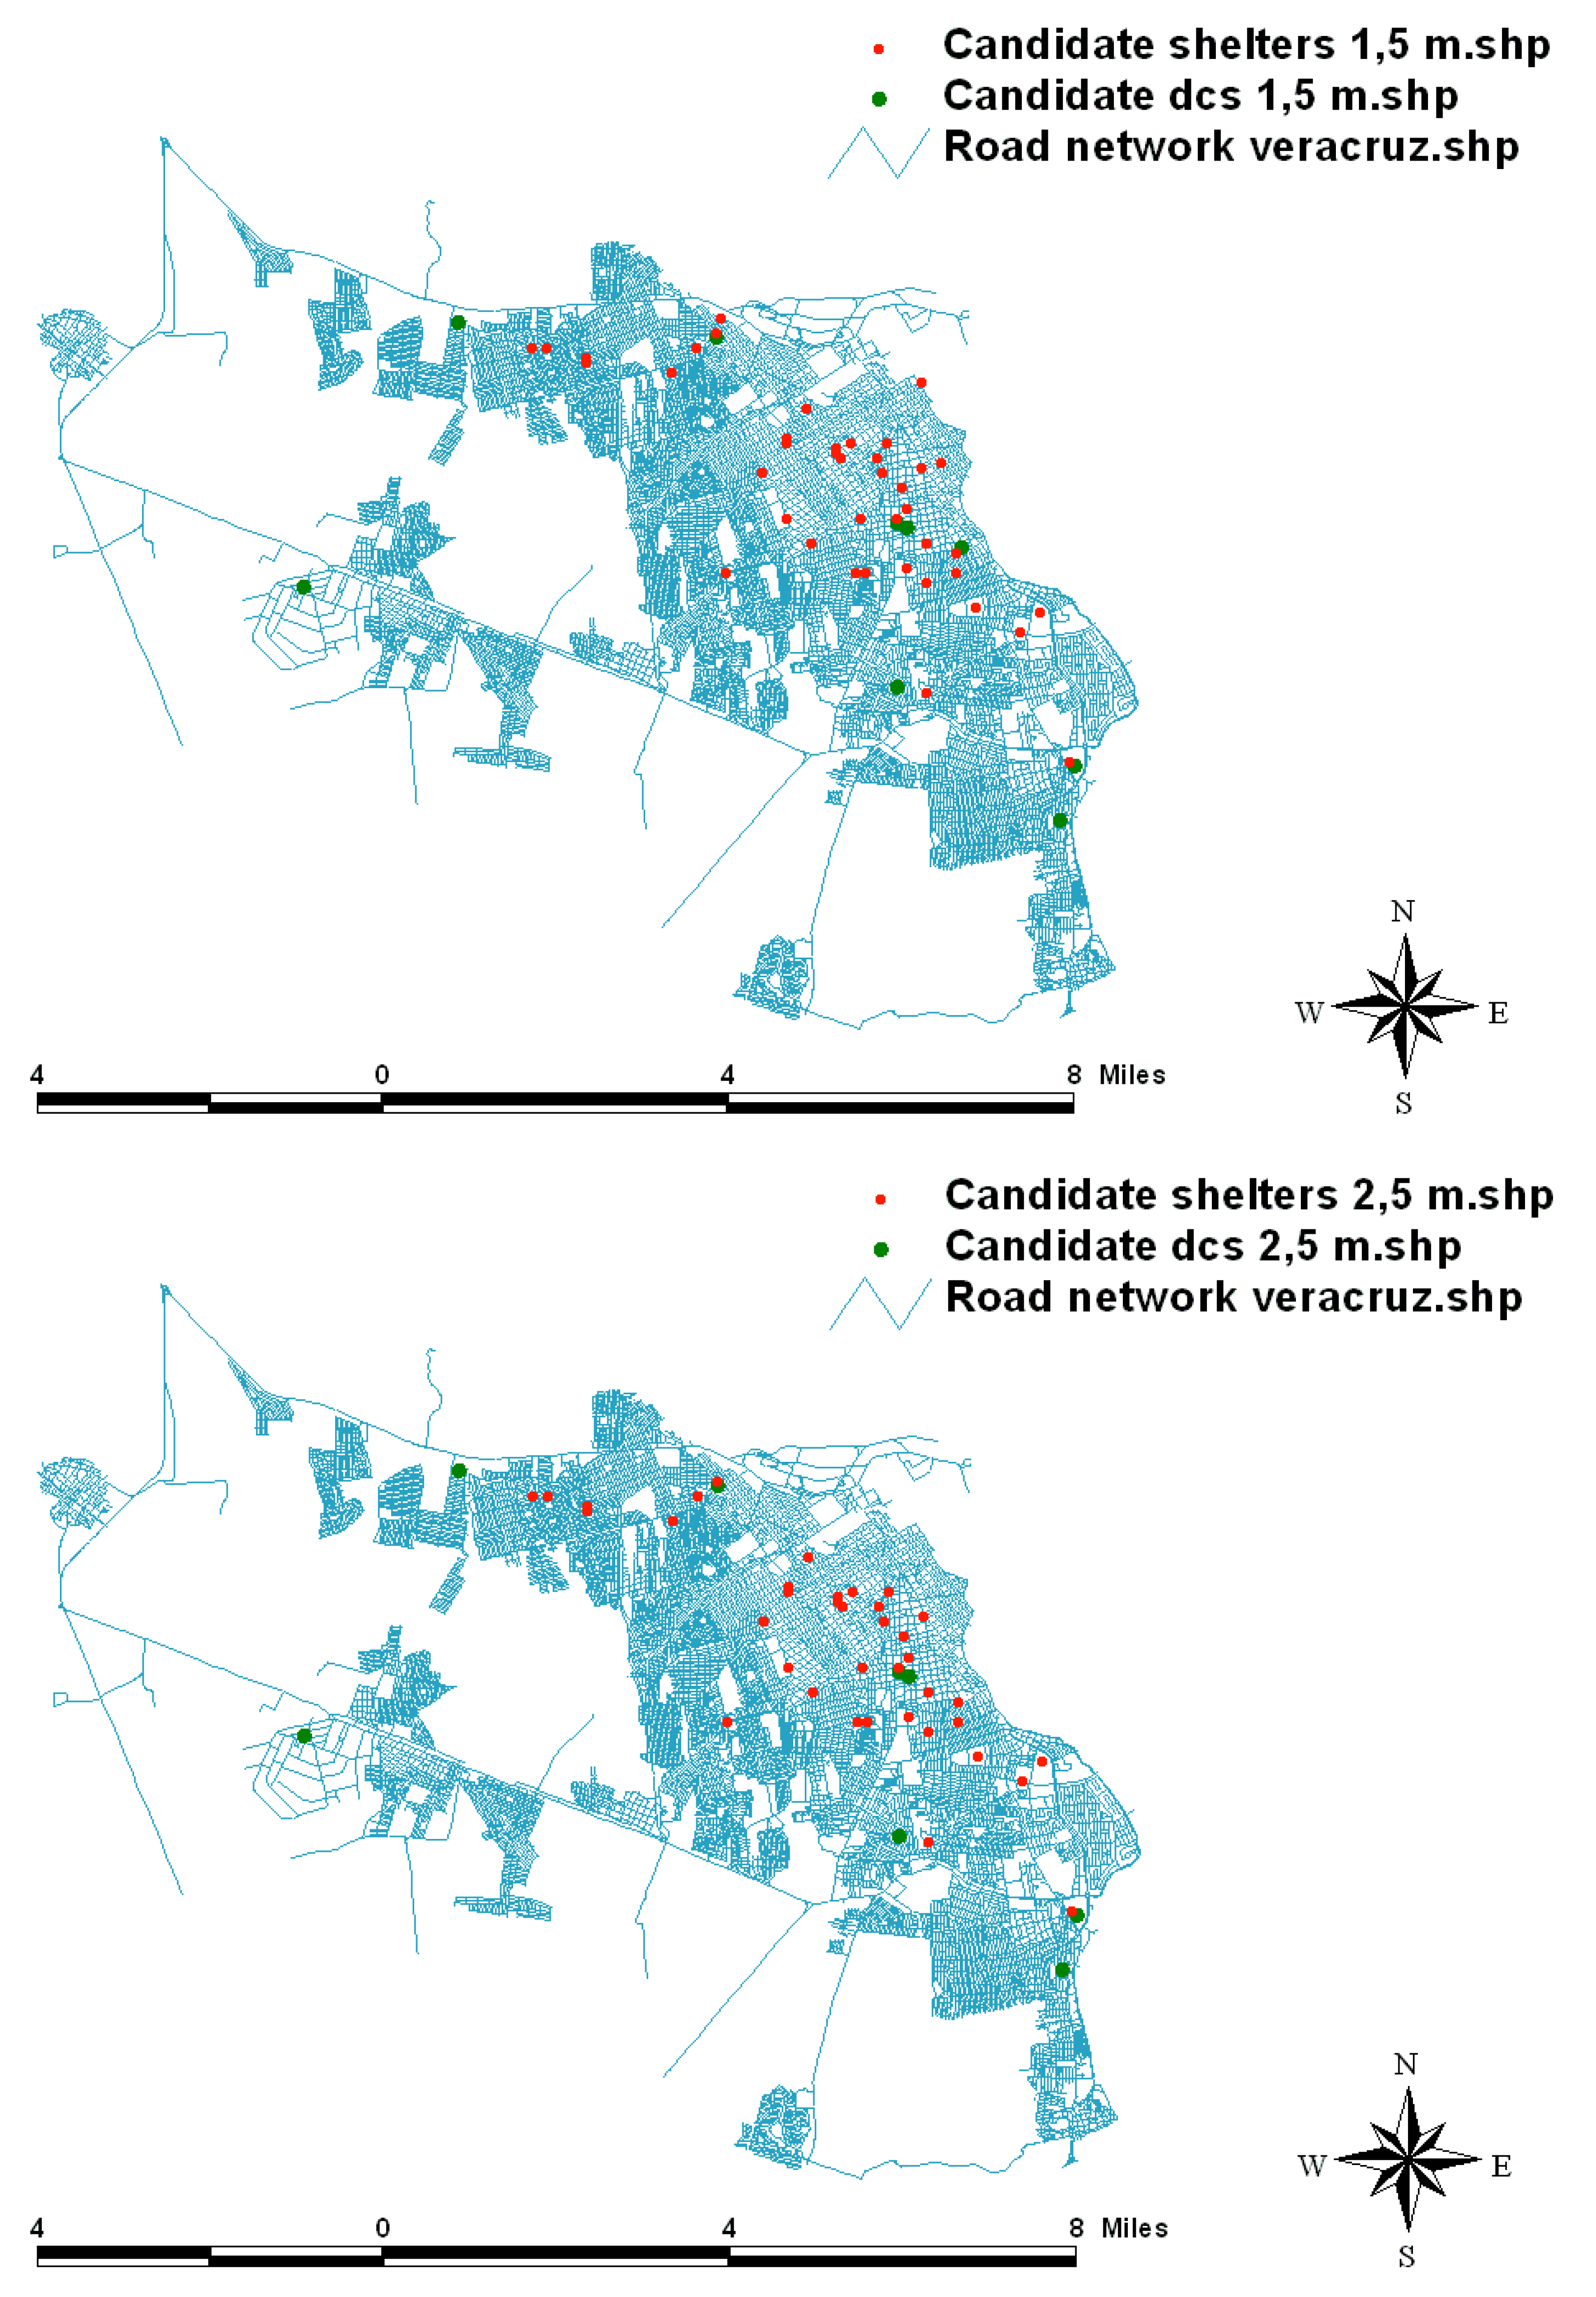
4.1.2. Application of the Cartographic Model
4.1.3. Results of the GIS Procedure Applied to Veracruz
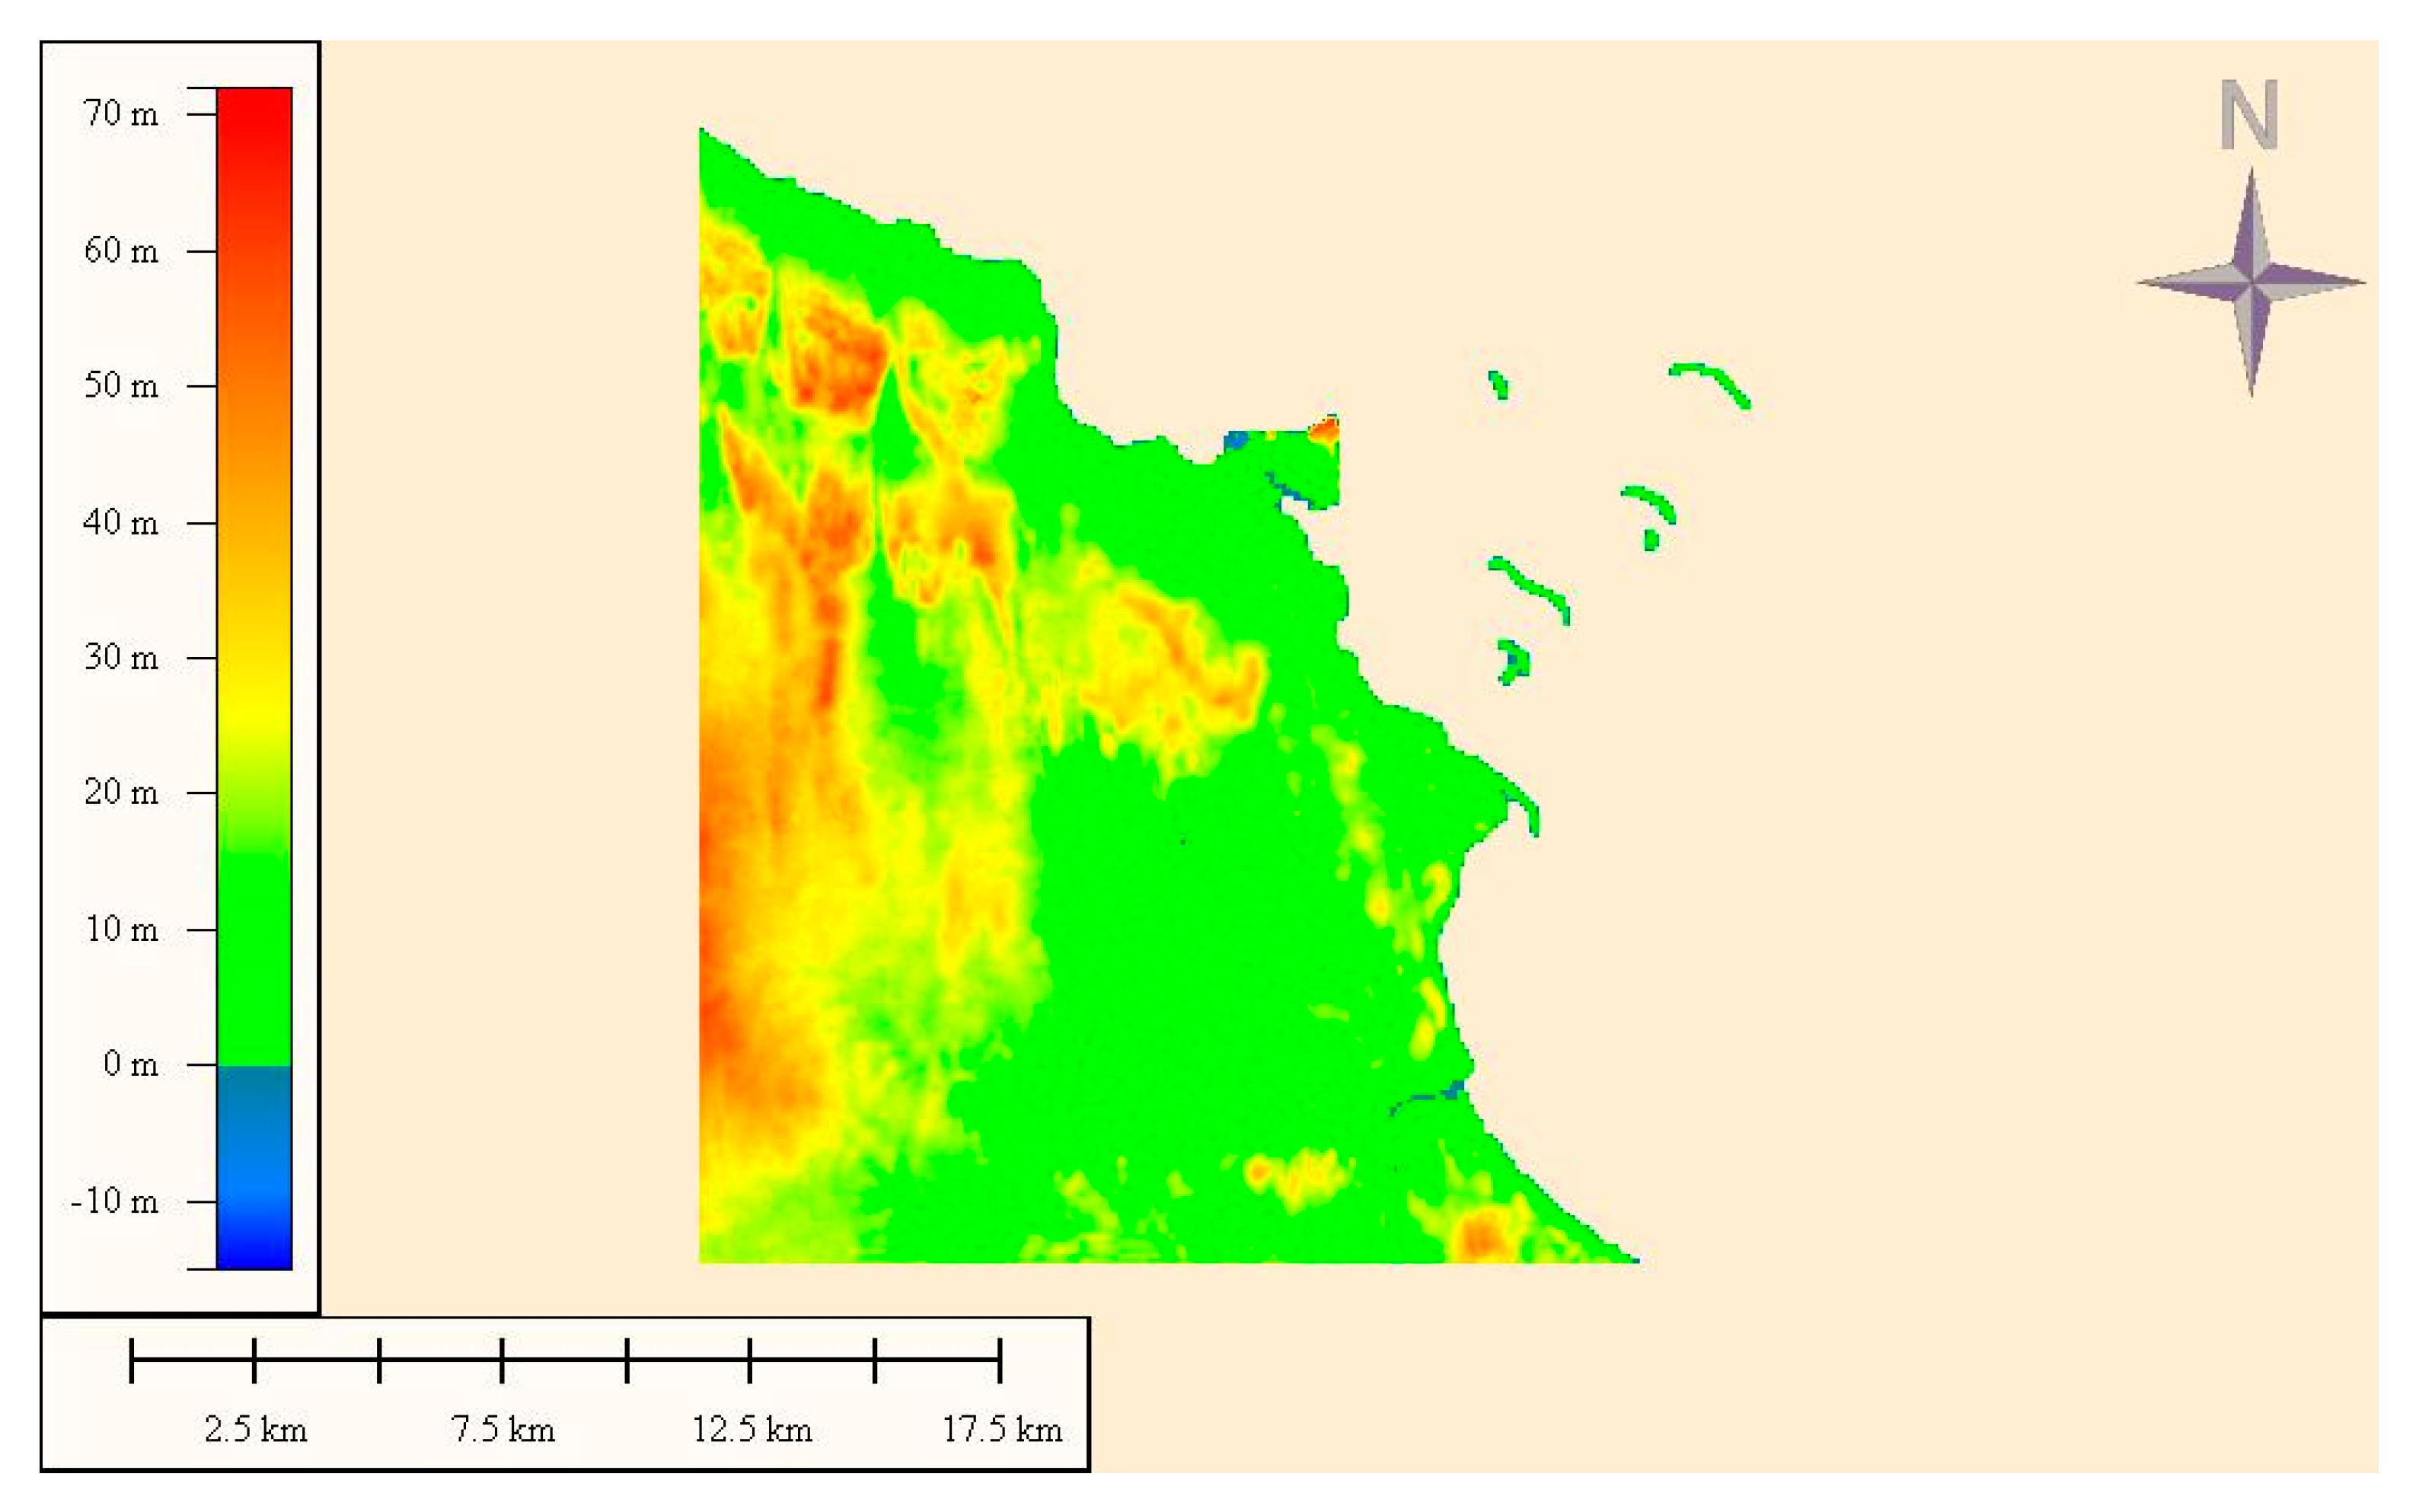
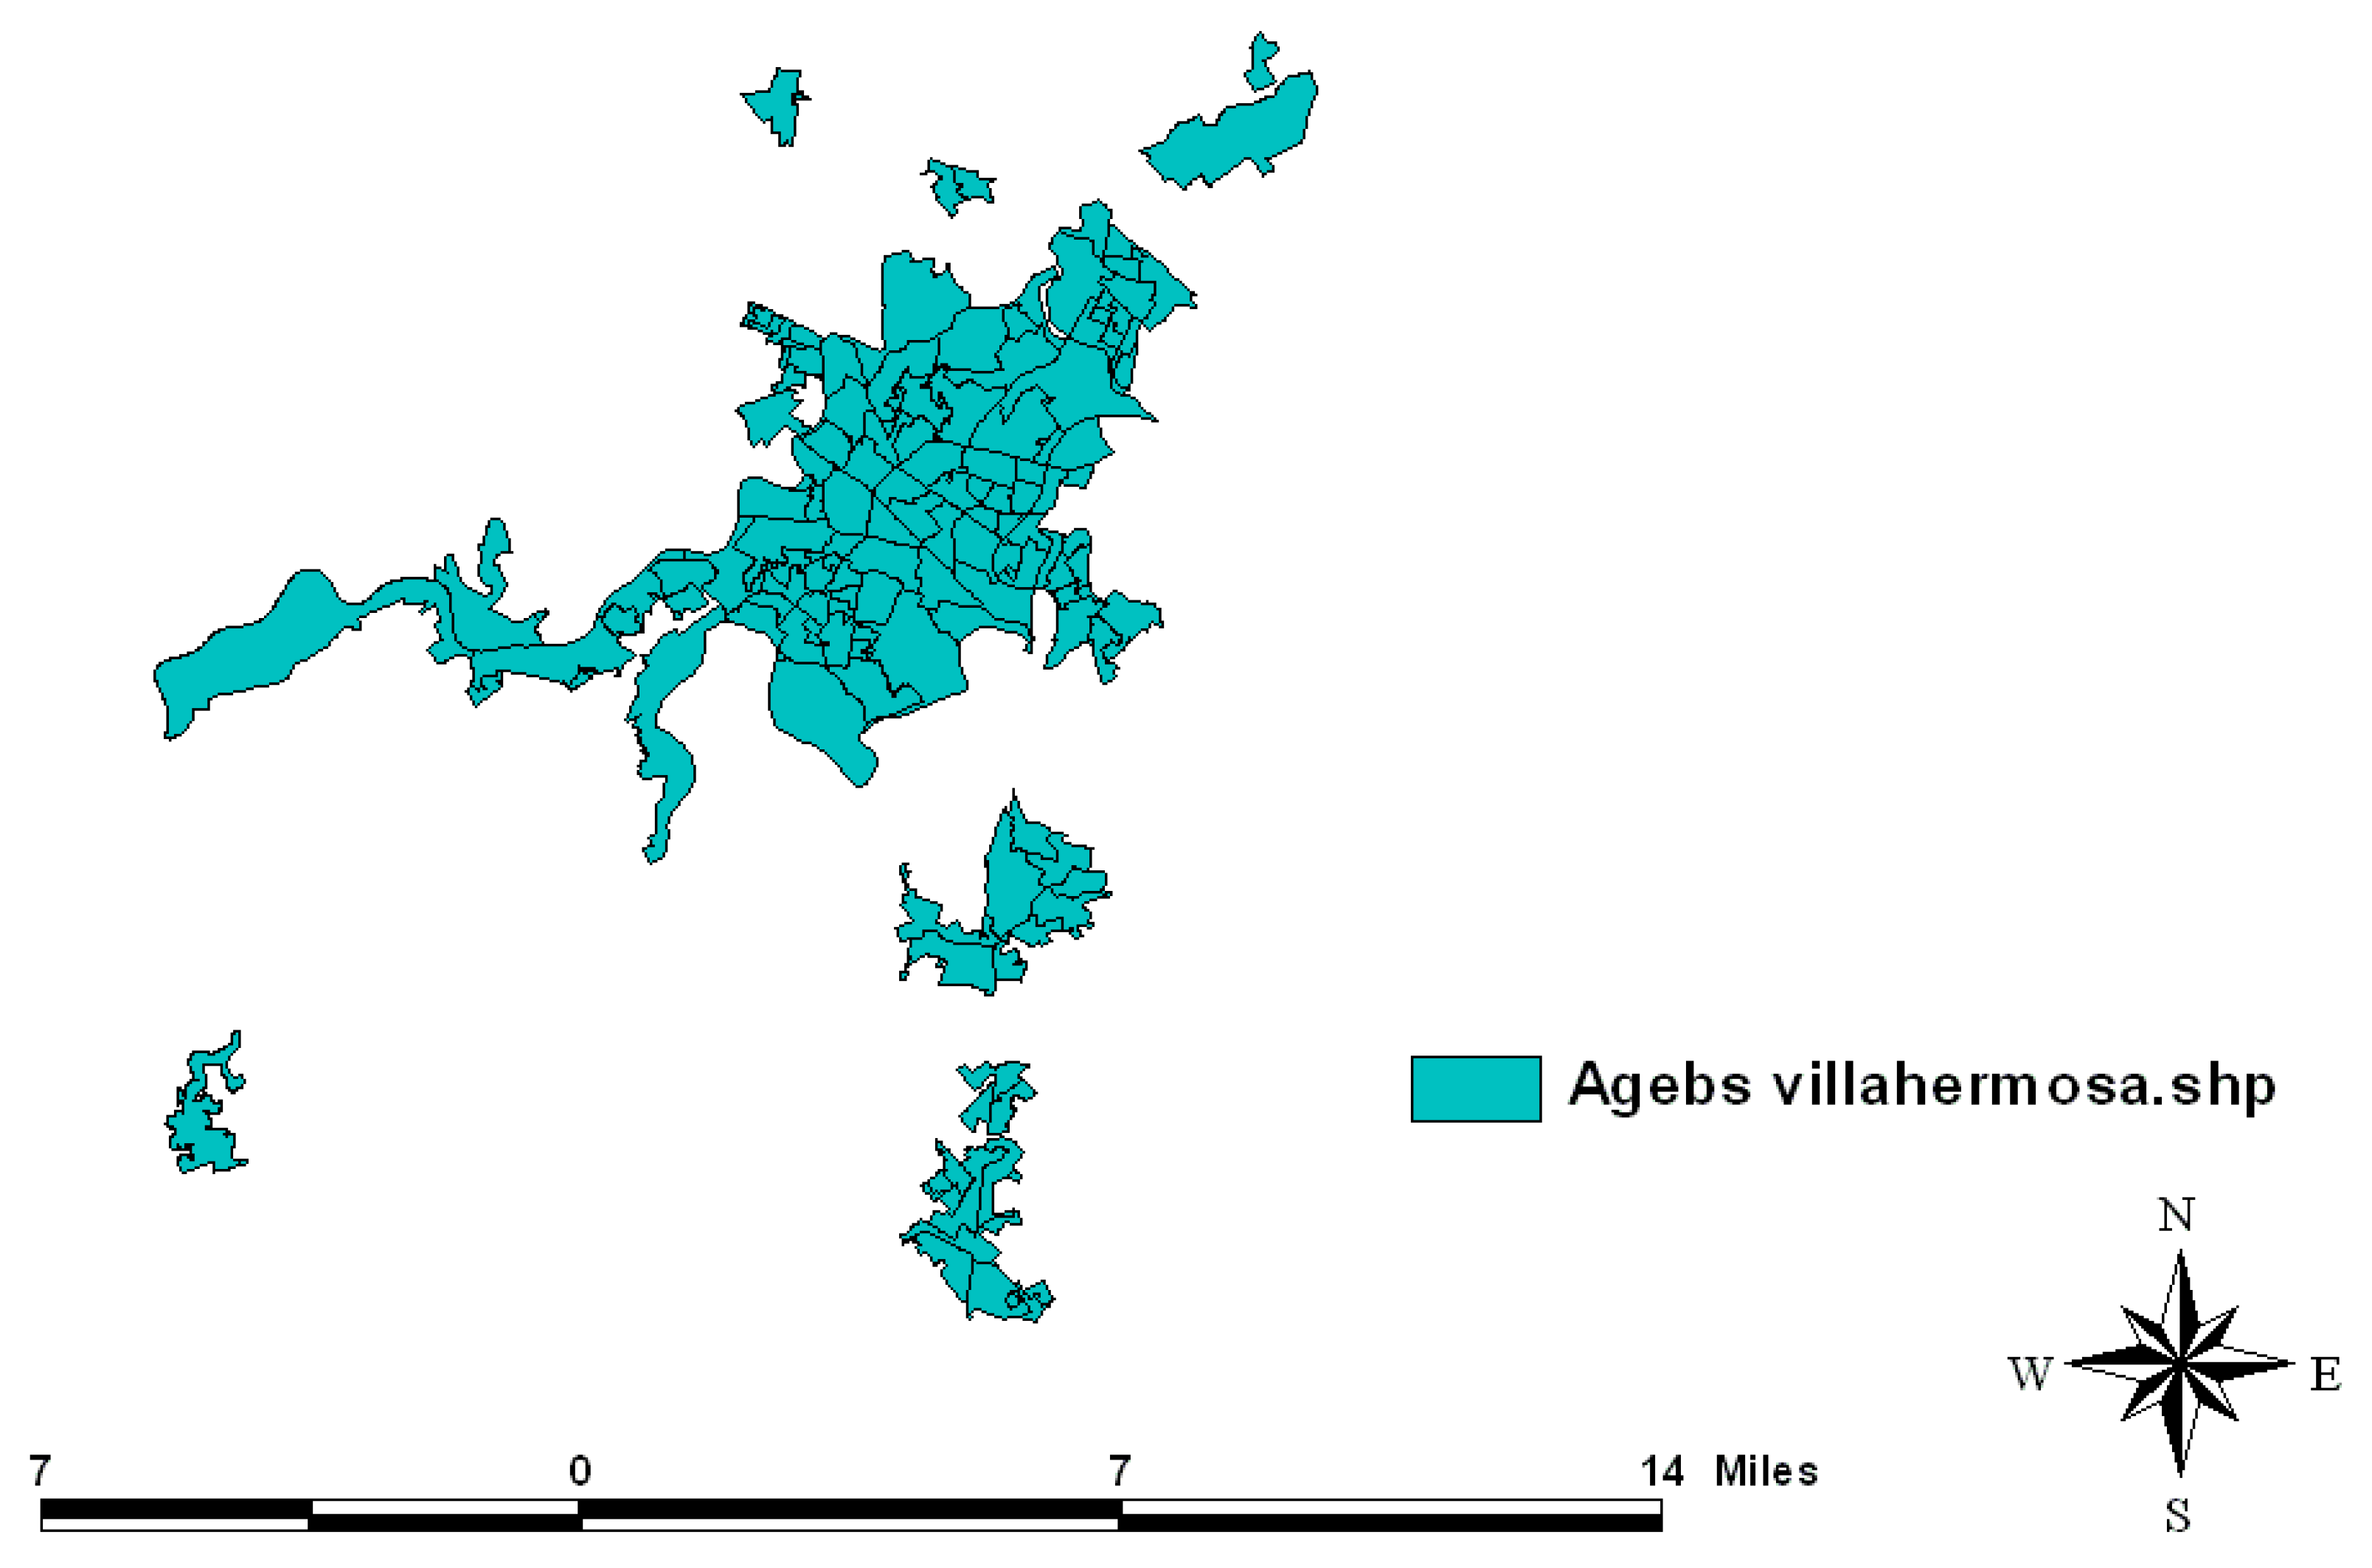
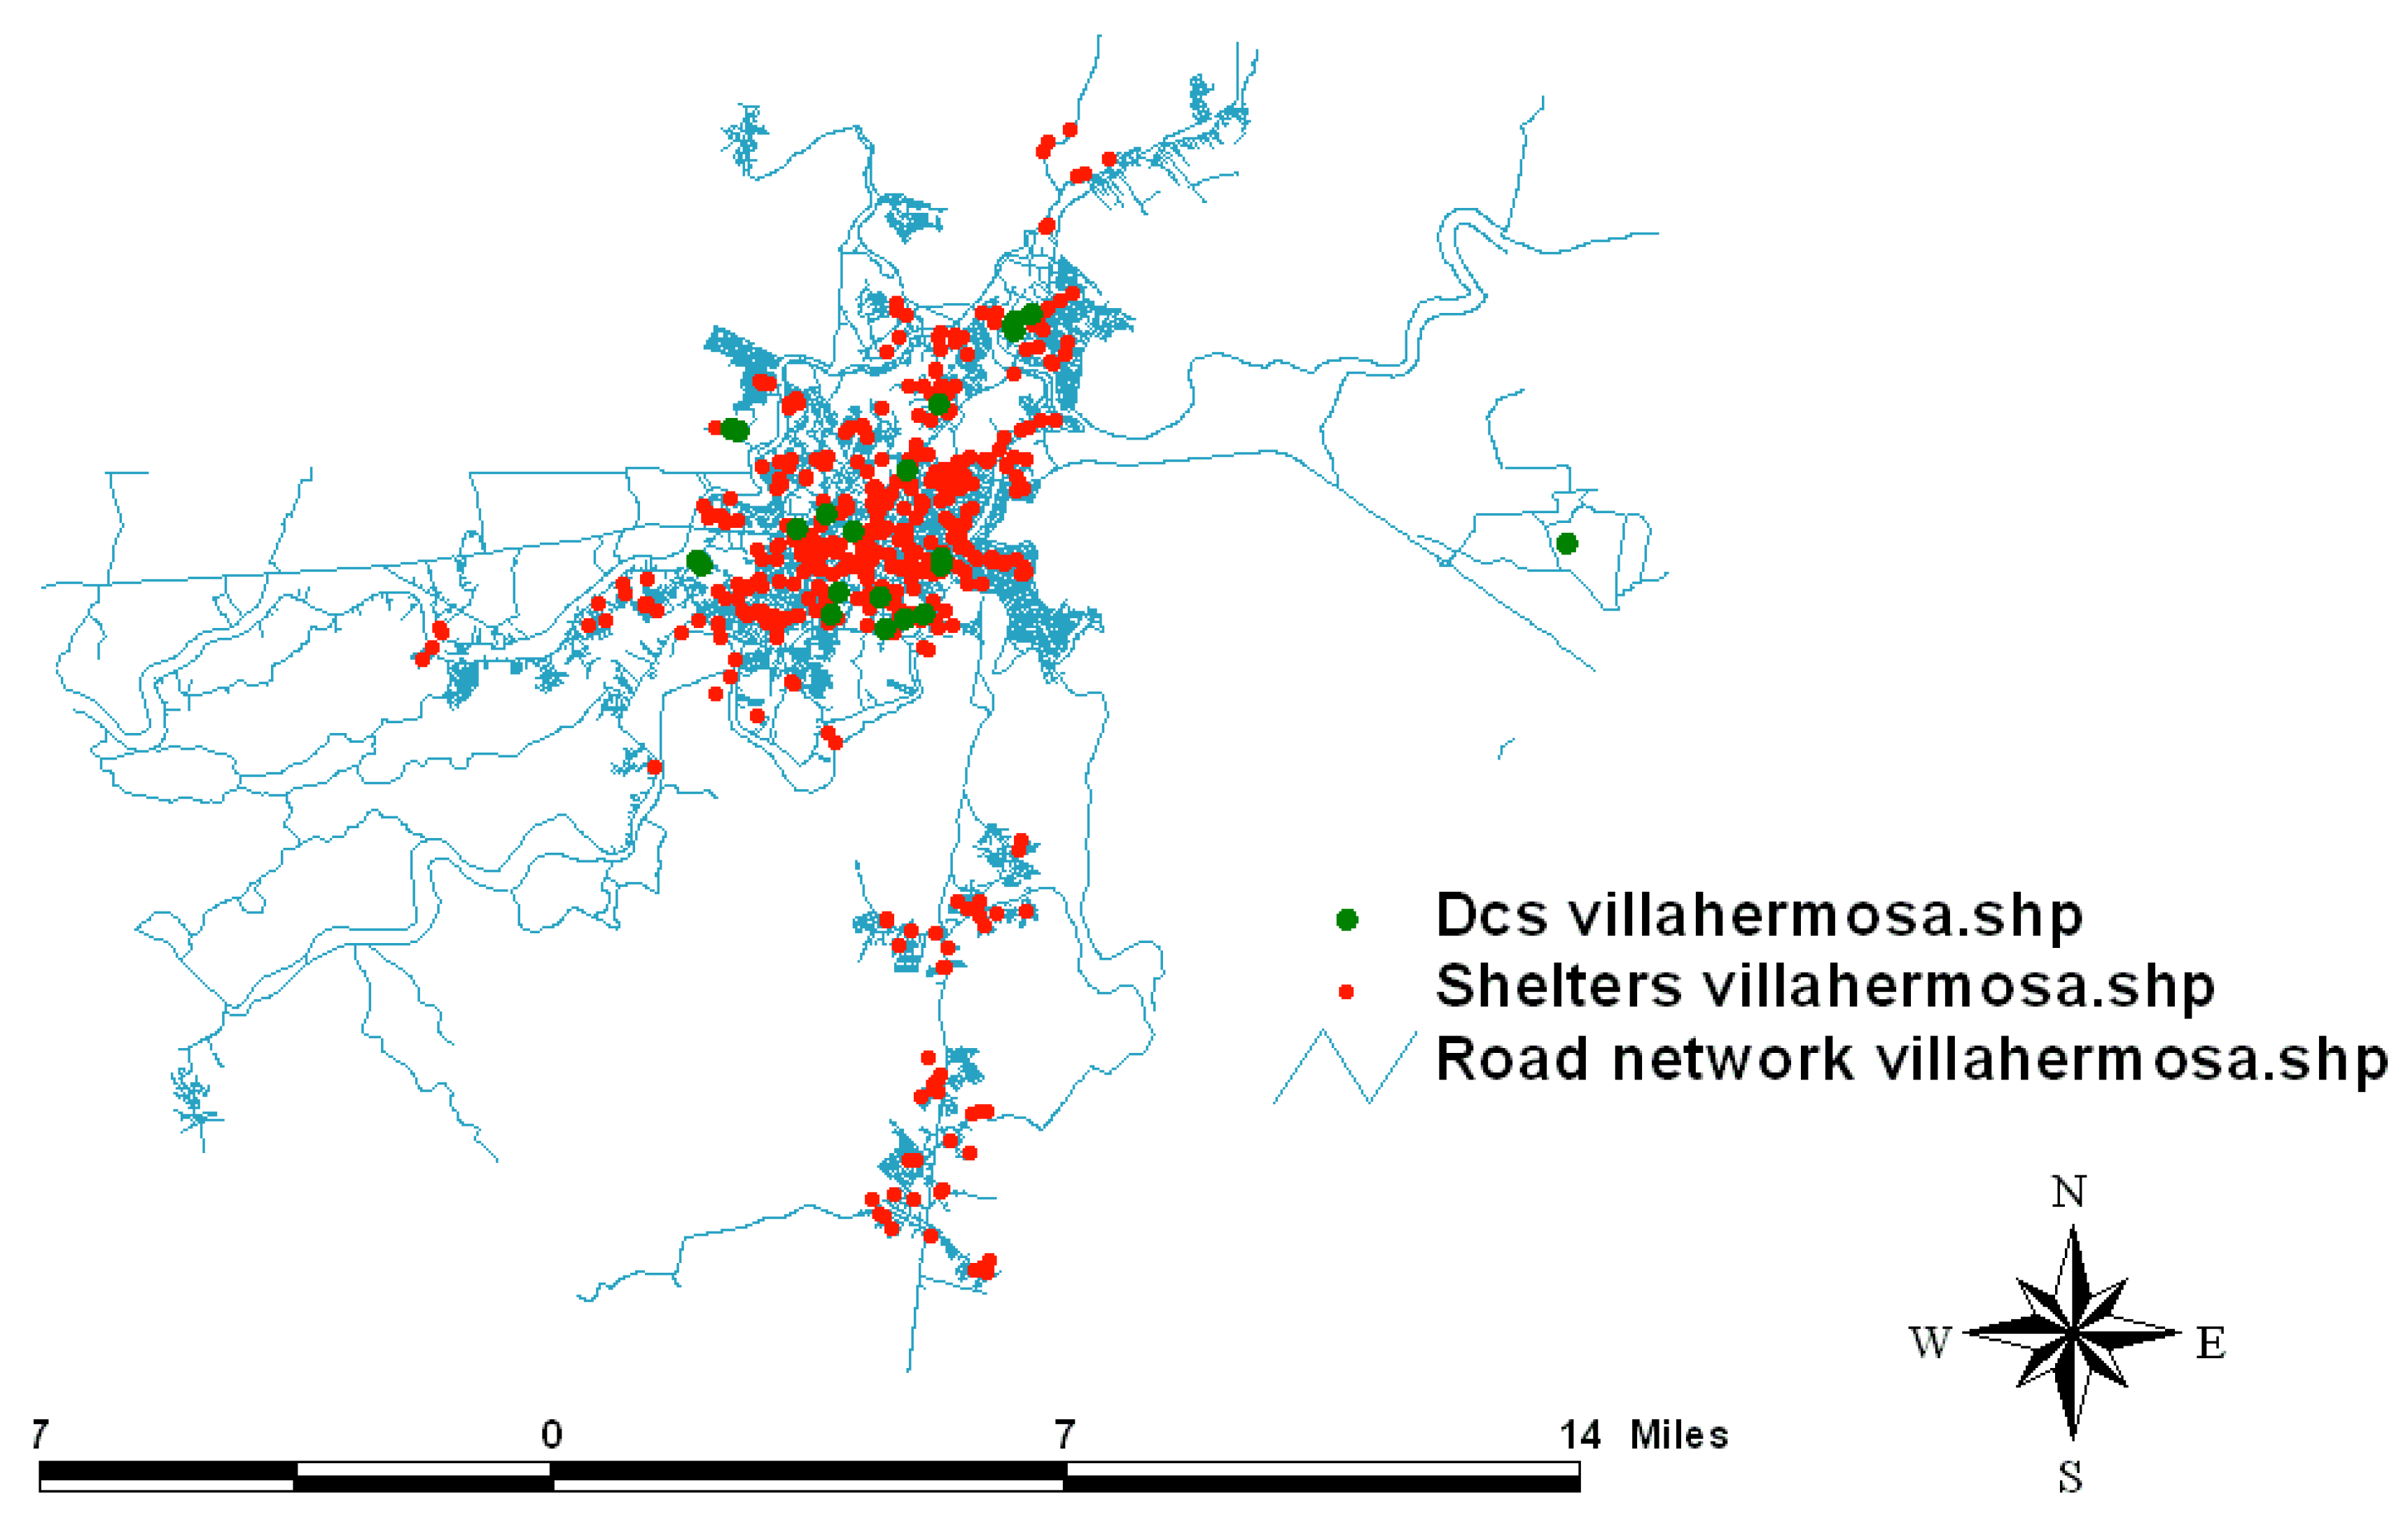
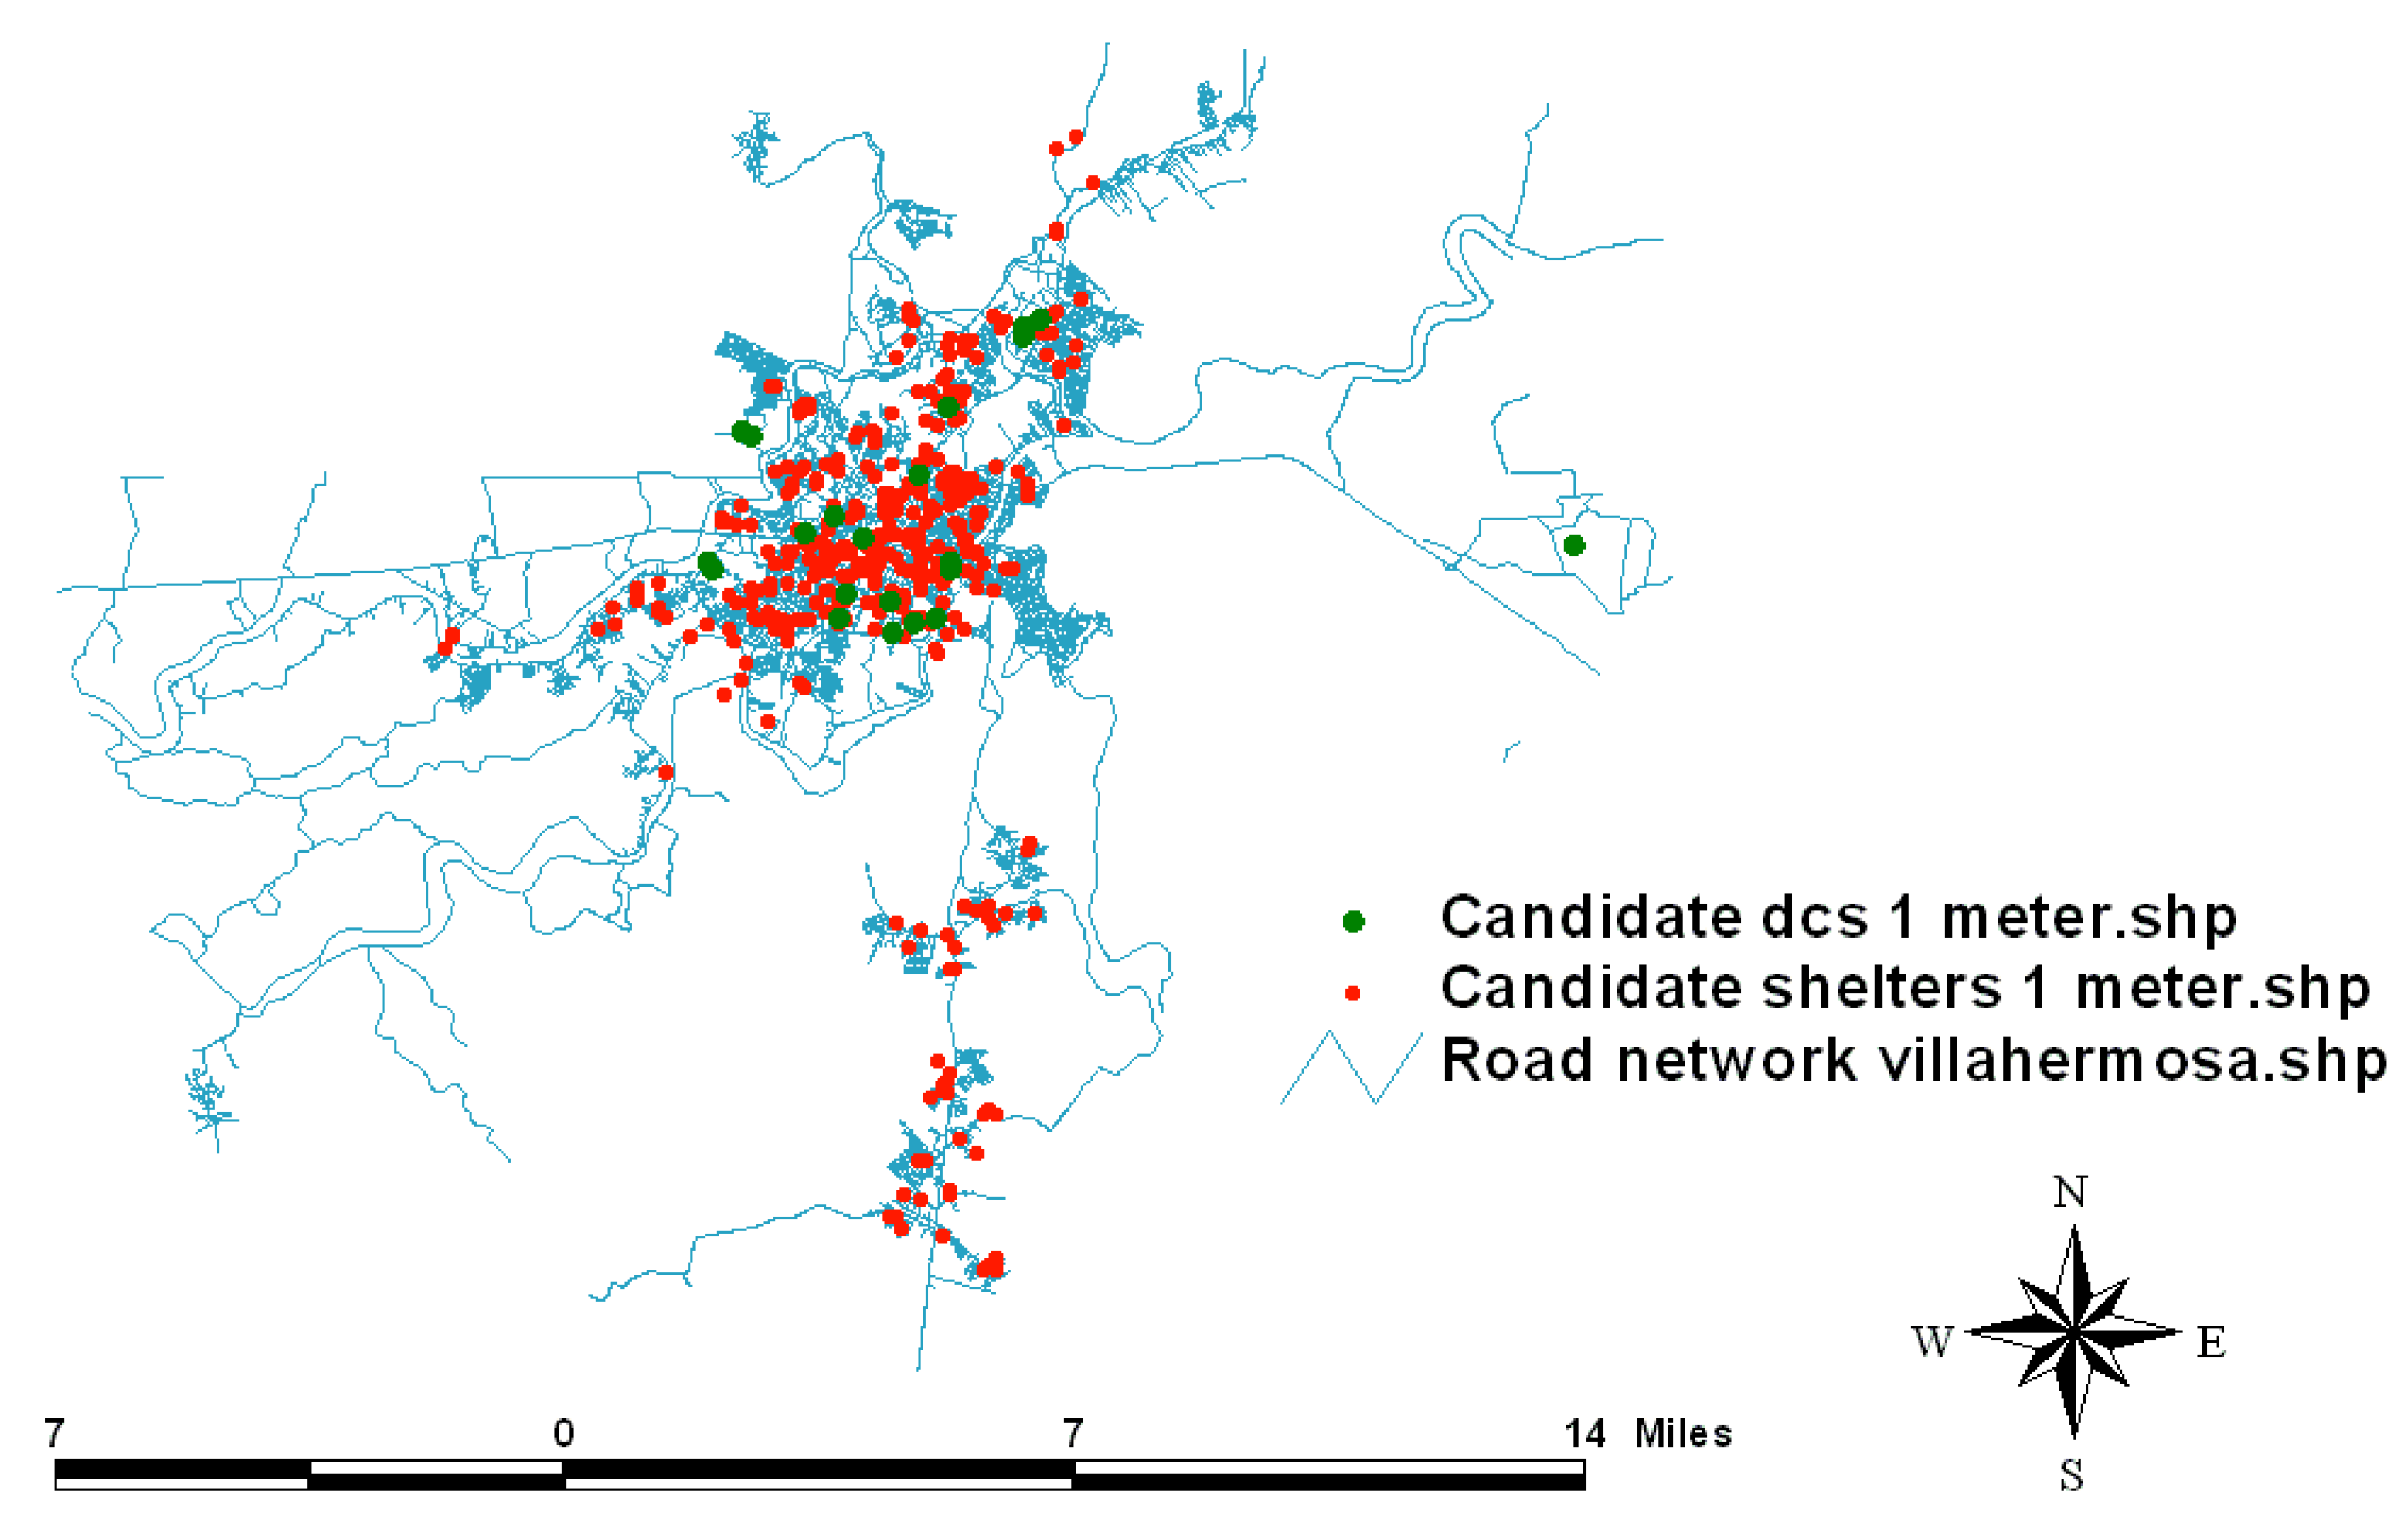
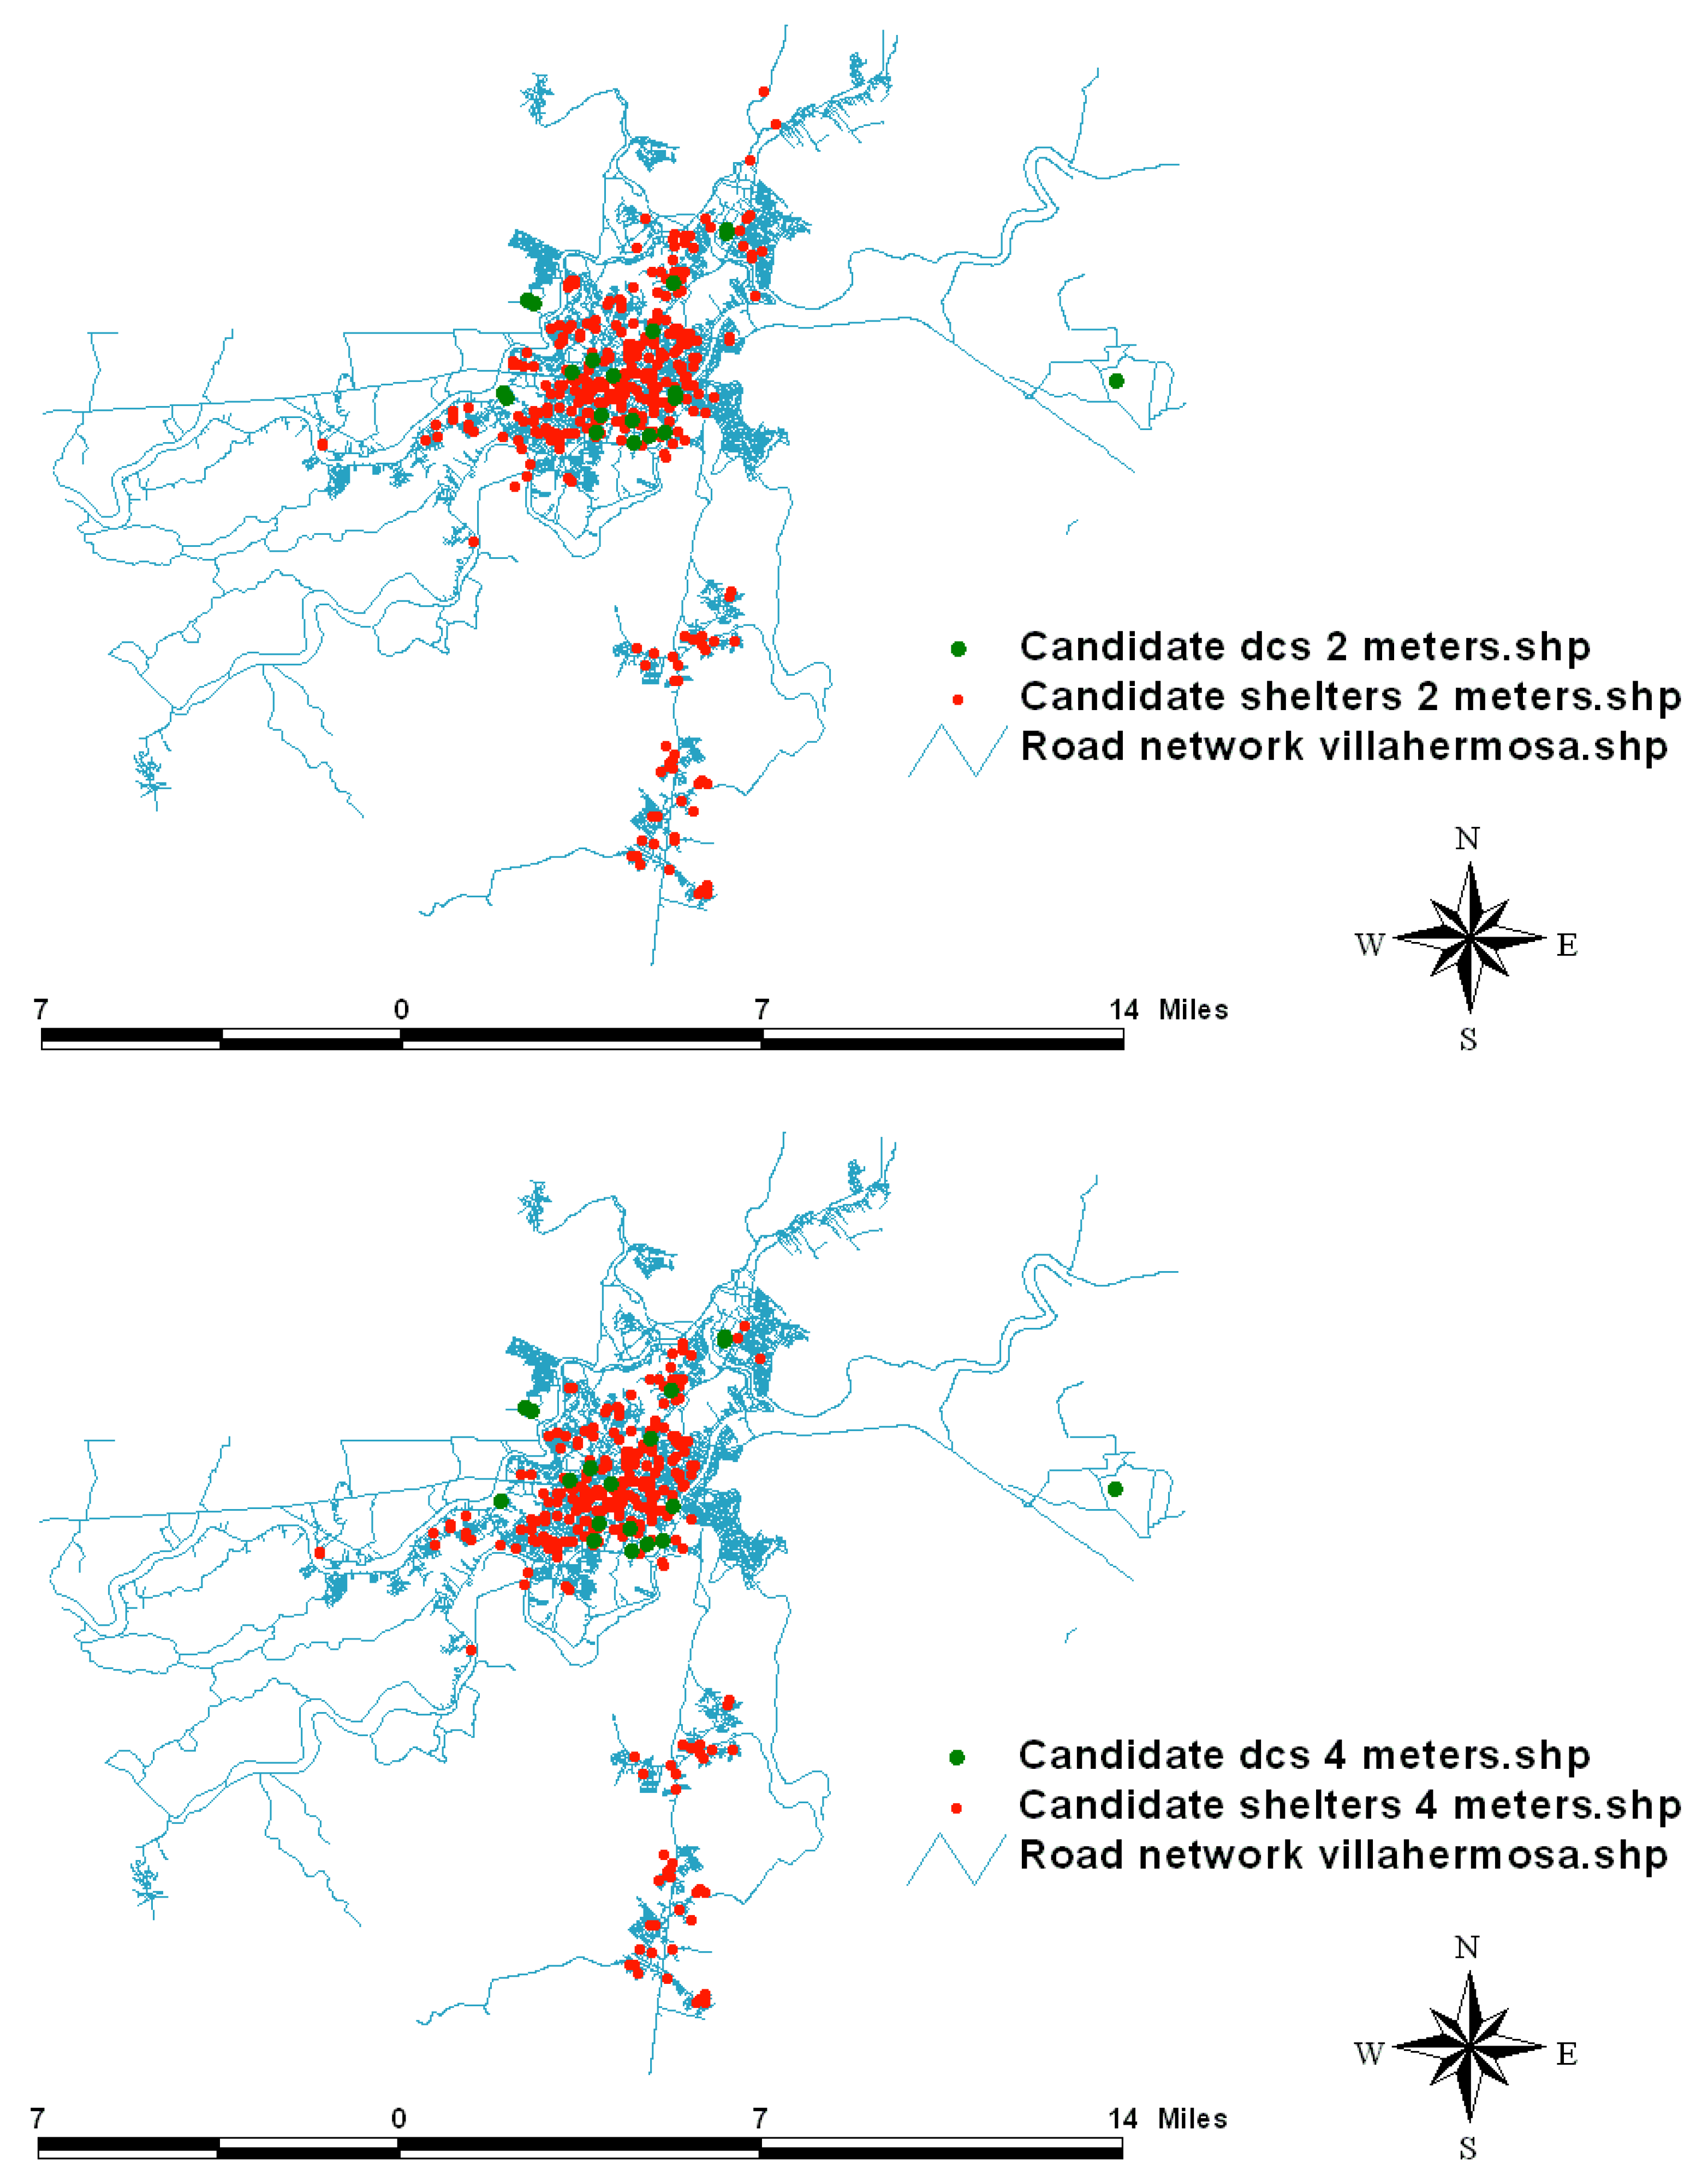
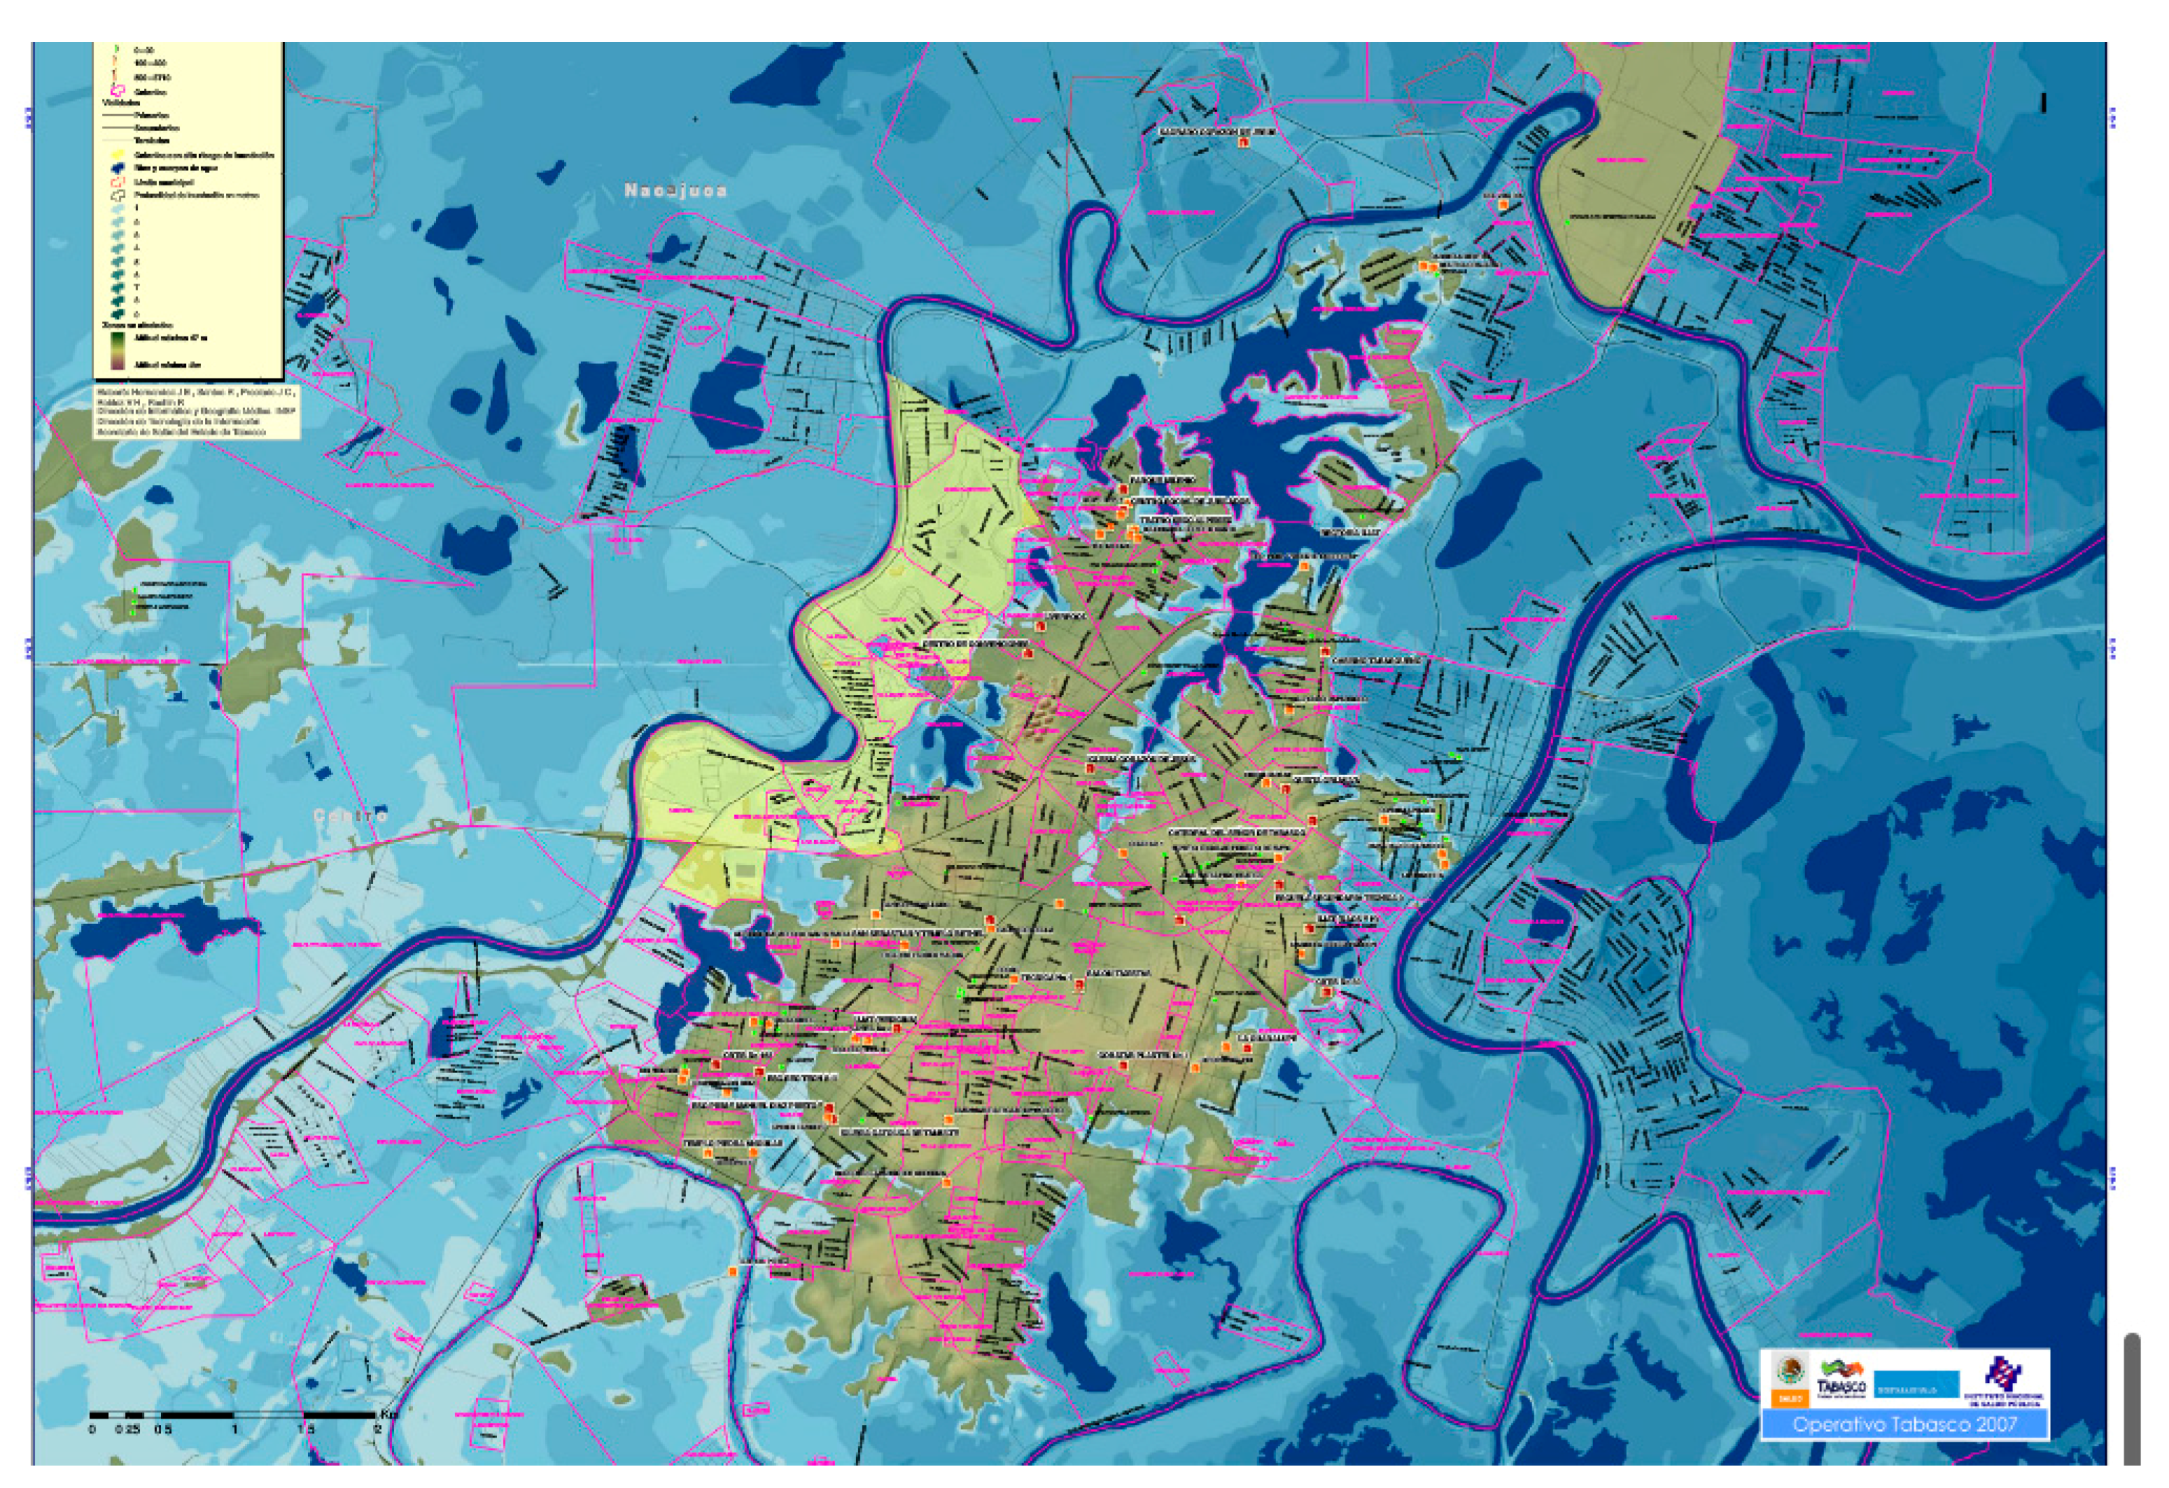
4.2. Villahermosa, Tabasco
4.2.1. Layers Used for the Case of Villahermosa
4.2.2. GIS Procedure for the Case of Villahermosa
4.2.3. Results of the GIS Procedure Applied to Villahermosa
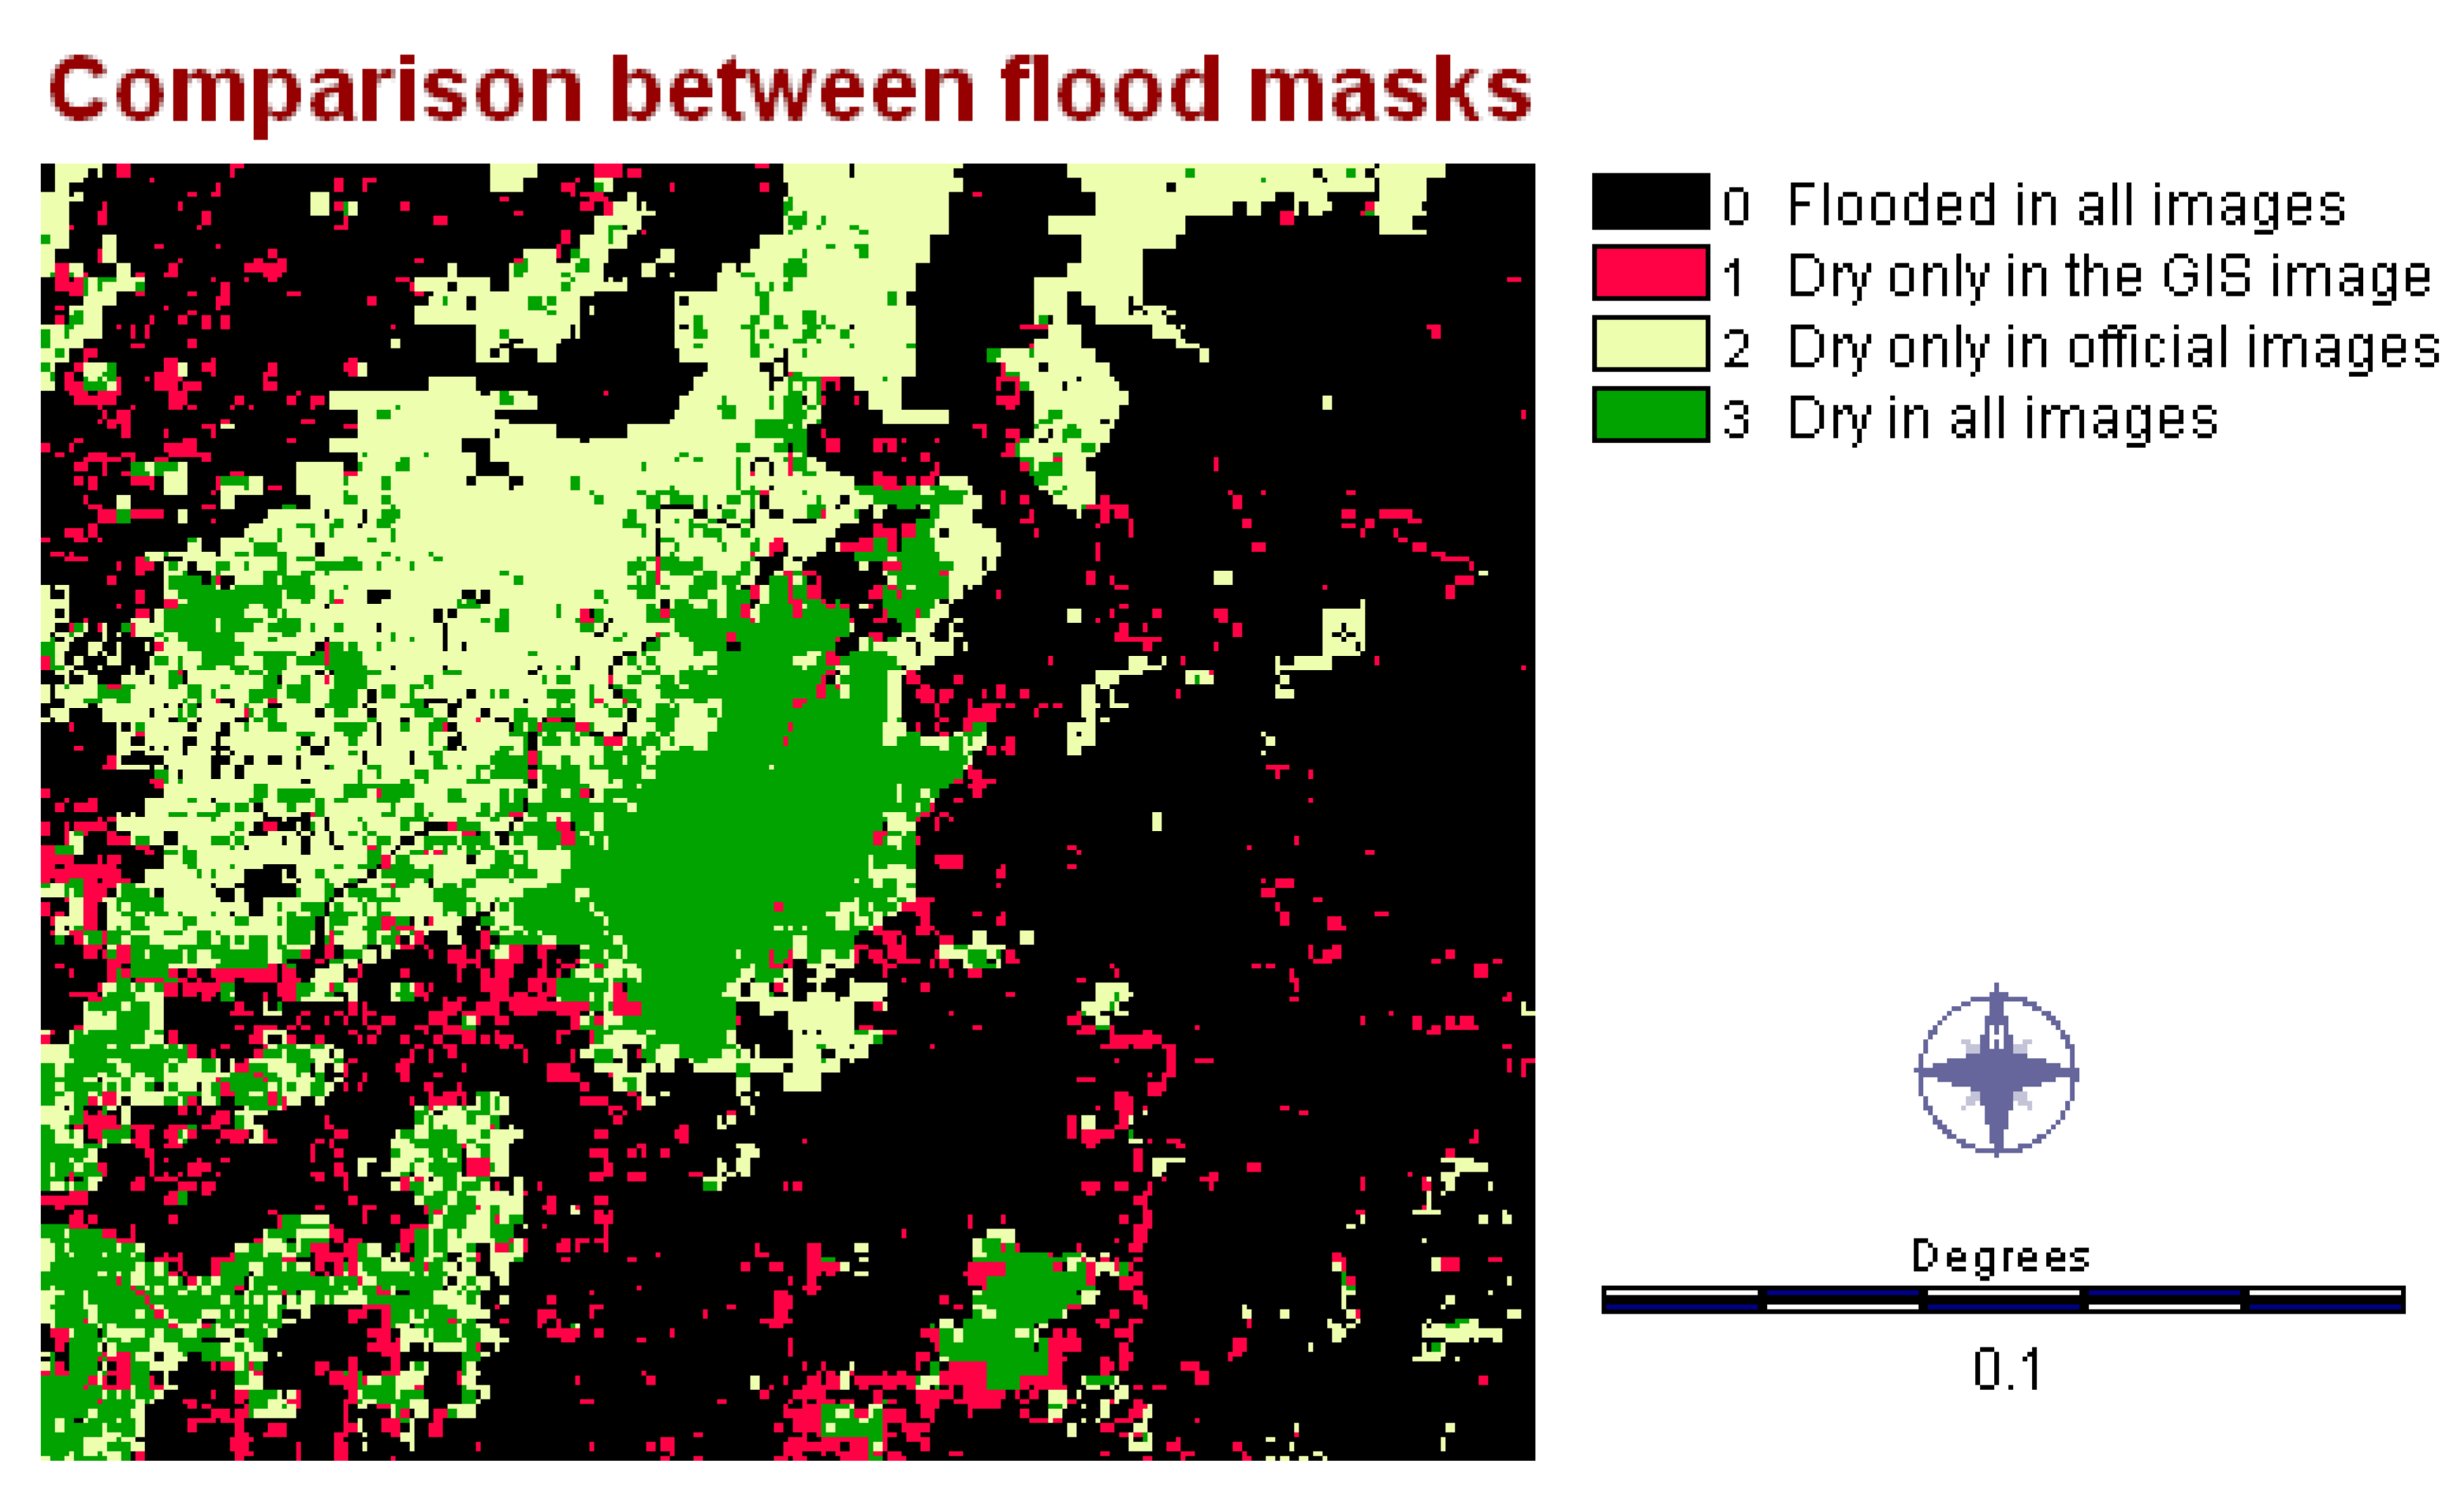
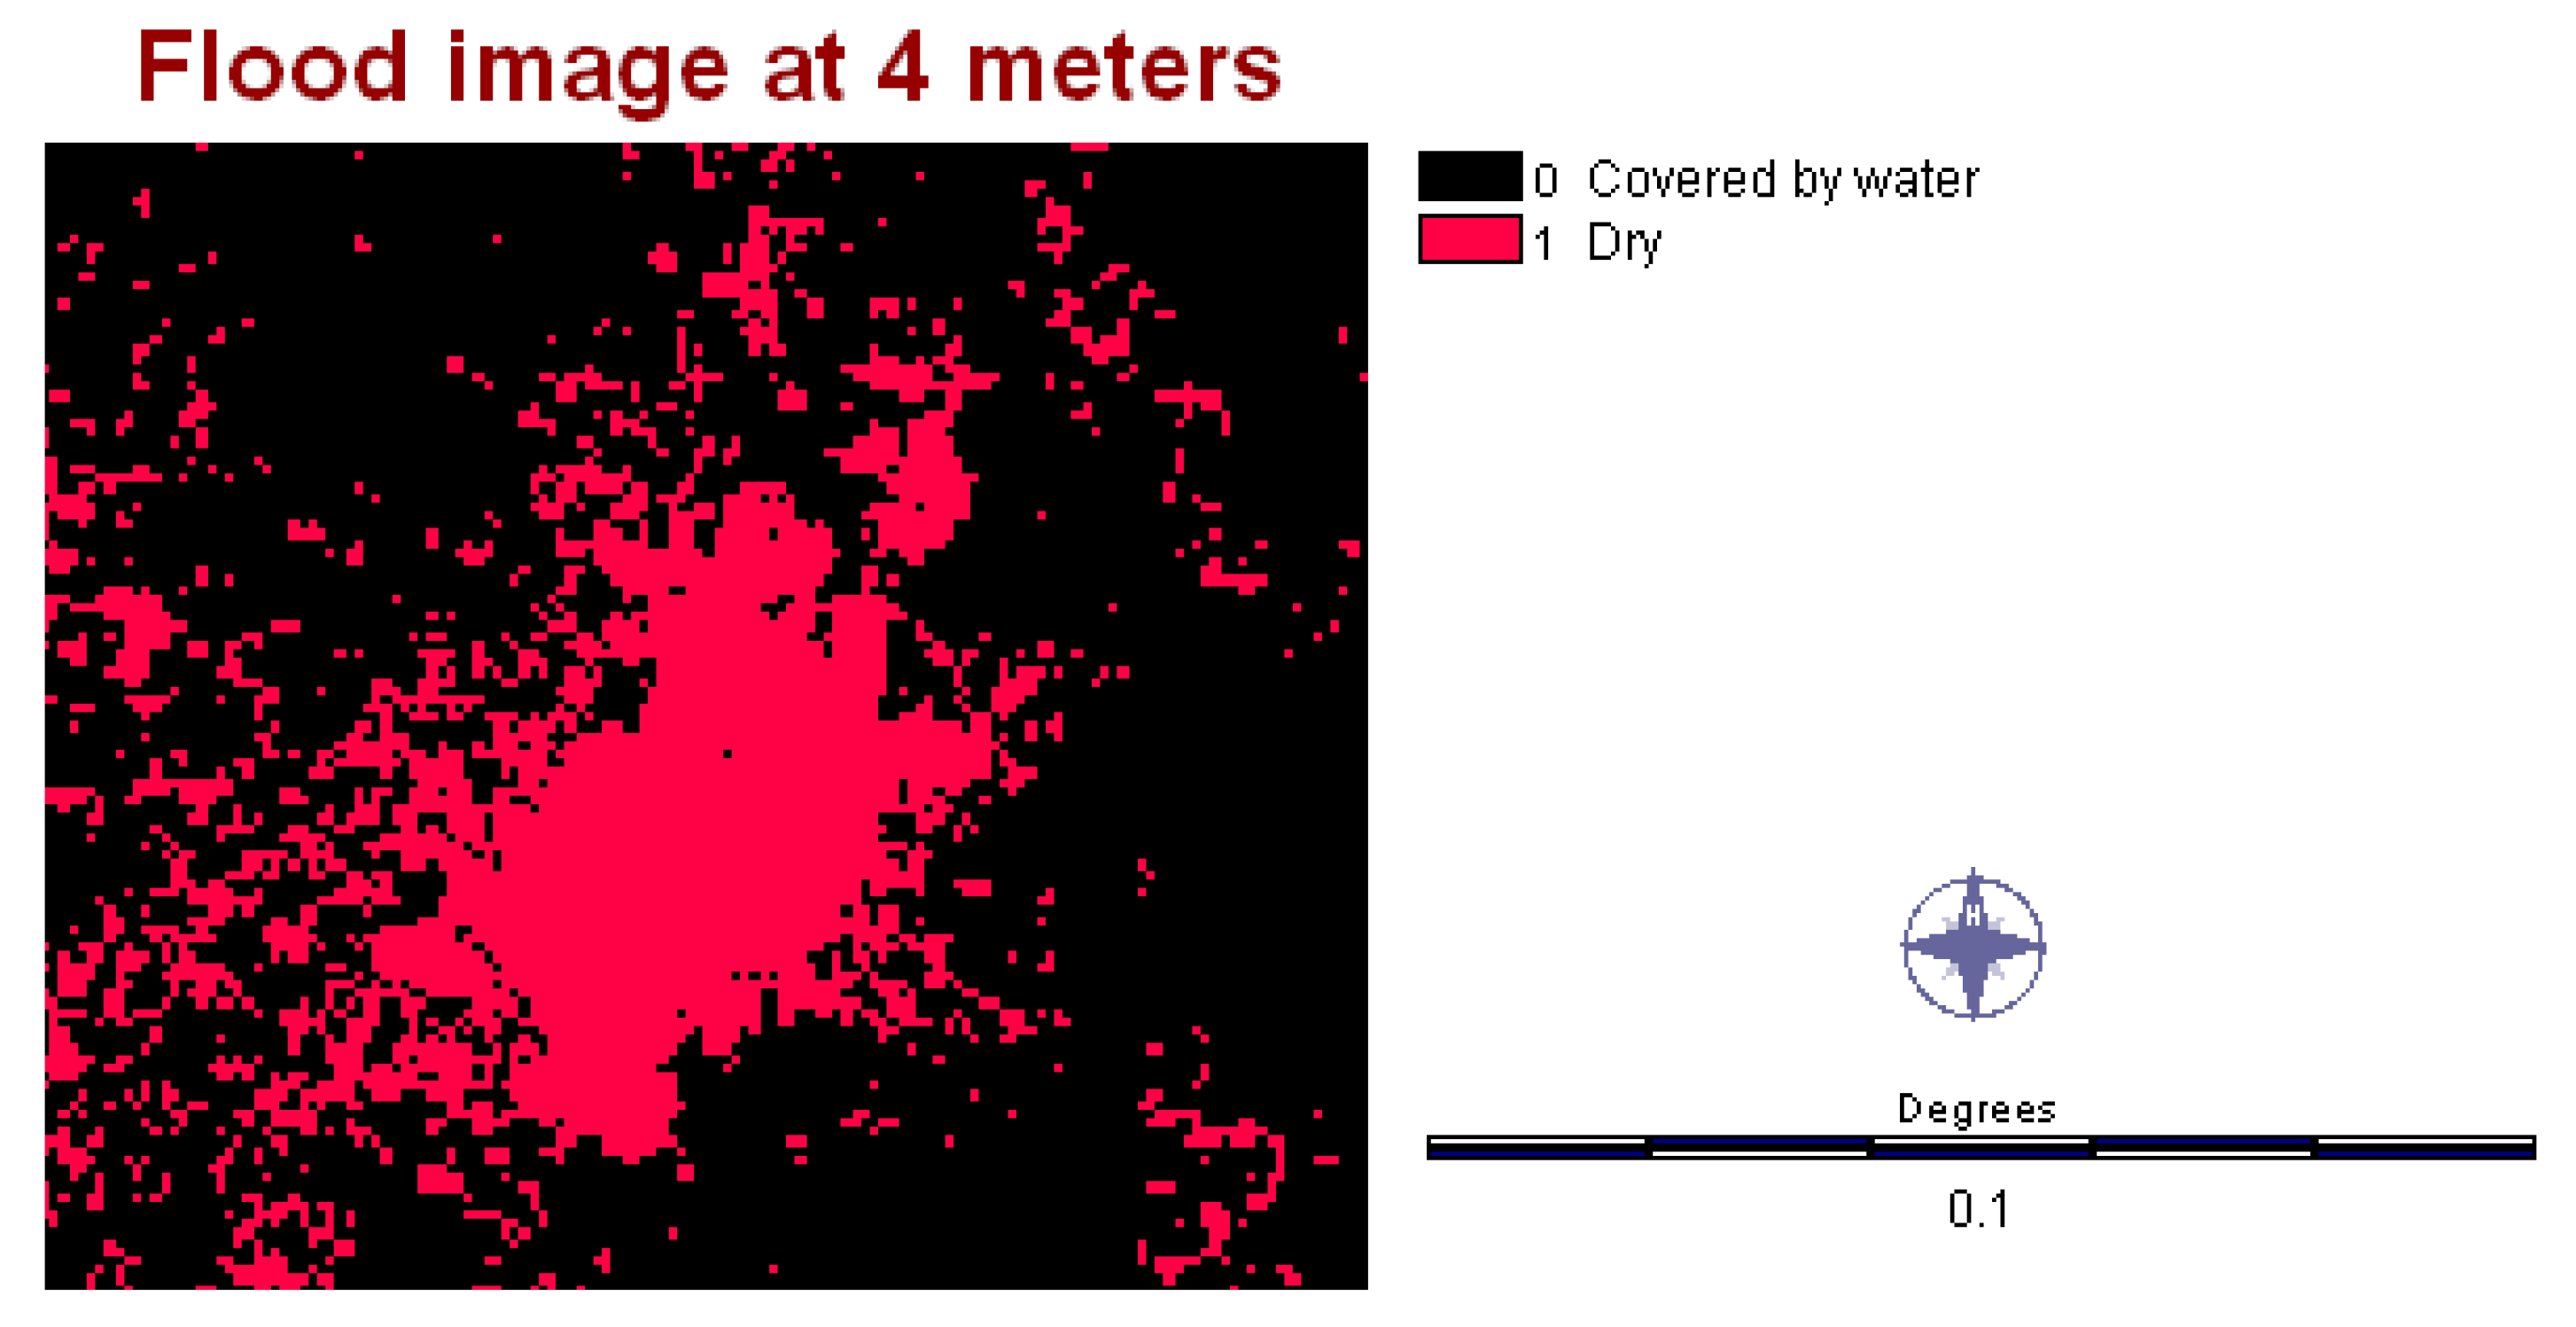
4.3. Validation
4.3.1. GIS for the Case of Veracruz
4.3.2. GIS for the Case of Villahermosa
4.3.3. Discussion and Summary of the Results from the Geographical Procedure
5. Comparison to the Real Circumstances
5.1. Veracruz
5.2. Villahermosa
5.3. Summary and Discussion
6. Conclusions
Acknowledgments
Author Contributions
Conflicts of Interest
References
- United Nations International Strategy for Disaster Reduction. Disaster Statistics. Available online: http://www.unisdr.org/we/inform/disaster-statistics (accessed on 13 February 2013).
- Independent Evaluation Group. Hazards of Nature, Risk to Development. An IEG Evaluation of World Bank Assistance for Natural Disasters; IEG: Washington, DC, USA, 2006; p. 181. [Google Scholar]
- Guha-Sapir, D.; Vos, F.; Below, R.; Ponserre, S. Annual Disaster Statistical Review 2011—The Numbers and Trends; Centre for Research on the Epidemiology of Disasters (CRED), Institute of Health and Society (IRSS) and Université catholique de Louvain: Brussels, Belgium, 2012. [Google Scholar]
- Cozzolino, A. Humanitarian logistics and supply chain management. In Humanitarian Logistics; Springer: Berlin, Germany, 2012; pp. 5–16. [Google Scholar]
- De Leeuw, S.; Vis, I.F.A.; Jonkman, S.N. Exploring logistics aspects of flood emergency measures. J. Conting. Crisis Manag. 2012, 20, 166–179. [Google Scholar] [CrossRef]
- Tehrany, M.S.; Pradhan, B.; Jebur, M.N. Spatial prediction of flood susceptible areas using rule based Decision Tree (DT) and a novel ensemble bivariate and multivariate statistical models in GIS. J. Hydrol. 2013, 504, 69–79. [Google Scholar] [CrossRef] [Green Version]
- Ajin, R.S.; Krishnamurthy, R.R.; Jayaprakash, M.; Vinod, P.G. Flood hazard assessment of vamanapuram river basin, Kerala, India: An approach using remote sensing & GIS techniques. Adv. Appl. Sci. Res. 2013, 4, 263–274. [Google Scholar]
- Patel, D.; Srivastava, P. Flood hazards mitigation analysis using remote sensing and GIS: Correspondence with town planning scheme. Water Resour. Manag. 2013, 27, 2353–2368. [Google Scholar] [CrossRef]
- Sarhadi, A.; Soltani, S.; Modarres, R. Probabilistic flood inundation mapping of ungauged rivers: Linking gis techniques and frequency analysis. J. Hydrol. 2012, 458–459, 68–86. [Google Scholar] [CrossRef]
- Kunz, N.; Reiner, G. A meta-analysis of humanitarian logistics research. J. Humanit. Logist. Supply Chain Manag. 2012, 2, 116–147. [Google Scholar] [CrossRef]
- Chang, M.-S.; Tseng, Y.-L.; Chen, J.-W. A scenario planning approach for the flood emergency logistics preparation problem under uncertainty. Transp. Res. Part E Logist. Transp. Rev. 2007, 43, 737–754. [Google Scholar] [CrossRef]
- Crowther, K.G. Risk-informed assessment of regional preparedness: A case study of emergency potable water for hurricane response in Southeast Virginia. Int. J. Crit. Infrastruct. Prot. 2010, 3, 83–98. [Google Scholar] [CrossRef]
- Altay, N.; Green, W.G. OR/MS research in disaster operations management. Eur. J. Oper. Res. 2006, 175, 475–493. [Google Scholar] [CrossRef]
- Diaz, C.; Isuhuaylas, V. Analisis de gran vision de las inundaciones en la cuenca alta del rio lerma: Caso de las subcuenca del rio Tejalpa, Estado de Mexico, Mexico. Ing. Hidrául. Méx. 2001, 16, 73–86. [Google Scholar]
- Ward, P.J.; de Moel, H.; Aerts, J.C.J.H.; Glade, T. How are flood risk estimates affected by the choice of return-periods? Nat. Hazards Earth Syst. Sci. 2011, 11, 3181–3195. [Google Scholar] [CrossRef]
- Esteves, L.S. Consequences to flood management of using different probability distributions to estimate extreme rainfall. J. Environ. Manag. 2013, 115, 98–105. [Google Scholar] [CrossRef] [PubMed]
- Liebscher, S.; Kirschstein, T.; Becker, C. The flood algorithm—A multivariate, self-organizing-map-based, robust location and covariance estimator. Stat. Comput. 2012, 22, 325–336. [Google Scholar] [CrossRef]
- Cova, T.J. GIS in emergency management. In Geographical Information Systems: Principles, Techniques, Management and Applications; Longley, P.A., Goodchild, M.F., Maguire, D.J., Rhind, D.W., Eds.; Wiley: New York, NY, USA, 1999; pp. 845–858. [Google Scholar]
- Horner, M.W.; Downs, J.A. Testing a flexible geographic information system-based network flow model for routing hurricane disaster relief goods. Transp. Res. Rec. 2007, 2022, 47–54. [Google Scholar] [CrossRef]
- Horner, M.W.; Downs, J.A. Optimizing hurricane disaster relief goods distribution: Model development and application with respect to planning strategies. Disasters 2010, 34, 821–844. [Google Scholar] [CrossRef] [PubMed]
- Martin, K. Modeling the impact of sea level rise in narraganset bay, rhode island. In Applications in Coastal Research and Management; UNITAR: Geneva, Switzerland, 1993; pp. 59–61. [Google Scholar]
- Rodríguez-Espíndola, O.; Gaytán, J. Scenario-based preparedness plan for floods. Nat. Hazards 2015, 76, 1241–1262. [Google Scholar] [CrossRef]
- Prathumchai, K.; Samarakoon, L. Application of remote sensing and GIS techniques for flood vulnerability and mitigation planning in munshiganj district of bangladesh. In Proceedings of the 25th Asian Conference on Remote Sensing, Hanoi, Vietnam, 7–11 November 2005.
- El-Anwar, O.; El-Rayes, K.; Elnashai, A. An automated system for optimizing post-disaster temporary housing allocation. Autom. Constr. 2009, 18, 983–993. [Google Scholar] [CrossRef]
- El-Anwar, O.; El-Rayes, K.; Elnashai, A. Multi-objective optimization of temporary housing for the 1994 northridge earthquake. J. Earthq. Eng. 2008, 12, 81–91. [Google Scholar] [CrossRef]
- Saadatseresht, M.; Mansourian, A.; Taleai, M. Evacuation planning using multiobjective evolutionary optimization approach. Eur. J. Oper. Res. 2009, 198, 305–314. [Google Scholar] [CrossRef]
- Alçada-Almeida, L.; Tralhão, L.; Santos, L.; Coutinho-Rodrigues, J. A multiobjective approach to locate emergency shelters and identify evacuation routes in urban areas. Geogr. Anal. 2009, 41, 9–29. [Google Scholar] [CrossRef]
- Coutinho-Rodrigues, J.; Tralhão, L.; Alçada-Almeida, L. Solving a location-routing problem with a multiobjective approach: The design of urban evacuation plans. J. Transp. Geogr. 2012, 22, 206–218. [Google Scholar] [CrossRef]
- Chanta, S.; Sangsawang, O. Shelter-site selection during flood disaster. Lect. Notes Manag. Sci. 2012, 4, 282–288. [Google Scholar]
- Dekle, J.; Lavieri, M.S.; Martin, E.; Emir-Farinas, H.L.; Francis, R.L. A florida county locates disaster recovery centers. Interfaces 2005, 35, 133–139. [Google Scholar] [CrossRef]
- Tzeng, G.-H.; Cheng, H.-J.; Huang, T.D. Multi-objective optimal planning for designing relief delivery systems. Transp. Res. Part E Logist. Transp. Rev. 2007, 43, 673–686. [Google Scholar] [CrossRef]
- Maliszewski, P.J.; Horner, M.W. A spatial modeling framework for siting critical supply infrastructures*. Prof. Geogr. 2010, 62, 426–441. [Google Scholar] [CrossRef]
- Widener, M.J.; Horner, M.W. A hierarchical approach to modeling hurricane disaster relief goods distribution. J. Transp. Geogr. 2011, 19, 821–828. [Google Scholar] [CrossRef]
- Teixeira, J.C.; Antunes, A.P. A hierarchical location model for public facility planning. Eur. J. Oper. Res. 2008, 185, 92–104. [Google Scholar] [CrossRef]
- Salman, F.S.; Yücel, E. Emergency facility location under random network damage: Insights from the istanbul case. Comput. Oper. Res. 2015, 62, 266–281. [Google Scholar] [CrossRef]
- Barzinpour, F.; Esmaeili, V. A multi-objective relief chain location distribution model for urban disaster management. Int. J. Adv. Manuf. Technol. 2014, 70, 1291–1302. [Google Scholar] [CrossRef]
- Esmaeili, V.; Barzinpour, F. Integrated decision making model for urban disaster management: A multi-objective genetic algorithm approach. Int. J. Ind. Eng. Comput. 2014, 5, 55–70. [Google Scholar] [CrossRef]
- Zhao, M.; Chen, Q. Risk-based optimization of emergency rescue facilities locations for large-scale environmental accidents to improve urban public safety. Nat. Hazards 2015, 75, 163–189. [Google Scholar] [CrossRef]
- Ahmadi, M.; Seifi, A.; Tootooni, B. A humanitarian logistics model for disaster relief operation considering network failure and standard relief time: A case study on san francisco district. Transp. Res. Part E Logist. Transp. Rev. 2015, 75, 145–163. [Google Scholar] [CrossRef]
- Rodríguez-Espíndola, O.; Albores, P.; Brewster, C. A multi-agency perspective to disaster preparedness. In Proceedings of the 12th International Conference on Information Systems for Crisis Response and Management, Kristiansand, Norway, 24–27 May 2015.
- Radke, J.; Cova, T.; Sheridan, M.F.; Troy, A.; Mu, L.; Johnson, R. Application challenges for geographic information science: Implications for research, education, and policy for emergency preparedness and response. J. Uran Reg. Inf. Sci. Assoc. 2000, 12, 15–30. [Google Scholar]
- Van Westen, C.J. Remote sensing and geographical information systems for natural disaster management. In Environmental Modelling with GIS and Remote Sensing; Skidmore, A., Ed.; CRC Press: London, UK, 2002; pp. 211–226. [Google Scholar]
- Jian-Kun, H.; Bin, Y.; Jie, W.; Zhi-Huan, W.; Zhi-Hua, H. GIS-based safe area discovery for emergency logistics. In Proceedings of the 2nd IEEE International Conference on Information Management & Engineering (ICIME), Chengdu, China, 16–18 April 2010; pp. 98–101.
- Chang, K.-T. Introduction to Geographic Information Systems; McGraw-Hill: Boston, MA, USA; London, UK, 2002. [Google Scholar]
- Delaney, J. Geographical Information Systems: An Introduction; Oxford University Press: Oxford, UK, 1999. [Google Scholar]
- Tomlin, C.D. GIS and Cartographic modelling. In Geographic Information Systems and Science, 1st ed.; Longley, P., Ed.; Wiley: Hoboken, NJ, USA, 1991. [Google Scholar]
- Burrough, P.A. Principles of Geographical Information Systems for Land Resources Assessment; Clarendon Press: Oxford, UK, 1986. [Google Scholar]
- McConnan, I. Humanitarian Charter and Minimum Standards in Humanitarian Response; The Sphere Project: Geneva, Switzerland, 2011; p. 402. [Google Scholar]
- Centro Nacional de Prevención de Desastres (CENAPRED). Activación de refugios temporales y atención a damnificados; CENAPRED: Ciudad de México, Mexico, 2009. [Google Scholar]
- Kongsomsaksakul, S.; Chen, A.; Yang, C. Shelter location-allocation model for flood evacuation planning. J. Eastern Asia Soc. Transp. Stud. 2005, 6, 4237–4252. [Google Scholar]
- Alam, J.B. Concept of flood shelter and its planning to cope with flood, Village Infrastructure to Cope with the Environment, Dhaka and Exeter, November 2000; Seraj, S.M., Hodgson, R.L., Ahmed, K.I., Eds.; Bangladesh University of Engineering and Technology and The Housing and Hazard Group: Dhaka, Bengal; Exeter, UK.
- Xu, W.; Okada, N.; Takeuchi, Y.; Kajitani, Y. A diagnosis model for disaster shelter planning from the viewpoint of local people: Case study of nagata ward in kobe city, hyogo prefecture, Japan. Annu. Disaster Prev. Res. Inst. 2007, 1, 233–239. [Google Scholar]
- Secretaría de Salud (SSA). Prácticas de higiene y sanidad para el proceso de alimentos, bebidas no alcohólicas y alcohólicas. In NOM-120-SSA1-1994; Health_Ministry: Mexico City, Mecico, 1994. [Google Scholar]
- Simav, Ö.; Şeker, D.Z.; Gazioǧlu, C. Coastal inundation due to sea level rise and extreme sea state and its potential impacts: Çukurova delta case. Turk. J. Earth Sci. 2013, 22, 671–680. [Google Scholar]
- Isma’il, M.; Opeluwa Saanyol, I. Application of Remote Sensing (RS) and Geographic Information Systems (GIS) in flood vulnerability mapping: Case study of River Kaduna. Int. J. Geomat. Geosci. 2013, 3, 618–627. [Google Scholar]
- Bhatt, C.M.; Srinivasa Rao, G.; Begum, A.; Manjusree, P.; Sharma, S.V.S.P.; Prasanna, L.; Bhanumurthy, V. Satellite images for extraction of flood disaster footprints and assessing the disaster impact: Brahmaputra floods of June–July 2012, Assam, India. Curr. Sci. 2013, 104, 1692–1700. [Google Scholar]
- Theiling, C.H.; Burant, J.T. Flood inundation mapping for integrated floodplain management: Upper Mississippi river system. River Res. Appl. 2013, 29, 961–978. [Google Scholar] [CrossRef]
- Qi, H.; Qi, P.; Altinakar, M.S. GIS-based spatial monte carlo analysis for integrated flood management with two dimensional flood simulation. Water Resour. Manag. 2013, 27, 3631–3645. [Google Scholar] [CrossRef]
- Rawat, P.K.; Pant, C.C.; Tiwari, P.C.; Pant, P.D.; Sharma, A.K. Spatial variability assessment of river-line floods and flash floods in himalaya a case study using GIS. Disaster Prev. Manag. 2012, 21, 135–159. [Google Scholar] [CrossRef]
- Paiva, R.C.D.; Collischonn, W.; Tucci, C.E.M. Large scale hydrologic and hydrodynamic modeling using limited data and a GIS based approach. J. Hydrol. 2011, 406, 170–181. [Google Scholar] [CrossRef]
- Waisurasingha, C.; Aniya, M.; Hirano, A.; Sang-Arun, J.; Sommut, W. Application of remote sensing and gis for improving rice production in flood-prone areas: A case study in lower chi-river basin, Thailand. Jpn. Agric. Res. Q. 2008, 42, 193–201. [Google Scholar] [CrossRef]
- Dutta, D.; Alam, J.; Umeda, K.; Hayashi, M.; Hironaka, S. A two-dimensional hydrodynamic model for flood inundation simulation: A case study in the lower mekong river basin. Hydrol. Process. 2007, 21, 1223–1237. [Google Scholar] [CrossRef]
- Overton, I.C. Modelling floodplain inundation on a regulated river: Integrating GIS, remote sensing and hydrological models. River Res. Appl. 2005, 21, 991–1001. [Google Scholar] [CrossRef]
- Chang, T.-J.; Hsu, M.-H.; Teng, W.-H.; Huang, C.-J. A GIS-assisted distributed watershed model for simulating flooding and inundation1. J. Am. Water Resour. Assoc. 2000, 36, 975–988. [Google Scholar] [CrossRef]
- Warshall, S. A theorem on boolean matrices. J. ACM 1962, 9, 11–12. [Google Scholar] [CrossRef]
- Floyd, R.W. Algorithm 97: Shortest path. Commun. ACM 1962, 5. [Google Scholar] [CrossRef]
- Aini, A.; Salehipour, A. Speeding up the floyd–warshall algorithm for the cycled shortest path problem. Appl. Math. Lett. 2012, 25, 1–5. [Google Scholar] [CrossRef]
- Höfner, P.; Möller, B. Dijkstra, floyd and warshall meet kleene. Form. Asp. Comput. 2012, 24, 459–476. [Google Scholar] [CrossRef]
- Instituto Mexicano de Tecnología del Agua (IMTA). Informe de las Inundaciones de 2007 en Tabasco. Diagnóstico Preeliminar; Hidráulicos, C.D.A., Ed.; IMTA: México City, México, 2008; p. 16. [Google Scholar]
- Instituto de Seguridad Social del Estado de Tabasco (ISSET). Information Request #06400914; Instituto de Seguridad Social del Estado de Tabasco: Tabasco, Mexico, 2014; p. 2. [Google Scholar]
- Secretaría de Gobernación (SEGOB). Information Request #06645414; Secretaría de Gobernación: Tabasco, Mexico, 2014. [Google Scholar]
- No Rest for Flood-Ravaged Mexico as New Storm Hits. Available onlline: https://www.rnw.org/archive/no-rest-flood-ravaged-mexico-new-storm-hits (accessed on 30 December 2015).
- Secretaría de Salud (SSA). Information Request #00430314; Secretaría de Salud de Tabasco: Tabasco, México, 2014. [Google Scholar]
- Secretaría de la Defensa Nacional. Information Request #0000700097414; Secretaría de la Defensa Nacional (SEDENA): Mexico city, Mexico, 2014. [Google Scholar]
- Protección Civil de Veracruz. Information Request #0043114; Protección Civil de Veracruz (CPV): Veracruz, México, 2010. [Google Scholar]
- Diagnóstico. Tipos de tráfico. Available online: http://caaarem.mx/Bases/Noticias07_09.nsf/b87c734d69cddd80862573da005c3979/4a871e86bd66c1e78625760200821155/$FILE/Capitulo%203.pdf (accessed on 30 December 2015).
- Programme des Nations Unies pour le développement (PNUD). Agua y Desarrollo. Agenda Municipal Para la Igualdad de Género; PNUD: México, Mexico, 2011; p. 92. [Google Scholar]
- Prontuario de información geográfica municipal de los Estados Unidos Mexicanos. Available onlline: http://www3.inegi.org.mx/sistemas/mexicocifras/datos-geograficos/30/30193.pdf (accessed on 30 December 2015).
- INEGI Scince versión 05/2012. Available onlline: http://www.inegi.org.mx/est/scince/scince2010.aspx (accessed on 30 December 2015).
- United States Geological Survey (USGS). Hydrosheds. Available online: http://gisdata.usgs.gov/website/HydroSHEDS (accessed on 10 April 2011).
- Stewart, S. Hurricane Karl Tropical Cyclone Report; National Hurricane Center: Miami, FL, USA, 2011; p. 17. [Google Scholar]
- Instituto Nacional de Estadística y Geografía (INEGI). Modelos Digitales de Elevación. Available online: http://www.inegi.org.mx/geo/contenidos/datosrelieve/continental/queesmde.aspx (accessed on 19 May 2015).
- Secretaría de Gobernación (SEGOB). Information Request #0000400233914; Secretaría de Gobernación: Mexico City, Mexico, 2014. [Google Scholar]
- Secretaría de Salud de Veracruz (SSV). Information Request #00430314; Secretaría de Salud de Veracruz: Veracruz, Mexico, 2014. [Google Scholar]
- Protección Civil del Estado de Veracruz. Information Request #00430114; Protección Civil del Estado de Veracruz: Veracruz, Mexico, 2014; p. 2. [Google Scholar]
- Secretaría de la Defensa Nacional (SEDENA). Information Request #0000700097714; Secretaría de la Defensa Nacional: Mexico City, Mexico, 2014. [Google Scholar]
- Diconsa. Information Request #20150000010114; Diconsa: Mexico city, Mexico, 2014. [Google Scholar]
- Protección Civil del Estado de Veracruz (PCV). Information Request #00431314; PCV: Veracruz, Mexico, 2014. [Google Scholar]
- Secretaría de la Defensa Nacional (SEDENA). Appendix of the Interview; Optva, S., Ed.; SEDENA: México, Mexico, 2010; p. 4. [Google Scholar]
- Google Earth. Available online: https://www.google.com/earth/ (accessed on 30 December 2015).
- Secretaría de Marina (SEMAR). Villahermosa, Tabasco; Secretaría de Marina: Mexico city, Mexico, 2015; p. 16. [Google Scholar]
- Comisión Económica para Latin America y el Caribe. Características e Impacto Socioeconómico de las Lluvias Extremas de 2008; CEPAL: Vitacura, Chile, 2011; p. 149. [Google Scholar]
- Programme des Nations Unies pour le développement (PNUD). Inundaciones en Tabasco 2009, Institucionalización de la Prevención en Las Tareas de Recuperación; United Nations: Mexico City, Mexico, 2009. [Google Scholar]
- Secretaría de Gobierno (SEGOB); Gobierno_del_Estado_de_Tabasco; Comisión Económica para Latin America y el Caribe (CEPAL); Centro Nacional para la Prevención de Desastres (CENAPRED). Tabasco: Características e impacto socioeconómico de las inundaciones provocadas a finales de octubre y a comienzos de noviembre de 2007 por el frente frío número 4; Comisión Económica para Latin America y el Caribe (CEPAL): Vitacura, Chile, 2008; p. 231. [Google Scholar]
- International Federation of Red Cross and Red Crescent. Mexico: Floods. Dref bulletin No. Mdrmx002 Glide: Fl-2007–000200-mex; IFRCRCS: Mexico City, Mexico, 2 November 2007. [Google Scholar]
- Dirección de Protección Civil. del Estado de Tabasco (PCT). Information Request #06401914; Dirección de Protección Civil. del Estado de Tabasco: Tabasco, México, 2014. [Google Scholar]
- Secretaría de la Defensa Nacional (SEDENA). Information Request #0000700144114; Secretaría de la Defensa Nacional: Mexico City, México, 2014. [Google Scholar]
- NASA. Flooding in southern mexico. Available online: http://earthobservatory.nasa.gov/NaturalHazards/view.php?id=45900 (accessed on 17 December 2015).
- Secretaría de Marina (SEMAR). Information Request #0001300043214; Secretaría de Marina: Mexico City, Mexico, 2014. [Google Scholar]
- Centro Nacional para la Prevención de Desastres (CENAPRED). Information Request #0413000000214; Centro Nacional para la Prevención de Desastres: Mexico city, Mexico, 2014. [Google Scholar]
- Hernández, J.; Santos, R.; Preciado, J.C.; Robles, V.; Rochin, R. Areas Inundadas en Villahermosa Tabasco Basado en el Modelo Digital de Elevación y la Presencia de Diques; National Institute of Public Health of Mexico: Cuernavaca, Mexico, 2007. [Google Scholar]
- Santos-Reyes, J.; Alvarado-Corona, R.; Olmos-Peña, S. Learning from tabasco’s floods by applying mort. Saf. Sci. 2010, 48, 1351–1360. [Google Scholar] [CrossRef]
- Santos-Reyes, J.; Beard, A.N. Applying the sdms model to the analysis of the tabasco flood disaster in mexico. Hum. Ecol. Risk Assess. 2011, 17, 646–677. [Google Scholar] [CrossRef]
- Feng, C.-C.; Wang, Y.-C. Giscience research challenges for emergency management in southeast asia. Nat. Hazards 2011, 59, 597–616. [Google Scholar] [CrossRef]
- Wang, Q.; Guo, H.; Chen, Y.; Lin, Q.; Li, H. Application of remote sensing for investigating mining geological hazards. Int. J. Digit. Earth 2013, 6, 449–468. [Google Scholar] [CrossRef]
- Kaiser, R.; Spiegel, P.B.; Henderson, A.K.; Gerber, M.L. The application of geographic information systems and global positioning systems in humanitarian emergencies: Lessons learned, programme implications and future research. Disasters 2003, 27, 127–140. [Google Scholar] [CrossRef] [PubMed]
- Lee, I.; Lee, K.; Torpelund-Bruin, C. Raster voronoi tessellation and its application to emergency modeling. Geo-spat. Inf. Sci. 2011, 14, 235–245. [Google Scholar]


| - | Requirement | CENAPRED | Sphere Project |
|---|---|---|---|
| Conditions | Total space available per person | - | 45 m2 |
| Minimum volume of air per person | 10.0 m3 | - | |
| Minimum distance between beds | 0.75 m | - | |
| Minimum covered floor area | 3.5 m2 | 3.5 m2 | |
| Personal hygiene | Washbasin | One per 10 people | - |
| Shower | One per 50 people (warm weather), one per 30 people (hot weather) | - | |
| Hygiene facilities | Separate sections for male and female | - | |
| Toilets | Female | One per 25 woman | - |
| Male | One toilet and one urinal per 35 males | - | |
| Minimum distance between buildings | 50 m | - |
| Section | Requirement |
|---|---|
| Courtyard |
|
| Building |
|
| Floors |
|
| Walls |
|
| Ceilings |
|
| Windows |
|
| Doors |
|
| Hygiene |
|
| Ventilation |
|
| Year | Location (City, State, Country) | Description |
|---|---|---|
| 2007 | Villahermosa, Tabasco, Mexico | Flood depth: 4 m [69] Start and end date: 29 October 2007–23 May 2008 Number of people sheltered: 99,000 [70,71] |
| 2010 | Veracruz, Veracruz, Mexico | Flood depth: 1.5 m [72] Start and end date: 19 September 2010–19 October 2010 Number of people sheltered: 5140 [73,74,75] |
| Percentage of Damage | 0.5 m | 1.5 m | 2.5 m |
|---|---|---|---|
| Not affected | 247 | 235 | 212 |
| 1 < x < 10 | 22 | 21 | 28 |
| 10 < x < 20 | 13 | 11 | 11 |
| 20 < x < 30 | 8 | 7 | 9 |
| 30 < x < 40 | 6 | 7 | 8 |
| 40 < x < 50 | 4 | 6 | 5 |
| 50 < x < 60 | 1 | 6 | 5 |
| 60 < x < 70 | 2 | 7 | 8 |
| 70 < x < 80 | 3 | 1 | 9 |
| 80 < x < 90 | 1 | 4 | 5 |
| 90 < x | 8 | 10 | 15 |
| Level of Damage | 1 m | 2 m | 4 m |
|---|---|---|---|
| Not affected | 47 | 32 | 18 |
| 1 < x < 10 | 35 | 27 | 14 |
| 10 < x < 20 | 10 | 12 | 8 |
| 20 < x < 30 | 13 | 13 | 11 |
| 30 < x < 40 | 11 | 7 | 6 |
| 40 < x < 50 | 6 | 16 | 3 |
| 50 < x < 60 | 6 | 8 | 15 |
| 60 < x < 70 | 7 | 8 | 12 |
| 70 < x < 80 | 4 | 6 | 10 |
| 80 < x < 90 | 0 | 6 | 13 |
| 90 < x | 8 | 12 | 37 |
| ID | Cost (mxn) | Unfulfilled (%) | Shelters Endangered | People at Risk | DCs Affected |
|---|---|---|---|---|---|
| VNG1 | 1,289,382.25 | 90.57 | 2 | 568 | 1 |
| VNG2 | 1,314,943.16 | 89.71 | 3 | 615 | 1 |
| VNG3 | 1,457,745.88 | 78.26 | 1 | 62 | 0 |
| VNG4 | 1,596,843.04 | 69.57 | 2 | 224 | 1 |
| VNG5 | 1,738,612.65 | 60.23 | 1 | 282 | 0 |
| VNG6 | 1,879,685.44 | 52.82 | 2 | 352 | 0 |
| VNG7 | 2,020,920.35 | 39.5 | 2 | 490 | 0 |
| VNG8 | 2,161,081.47 | 27.18 | 2 | 568 | 0 |
| VNG9 | 2,302,564.41 | 22.6 | 0 | 0 | 0 |
| VNG10 | 2,443,454.81 | 11.84 | 0 | 0 | 0 |
| VNG11 | 2,550,565.24 | 6.22 | 2 | 565 | 0 |
| VNG12 | 2,572,117.95 | 4.46 | 0 | 0 | 0 |
| VNG13 | 2,577,332.72 | 4.37 | 0 | 0 | 0 |
| VNG14 | 2,578,529.58 | 4.33 | 0 | 0 | 0 |
| VNG15 | 2,584,964.49 | 4.29 | 0 | 0 | 0 |
| VNG16 | 2,602,335.43 | 4.21 | 1 | 290 | 0 |
| VNG17 | 2,625,476.88 | 4.12 | 0 | 0 | 0 |
| VNG18 | 2,636,437.79 | 4.07 | 0 | 0 | 0 |
| VNG19 | 2,639,966.91 | 4.03 | 0 | 0 | 0 |
| VNG20 | 2,689,884.41 | 3.86 | 0 | 0 | 0 |
| VNG21 | 2,862,202.03 | 3.75 | 0 | 0 | 1 |
| VNG22 | 3,142,947.2 | 2.87 | 0 | 0 | 0 |
| VNG23 | 3,157,023.09 | 2.43 | 0 | 0 | 0 |
| VNG24 | 3,388,740.71 | 2.16 | 0 | 0 | 0 |
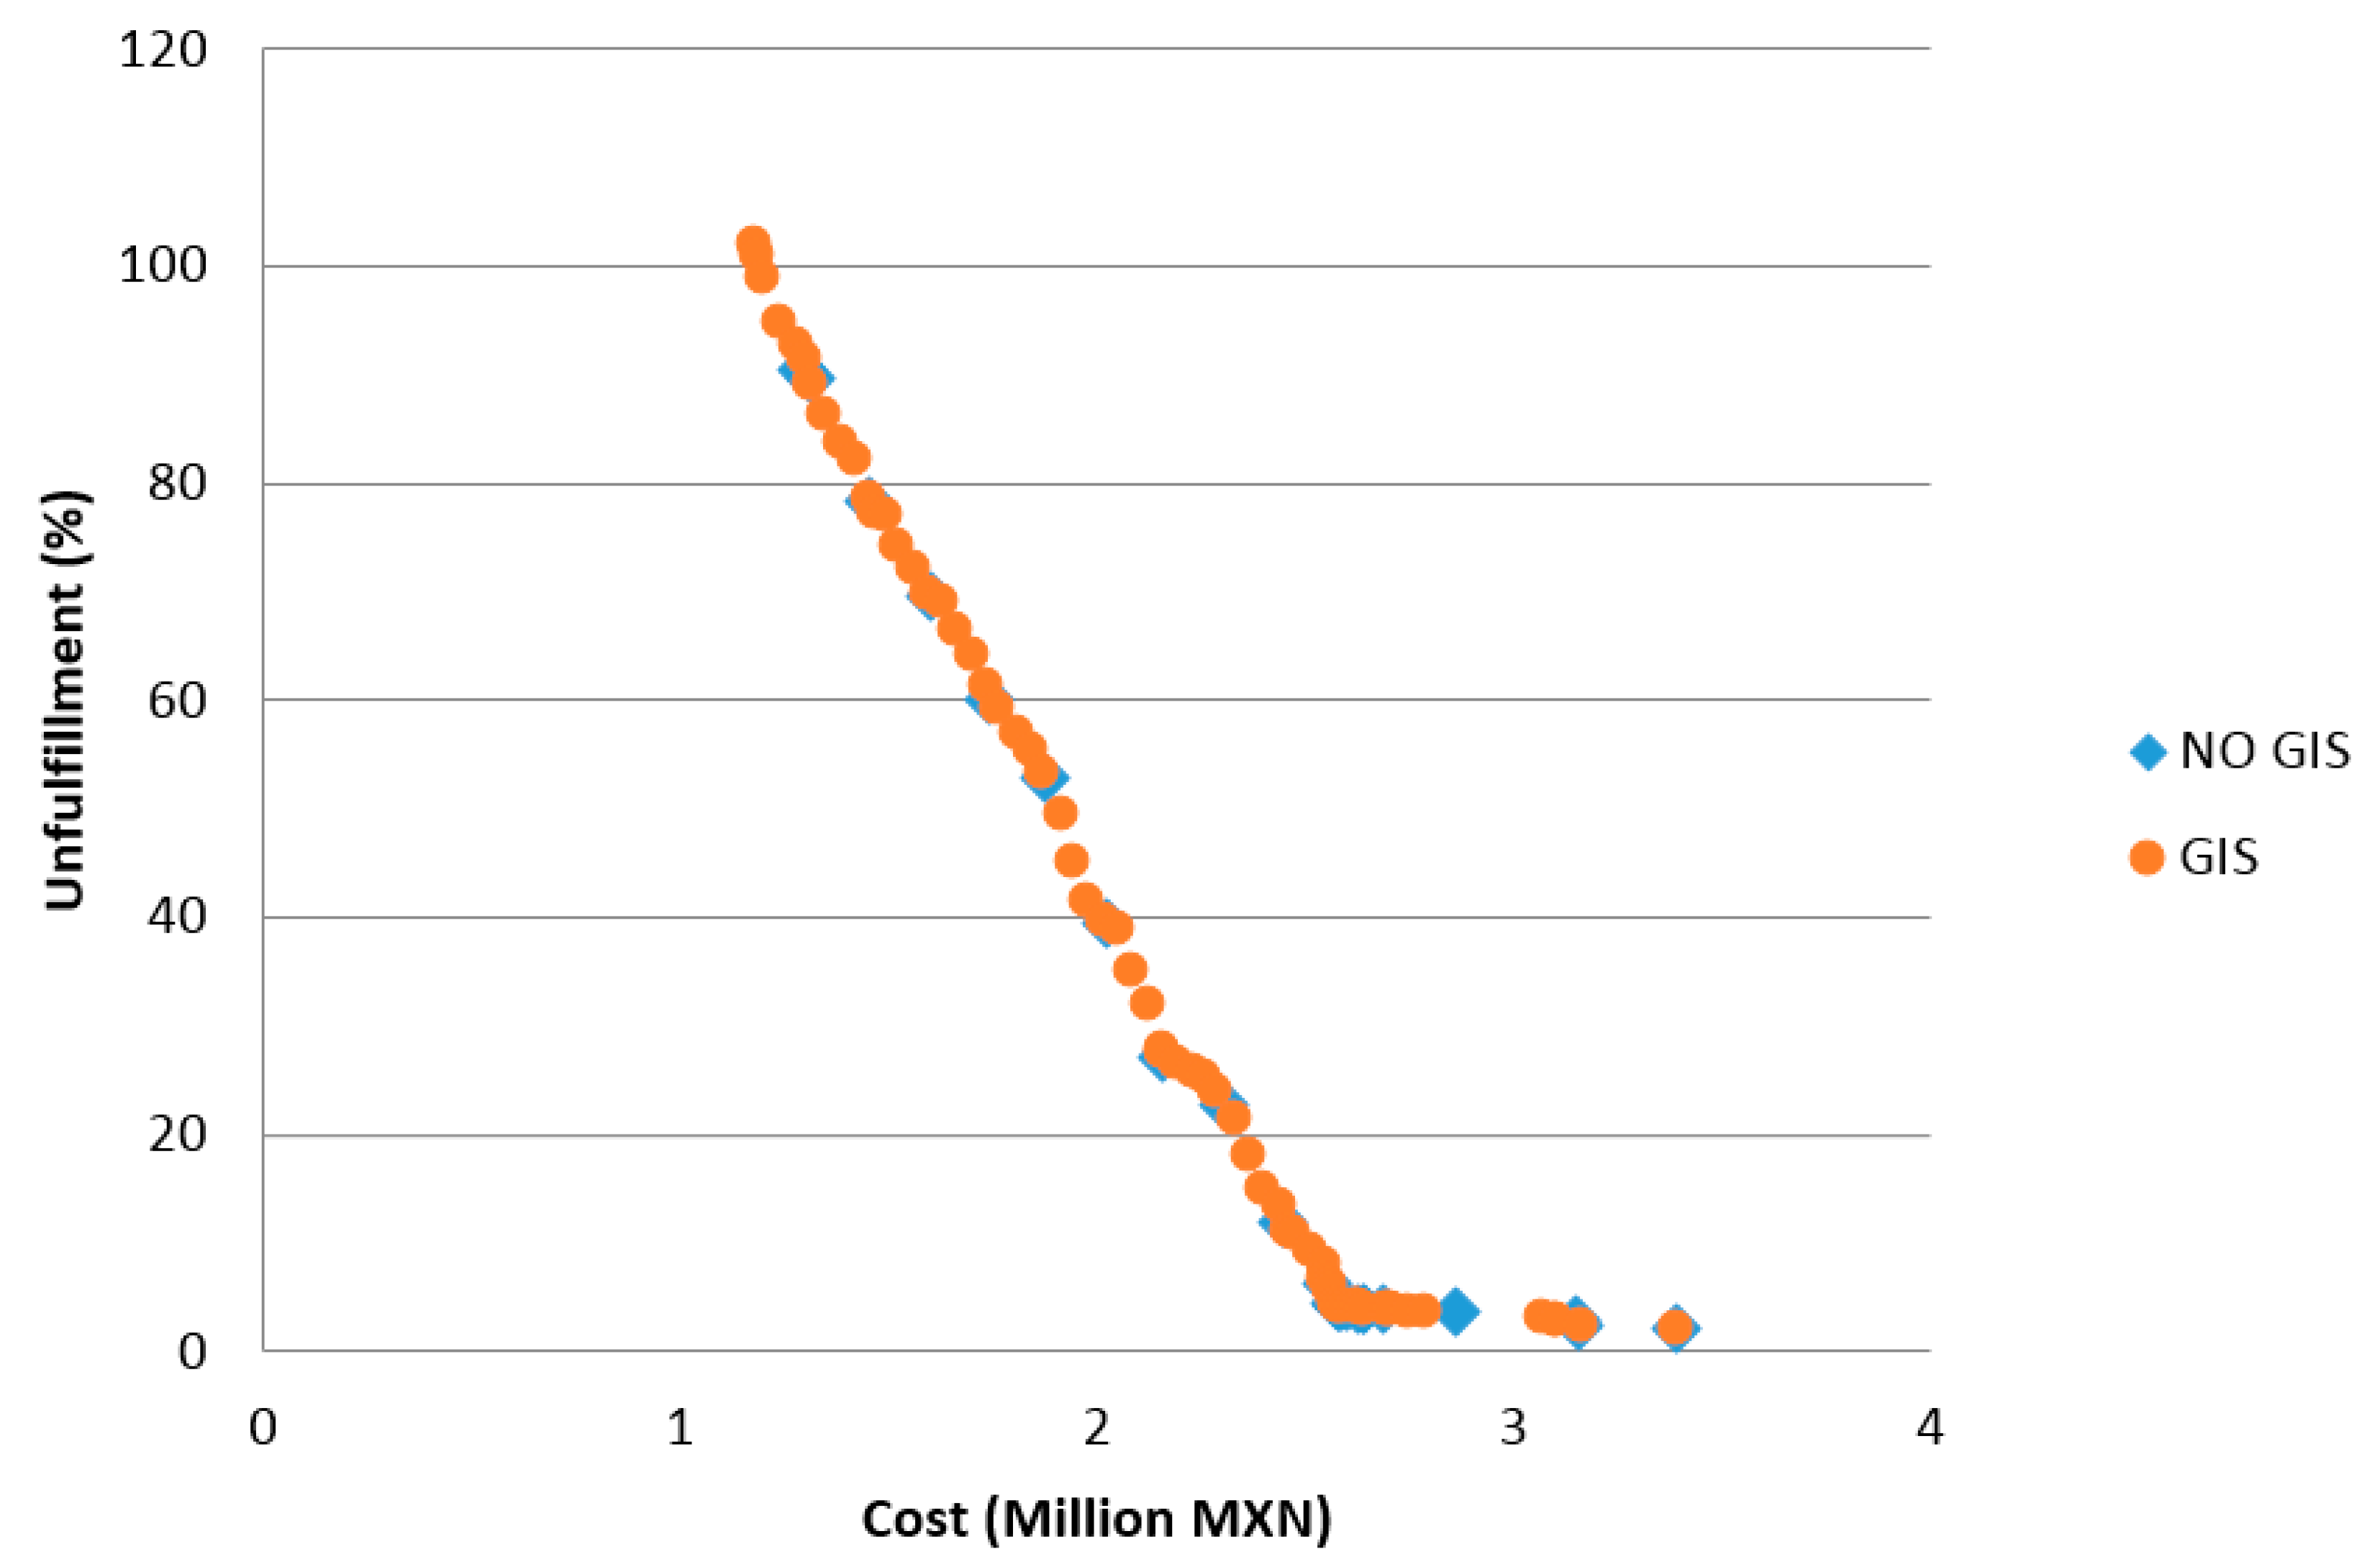
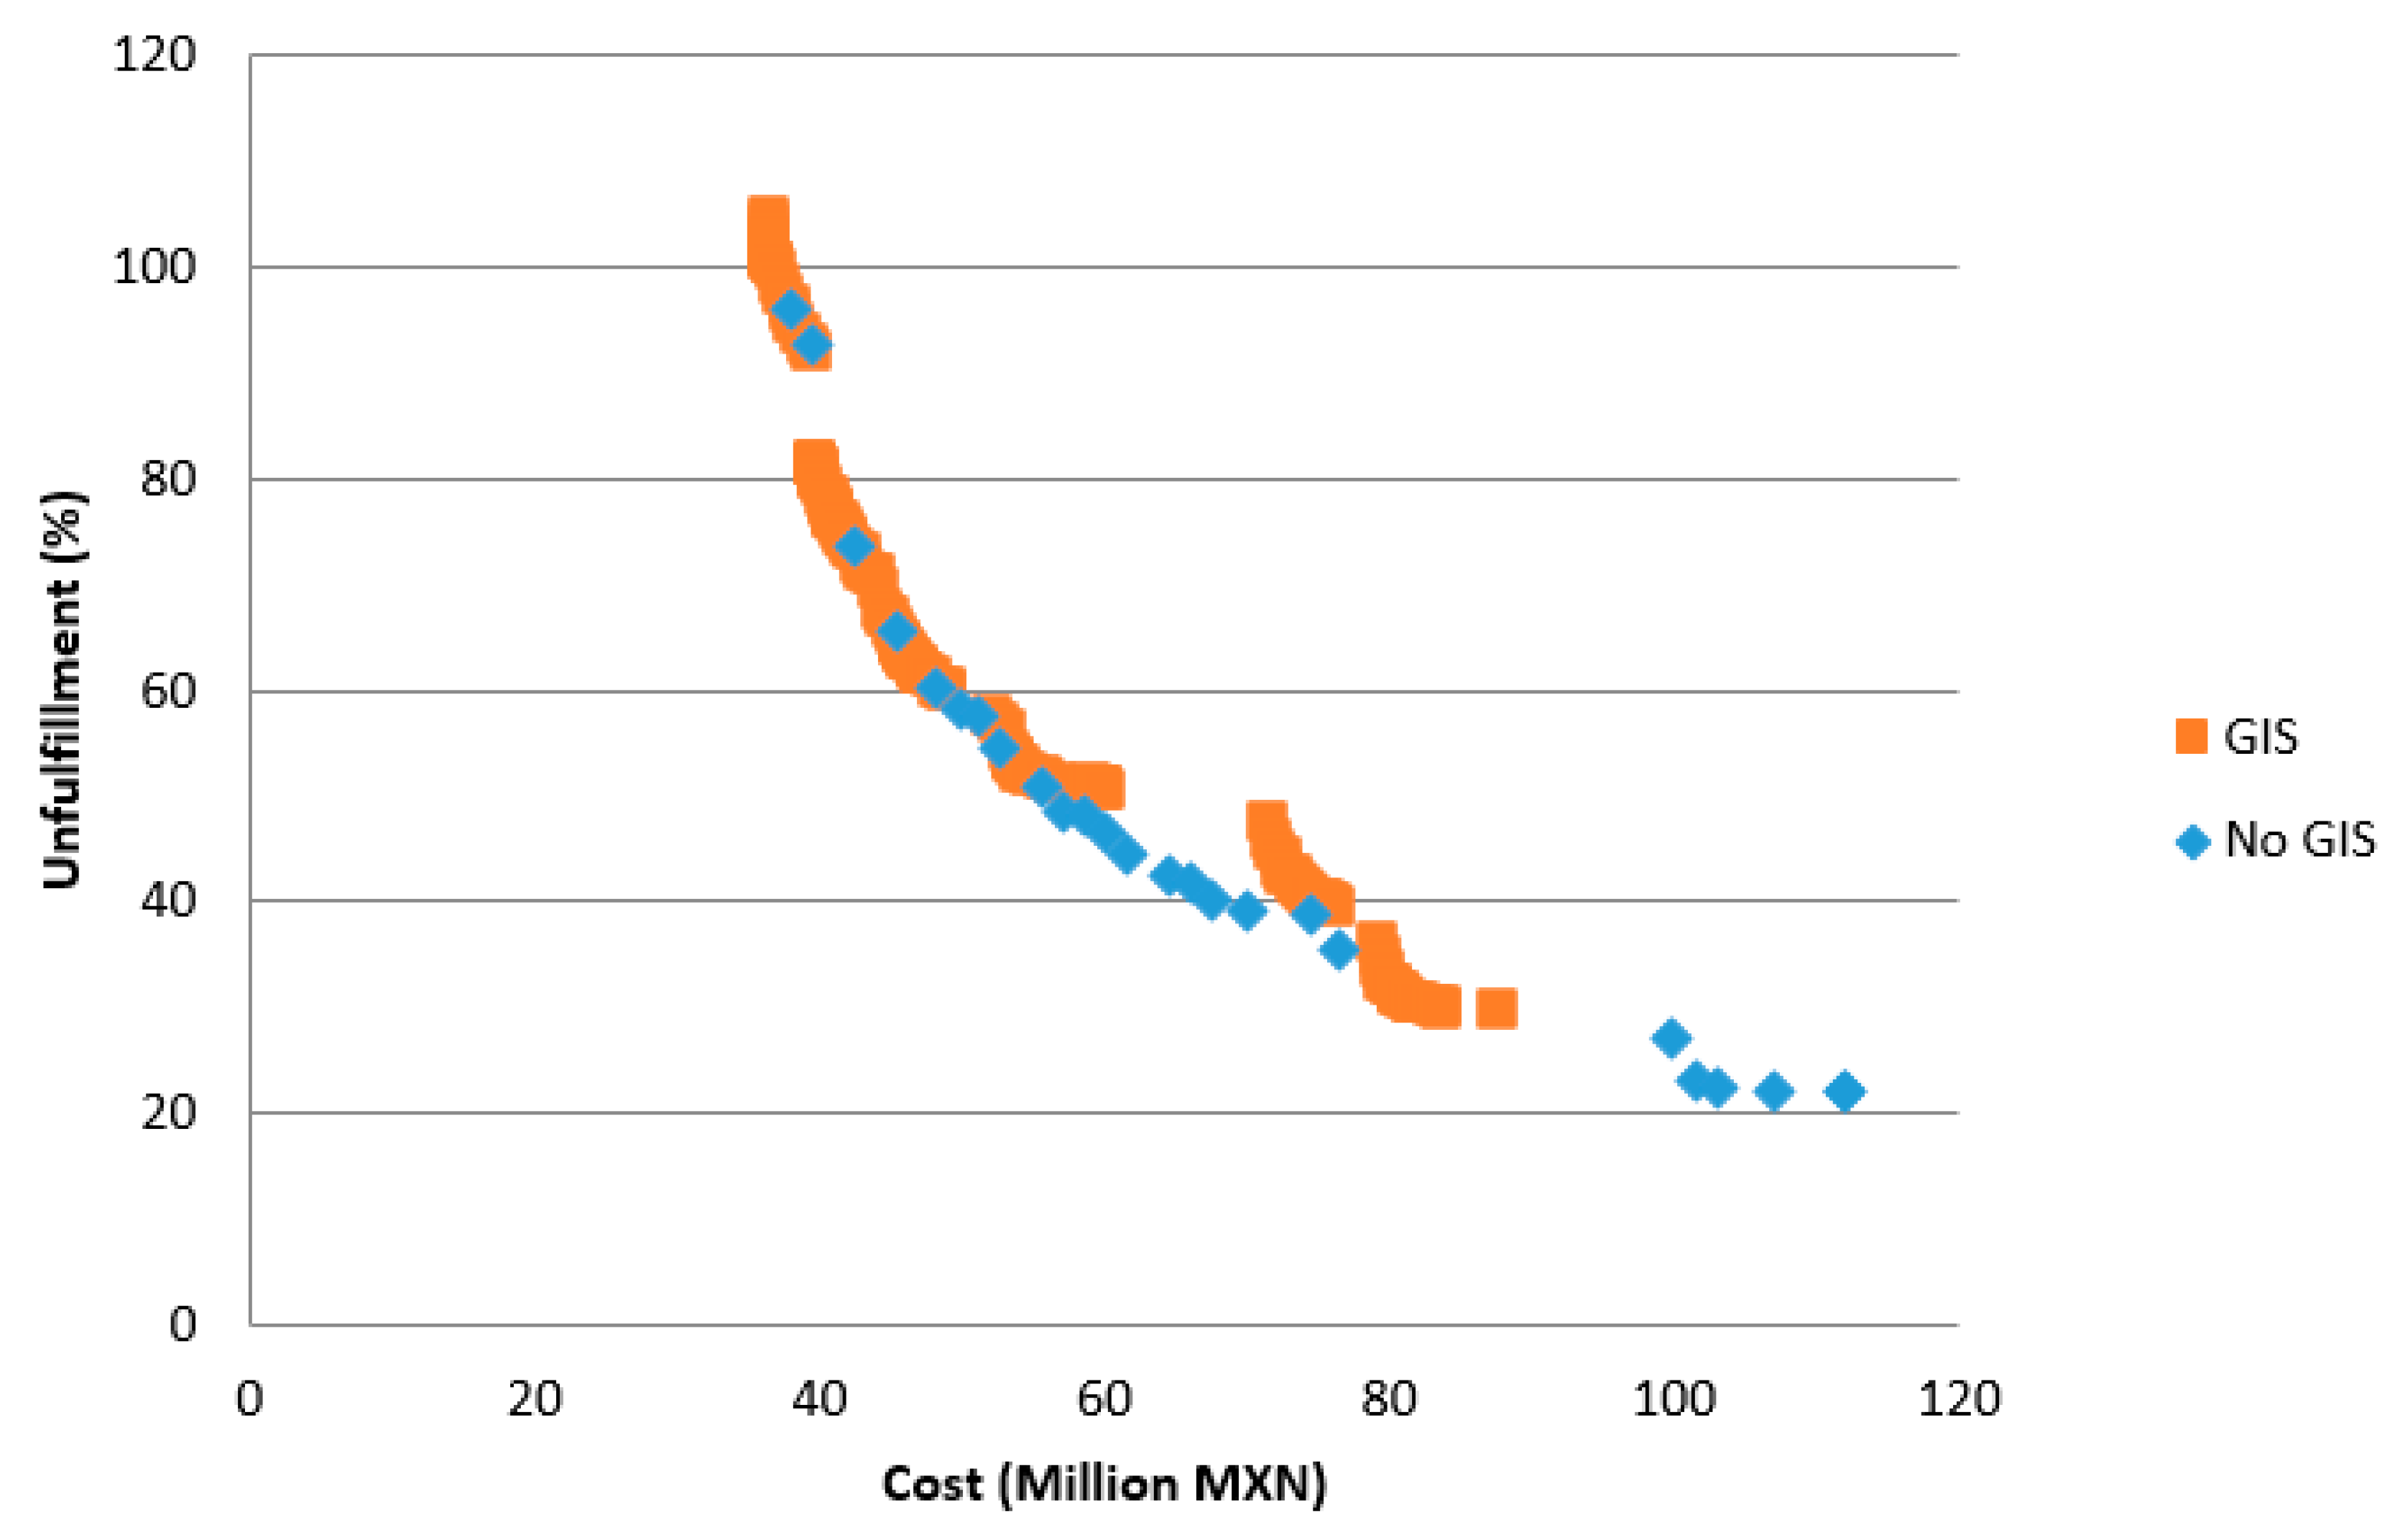
| ID | Cost (mxn) | Unfulfilled (%) | Shelters Endangered | People at Risk | DCs Affected |
|---|---|---|---|---|---|
| TNG1 | 37,912,695 | 95.79288 | 60 | 34,577 | 0 |
| TNG2 | 39,393,530 | 92.64069 | 55 | 27,214 | 0 |
| TNG3 | 42,348,714 | 73.58491 | 59 | 31,891 | 0 |
| TNG4 | 45,312,141 | 65.80087 | 62 | 31,285 | 0 |
| TNG5 | 48,281,093 | 60.11983 | 61 | 31,285 | 0 |
| TNG6 | 49,754,160 | 58.25243 | 73 | 32,612 | 0 |
| TNG7 | 51,202,469 | 57.53509 | 66 | 32,013 | 0 |
| TNG8 | 52,724,503 | 54.55939 | 65 | 29,499 | 0 |
| TNG9 | 55,651,605 | 51.02041 | 89 | 37,790 | 0 |
| TNG10 | 57,165,905 | 48.65591 | 55 | 27,135 | 0 |
| TNG11 | 58,648,895 | 48.3871 | 38 | 33,539 | 1 |
| TNG12 | 60,125,523 | 46.58491 | 60 | 34,196 | 1 |
| TNG13 | 61,601,567 | 44.54685 | 60 | 37,175 | 0 |
| TNG14 | 64,412,961 | 42.46285 | 80 | 29,620 | 1 |
| TNG15 | 66,035,112 | 41.97531 | 82 | 31,636 | 1 |
| TNG16 | 67,533,346 | 40.23379 | 89 | 29,885 | 1 |
| TNG17 | 70,001,418 | 39.17713 | 104 | 33,713 | 2 |
| TNG18 | 74,611,184 | 38.61004 | 106 | 30,080 | 3 |
| TNG19 | 76,422,606 | 35.58719 | 88 | 33,701 | 1 |
| TNG20 | 99,705,500 | 27.14364 | 85 | 30,618 | 0 |
| TNG21 | 101,569,322 | 23.00877 | 79 | 30,336 | 1 |
| TNG22 | 102,882,459 | 22.32704 | 96 | 32,566 | 2 |
| TNG23 | 106,992,320 | 22.2973 | 94 | 29,230 | 2 |
| TNG24 | 111,912,735 | 22.25476 | 160 | 34,849 | 3 |
| TNG25 | 111,979,634 | 22.05567 | 160 | 31,306 | 2 |
© 2016 by the authors; licensee MDPI, Basel, Switzerland. This article is an open access article distributed under the terms and conditions of the Creative Commons by Attribution (CC-BY) license (http://creativecommons.org/licenses/by/4.0/).
Share and Cite
Rodríguez-Espíndola, O.; Albores, P.; Brewster, C. GIS and Optimisation: Potential Benefits for Emergency Facility Location in Humanitarian Logistics. Geosciences 2016, 6, 18. https://0-doi-org.brum.beds.ac.uk/10.3390/geosciences6020018
Rodríguez-Espíndola O, Albores P, Brewster C. GIS and Optimisation: Potential Benefits for Emergency Facility Location in Humanitarian Logistics. Geosciences. 2016; 6(2):18. https://0-doi-org.brum.beds.ac.uk/10.3390/geosciences6020018
Chicago/Turabian StyleRodríguez-Espíndola, Oscar, Pavel Albores, and Christopher Brewster. 2016. "GIS and Optimisation: Potential Benefits for Emergency Facility Location in Humanitarian Logistics" Geosciences 6, no. 2: 18. https://0-doi-org.brum.beds.ac.uk/10.3390/geosciences6020018