Article

The Evolutionary Trends of Health Behaviors in Chinese Elderly and the Influencing Factors of These Trends: 2005–2014

1
School of Business, Guizhou Minzu University, Guiyang 550025, China
2
Centre for Social Security Studies, Wuhan University, Wuhan 430072, China
3
Institute for Social Policy Research, Zhongnan University of Economics and Law, Wuhan 430073, China
*
Author to whom correspondence should be addressed.
Int. J. Environ. Res. Public Health 2019, 16(10), 1687; https://0-doi-org.brum.beds.ac.uk/10.3390/ijerph16101687
Submission received: 16 April 2019 / Revised: 8 May 2019 / Accepted: 10 May 2019 / Published: 14 May 2019
(This article belongs to the Collection Aging and Public Health)

Abstract

:
As China is now facing the severe challenge of rapid population ageing, the health behaviors in Chinese elderly people are of great significance for realizing the goal of “Healthy Ageing” and the construction of a “Healthy China”. Little is known about the evolutionary trends of health behaviors in the Chinese elderly and about the factors influencing these trends; thus, the purposes of this paper are: (1) To describe the classes and evolutionary trends of health behaviors in the Chinese elderly; and (2) to explore the factors that influence the changes in the health behaviors in the elderly in China. Latent class analysis (LCA) is applied in this study to analyze the classes of health behaviors in the Chinese elderly. Growth mixture modelling (GMM) is employed to describe the evolutionary trends of the health behaviors in elderly people in China. In addition, the Bivariate analysis model is adopted to identify the influencing factors of the evolution of health behaviors. The data were derived from the Chinese Longitudinal Healthy Longevity Survey (CLHLS) from 2005 to 2014. The results reveal that the health behaviors in the Chinese elderly can be grouped into five classes: Negative, relatively negative, fair, relatively positive, and positive. Approximately 77.2% of the health behaviors in the Chinese elderly have the characteristics of “modified”, with a positive tendency. Moreover, approximately 22.8% of the health behaviors in Chinese elderly people have the characteristics of “non-modified”, with a negative tendency or remaining unchanged. The evolution of the health behaviors in the elderly in China is more affected by economic factors such as timely medical treatment during childhood, pension, occupations before the age of 60 and family income, as well as by self-rated health (SRH) and demographic characteristics such as household registration, age, and education level. Hence, various possible interventions should be made to improve the health behaviors in elderly people.

1. Introduction

Population ageing is one of the major challenges faced by China in this century. In 2018, the number of elderly people over the age of 60 in China had reached 249 million, accounting for 17.9% of the total population. However, in comparison with the number of elderly people in China when it first became an ageing society in 1999, the net increase is approximately 120 million [1]. It is estimated that by 2050, the number of elderly people over the age of 60 in China will exceed 450 million, with a proportion of the total population over 30% [2]. The World Health Organization points out that the increase in life expectancy rather than the improvement in quality of life is of no value, and healthy life expectancy is of more significance than lifespan [3]. While the average life expectancy of Chinese elderly people has reached 76.4 years, the healthy life expectancy is only 68.7 years [4]. Additionally, in regard to the prevalence of chronic diseases, the probability of chronic diseases in the Chinese elderly has reached 80% [5], and the Chinese elderly have the trait of “longevity but not healthy”, indicating there is a huge demand for medical and nursing resources. Long-term effects of unhealthy behaviors and lifestyle can cause diseases, especially chronic ones. Without control measures, rapid population ageing by 2030 may aggravate the burden of chronic diseases in China by at least 40% [5]. All of the facts above highlight the role of health behaviors in improving the health of elderly individuals and reducing the burden of diseases.
China has the incomparably largest elderly population in the world. The health behaviors in the Chinese elderly are of great significance in realizing the goal of “Healthy Ageing” and the construction of a “Healthy China”. Previous studies on the health behaviors in Chinese elderly people encompassed the following aspects: the status quo and determinants of health behaviors and health knowledge [6,7,8,9], the impact of health literacy and health behaviors on the health status of the elderly [10,11,12,13], health behaviors and health knowledge of the rural elderly [14,15,16,17], and the health behaviors and influencing factors of empty nester elderly people [18,19,20,21]. These studies have enriched the academic field on the health behaviors in the elderly in China, however, to be fair, their observations are only based on cross-sectional data regarding the health behaviors in the elderly and their influencing factors with a relatively limited coverage of samples in only a few provinces. Given that China’s elderly population ranks as the highest in the world with an uneven spatial distribution in urban and rural areas and different provinces, these studies cannot summarize the overall perspectives of the health behaviors in the Chinese elderly, and they are even less able to report the evolution trends and the influencing factors of health behaviors in Chinese elderly people. In fact, individuals will constantly adjust their health behaviors to be in line with external factors such as living environment, accessibility to health resources and health information technology advancement [22,23], which also offers some enlightening insights for public policies promoting health behaviors. This study will use the CLHLS data from 2005 to 2014 to reveal and classify the characteristics of the Chinese elderly’s health behaviors through the LCA. On this basis, GMM is then employed to describe the evolutionary trends of health behaviors in Chinese elderly, and a Bivariate analysis model is adopted in this study to identify the influencing factors of the evolution of health behaviors in Chinese elderly.

2. Materials and Methods

2.1. Data

CLHLS provides the reliable data used in this study. The survey was jointly carried out by the Center for Healthy Aging and Development Studies at Peking University and Duke University. As the largest survey around the world, currently, in terms of health and longevity, it conducted a baseline survey in 1998, followed by six wave surveys in 2000, 2002, 2005, 2008, 2011, and 2014 from 23 random sample areas in 31 provincial administrative units of China (Beijing, Tianjin, Hebei, Shanxi, Liaoning, Jilin, Heilongjiang, Shanghai, Jiangsu, Zhejiang, Anhui, Fujian, Jiangxi, Shandong, Henan, Hubei, Hunan, Guangdong, Guangxi, Chongqing, Sichuan, Shanxi, and Hainan), all over the Eastern, middle and Western regions as well as Northeast China. After randomly selecting approximately 50% of the counties in the above 23 provincial administrative units, the survey had covered approximately 85% of China’s total population, which, approximately, can be seen as a random sampling survey among the national elderly [24]. CLHLS consists of the health status and influencing factors of the elderly from physiology, soma and cognition, including the demographic characteristics, lifestyles, health services, social participation, economic status, and family characteristics, etc. These data provide rich information and data quality has been widely tested and recognized [25,26]. More detailed information on CLHLS can be found at: http://www.icpsr.umich.edu/icpsrweb/NACDA/studies/36179.
The respondents of the CLHLS baseline survey were elderly people aged 80 years and over, and the age range after 2002 was adjusted to 65 years and over. Previous studies have found that the elderly aged 105 and below could validly fill out the questionnaire, which is generally consistent with developed countries, but the elderly aged 106 and over may underperform [27]. Therefore, in order to ensure our research quality, this study eliminated the samples of people aged 106 years and over from the data analysis. Since respondents differentiated in age range and other specific characteristics between the surveys in 1998, 2000, 2002, and the last four follow-ups, this study excluded the data from the previous 3 waves and only used CLHLS data from 2005, 2008, 2011 and 2014. For the data merging of the four waves, ID (identity code) was the only matching condition, and data from 2723 elderly people aged 65 to 105 who participated in the survey in 10 years were retained. Then, balanced panel data was constructed accordingly.

2.2. Variables

2.2.1. Manifest Variables of Health Behaviors

In light of the design of the CLHLS questionnaire on health behaviors in the elderly, manifest variables of health behaviors selected in this paper were grouped into five dimensions: diet, exercise, social activities, smoking, alcohol consumption, including 11 health behavior variables (see Table 1). The following principles were followed when selecting specific health behaviors: first, fully consider the connotation of health behaviors and use frequency of manifest variables of health behaviors in prior studies [7,28,29], then select the existing manifest variables of health behaviors which are representative and have been fully verified by research. Second, in terms of data processing, the manifest variables related to health behaviors in the CLHLS questionnaire were included in the LCA for exploratory analysis, and the health behaviors variables with low correlation between manifest variables and latent variables were excluded. What must be noted is that the purpose of the manifest variables of health behaviors is to find the latent variables of health behaviors through LCA rather than generating new variables by simple calculations based on specific health behaviors.

2.2.2. Influencing Factors of the Evolution of Health Behaviors

Based on previous studies [6,14,25,30], influencing factors of the evolution of the elderly’s health behaviors selected mainly consists of social security and services, SRH, family characteristics, and demographic characteristics of the elderly. Descriptive statistics of variables are shown in Table 2.

2.3. Methods

2.3.1. Latent Class Analysis (LCA)

The LCA is used to identify latent classes of manifest variables of the health behaviors in the Chinese elderly, with the primary goal being to determine the individual’s potential characteristics according to an individual’s manifest variables of health behaviors and obtain the proportion of different types of people. Then, different intervention strategies will be adopted for different subgroups [31,32]. Many variables in studies cannot be directly measured, and these are called “latent variables”. Relative to the manifest variables which can be directly measured by instruments or methods such as scales or experiments, latent variables are often the characteristics or abstract concepts originating from manifest variables, which may be not be able to be directly measured, but have to be reflected or classified based on data or characteristics of manifest variables. As for the applicable conditions, model parameters or implementation steps of the LCA, this paper will not be redundant. Studies in this field can be observed in previous studies [31,32,33,34].
This analysis utilized LatentGold4.5 (Statistical Innovations Inc., Belmont, MA, USA) to identify the latent classes of health behavior variables of the Chinese elderly using the following procedures: (1) Gradually increase the number of manifest health behavior variables, starting by calculating the Null Model with only one manifest variable of health behavior, and then compare the fit indexes until the optimal model is found. (2) On the basis of determining the optimal model, the tendency of each class is determined based on the conditional probability. The greater the conditional probability is, the greater the probability that the latent class will be selected for the manifest variables, which indicates a more noticeable tendency. (3) The characteristics of the latent classes are then induced according to the conditional probability of the manifest variables in order to determine the latent class of health behaviors and name them. (4) Lastly, the health behaviors in each sample of the elderly are classified by calculating the Posterior probability with the purpose of inferring the latent class to which the sample of the elderly belongs.

2.3.2. Growth Mixture Modelling (GMM)

Given that the data types in this study were used as panel data, after using LCA to classify the types of health behaviors in the elderly, GMM was used to describe the evolutionary trends of health behaviors in the elderly in the 10 years from 2005 to 2014. This model can investigate not only the heterogeneous growth of the elderly but also the variability of individual development trends within the group. In the setting of the fit indexes of the model, since the setting of the GMM starts from the Null Model with only one class and then gradually increases the number of classes, Bayesian information criterion (BIC) is chosen as the main index to determine whether the model is optimally fit, and the BIC correlates negatively with the quality of fitness [31,32]. At the same time, Log Likelihood (LL), Akaike Information Criterion (AIC), Entropy, LMR (Lo-Mendell-Rubin), and Bootstrap Likelihood Ratio Test (BLRT) were simultaneously reported for reference.

2.3.3. Bivariate Analysis Model

After using the LCA and GMM to describe the latent classes of the elderly’s health behaviors and their evolutionary trends, the evolutionary results of the elderly health behaviors were treated as a bivariate variable (modified = 1, non-modified = 0), used as explanatory variables. The Bivariate analysis model was employed to research the impact of social security and services, SRH, family characteristics and demographic characteristics on the evolution of health behaviors in the elderly.

3. Results

3.1. LCA Results of Health Behaviors in Chinese Elderly

In this study, LatentGold4.5 was used to conduct an exploratory LCA of manifest variables of the health behaviors in CLHLS in 2005, 2008, 2011 and 2014 and to determine whether there are latent class variables with a significant explanatory power among the manifest variables of health behaviors in all waves. Based on manifest variables of the health behaviors in each wave, six latent class models were constructed from a Null model with only one class. The LCA fit indexes of each wave survey (see Table 3) demonstrates that, among the manifest health behaviors in all four waves, there exists the latent variable of health behaviors in the Chinese elderly. In addition, the BIC value was used as the main fit index to determine model fitness. Relative to models in all the waves, Model 5 is the best model.
According to the conditional probability (horizontally or vertically) of health behavior variables in LCA, and its possible impact directions (“+” or “−“) on the health of the elderly (see Appendix A Table A1), the health behaviors in each wave can be grouped into five classes: Negative, relatively negative, fair, relatively positive, and positive. Table 4 presents the latent class probability for Chinese elderly’s health behaviors in each wave survey.

3.2. Evolution Results of Health Behaviors in Chinese Elderly

The evolution of health behaviors generally has three trends: better, unchanged, and worse. Interactive analysis was first used to describe the results of the health behaviors in the elderly in our study. As shown in Table 5, from 2005 to 2014, the health behaviors in the Chinese elderly are generally changing in a more positive trend. However, it is acknowledged that to determine the evolutionary trends of the health behaviors in the elderly based only on the classes at the beginning and end of the wave may be biased, as this approach does not consider the adjustment of health behaviors over the course of the decade. Moreover, this practice could also not clearly present the evolutionary trends of elderly’s health behaviors. In view of this point, based on the 4 wave panel data over ten years of elderly’s health behaviors, three GMMs were established by using Mplus7.0 (https://www.statmodel.com/verhistory.shtml). The fit indexes of each model are shown in Table 6. Except for the Null Model with only one class in the three models, the BIC of Model 2 is the smallest, thus it is the optimal model. While Model 3 classifies the evolution of elderly’s health behaviors into three classes, one of the health behaviors’ evolution classes accounts for only 1.9% of the sample size (approximately 52 people), and the evolutionary trend is not highly differentiated from other classes. Considering all of these factors, Model 2 was the optimal model.
The estimated values of the intercept factors and the slope factors corresponding to GMM are presented in Table 7. The mean of the intercept factors and the slope factors was −3.261 (p < 0.01) and 0.278 (p < 0.01) in class 1, 0 and −0.130 (p < 0.01) in class 2. By comparing the mean of the slope factors of the two classes, it can be found that the evolutionary trend of the health behaviors type represented by class 1 is increasing and that of class 2 is decreasing. This study has uniformly adjusted the health behaviors variables generated by the LCA. That is, the higher the value represented, the better the health behavior type. It can be inferred that in class 1, health behaviors over 10 years have been optimized, and health behaviors in class 2 remained unchanged. As the results of the health behaviors’ evolution can generally be divided into three classes of better, unchanged, and worse, it can be concluded that class 2 represents a trend towards worse or unchanged over the past decade.
The essence of behavior modification is the use of theories of learning to deal with the individual behaviors, emotions and other aspects for treatment. The goal of behavior modification includes not only eliminating the specific bad behaviors of the individual but also cultivating and developing good behaviors [35,36]. Considering all the theoretical and quantitative significance of the evolutionary outcomes of the two classes of health behaviors, it can be inferred that Class 1 represents a positive type of evolution defined as “modified”, which accounts for approximately 77.2% of the total sample size; Class 2 stands for the class of health behaviors whose evolutionary trend is negative or unchanged, which is defined as “non-modified”, accounting for approximately 22.8% of the total sample size.
To be more rigorous and scientific, this study set the classes of health behaviors in the elderly as categorical variables in the GMM. The GMM of class variables did not yield the evolutionary trend of the sample population but rather yielded the evolutionary trends of the subclasses as illustrated in Figure 1, Figure 2, Figure 3, Figure 4 and 
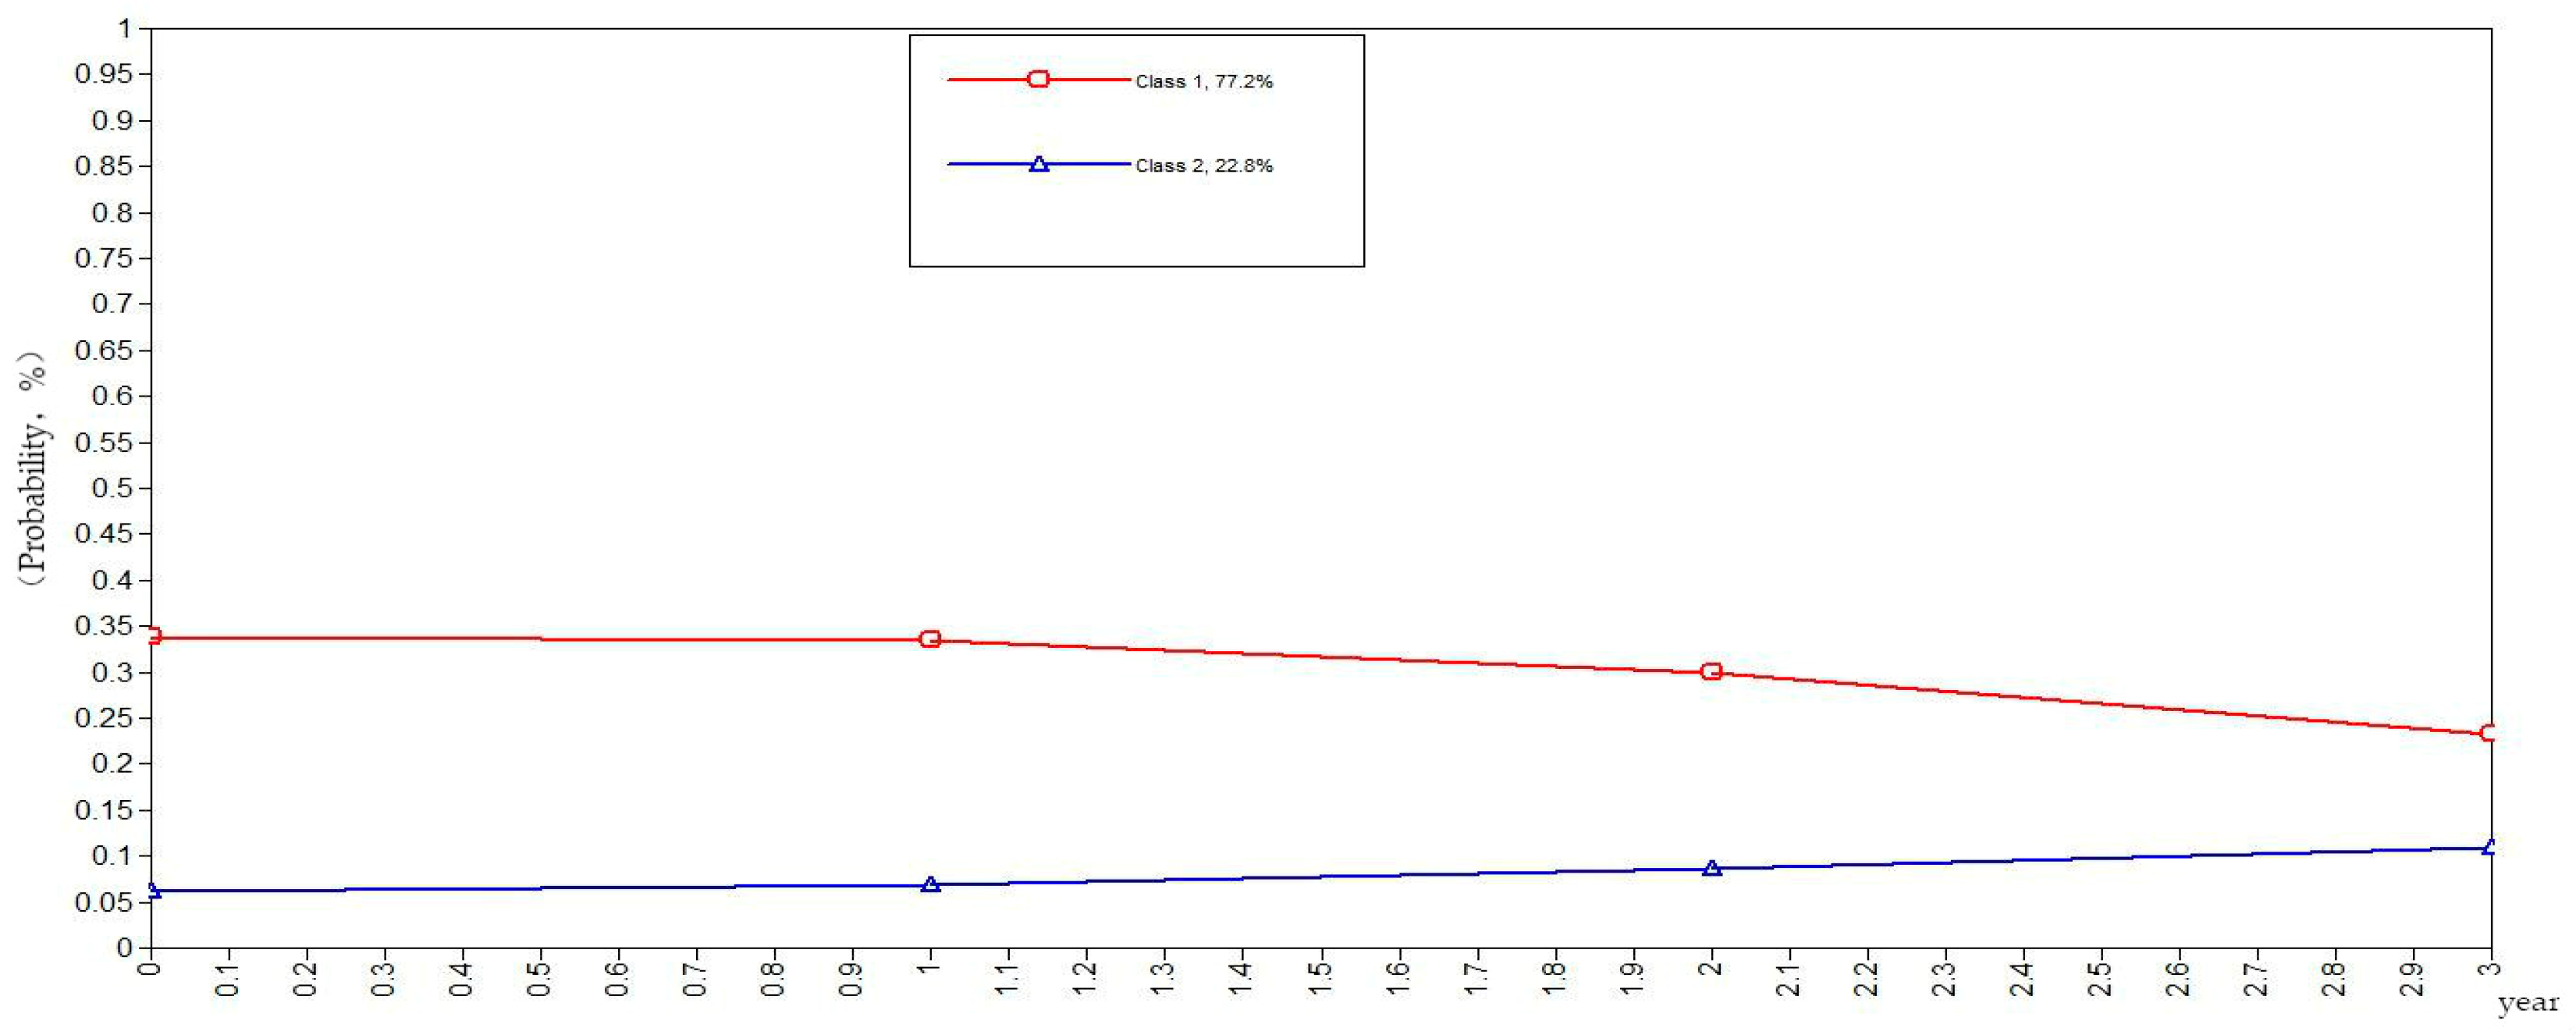
Figure 5. The ordinate in the graph represents the estimated probability value of health behavior modification, which ranges from 0–1. The abscissa represents different time periods. CLHLS data of the four waves in 2005, 2008, 2011, and 2014 are selected for this study. There are three time periods, and the abscissa value range is 0–3. It can be observed from Figure 1 that the elderly with negative health behaviors have a lower estimated probability of behavior modification as their age increases, while the estimated probability of non-modification is slightly increased. What can be gathered from 
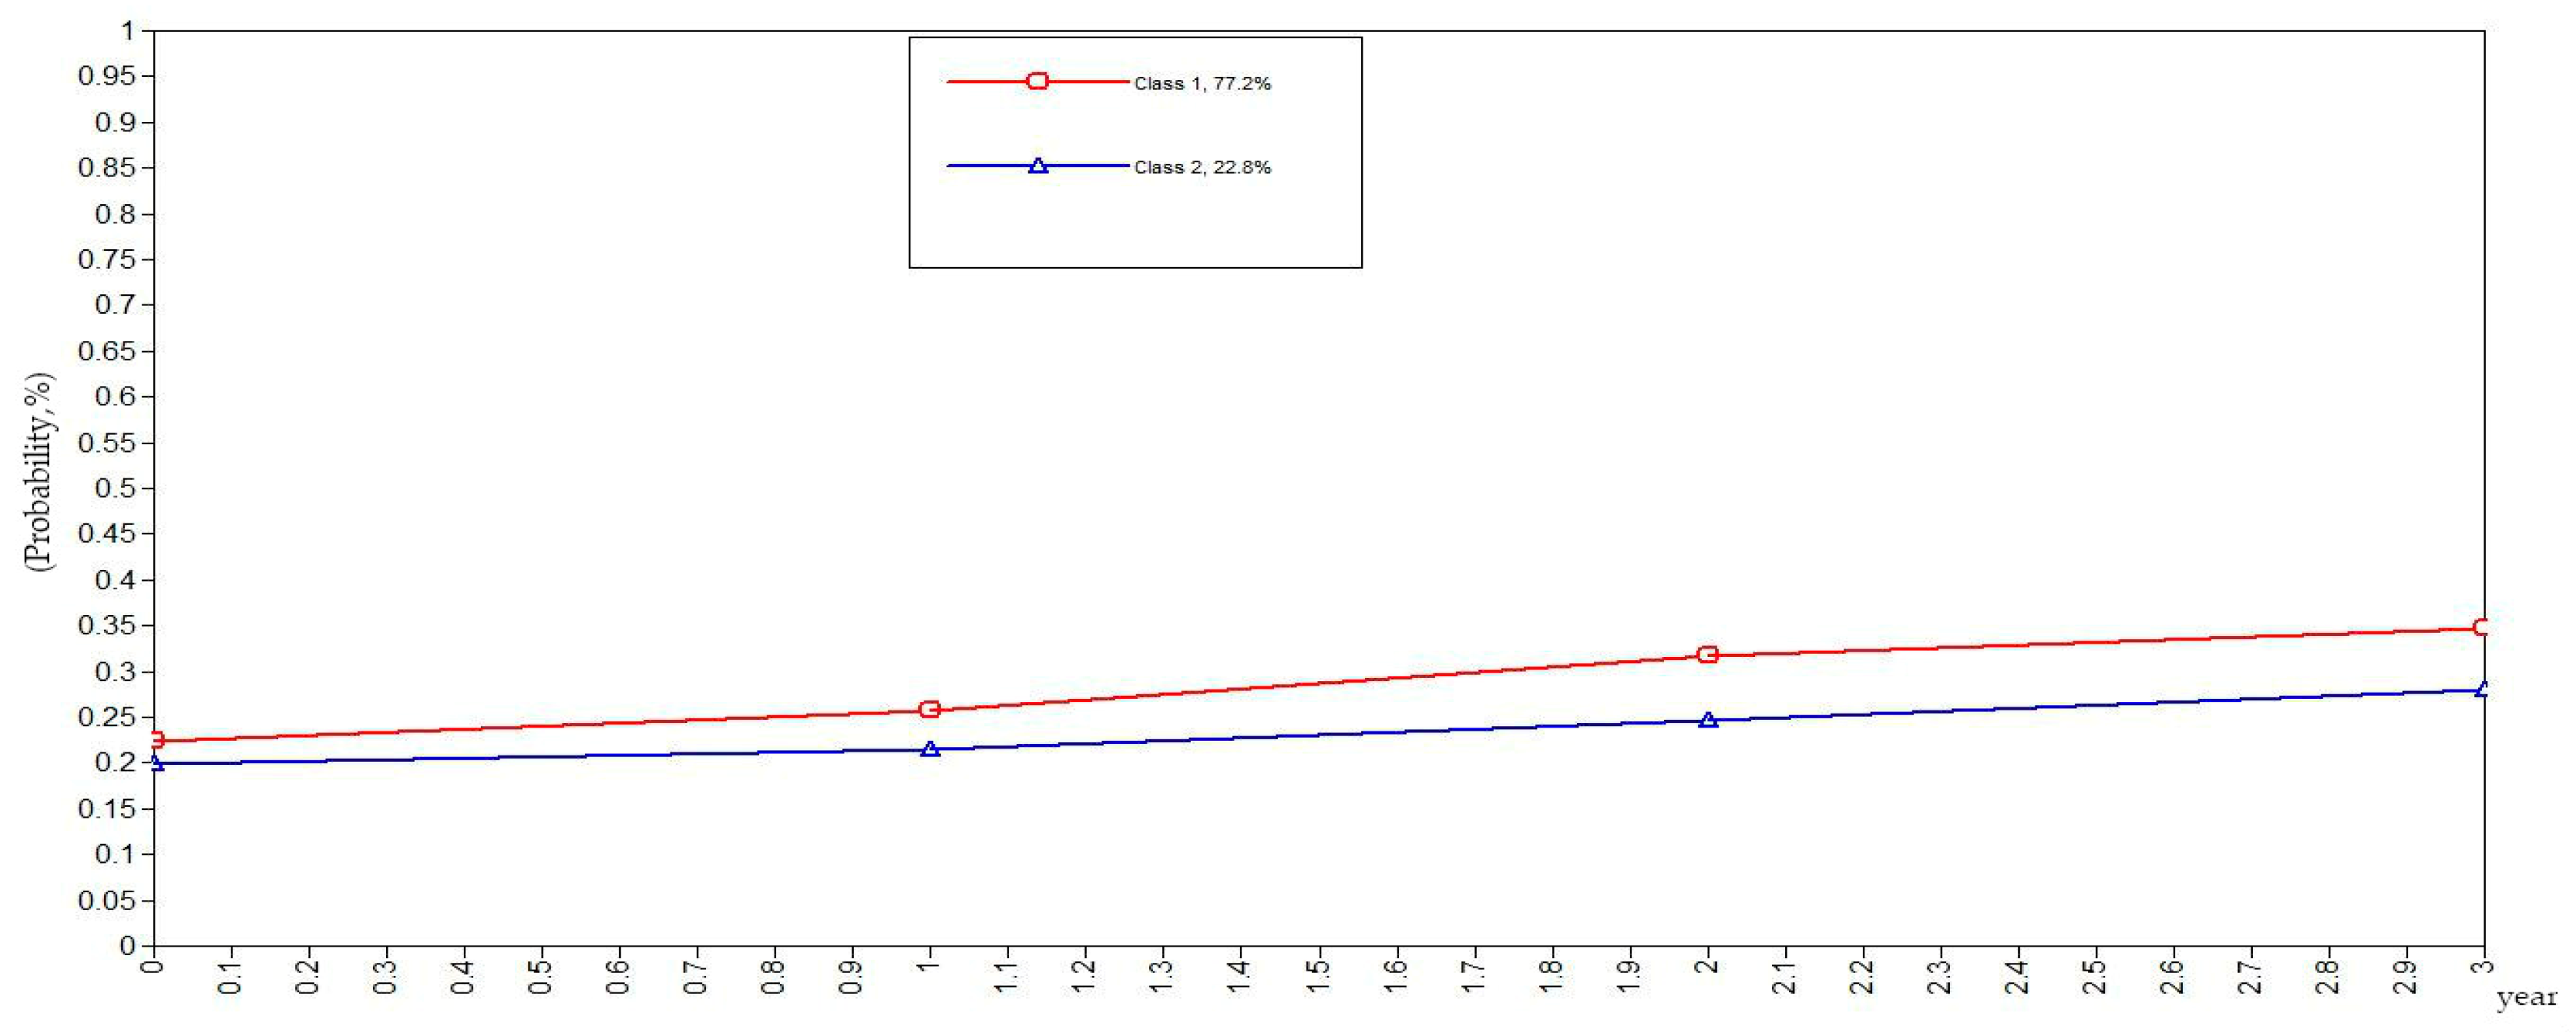
Figure 2 is that the modifications of the elderly with relatively negative health behaviors is similar to that of the elderly with negative health behaviors. From 
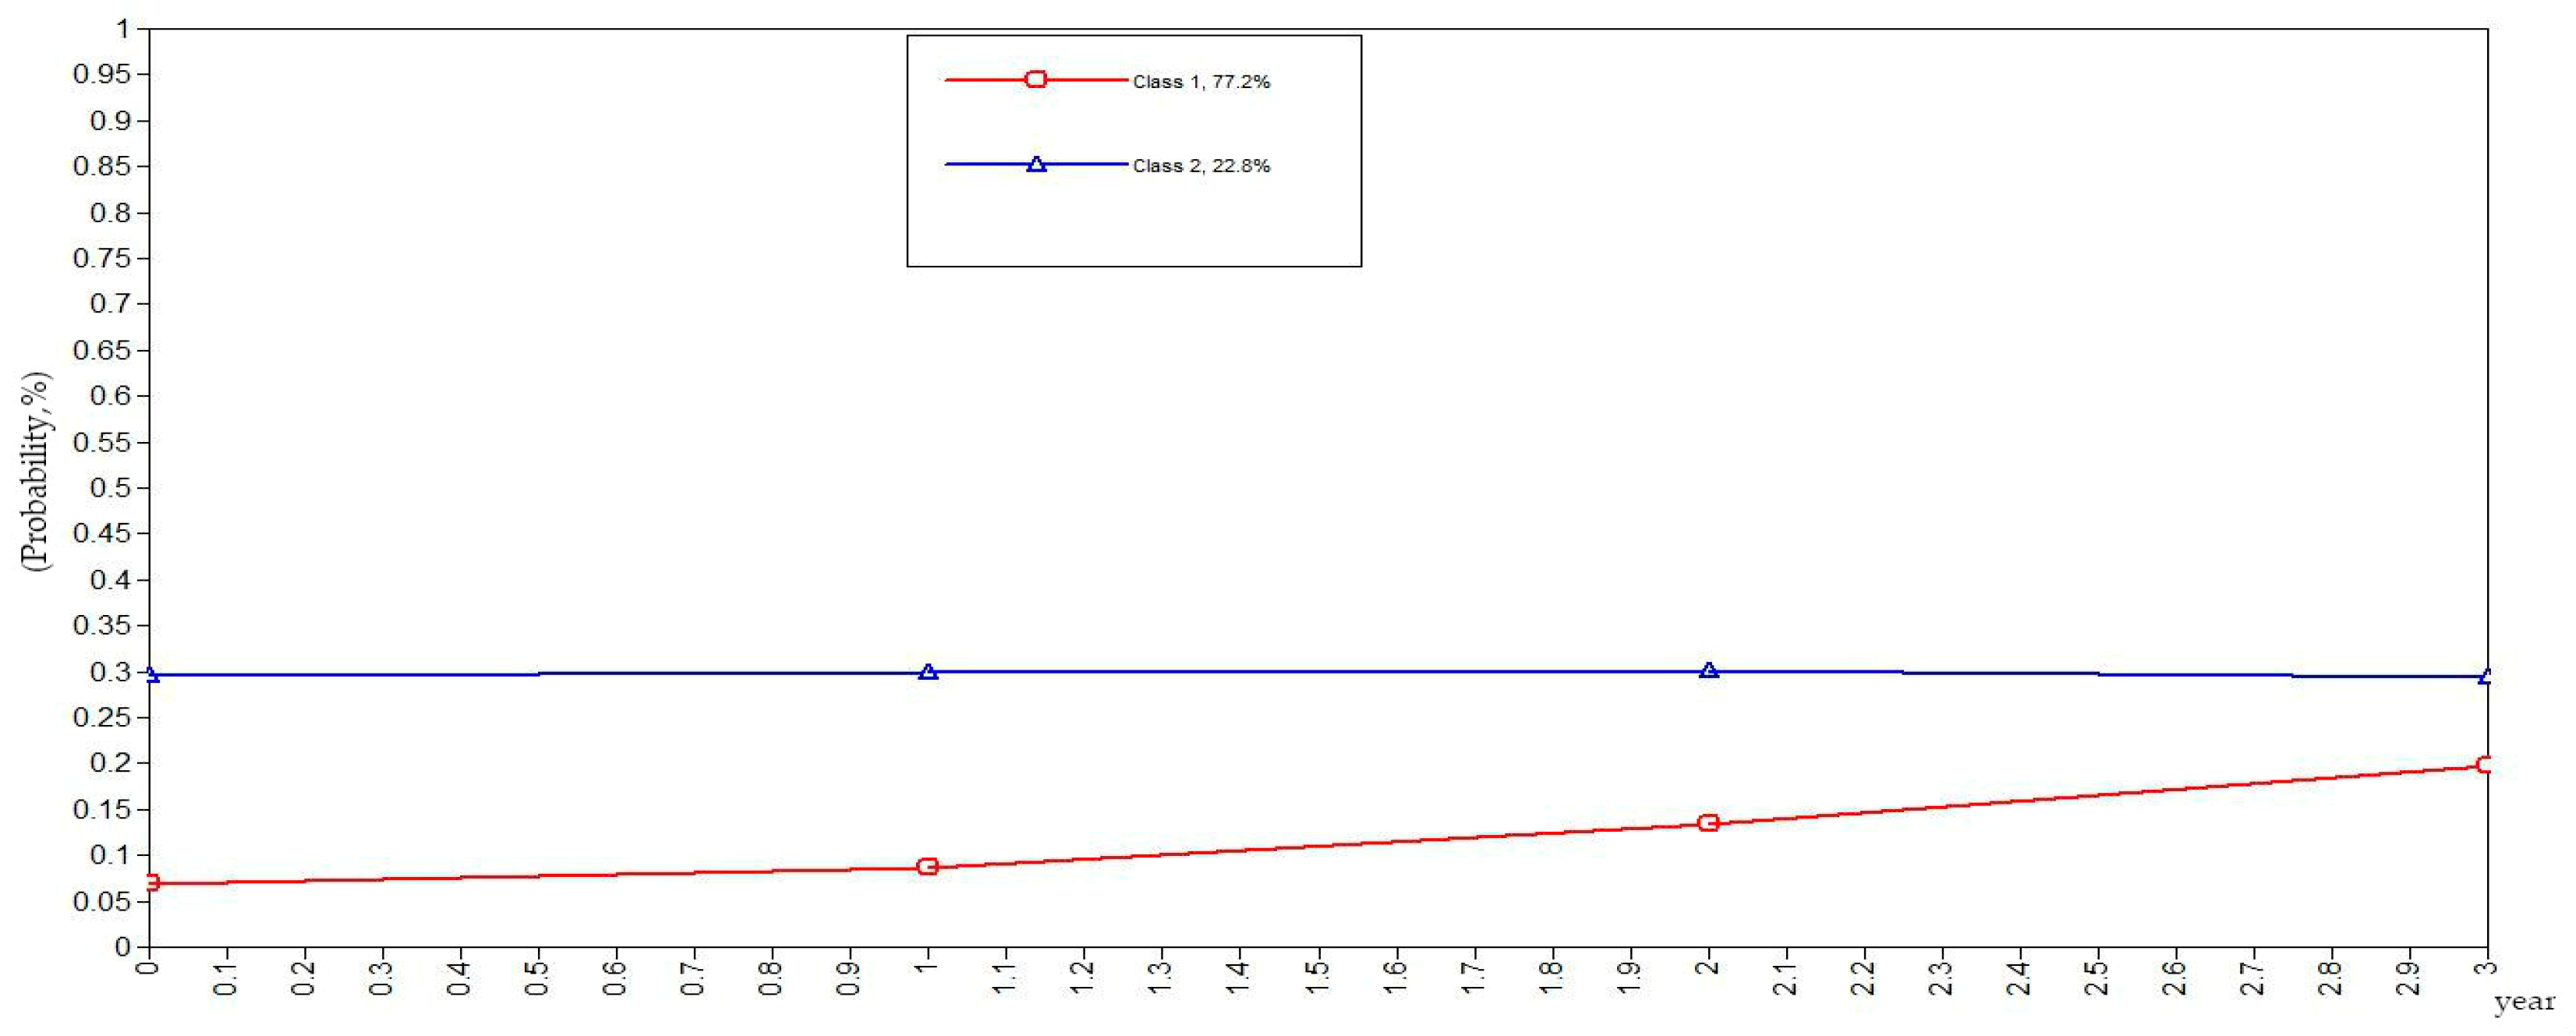
Figure 3, it can be found that the estimated probability of behavior modification with increasing age is higher for those with fair health behaviors, although the probability of those with non-modified behaviors is also slightly elevated. However, in this class, the estimated value of probability for modified behaviors is always higher than that of the non-modified ones. It is revealed in 
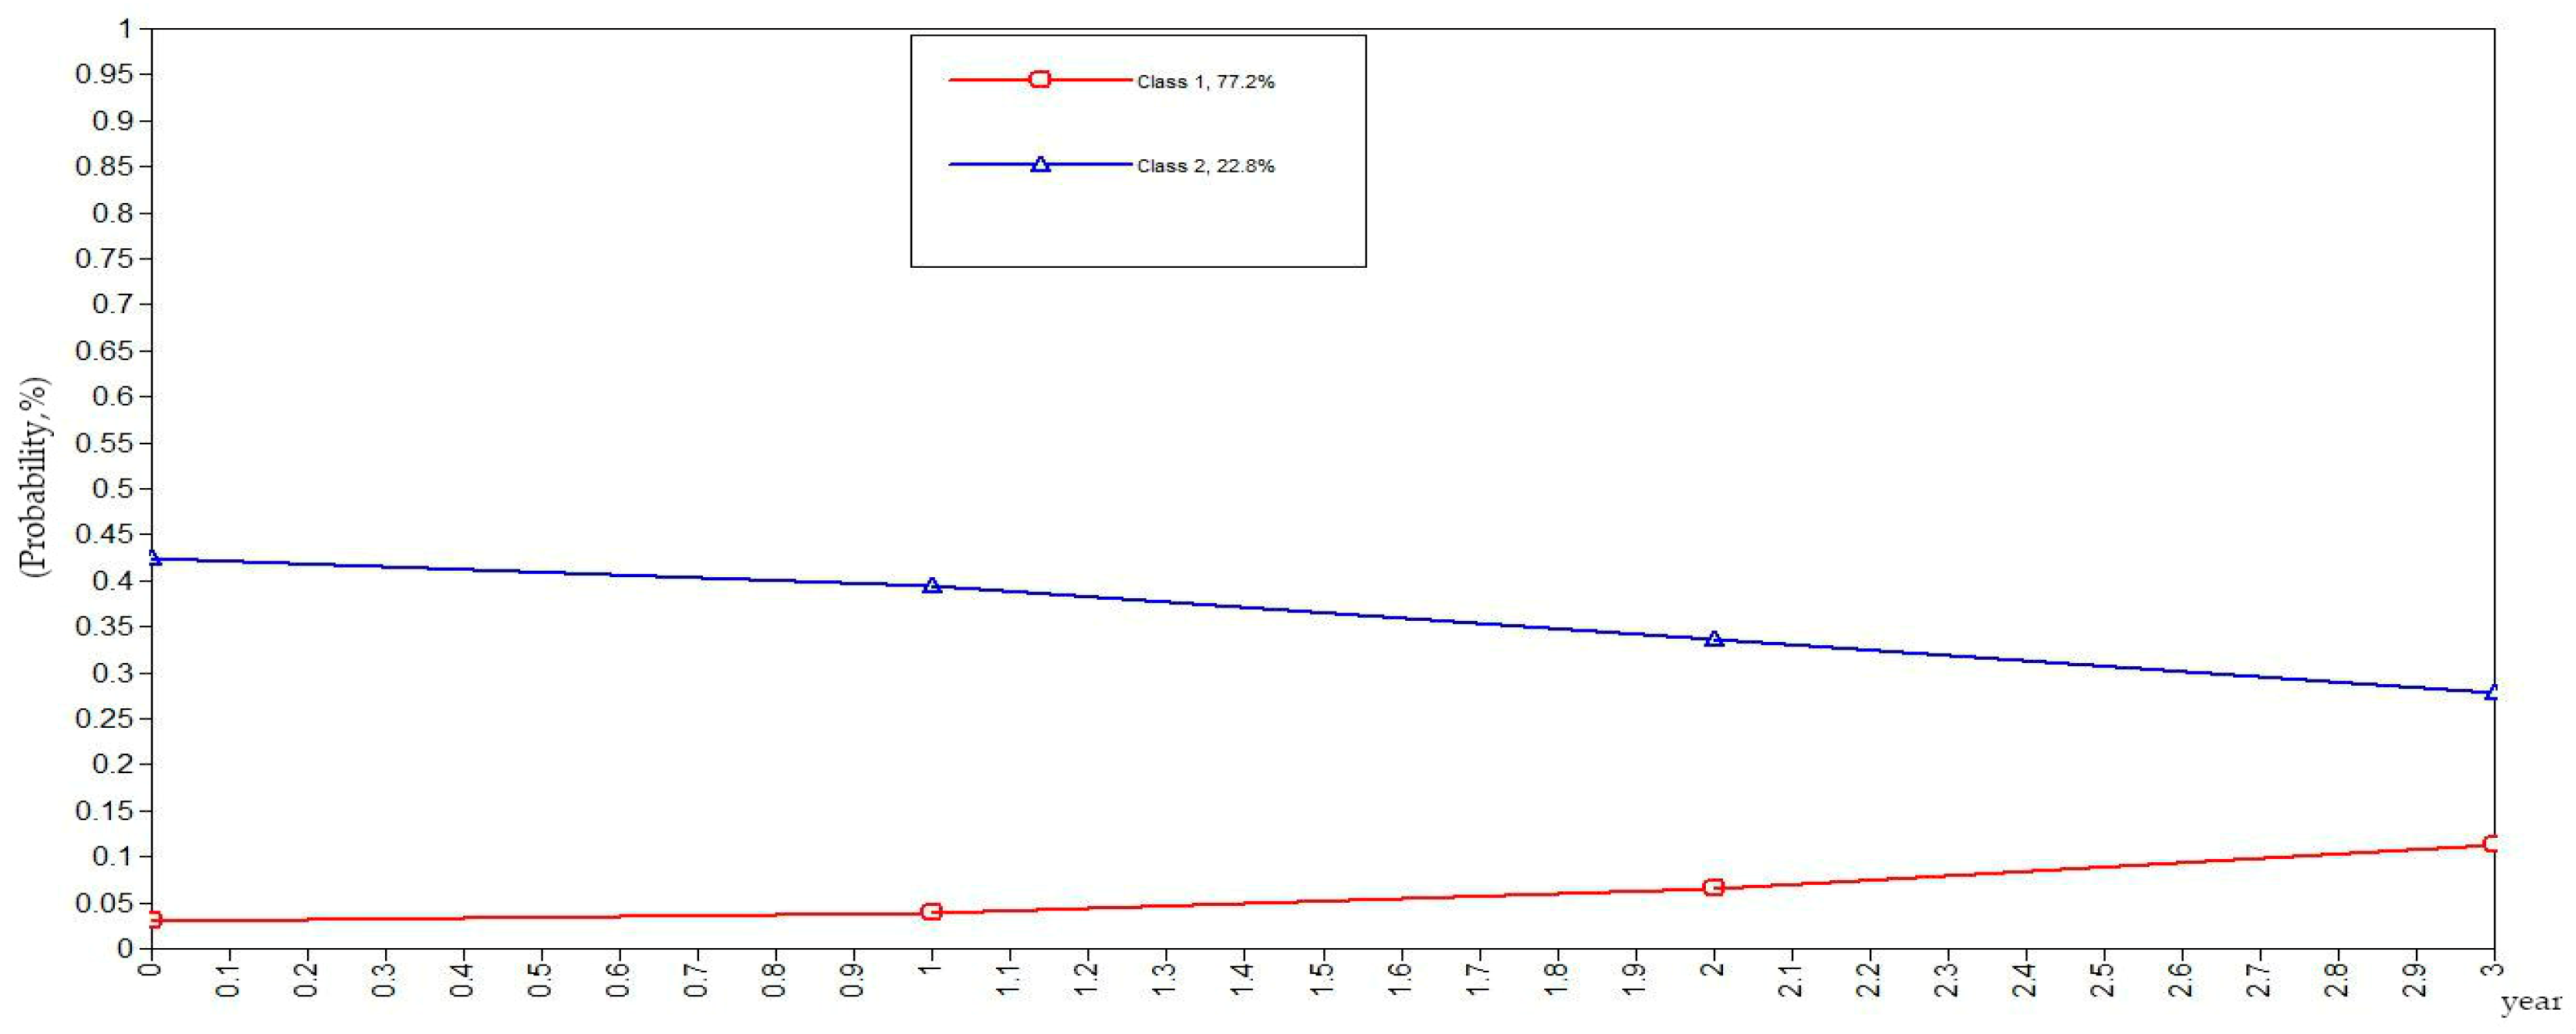
Figure 4 that the behavior modification probability value of the elderly with relatively positive healthy behaviors is higher, and the value of the elderly with non-modified behaviors is relatively stable. The estimated probability value of behavior modification in this class is always lower than the non-modified one. From Figure 5, it is reflected that the estimated probability value of behavior modification for positive health behaviors gets higher with age, and the value of non-modified behaviors is decreasing.
In general, elderly people with positive health behaviors have a better tendency for behavior modification. Among the various classes of health behaviors, the older the elderly with negative and relatively negative health behaviors is, the lower the probability of behavior modification will be. In addition, the elderly with fair, relatively positive and positive health behaviors would pay more attention to optimizing health behaviors as their age increases.

3.3. Influencing Factors of the Evolution of the Elderly’s Health Behaviors

In this study, the evolution results of the elderly’s health behaviors were processed as Bivariate variables (modified or non-modified). The Bivariate analysis model was used to estimate social health and services, SRH, family characteristics and individual characteristics of the evolution of health behaviors in the Chinese elderly, analyses were performed using Stata (Stata version 13.0 for Windows, StataCorp LP, College Station, TX, USA). The results are shown in Table 8. In general, as the variables continue to increase, the explanatory power of the model is gradually increasing. Specifically, the R2 of Model I is 0.180, suggesting that social security and services can explain the variance of 18.0% of the evolution of the elderly’s health behaviors. The R2 of Model II is 0.189, and SRH can explain only the variance of 0.9% of the evolution of health behaviors. Model III’s R2 is 0.201, and family characteristics can explain the variance of 1.2% of the evolution of the elderly’s health behaviors. Model IV’s R2 is 0.253, so the individual characteristics can explain the variance of 5.2% of the evolution of the elderly’s health behaviors.
What can be inferred from the regression results of these variables is that the timely treatment of illness in childhood has a significant negative effect on behavior modifications of the elderly. The probability of behavior modification of the elderly who received timely medical treatment in childhood is significantly lower than those who did not. The former is approximately 26.3–39.9% lower than the latter (p < 0.05, p < 0.001), indicating that the accessibility of medical services in childhood significantly reduced the elderly’s emphasis on health behaviors and the sense of modification for risky health behaviors. The probability of behavior modification of elderly people with pensions is significantly lower than that of those without pensions. The former is approximately 63.9–88.2% lower than the latter (p < 0.001), indicating that pension plays a role as a reverse incentive in the evolution of health behaviors. The probability of behavior modification of the elderly whose self-rated their own health as “unhealthy” is significantly higher than those who chose “very healthy”; the former’s probability is 2.868–2.989 (p < 0.001) times higher than the latter’s. With one additional unit in family annual income (taking the natural logarithm), the probability of behavior modification of the elderly decreased by 17.8–26.9% (p < 0.001).
The probability of behavior modification of the elderly increased by 3.1% with one year of ageing (p < 0.001). The probability of behavior modification of the elderly was reduced by 6.5% (p < 0.001) with a one-year-advancement in attaining education. The urban/county/rural distinction in the evolution of health behaviors in the elderly is also very significant, and the probability of behavior modification of the elderly is notably lower in those living in urban settings. The probability of behavior modification of the elderly in the country is 1.813 times (p < 0.001) higher than those in urban areas, and the probability of behavior modification in the rural elderly is also noticeably higher than the urban elderly with the former being 3.06 times (p < 0.001) higher. The differences of evolution are also distinct between occupational types; the probability of behavior modification of the elderly who were engaged in the public sector before the age of 60 was 39.5% lower than those who worked as commercial, service or industrial staff before the age of 60 (p < 0.01). The probability of behavior modification of the elderly engaged in agricultural works before the age of 60 is notably higher than that of the elderly who were engaged in commercial, service, or industrial jobs before the age of 60, the former being 1.525 times higher than that of the latter (p < 0.05). Hence, it can be inferred that there is a low probability of behavior modification of the elderly with relatively high-level occupations before the age of 60 and between the occupational level and the optimization of health behaviors exists a reverse correlation.

4. Discussion

LCA is widely adopted in the study of health behaviors. GMM can investigate the heterogeneity of the group and describe the trends within the group and is considered to be the most commonly used and most influential model for dealing with group heterogeneous growth. This study, as far as we know, is the first study to reflect the evolutionary trends of the health behaviors in the elderly in China based on LCA and GMM through large sample panel data, with the purpose of providing new evidence on the evolution of health behaviors of the Chinese elderly. We also further explored the influencing factors of that evolution trends, and some inspiring conclusions were drawn.
The BIC value was used as the main fit index for LCA. The Entropy value and AIC value of the model were simultaneously referenced. The health behaviors in Chinese elderly people in 2005–2014 can be categorized into five classes: Negative, relatively negative, fair, relatively positive, and positive. The evolution results of the elderly’s health behaviors were accordingly divided into two types: “modified” and “non-modified” through GMM. As seen from the results, 77.2% of Chinese elderly people reported a healthier trend in the 10 years from 2005–2014 while a total of 22.8% of elderly people who reported no modification in their health behaviors over the past 10 years were unchanged or even worse.
More specifically, with the increasing of age, the elderly with negative and relatively negative health behaviors find it more difficult to optimize their health behaviors, which implies that the unhealthy behaviors are strongly irreversible and extensible, thus timely and early intervention is essential. For the elderly with fair healthy behaviors, the estimated probability of behavior modification gets higher with age increasing, but the probability of unmodified behaviors are also slightly increased, indicating that the behavior optimization process of the elderly with fair health behaviors is more complicated. The elderly with general health behaviors still have a large probability of behavior optimization in that a probability of this type is always higher than the non-modified one. The relatively positive health behaviors and positive health behaviors in the elderly have a higher probability of behavior modification, and the possibility of behavior optimization of the elderly with non-modified behaviors is elevating.
The analysis of the influencing factors on the evolution of health behaviors in the Chinese elderly shows that economic factors have a significant reverse effect on the process of the elderly’s behavior modification. These factors include the timely treatment of disease during childhood, pensions, higher occupational level before the age of 60, higher family income, and urban household registration, all of which largely represent an adequate economic situation of the elderly. All of the above factors will reduce the probability of the elderly’s modification of their health behaviors. Specifically, because the childhoods of the elderly in these samples was concentrated between the 1950s and 1960s, when the Chinese public health and medical service system had just gotten started, the ability to enjoy proper medical services represents a higher social class and good economic condition. The availability of a pension and pension levels are closely related to occupations before the age of 60, and whether they have urban household registration or not. China’s pension system has obvious regional and occupational features, and its main coverage is in urban areas. The occupational groups covered are mainly concentrated within authority unit or institutions servants, state-owned enterprise employees and workers with urban household registration. These occupational categories are all in the upper and middle classes in Chinese occupational system, which brings higher social classes, social capital and economic income, and guarantees that they can get more adequate pensions after the age of 60. This conclusion has also been confirmed in previous studies [37,38]. However, high-income Chinese families have higher consumption levels of junk food, tobacco, and alcohol. Chinese elderly people with higher socioeconomic status tend to have more negative behavior trends. In addition, the lower the age and the less education they receive, the higher the probability of health behavior modification of the elderly will be, in a negative correlation.

5. Conclusions

Health behaviors play a significant role in determining the health status of individuals. Based on the above analysis, this study indicates that the improvement of the health behaviors in the Chinese elderly needs to be performed through the following three modes. The first is to conduct various forms of health education by extending health knowledge and enhancing self-discipline in the health behaviors in the elderly. The focus of this action should be on elderly groups with greater likelihood of health behavior modification, such as the rural elderly, the oldest of the elderly, and the elderly with less education. Furthermore, we should strengthen the construction of the monitoring system for the elderly’s health status and take measures to intervene as soon as possible for the elderly with unhealthy behaviors. The data analysis shows that the elderly with poor SRH are more likely to modify their behaviors. Based on this, a health monitoring system covering all of the elderly needs to be established to help the elderly confirm their health status in time and constrain their unhealthy behaviors. Lastly, considering that economic factors (pension, family income, etc.) have a negative impact on health behavior modification in the elderly, it is necessary to enhance the impact of family members, primary health care institutions and other groups (such as community service agency, social work group, etc.) on urging the elderly to control and modify risky health behaviors. Family members should promptly identify the unhealthy behaviors in the elderly in their daily lives and urge them to promptly modify such behaviors. Primary health care service institutions should also provide continuous service and guidance on daily diet, exercise, and health management for the elderly.

6. Future Areas of Research

Constrained by the CLHLS data structure, we failed to provide wider and more detailed information about the health behaviors in the elderly, such as health knowledge development, sleeping habits, occupational health protection, safe sexual behavior, etc. These factors are also vital to studies on health behavior. Thus, future research would lay more emphasis on a full-scale set of measurement indices of elderly health behaviors, expanding the sample size and ensuring a more balanced sample distribution to carry out more comprehensive and scientific measurements of health behaviors in the Chinese elderly. At the same time, the health outcomes of elderly’s health behaviors and their changes are worthy of further study. For example, what are the differences in activities of daily living, instrumental activities of daily living, cognitive ability, and frailty index among the elderly with different health behaviors?

Author Contributions

The authors are jointly responsible for the entire article. Y.F. analysed the data and wrote the manuscript. E.L. designed the study and reviewed the paper. Z.Y. and Q.Z. put forward the study topic and provided advice on the writing of the paper. T.H. responsible for collecting and cleansing the data.

Funding

This research was funded by the Major Project of Humanities and Social Sciences of Ministry of Education of China (Grant No.15JJD630009) (Grant No.16JJD840011) (Grant No.16JJD840009), the Foundation of Humanities and Social Sciences by the Ministry of Education of China (Grant No. 19YJA840006) (Grant No. 18YJC630259).

Acknowledgments

Data used in this research were provided by the study entitled “Chinese Longitudinal Longevity Survey” (CLHLS) was jointly implemented by the Center for Healthy Aging and Development Studies of Peking University and Duke University. CLHLS is supported by funds from the U.S. National Institutes on Aging (NIA), China Natural Science Foundation, China Social Science Foundation, and UNFPA.

Conflicts of Interest

The authors declare no conflict of interest.

Abbreviations

The following abbreviations are used in this manuscript:
AICAkaike’s Information Criterion
BICBayesian Information Criterion
BLRTBootstrap Likelihood Ratio Test
CLHLSChinese Longitudinal Healthy Longevity Survey
GMMGrowth Mixture Modeling
LCALatent Class Analysis
LLLog Likelihood
LMRLo-Mendell-Rubin
SRHSelf-rated Health

Appendix A

Table A1. Directions of each health behavior on elderly health.
Manifest Variables of Health Behaviors2005200820112014
Class 1Class 2Class 3Class 4Class 5Class 1Class 2Class 3Class 4Class 5Class 1Class 2Class 3Class 4Class 5Class 1Class 2Class 3Class 4Class 5
Staple Food Types++++++
Fresh Vegetables++++++++++++++
Tea++++++++++
Fresh Fruits+++++
Pickles+++++++++++++++++
Physical Activity+++++++++
Outdoor Activity+++++++++++++
Playing Cards or Mahjong+++++
Organized Social Activities+++++++
Smoking++++++++++++
Alcohol Consumption++++++++++++
Total(2+, 9−)(3+, 8−)(6+, 5−)(8+, 3−)(10+,1−)(1+,10−)(3+, 8−)(6+, 5−)(7+, 4−)(9+, 2−)(2+, 9−)(3+, 8−)(5+, 6−)(7+, 4−)(10+,1−)(3+, 8−)(4+, 7−)(5+, 6−)(7+, 4−)(9+, 2−)
ClassNRNFRPPNRNFRPPNRNFRPPNRNFRPP
LCP (%)30.190823.220824.358012.65599.574535.806118.802817.223717.774510.282829.709923.319918.509019.83117.822333.749122.010319.075614.78366.5297
Note: “+” or “-“ represent the impact direction of behavior on the health of the elderly; N = Negative, RN = Relatively Negative, F = Fair, RP = Relatively Positive, P = Positive; LCP = Latent Class Probability.

References

  1. Statistical Bulletin of the People’s Republic of China on National Economic and Social Development in 2018. Available online: http://www.stats.gov.cn/tjsj/zxfb/201902/t20190228_1651265.html (accessed on 28 February 2019).
  2. World Population Prospects: The 2012 Revision. Available online: http://esa.un.org/unpd/wpp/Excel-Data/population.htm (accessed on 17 January 2019).
  3. World Health Organization. World Health Report 1997. Available online: http://www.who.int/whr/1997/media_centre/dgmessage_en/en/ (accessed on 17 January 2019).
  4. World Health Organization. World Health Statistics 2018: Monitoring Health for the SDGs, Sustainable Development Goals. Available online: https://www.who.int/gho/publications/world_health_statistics/2018/en/ (accessed on 19 January 2019).
  5. World Bank. Toward a Healthy and Harmonious Life in CHINA: Stemming the Rising Tide of Non-Communicable Diseases. Available online: https://openknowledge.worldbank.org/handle/10986/27357 (accessed on 21 January 2019).
  6. Yin, Z.; Geng, G.; Lan, X.; Zhang, L.; Wang, S.; Zang, Y.; Peng, M. Status and determinants of health behavior knowledge among the elderly in China: A community-based cross-sectional study. BMC Public Health 2013, 13, 710. [Google Scholar] [CrossRef] [PubMed]
  7. Cao, W.J.; Chen, C.S.; Hua, Y.; Li, Y.M.; Xu, Y.Y.; Hua, Q.Z. Factor analysis of a health-promoting lifestyle profile (HPLP): Application to older adults in Mainland China. Arch. Gerontol. Geriatr. 2012, 55, 632–638. [Google Scholar] [CrossRef]
  8. Dai, Y.; Zhang, B.Q.; Zhang, W.C. The health promotion lifestyle in the elderly: A meta-analysis. Chin. J. Nurs. Educ. 2018, 5, 331–335. (In Chinese) [Google Scholar]
  9. Hu, J.; Guo, H.J.; Li, Y.; Qu, C.; Chen, Y.; Li, X.N.; Zhang, X.J. Health literacy and its influencing factors among residents aged 60-69 years in Jiangsu province. Chin. J. Public Health 2016, 9, 1156–1158. (In Chinese) [Google Scholar]
  10. Liu, Y.B.; Liu, L.; Li, Y.F.; Chen, Y.L. Relationship between health literacy, health-related behaviors and health status: A survey of elderly Chinese. Int. J. Environ. Res. Public Health 2015, 12, 9714–9725. [Google Scholar] [CrossRef] [PubMed]
  11. Wang, F.; Zhen, Q.K.; Li, K.G.; Wen, X. Association of socioeconomic status and health-related behavior with elderly health in China. PLoS ONE 2018, 9, e0204237. [Google Scholar] [CrossRef] [PubMed]
  12. Qi, X.; Wu, M.; Zeng, T.Y. Social support networks in Chinese older adults: Health outcomes and health related behaviors: A path analysis. Aging Ment. Health 2019, in press. [Google Scholar]
  13. Tang, C.X.; Wu, X.J.; Chen, X.F.; Pan, B.Y.; Yang, X.C. Examining income-related inequality in health literacy and health-information seeking among urban population in China. BMC Public Health 2019, 19, 221. [Google Scholar] [CrossRef] [PubMed]
  14. He, Z.F.; Cheng, Z.C.; Shao, T.; Liu, C.Y.; Shao, P.P.; Bishwajit, G.; Feng, D.; Feng, Z.C. Factors influencing health knowledge and behaviors among the elderly in rural China. Int. J. Environ. Res. Public Health 2016, 13, 975. [Google Scholar] [CrossRef]
  15. Li, D.M.; Chen, M.J. Health behavior inhabitors of the aged in rural China. Chin. J. Gerontol. 2014, 5, 1336–1338. (In Chinese) [Google Scholar]
  16. Qi, J.; Mao, Z.Y. The Effect of health intervention on health knowledge, attitude and practice among the middle-aged and elderly people in rural China. Popul. J. 2018, 2, 34–47. (In Chinese) [Google Scholar]
  17. Fu, H.; Feng, D.; Tang, S.F.; He, Z.F.; Xiang, Y.X.; Wu, T.L.; Wang, R.X.; Shao, T.; Liu, C.Y.; Shao, P.P.; et al. Prevalence of tobacco smoking and determinants of success in quitting smoking among patients with chronic diseases: A cross-sectional study in rural Western China. Int. J. Environ. Res. Public Health 2017, 14, 167. [Google Scholar] [CrossRef] [PubMed]
  18. Zhang, C.C.; Zhu, R.F.; Lu, J.; Xue, Y.Q.; Hou, L.H.; Li, M.M.; Zheng, X.; Yang, T.Z.; Zheng, J.Z. Health promoting lifestyles and influencing factors among empty nesters and non-empty nesters in Taiyuan, China: A cross-sectional study. Health Qual. Life Outcomes 2018, 16, 103. [Google Scholar] [CrossRef]
  19. Feng, Y.R.; Zhou, L.Z. The influence of living habits and family support on the health status of empty nesters in urban and rural areas. Chin. J. Gerontol. 2017, 14, 3591–3594. (In Chinese) [Google Scholar]
  20. Liang, Y.; Wu, W. Exploratory analysis of health-related quality of life among the empty-nest elderly in rural China: An empirical study in three economically developed cities in eastern China. Health Qual. Life Outcomes 2014, 12, 59. [Google Scholar] [CrossRef]
  21. Li, F.Y.; Xue, H.; Li, T.T.; Zhang, Z.A. Health literacy of empty nest elderly in Shibei district of Qingdao: A survey of current situation. Med. J. Qilu 2015, 6, 737–739. [Google Scholar]
  22. Norman, P.; Conner, M. The theory of planned behavior and exercise: Evidence for the mediating and moderating roles of planning on intention-behavior relationships. J. Sport Exerc. Psychol. 2005, 27, 488–504. [Google Scholar] [CrossRef]
  23. Curioso, W.H.; Kurth, A.E. Access, use and perceptions regarding Internet, cell phones and PDAs as a means for health promotion for people living with HIV in Peru. BMC Med. Inform. Decis. Mak. 2007, 7, 24. [Google Scholar] [CrossRef]
  24. Gu, L.; Rosenberg, M.W.; Zeng, J. Changing caregiving relationships for older home-based Chinese people in a transitional stage: Trends, factors and policy implications. Arch. Gerontol. Geriatr. 2017, 70, 219–229. [Google Scholar] [CrossRef]
  25. Zhang, H.; Wang, Y.Y.; Wu, D.; Chen, J.P. Evolutionary path of factors influencing life satisfaction among Chinese elderly: A perspective of data visualization. Int. J. Environ. Res. Public Health. 2018, 3, 35. [Google Scholar] [CrossRef]
  26. Zeng, Y.; Feng, Q.S.; Hesketh, T.; Christensen, K.; Vaupel, J.W. Survival, disabilities in activities of daily living, and physical and cognitive functioning among the oldest-old in China: A cohort study. Lancet 2017, 389, 1619–1629. [Google Scholar] [CrossRef]
  27. Zeng, Y.; Xiao, Z.Y.; Zhang, C.Y.; Liu, Y.Z.; Zhan, J.; Vaupel, J.W. Survey of health and longevity in 1998 and healthy life expectancy for the elderly in China. Popul. Sci. Chin. 2001, 3, 9–16. (In Chinese) [Google Scholar]
  28. Hotta, R.; Makizako, H.; Doi, T.; Tsutsumimoto, K.; Nakakubo, S.; Makino, K.; Suzuki, T.; Shimada, H. Healthy behaviors and incidence of disability in community-dwelling elderly. Am. J. Health Behav. 2018, 42, 51–58. [Google Scholar] [CrossRef]
  29. Lyu, J.; Lee, S.H.; Kim, H.Y. Associations between healthy lifestyles and health outcomes among older Koreans. Geriatr. Gerontol. 2016, 16, 663–669. [Google Scholar] [CrossRef] [PubMed]
  30. Harooni, J.; Hassanzadeh, A.; Mostafavi, F. Influencing factors on health promoting behavior among the elderly living in the community. J. Educ. Health Promot. 2014, 3, 40. [Google Scholar]
  31. Garrett, E.S.; Zeger, S.L. Latent class model diagnosis. Biometrics 2000, 56, 1055–1067. [Google Scholar] [CrossRef]
  32. Øvrum, A. Socioeconomic status and lifestyle choices: Evidence from latent class analysis. Health Econ. 2011, 20, 971–984. [Google Scholar] [CrossRef]
  33. Nylund, K.L.; Asparouhov, T.; Muthén, B.O. Deciding on the number of classes in latent class analysis and growth mixture modeling: A Monte Carlo Simulation study. Struct. Equ. Model. 2007, 14, 535–569. [Google Scholar] [CrossRef]
  34. Uzhova, I.; Woolhead, C.; Timon, C.M.; O’Sullivan, A.; Brennan, L.; Peñalvo, J.L.; Gibney, E.R. Generic meal patterns identified by latent class analysis: Insights from NANS (National Adult Nutrition Survey). Nutrients 2018, 10, 310. [Google Scholar] [CrossRef]
  35. Galloway, R.D. Health promotion: Causes, beliefs and measurements. Clin. Med. Res. 2003, 1, 249–258. [Google Scholar] [CrossRef]
  36. Limbers, C.A.; Turner, E.A.; Varni, J.W. Promoting healthy lifestyles: Behavior modification and motivational interviewing in the treatment of childhood obesity. J. Clin. Lipidol. 2008, 2, 169–178. [Google Scholar] [CrossRef] [PubMed]
  37. Wang, Z.H.; Zhai, F.Y.; Du, S.F.; Popkin, B.M. Dynamic shifts in Chinese eating behaviors. Asia Pac. J. Clin. Nutr. 2008, 17, 123–130. [Google Scholar] [PubMed]
  38. Kim, S.; Symons, M.; Popkin, B.M. Contrasting socioeconomic profiles related to healthier lifestyles in China and the United States. Am. J. Epidemiol. 2004, 159, 184–191. [Google Scholar] [CrossRef] [PubMed]
Figure 1. Evolution trends of the elderly with negative health behaviors.
Ijerph 16 01687 g001
Figure 2. Evolution trends of the elderly with relatively negative health behaviors.
Ijerph 16 01687 g002
Figure 3. Evolution trends of the elderly with fair health behaviors.
Ijerph 16 01687 g003
Figure 4. Evolution trends of the elderly with relatively positive health behaviors.
Ijerph 16 01687 g004
Figure 5. Evolution trends of the elderly with positive health behaviors.
Ijerph 16 01687 g005
Table 1. Descriptive statistics for manifest variables of health behaviors.
Manifest Variables of Health BehaviorsMeasurement2005 (%)2008 (%)2011 (%)2014 (%)
DietStaple Food Typesrice = 168.4268.4967.9966.58
whole grains = 23.203.824.776.10
flour = 314.9512.6013.3312.27
half rice and half flour = 412.8914.9513.6614.47
others = 50.550.150.440.59
Fresh Vegetablesrarely or never eat = 11.471.402.313.89
sometimes eat = 28.967.096.066.79
often eat = 333.1323.4725.9628.53
eat almost every day = 456.4568.0565.6660.78
Teararely or never drink = 148.4445.9858.2463.28
sometimes drink = 219.4315.9814.4015.79
drink almost every day = 332.1338.0527.3620.93
Fresh Fruitsrarely or never eat = 123.8320.9726.9928.83
sometimes eat = 239.8839.2235.8135.70
often eat = 325.0126.7721.5921.45
eat almost every day = 411.2713.0415.6114.03
Pickleseat almost every day = 127.8731.9538.7439.96
sometimes eat = 233.4645.6142.1644.47
rarely or never eat = 338.6722.4419.1015.57
ExercisePhysical Activityrarely or never = 152.8144.8840.2556.22
past or present = 224.7236.4340.5416.23
past and present = 322.4818.6919.2127.54
Social activitiesOutdoor Activityrarely or never = 120.2423.5025.7133.79
sometimes = 26.575.075.694.30
monthly = 34.814.332.205.25
weekly = 412.5212.6011.649.92
daily = 555.8654.5054.7646.75
Playing Cards or Mahjongrarely or never = 174.1577.2779.3678.96
sometimes = 25.294.524.336.10
monthly = 33.823.051.982.39
weekly = 48.265.625.665.21
daily = 58.489.558.677.34
Organized Social Activitiesrarely or never = 179.2982.0878.9981.60
sometimes = 210.437.3110.769.14
monthly = 33.314.303.012.94
weekly = 42.792.352.942.28
daily = 54.193.974.304.04
SmokingSmokingpast and present = 122.8118.5118.0716.78
past or present = 216.4520.6020.3118.29
rarely or never = 360.7460.8961.6264.93
Alcohol ConsumptionAlcohol Consumptionpast and present = 119.1013.4013.8814.51
past or present = 217.9623.3222.5114.32
rarely or never = 362.9563.2863.6171.17
Table 2. Description of influencing factors of the evolution of health behaviors.
VariableDefinitionMeanStd. Dev.p-Value
Social Security and ServicesCommunity Health Knowledge Servicesyes = 1, no = 00.3930.4880.787
Community Medical Servicesyes = 1, no = 00.2900.4541.000
Timely medical treatment during childhoodyes = 1, no = 00.4180.493<0.000
Timely medical treatment during 60-year-oldyes = 1, no = 0 0.9070.291<0.000
Pensionyes = 1, no = 00.2440.430<0.000
Health Insuranceenrolled = 1, unenrolled = 00.7100.454<0.000
SRHSelf-rated Healthvery unhealthy = 1, other = 00.0150.1200.936
unhealthy = 1, other = 00.1110.3141.000
basically healthy = 1, other = 00.3130.4640.173
healthy = 1, other = 00.4310.4950.351
very healthy = 1, other = 00.1310.337<0.000
Family CharacteristicsLiving Arrangementsliving with family = 1, other = 00.8600.3470.133
living alone = 1, other = 00.1290.3350.948
living in nursing homes = 1, other = 00.0110.103<0.060
Family Incomenatural logarithm after continuous measurements8.0221.059<0.000
Personal CharacteristicsAgecontinuous measurements (year)74.5877.4451.000
Education Attainmentcontinuous measurements (year)2.6843.712<0.000
GenderMale = 1, female = 00.4730.499<0.000
Marital Statushaving spouse = 1, no spouse = 00.5840.493<0.000
Household Registercity = 1, other = 00.1760.3810.133
county = 1, other = 00.1920.3940.948
village = 1, other = 00.6320.482<0.060
Occupation before 60professional or technical staff = 1, other = 00.0640.245<0.000
public sector staff = 1, other = 00.0460.210<0.000
commercial, service or industrial staff = 1, other = 00.1650.371<0.000
farmers = 1, other = 00.6540.4761.000
Domestic labour/unemployed = 1, other = 00.0720.2580.805
Table 3. Latent class analysis fit indexes.
Model ClassBICAICEntropyLLNpardf
2005
Model 160,894.358160,705.23091.000019,092.1759322693
Model 259,966.006659,705.95680.586318,068.9018442681
Model 359,502.351359,171.37870.631917,510.3237562669
Model 459,441.307259,039.41200.645617,354.3570682657
Model 559,408.445558,935.62760.607317,226.5726802645
Model 659,436.906558,893.16600.591917,160.1110922633
2008
Model 159,066.131258,877.06281.000017,633.1189322688
Model 258,148.606157,888.63700.571316,620.6931442676
Model 357,678.550957,347.68120.626216,055.7373562664
Model 457,614.477757,212.70730.592515,896.7635682652
Model 557,607.646457,134.97550.590115,795.0316802640
Model 657,608.899957,065.32830.571715,701.3844922628
2011
Model 158,444.299958,255.45581.000017,296.1445322669
Model 257,571.908357,312.24770.547616,328.9364442657
Model 357,196.702256,866.22510.600615,858.9137562645
Model 457,121.764456,720.47070.588715,689.1594682633
Model 557,087.185456,615.07520.587115,559.7639802621
Model 657,090.072356,547.14560.585915,467.8343922609
2014
Model 155,120.734654,932.85261.000016,078.0258322589
Model 253,958.897853,700.56010.633914,821.7333442577
Model 353,683.432853,354.63940.643314,451.8126562565
Model 453,545.853353,146.60410.632014,219.7773682553
Model 553,506.586853,036.88190.640114,086.0551802541
Model 653,538.135452,997.97480.610114,023.1480922529
Note: Npar represent number of free parameters, df represents degree of freedom.
Table 4. Latent class probability of health behaviors in Chinese Elderly (%).
NameNegativeRelatively NegativeFairRelatively PositivePositive
Latent class probability in 200530.190823.220824.358012.65599.5745
Latent class probability in 200835.806117.223718.802817.774510.2828
Latent class probability in 201129.709918.509023.319919.83117.8223
Latent class probability in 201433.749119.075622.010314.78366.5297
Table 5. Evolution of health behaviors in the Chinese elderly 2005–2014 (%).
Health Behaviors in 2005Health Behaviors in 2014
NegativeRelatively NegativeFairRelatively PositivePositive
Negative5.3645.3118.3926.924.02
Relatively Negative9.646.6463.356.0014.38
Fair6.788.7351.666.1726.66
Relatively positive5.5225.8715.9943.319.30
Positive3.4514.563526.8226.82
Table 6. GMM fit indexes.
ModelLLAICBICaBICEntropyLMRBLRTLatent Class Probability
Model 1−16,481.33732,980.67533,033.86033,005.265---1
Model 2−16,396.24332,816.48632,887.40032,849.2720.6980.00000.00000.772/0.228
Model 3−16,386.10832,802.21532,890.85832,843.1980.7690.00000.00010.740/0.019/0.242
Note: aBIC represent Adjusted BIC.
Table 7. GMM results of the Chinese elderly’s health behaviors.
ClassEstimateStd. ErrEstimate/Std. Errp-Value
Class 1Intercept Mean Value−3.261 0.099 −32.832 0.000
Slope Mean Value0.278 0.022 12.460 0.000
Class 2Intercept Mean Value0.000 0.000 999.000 999.000
Slope Man Value−0.130 0.025 −5.213 0.000
Between-classIntercept Variance0.169 0.065 2.592 0.010
Slope Variance0.000 0.000 0.012 0.991
Intercept Ijerph 16 01687 i001 Slope0.000 0.007 0.020 0.984
Table 8. Bivariate regression of the influencing factors of elderly’s health behaviors evolution.
VariableModel IModel IIModel IIIModel IV
bExp(b)bExp(b)bExp(b)bExp(b)
Community Provides Health Knowledge Services0.0451.0460.0291.0300.0521.0540.0391.040
Community Provides Medical Services0.1401.1500.1581.1710.1581.1710.0121.012
Illness Timely Treated in Childhood−0.509 ***0.601−0.492 ***0.611−0.471 ***0.625−0.305 **0.737
Illness Timely Treated in 60-year-old−0.3970.672−0.2890.749−0.1870.830−0.0830.921
Pension−2.136 ***0.118−2.132 ***0.119−1.920 ***0.147−1.018 ***0.361
Health Insurance−0.1720.842−0.1640.849−0.1960.822−0.1410.868
Self-rated Health (Very healthy = 0)
very unhealthy 1.040 *2.8290.9452.5730.6731.960
unhealthy 1.054 ***2.8680.999 ***2.7141.095 ***2.989
basically healthy 0.2051.2280.1381.1470.111111.7
healthy 0.1631.1770.1311.1400.04826.64
Living Arrangements (Living in nursing home = 0)
living with families 0.8242.2790.8722.391
living alone 0.8442.3250.6001.822
Family Income −0.313 ***0.731−0.184 ***0.832
Age 0.030 ***1.031
Education Attainment −0.067 ***0.935
Male 0.1211.128
Having Spouse −0.1270.880
Household registration (City = 0)
County 0.595 ***1.813
Village 1.118 ***3.060
Occupational (Commercial, service or industrial = 0)
professional or technical −0.2010.818
public sector −0.503 *0.605
Farmers 0.422 **1.525
Other 0.2421.274
Cons2.658 ***14.2672.307 ***10.0434.751 ***115.7060.3481.416
Log likelihood−1058.950−1047.659−1031.925−965.026
Chi-square Statistics466.000488.590520.050653.850
Pseudo R20.1800.1890.2010.253
Sample Size2723272327232723
Note: b represent coefficient of interpretation; *, **, *** indicate significance at levels of 10%, 5%, and 1%, respectively.

