Comparison of Frailty Screening Instruments in the Emergency Department

 , , and
Abstract
:1. Introduction
2. Materials and Methods
2.1. Participants
2.2. Preparation and Training
2.3. Screening Instruments
2.4. Data Collection and Study Outcome
2.5. Comprehensive Geriatric Assessment to Determine Frailty Status
2.6. Statistical Analysis
3. Results
4. Discussion
5. Conclusions
Author Contributions
Funding
Conflicts of Interest
References
- Foo, C.L.; Siu, V.W.; Ang, H.; Phuah, M.W.; Ooi, C.K. Risk stratification and rapid geriatric screening in an emergency department–a quasi-randomised controlled trial. BMC Geriatr. 2014, 14, 98. [Google Scholar] [CrossRef] [PubMed]
- Wallis, S.J.; Wall, J.; Biram, R.W.; Romero-Ortuno, R. Association of the clinical frailty scale with hospital outcomes. QJM 2015, 108, 943–949. [Google Scholar] [CrossRef] [PubMed] [Green Version]
- Credé, S.H.; O’Keeffe, C.; Mason, S.; Sutton, A.; Howe, E.; Croft, S.J.; Whiteside, M. What is the evidence for the management of patients along the pathway from the emergency department to acute admission to reduce unplanned attendance and admission? An evidence synthesis. BMC Health Serv. Res. 2017, 17, 355. [Google Scholar] [CrossRef] [PubMed]
- Peters, M.L. The older adult in the emergency department: Aging and atypical illness presentation. J. Emerg. Nurs. 2010, 36, 29–34. [Google Scholar] [CrossRef] [PubMed]
- Limpawattana, P.; Phungoen, P.; Mitsungnern, T. Atypical presentations of older adults at the emergency department and associated factors. Arch. Gerontol. Geriatr. 2016, 62, 97–102. [Google Scholar] [CrossRef] [PubMed]
- Morrison, L.; Costello, M.; Flannery, A.; Small, C.; Nevin, R.; Havelin, A.; O’Reilly, L.; Heffernan, L.; Hong, Y.Y.; Waters, R.; et al. Frailty in an acute hospital: Point prevalence and change in baseline status during hospitalisation. Age Ageing 2017, 46, 11–12. [Google Scholar] [CrossRef]
- Ellis, G.; Whitehead, M.A.; Robinson, D.; O’Neill, D.; Langhorne, P. Comprehensive geriatric assessment for older adults admitted to hospital: Meta-analysis of randomised controlled trials. Bmj 2011, 343, d6553. [Google Scholar] [CrossRef]
- Gray, L.C.; Peel, N.M.; Costa, A.P.; Burkett, E.; Dey, A.B.; Jonsson, P.V.; Lakhan, P.; Ljunggren, G.; Sjostrand, F.; Swoboda, W.; et al. Profiles of older patients in the emergency department: Findings from the interRAI Multinational Emergency Department Study. Ann. Emerg. Med. 2013, 62, 467–474. [Google Scholar] [CrossRef]
- Ferguson, C.; Woodard, J.; Banerjee, J.; Conroy, S. Operationalising frailty definitions in the emergency department—A mapping exercise. Age Ageing 2010, 39, i7. [Google Scholar]
- Latham, L.P.; Ackroyd-Stolarz, S. Emergency Department Utilization by Older Adults: A Descriptive Study. Can. Geriatr. J. 2014, 17, 118. [Google Scholar] [CrossRef]
- Salvi, F.; Morichi, V.; Grilli, A.; Lancioni, L.; Spazzafumo, L.; Polonara, S.; Abbatecola, A.M.; De Tommaso, G.; Dessi-Fulgheri, P.; Lattanzio, F. Screening for frailty in elderly emergency department patients by using the Identification of Seniors at Risk (ISAR). J. Nutr. Health Aging 2012, 16, 313–318. [Google Scholar] [CrossRef] [PubMed]
- Khandelwal, D.; Goel, A.; Kumar, U.; Gulati, V.; Narang, R.; Dey, A.B. Frailty is associated with longer hospital stay and increased mortality in hospitalized older patients. J. Nutr. Health Aging 2012, 16, 732–735. [Google Scholar] [CrossRef] [PubMed]
- Kahlon, S.; Pederson, J.; Majumdar, S.R.; Belga, S.; Lau, D.; Fradette, M.; Boyko, D.; Bakal, J.A.; Johnston, C.; Padwal, R.S.; et al. Association between frailty and 30-day outcomes after discharge from hospital. Cmaj 2015, 187, 799–804. [Google Scholar] [CrossRef] [PubMed] [Green Version]
- Conroy, S.P.; Turpin, S. New horizons: Urgent care for older people with frailty. Age Ageing 2016, 45, 577–584. [Google Scholar] [CrossRef] [PubMed]
- Hubbard, R.E.; Peel, N.M.; Samanta, M.; Gray, L.C.; Mitnitski, A.; Rockwood, K. Frailty status at admission to hospital predicts multiple adverse outcomes. Age Ageing 2017, 46, 801–806. [Google Scholar] [CrossRef] [Green Version]
- Devriendt, E.; De Brauwer, I.; Vandersaenen, L.; Heeren, P.; Conroy, S.; Boland, B.; Flamaing, J.; Sabbe, M.; Milisen, K. Geriatric support in the emergency department: A national survey in Belgium. BMC Geriatr. 2017, 17, 68. [Google Scholar] [CrossRef] [PubMed]
- Schoenenberger, A.W.; Bieri, C.; Özgüler, O.; Moser, A.; Haberkern, M.; Zimmermann, H.; Stuck, A.E.; Exadaktylos, A. A novel multidimensional geriatric screening tool in the ED: Evaluation of feasibility and clinical relevance. Am. J. Emerg. Med. 2014, 32, 623–628. [Google Scholar] [CrossRef]
- Elliott, A.; Phelps, K.; Regen, E.; Conroy, S.P. Identifying frailty in the Emergency Department—Feasibility study. Age Ageing 2017, 46, 840–845. [Google Scholar] [CrossRef]
- Elliott, A.; Hull, L.; Conroy, S.P. Frailty identification in the emergency department—A systematic review focusing on feasibility. Age Ageing 2017, 46, 509–513. [Google Scholar] [CrossRef]
- Fallon, A.; Kennelly, S.; O’Neill, D. Frailty in emergency departments. Lancet 2016, 387, 1720. [Google Scholar] [CrossRef]
- Aminzadeh, F.; Dalziel, W.B. Older adults in the emergency department: A systematic review of patterns of use, adverse outcomes, and effectiveness of interventions. Ann. Emerg. Med. 2002, 39, 238–247. [Google Scholar] [CrossRef] [PubMed] [Green Version]
- De Vries, N.M.; Staal, J.B.; Van Ravensberg, C.D.; Hobbelen, J.S.M.; Rikkert, M.O.; Nijhuis-Van der Sanden, M.W.G. Outcome instruments to measure frailty: A systematic review. Ageing Res. Rev. 2011, 10, 104–114. [Google Scholar] [CrossRef] [PubMed]
- Carpenter, C.R.; Shelton, E.; Fowler, S.; Suffoletto, B.; Platts-Mills, T.F.; Rothman, R.E.; Hogan, T.M. Risk factors and screening instruments to predict adverse outcomes for undifferentiated older emergency department patients: A systematic review and meta-analysis. Acad. Emerg. Med. 2015, 22, 1–21. [Google Scholar] [CrossRef] [PubMed]
- British Geriatric Society. Fit for Frailty: Consensus Best Practice Guidance for the Care of Older People Living with Frailty in Community and Outpatient Settings. 2014. Available online: http://www.bgs.org.uk/campaigns/fff/fff_full.pdf (accessed on 28 June 2019).
- Raîche, M.; Hébert, R.; Dubois, M. PRISMA-7: A case-finding tool to identify older adults with moderate to severe disabilities. Arch. Gerontol. Geriatr. 2008, 47, 9–18. [Google Scholar] [CrossRef] [PubMed]
- Hoogendijk, E.O.; Van Der Horst, H.E.; Deeg, D.J.; Frijters, D.H.; Prins, B.A.; Jansen, A.P.; Nijpels, G.; Van Hout, H.P. The identification of frail older adults in primary care: Comparing the accuracy of five simple instruments. Age Ageing 2012, 42, 262–265. [Google Scholar] [CrossRef] [PubMed]
- Clegg, A.; Rogers, L.; Young, J. Diagnostic test accuracy of simple instruments for identifying frailty in community-dwelling older people: A systematic review. Age Ageing 2015, 44, 148–152. [Google Scholar] [CrossRef] [PubMed]
- Mackway-Jones, K.; Marsden, J.; Windle, J. Emergency Triage: Manchester Triage Group, 3rd ed.; BMJ Publishing Group: London, UK, 2014; ISBN 978-1-11-829906-7. [Google Scholar]
- Kojima, G. Prevalence of Frailty in Nursing Homes: A Systematic Review and Meta-Analysis. JAMDA 2015, 16, 940–945. [Google Scholar] [CrossRef] [PubMed]
- Rockwood, K.; Song, X.; MacKnight, C.; Bergman, H.; Hogan, D.B.; McDowell, I.; Mitnitski, A. A global clinical measure of fitness and frailty in elderly people. Cmaj 2005, 173, 489–495. [Google Scholar] [CrossRef] [PubMed] [Green Version]
- Juma, S.; Taabazuing, M.M.; Montero-Odasso, M. Clinical frailty scale in an acute medicine unit: A simple tool that predicts length of stay. Can. Geriatr. J. 2016, 19, 34. [Google Scholar] [CrossRef]
- O’Caoimh, R.; Gao, Y.; Svendrovski, A.; Healy, E.; O’Connell, E.; O’Keeffe, G.; Cronin, U.; O’Herlihy, E.; Cornally, N.; Molloy, W.D. Screening for markers of frailty and perceived risk of adverse outcomes using the Risk Instrument for Screening in the Community (RISC). BMC Geriatr. 2014, 14, 104. [Google Scholar] [CrossRef]
- McCusker, J.B.F.; Cardin, S.; Trepanier, S.; Verdon, J.; Ardman, O. Detection of older people at increased risk of adverse health outcomes after an emergency visit: The ISAR screening tool. J. Am. Geriatr. Soc. 1999, 47, 1229–1237. [Google Scholar] [CrossRef] [PubMed]
- O’Caoimh, R.; Cornally, N.; Weathers, E.; O’Sullivan, R.; Fitzgerald, C.; Orfila, F.; Clarnette, R.; Paúl, C.; Molloy, D.W. Risk prediction in the community: A systematic review of case-finding instruments that predict adverse healthcare outcomes in community-dwelling older adults. Maturitas 2015, 82, 3–21. [Google Scholar] [CrossRef] [PubMed]
- Yao, J.L.; Fang, J.; Lou, Q.Q.; Anderson, R.M. A systematic review of the identification of seniors at risk (ISAR) tool for the prediction of adverse outcome in elderly patients seen in the emergency department. Int. J. Clin. Exp. Med. 2015, 8, 4778. [Google Scholar] [PubMed]
- Galvin, R.; Gilleit, Y.; Wallace, E.; Cousins, G.; Bolmer, M.; Rainer, T.; Smith, S.M.; Fahey, T. Adverse outcomes in older adults attending emergency departments: A systematic review and meta-analysis of the Identification of Seniors at Risk (ISAR) screening tool. Age Ageing 2017, 46, 179–186. [Google Scholar]
- Morley, J.E.; Malmstrom, T.K.; Miller, D.K. A simple frailty questionnaire (FRAIL) predicts outcomes in middle aged African Americans. J. Nutr. Health Aging 2012, 16, 601–608. [Google Scholar] [CrossRef] [PubMed] [Green Version]
- Steverink, N.; Slaets, J.P.J.; Schuurmans, H.; Van Lis, M. Measuring frailty: Developing and testing the GFI (Groningen Frailty Indicator). Gerontologist 2001, 41, 236. [Google Scholar]
- Rubenstein, L.Z.; Harker, J.O.; Salvà, A.; Guigoz, Y.; Vellas, B. Screening for undernutrition in geriatric practice: Developing the short-form mini-nutritional assessment (MNA-SF). J. Gerontol. A Biol. Sci. Med. Sci. 2001, 56, 366–372. [Google Scholar] [CrossRef]
- Lilamand, M.; Kelaiditi, E.; Cesari, M.; Raynaud-Simon, A.; Ghisolfi, A.; Guyonnet, S.; Vellas, B.; Van Kan, G.A. Validation of the Mini Nutritional Assessment-Short Form in a population of frail elders without disability. Analysis of the Toulouse Frailty Platform population in 2013. J. Nutr. Health Aging 2015, 19, 570–574. [Google Scholar] [CrossRef]
- Galvin, J.E.; Roe, C.M.; Powlishta, K.K.; Coats, M.A.; Muich, S.J.; Grant, E.; Miller, J.P.; Storandt, M.; Morris, J.C. The AD8 A brief informant interview to detect dementia. Neurology 2005, 65, 559–564. [Google Scholar] [CrossRef]
- Carpenter, C.R.; DesPain, B.; Keeling, T.N.; Shah, M.; Rothenberger, M. The Six-Item Screener and AD8 for the detection of cognitive impairment in geriatric emergency department patients. Ann. Emerg. Med. 2011, 57, 653–661. [Google Scholar] [CrossRef]
- Hodkinson, H.M. Evaluation of a mental test score for assessment of mental impairment in the elderly. Age Ageing 1972, 1, 233–238. [Google Scholar] [CrossRef] [PubMed]
- Brazier, J.E.; Walters, S.J.; Nicholl, J.P.; Kohler, B. Using the SF-36 and Euroqol on an elderly population. Qual. Life Res. 1996, 5, 195–204. [Google Scholar] [CrossRef] [PubMed]
- DeSalvo, K.B.; Fan, V.S.; McDonell, M.B.; Fihn, S.D. Predicting mortality and healthcare utilization with a single question. Health Serv. Res. 2005, 40, 1234–1246. [Google Scholar] [CrossRef] [PubMed]
- Bédard, M.; Molloy, D.W.; Squire, L.; Dubois, S.; Lever, J.A.; O’Donnell, M. The Zarit Burden Interview: A new short version and screening version. Gerontologist 2001, 41, 652–657. [Google Scholar] [CrossRef] [PubMed]
- DeLong, E.R.; DeLong, D.M.; Clarke-Pearson, D.L. Comparing the areas under two or more correlated receiver operating characteristic curves: A nonparametric approach. Biometrics 1988, 44, 837–845. [Google Scholar] [CrossRef] [PubMed]
- Flahault, A.; Cadilhac, M.; Thomas, G. Sample size calculation should be performed for design accuracy in diagnostic test studies. J. Clin. Epidemiol. 2005, 58, 859–862. [Google Scholar] [CrossRef] [PubMed]
- Parenti, N.; Reggiani, M.L.B.; Iannone, P.; Percudani, D.; Dowding, D. A systematic review on the validity and reliability of an emergency department triage scale, the Manchester Triage System. Int. J. Nurs. Stud. 2014, 51, 1062–1069. [Google Scholar] [CrossRef] [PubMed]
- Cronin, J.G. The introduction of the Manchester triage scale to an emergency department in the Republic of Ireland. Accid. Emerg. Nurs. 2003, 11, 121–125. [Google Scholar] [CrossRef]
- Modified Bournemouth Frailty Criteria: Over 65 from a Care Home, over 85, over 75 with 2 of: Acute Confusion, Amts <7/10, History of Falls, Incontinence, Impaired Mobility, Care Package, Multi-Morbidity. Enhanced Needs Assessment of Frail and Elderly People in Stafford & Surrounds. Available online: https://www.staffordbc.gov.uk/sites/default/files/cme/DocMan1/EnvironmentalHealth/Health and Wellbeing/Stafford--Surrounds_Frail--Elderly-Health-Needs-Assessment.pdf (accessed on 22 August 2019).
- O’Caoimh, R.; Kennelly, S.; O’Shea, D. Can the Geriatric Day Hospital Act as a Hub for Services for Older People across the Spectrum of Ageing from Active Ageing to Advanced Frailty? Front. Med. 2018, 5, 23. [Google Scholar] [CrossRef]
- Liotta, G.; Ussai, S.; Illario, M.; O’Caoimh, R.; Cano, A.; Holland, C.; Roller-Wirnsberger, R.; Capanna, A.; Grecuccio, C.; Ferraro, M.; et al. Frailty as the Future Core Business of Public Health: Report of the Activities of the A3 Action Group of the European Innovation Partnership on Active and Healthy Ageing (EIP on AHA). Int. J. Environ. Res. Public Health 2018, 15, 2843. [Google Scholar] [CrossRef]
- Coffey, A.; Leahy-Warren, P.; Savage, E.; Hegarty, J.; Cornally, N.; Day, M.R.; Sahm, L.; O’Connor, K.; O’Doherty, J.; Liew, A.; et al. Interventions to Promote Early Discharge and Avoid Inappropriate Hospital (Re)Admission: A Systematic Review. Int. J. Environ. Res. Public Health 2019, 16, 2457. [Google Scholar] [CrossRef]
- Hansson, A.; Svensson, A.; Hedman Ahlström, B.; Forsman, B.; Ahlsén, P. Flawed communications: Health professionals’ experience of collaboration in the care of frail elderly patients. Scand. J. Public Health 2017, 46, 680–689. [Google Scholar] [CrossRef]
- Jansen-Kosterink, S.; van Velsen, L.; Frazer, S.; Dekker-van Weering, M.; O’Caoimh, R.; Vollenbroek-Hutten, M. Identification of community-dwelling older adults at risk of frailty using the PERSSILAA screening pathway: A methodological guide and results of a large-scale deployment in the Netherlands. BMC Public Health 2019, 19, 504. [Google Scholar] [CrossRef]

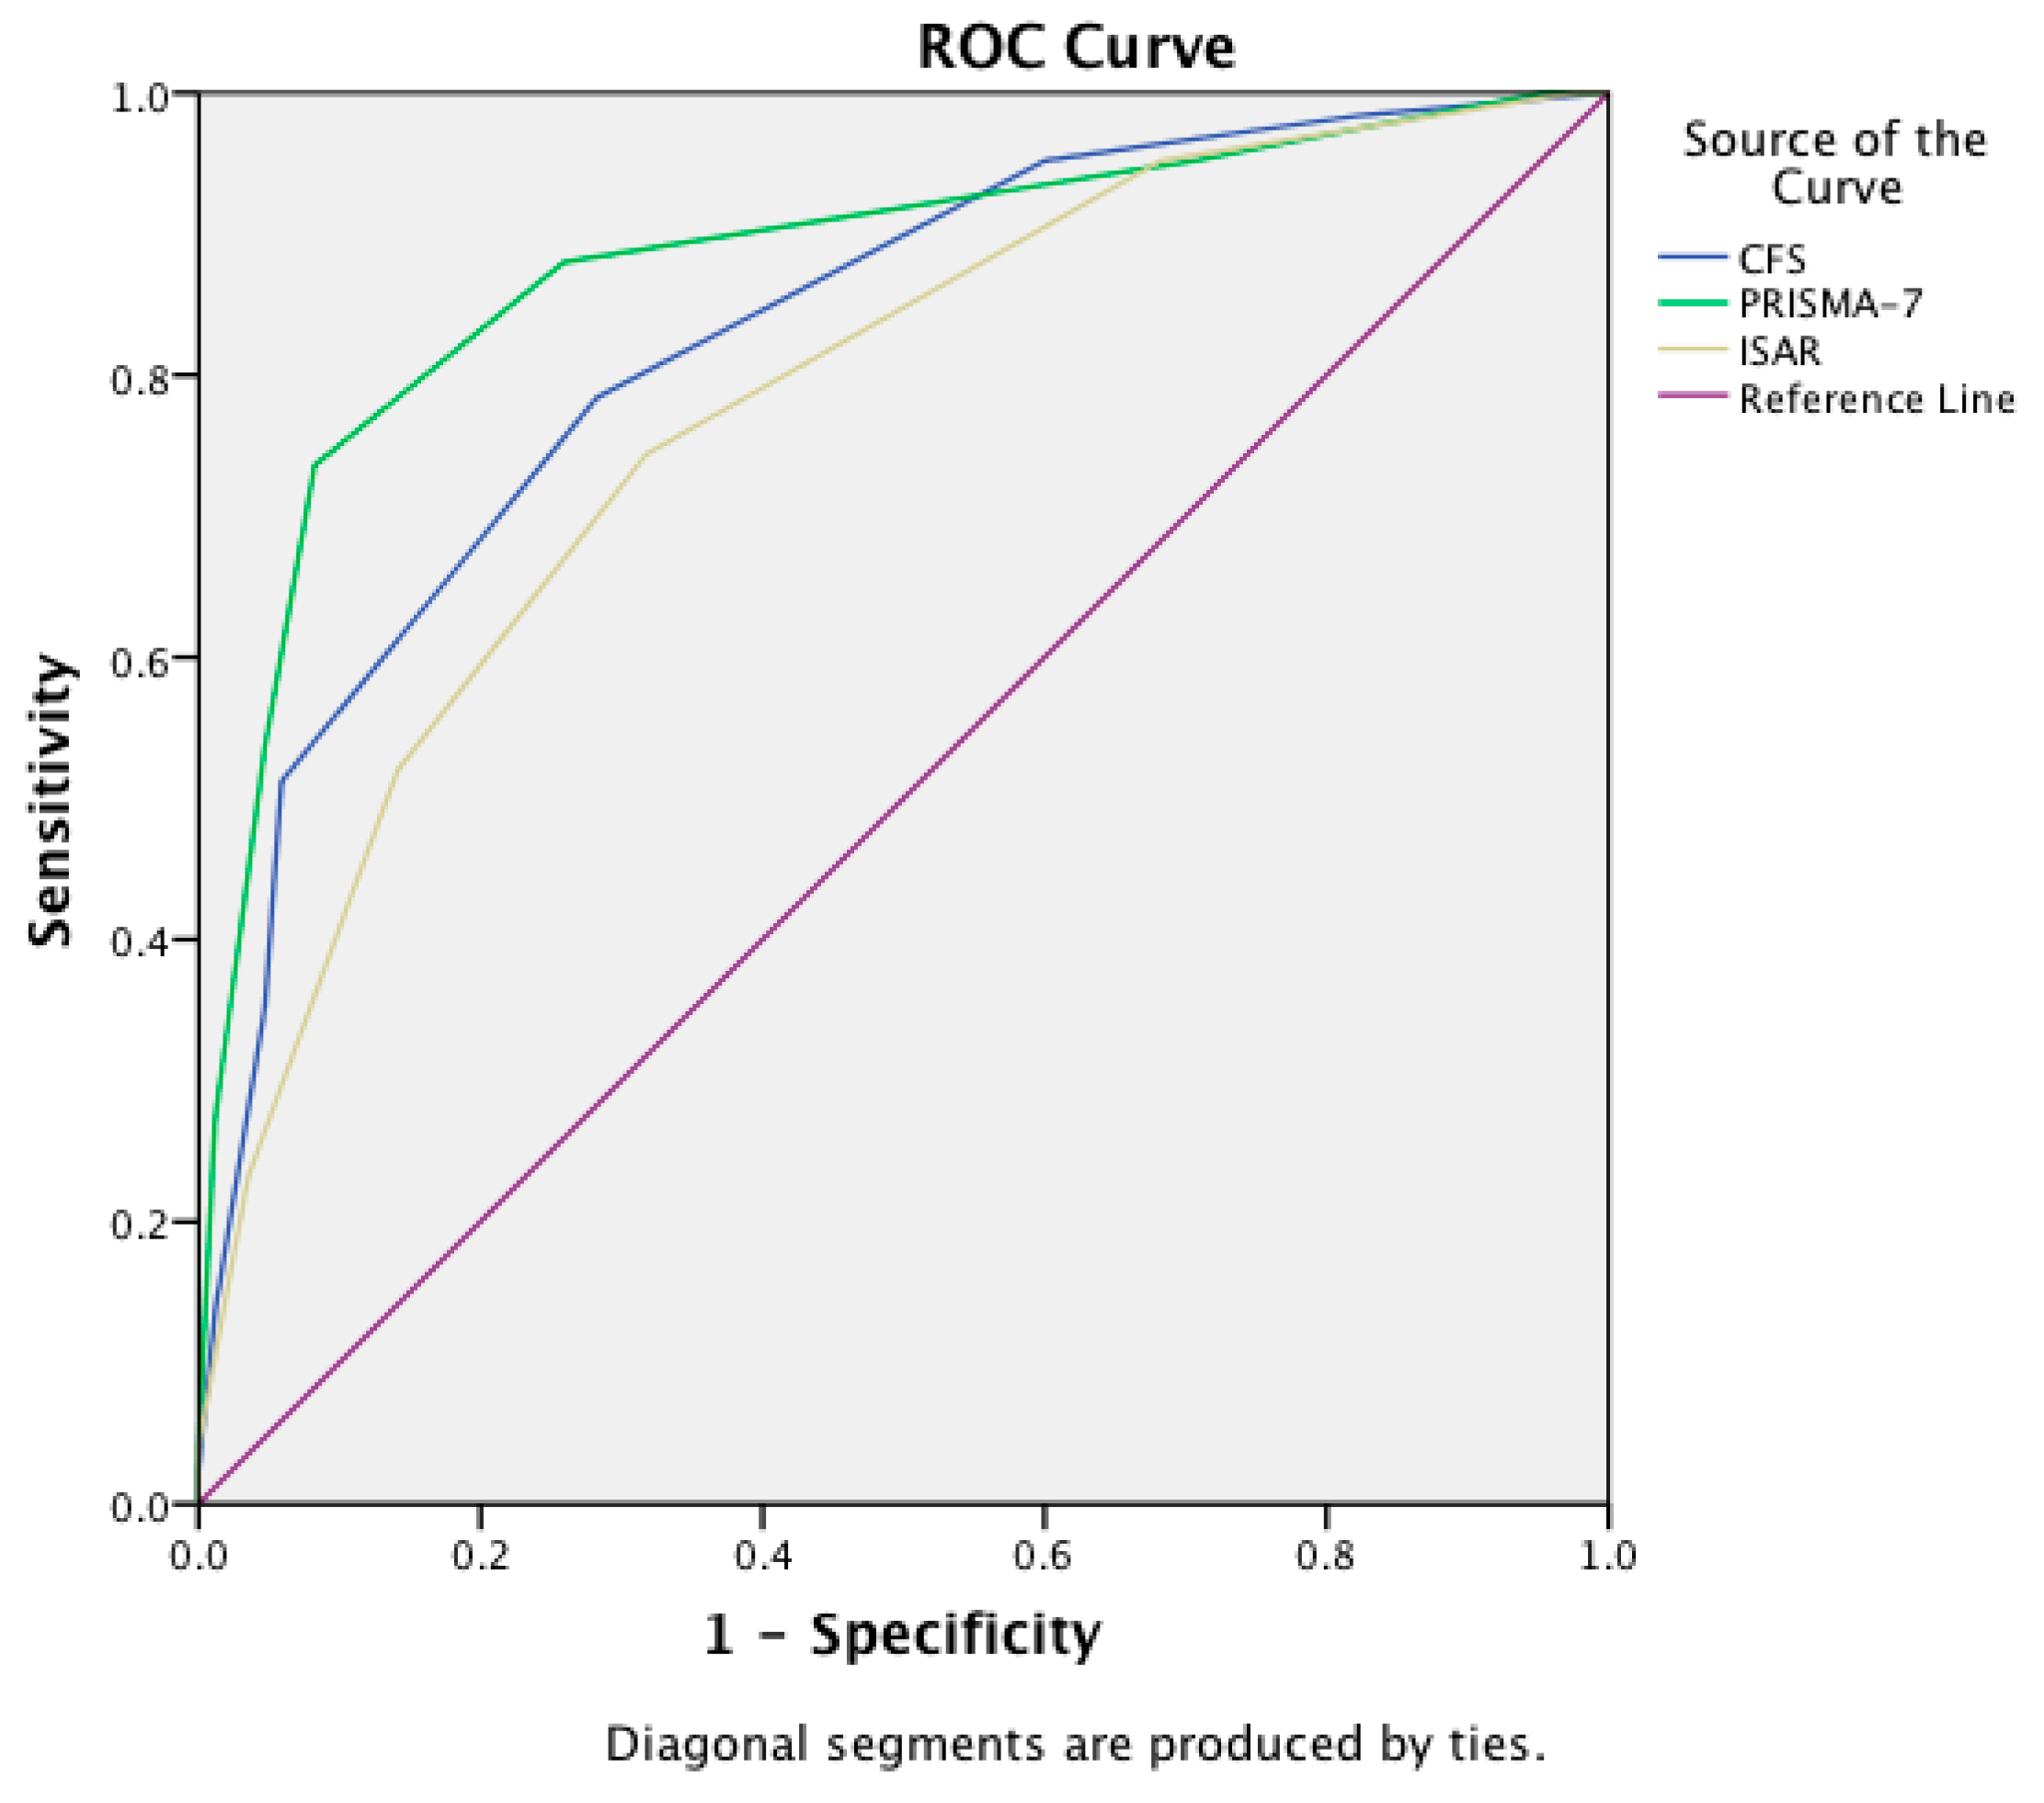
| Instrument | Area Under the Curve | 95% Confidence Interval |
|---|---|---|
| CFS | 0.83 | 0.77–0.88 |
| PRISMA-7 | 0.88 | 0.83–0.93 |
| ISAR | 0.78 | 0.71–0.84 |

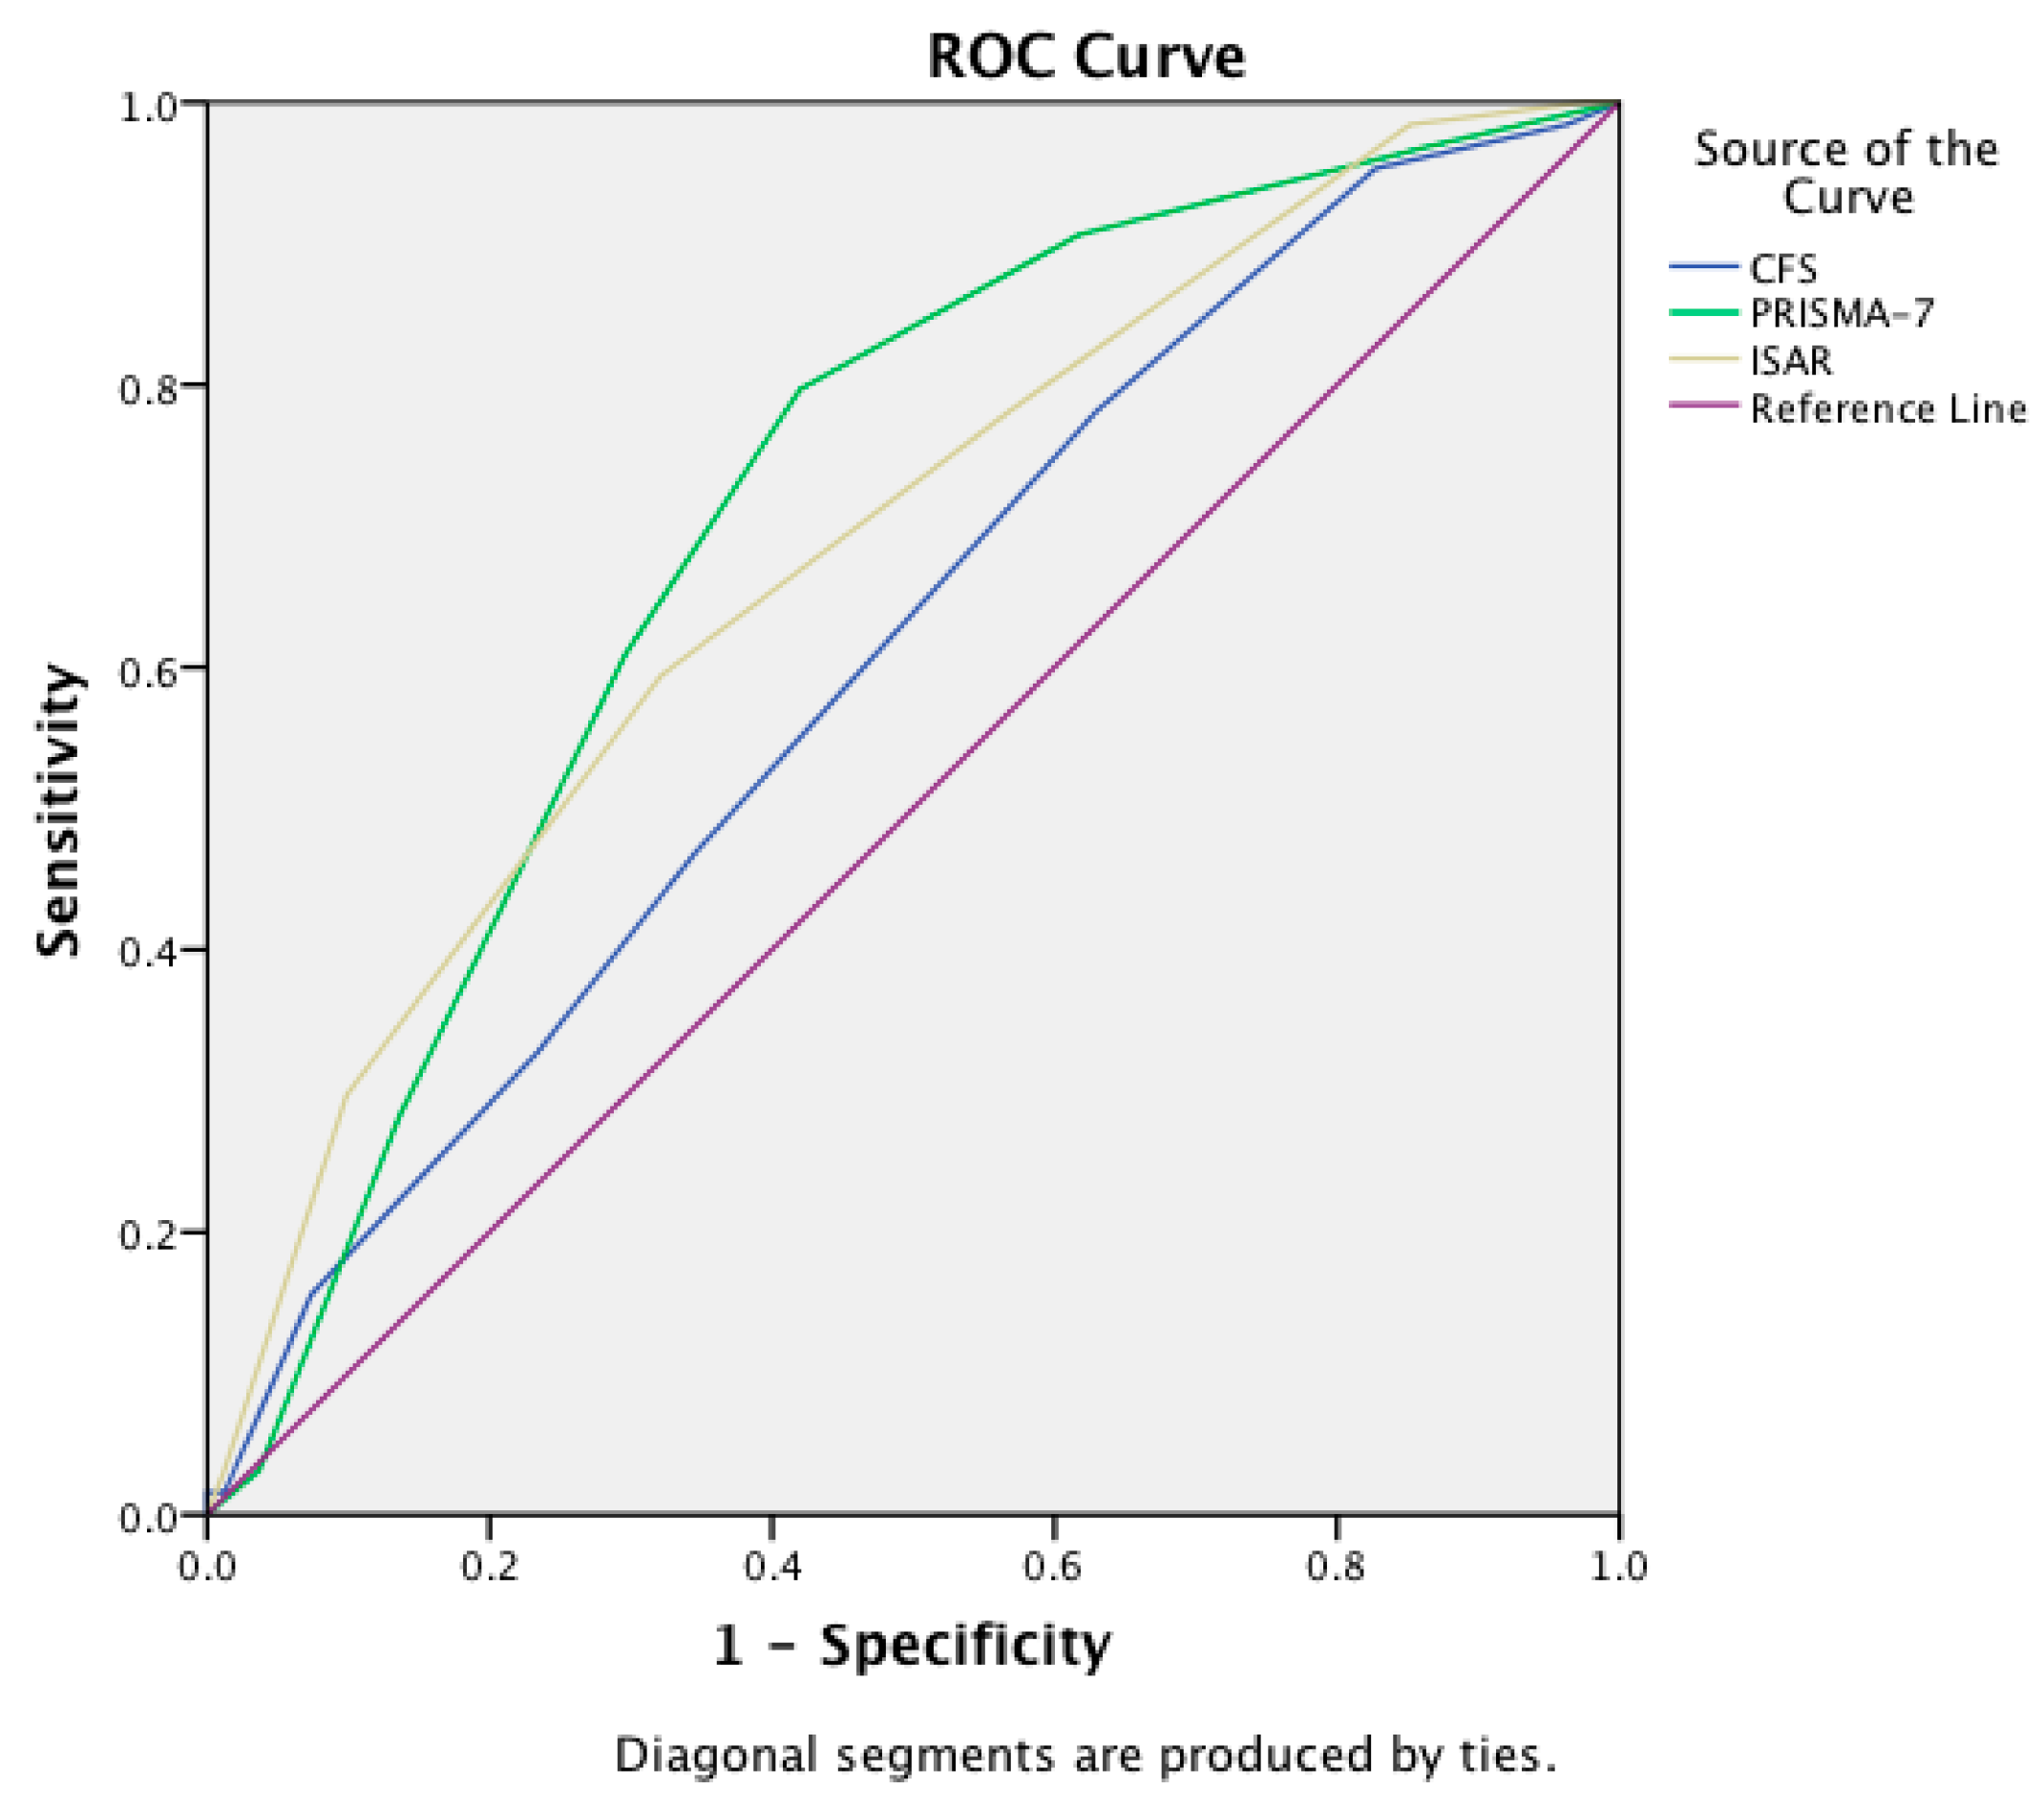
| Instrument | Area Under the Curve | 95% Confidence Interval |
|---|---|---|
| CFS | 0.61 | 0.51–0.70 |
| PRISMA-7 | 0.71 | 0.62–0.79 |
| ISAR | 0.68 | 0.59–0.77 |

| Predictor | Total Median (Q3−Q1 = ±IQR) | Frail Median (Q3−Q1 = ±IQR) | Non Frail Median (Q3−Q1 = ±IQR) | P = X |
|---|---|---|---|---|
| Age (Years) | 78 (83−74 = ±9) | 80 (84−75 = ±9) | 76 (82−73 = ±9) | z = −3.3 p = 0.001 |
| Sex (% Female) | 54% | 54% | 53% | X2(1) = 0.01 p = 0.91 |
| BMI | 25.7 (28.7−22.5 = ±6.2) | 25.3 (28−22 = ±6) | 25.9 (29−23 = ±6) | z = −1 p = 0.36 |
| MNA-SF | 11 (13−9 = ±4) | 9 (12−7 = ±5) | 12 (14−11 = ±3) | z = −7.5 p < 0.001 |
| AD8 | 0 (2−0 = ±2) | 1 (3−0 = ±3) | 0 (0−0 = ±0) | z = −6.8 p < 0.001 |
| AMTS | 9 (10−7 = ±3) | 9 (10−5 = ±5) | 10 (10−8 = ±2) | z = −2 p = 0.04 |
| CBS | 4 (17−0 = ±17) | 12 (20−4 = ±16) | 0 (0−0 = ±0) | z = −4.5 p < 0.001 |
| EQ-5D (VAS) | 60 (80−50 = ±30) | 50 (60−40 = ±20) | 80 (85−60 = ±25) | z = −8.3 p < 0.001 |
| GSRH (% Very good or excellent) | 21% | 5% | 43% | X2(1) = 53 p < 0.001 |
| GFI | 4 (7−2 = ±5) | 6 (8−5 = ±3) | 2 (3−1 = ±2) | z = −12.4 p < 0.001 |
| FRAIL scale | 1 (3−0 = ±3) | 2 (3−1 = ±2) | 0 (1−0 = ±1) | z = −10.1 p < 0.001 |
| ISAR | 3 (4−2 = ±2) | 3.5 (4−2 = ±2) | 2 (3−1 = ±2) | z = −8.1 p < 0.001 |
| CFS | 4 (5−3 = ±2) | 5 (6−4 = ±2) | 3 (4−2 = ±2) | z = −8.2 p < 0.001 |
| PRISMA-7 | 3 (5−2 = ±3) | 5 (6−3 = ±3) | 2 (2−1 = ±1) | z = −10.3 p < 0.001 |
| Frailty Classification Approach | CGA AUC (with 95% CI) | FRAIL Scale AUC (with 95% CI) | GFI AUC (with 95% CI) |
|---|---|---|---|
| Instrument | |||
| CFS | 0.83 (0.77–0.88) | 0.68 (0.61–0.76) | 0.81 (0.75–0.86) |
| PRISMA-7 | 0.88 (0.83–0.93) | 0.79 (0.74–0.85) | 0.82 (0.77–0.87) |
| ISAR | 0.78 (0.71–0.84) | 0.74 (0.67–0.80) | 0.77 (0.71–0.82) |
| Frailty Screen Cut-Off Score | Youden’s Index | Sensitivity (95% CI) | Specificity (95% CI) | PPV (95% CI) | NPV (95% CI) | False Positive (95% CI) | False Negative (95% CI) |
|---|---|---|---|---|---|---|---|
| CFS | |||||||
| ≥3 | 0.35 | 95% (89–98) | 40% (30–51) | 70% (62–77) | 85% (69–94) | 30% (23–38) | 15% (6–31) |
| ≥4 ^ | 0.5 | 78% (70–85) | 72% (61–81) | 80% (72–87) | 69% (58–78) | 20% (13–28) | 31% (22–42) |
| ≥5 * | 0.45 | 51% (42–60) | 94% (86–98) | 93% (83–97) | 57% (48–65) | 7% (3–17) | 43% (35–52) |
| ≥6 | 0.3 | 35% (27–44) | 95% (88–98) | 92% (79–97) | 50% (42–58) | 8% (3–21) | 50% (42–58) |
| ISAR | |||||||
| ≥1 | 0.05 | 100% (97–100) | 5% (2–11) | 59% (53–65) | 100% (46–100) | 41% (35–47) | 0% (0–54) |
| ≥2 * | 0.3 | 95% (90–98) | 35% (26–45) | 67% (60–73) | 83% (69–92) | 33% (27–40) | 17% (8–31) |
| ≥3 ^ | 0.44 | 72% (64–79) | 72% (63–80) | 78% (70–84) | 65% (56–73) | 22% (16–30) | 35% (27–44) |
| ≥4 | 0.38 | 50% (42–58) | 88% (80–93) | 86% (76–92) | 56% (48–63) | 14% (8–24) | 44% (37–52) |
| ≥5 | 0.17 | 20% (14–28) | 97% (92–99) | 91% (75–98) | 53% (47–60) | 9% (2–25) | 53% (47–60) |
| PRISMA-7 | |||||||
| ≥2 | 0.24 | 94% (88–97) | 30% (22–39) | 65% (58–71) | 77% (61–88) | 35% (29–42) | 23% (12–39) |
| ≥3 * | 0.62 | 84% (77–90) | 78% (69–85) | 84% (77–90) | 78% (69–85) | 16% (10–23) | 22% (15–31) |
| ≥4 ^ | 0.63 | 70% (62–77) | 93% (86–97) | 93% (86–97) | 69% (61–76) | 7% (3–14) | 31% (24–39) |
| ≥5 | 0.47 | 51% (43–59) | 96% (90–99) | 95% (87–98) | 58% (51–66) | 5% (2–13) | 42% (34–49) |
| ≥6 | 0.24 | 25% (19–33) | 99% (94–100) | 98% (85–100) | 49% (42–56) | 3% (0–15) | 51% (44–58) |
© 2019 by the authors. Licensee MDPI, Basel, Switzerland. This article is an open access article distributed under the terms and conditions of the Creative Commons Attribution (CC BY) license (http://creativecommons.org/licenses/by/4.0/).
Share and Cite
O’Caoimh, R.; Costello, M.; Small, C.; Spooner, L.; Flannery, A.; O’Reilly, L.; Heffernan, L.; Mannion, E.; Maughan, A.; Joyce, A.; et al. Comparison of Frailty Screening Instruments in the Emergency Department. Int. J. Environ. Res. Public Health 2019, 16, 3626. https://0-doi-org.brum.beds.ac.uk/10.3390/ijerph16193626
O’Caoimh R, Costello M, Small C, Spooner L, Flannery A, O’Reilly L, Heffernan L, Mannion E, Maughan A, Joyce A, et al. Comparison of Frailty Screening Instruments in the Emergency Department. International Journal of Environmental Research and Public Health. 2019; 16(19):3626. https://0-doi-org.brum.beds.ac.uk/10.3390/ijerph16193626
Chicago/Turabian StyleO’Caoimh, Rónán, Maria Costello, Cliona Small, Lynn Spooner, Antoinette Flannery, Liam O’Reilly, Laura Heffernan, Edel Mannion, Anna Maughan, Alma Joyce, and et al. 2019. "Comparison of Frailty Screening Instruments in the Emergency Department" International Journal of Environmental Research and Public Health 16, no. 19: 3626. https://0-doi-org.brum.beds.ac.uk/10.3390/ijerph16193626