The Relationship between Cognitive Impairment and Social Vulnerability among the Elderly: Evidence from an Unconditional Quantile Regression Analysis in China


Abstract
:1. Introduction
2. Methods
2.1. Study Sample
2.2. Measures
2.2.1. Measure of Cognitive Impairment (Dependent Variable)
2.2.2. Measure of Social Vulnerability (Independent Variable)
2.2.3. Measure of Covariates
3. Statistical Analysis
4. Results and Discussion
5. Robustness Checks
6. Conclusions
Author Contributions
Funding
Conflicts of Interest
References
- WHO. World Report on Ageing and Health. Available online: https://www.who.int/ageing/publications/world-report-2015/en/ (accessed on 5 August 2019).
- WHO. China Country Assessment Report on Ageing and Health. Available online: https://www.who.int/ageing/publications/china-country-assessment/en/ (accessed on 5 August 2019).
- Ma, L.; Zhang, L.; Sun, F.; Li, Y.; Tang, Z. Cognitive function in prefrail and frail community-dwelling older adults in China. BMC Geriatr. 2019, 19, 53. [Google Scholar] [CrossRef]
- Andrew, M.K.; Keefe, J.M. Social vulnerability from a social ecology perspective: A cohort study of older adults from the National Population Health Survey of Canada. BMC Geriatr. 2014, 14, 90. [Google Scholar] [CrossRef]
- Nguyen, T.; Ngangue, P.; Bouhali, T.; Ryan, B.; Stewart, M.; Fortin, M. Social vulnerability in patients with multimorbidity: A cross-sectional analysis. Int. J. Environ. Res. Public Health 2019, 16, 1244. [Google Scholar] [CrossRef]
- Wu, M.S.; Lan, T.H.; Chen, C.M.; Chiu, H.C.; Lan, T.Y. Socio-demographic and health-related factors associated with cognitive impairment in the elderly in Taiwan. BMC Public Health 2011, 11, 22. [Google Scholar] [CrossRef]
- Gu, D.; Yang, F.; Sautter, J. Socioeconomic status as a moderator between frailty and mortality at old ages. BMC Geriatr. 2016, 16, 151. [Google Scholar]
- Andrew, M.K.; Rockwood, K. Social vulnerability predicts cognitive decline in a prospective cohort of older Canadians. Alzheimer’s Dement. 2010, 6, 319–325. [Google Scholar] [CrossRef]
- Seeman, T.E.; Lusignolo, T.M.; Albert, M.; Berkman, L. Social relationships, social support, and patterns of cognitive aging in healthy, high-functioning older adults: MacArthur studies of successful aging. Health Psychol. 2001, 20, 243–255. [Google Scholar] [CrossRef]
- Gilchrist, A.C.; Creed, F.H. Depression, cognitive impairment and social stress in multiple sclerosis. J. Psychosom. Res. 1994, 38, 193–201. [Google Scholar] [CrossRef]
- Sampson, E.L.; Bulpitt, C.J.; Fletcher, A.E. Survival of community-dwelling older people: The effect of cognitive impairment and social engagement. J. Am. Geriatr. Soc. 2009, 57, 985–991. [Google Scholar] [CrossRef]
- Valerie, C.C.; James, L.; Diana, B.P.; Deborah, L.; Vicki, C. Social network, cognitive function, and dementia incidence among elderly women. Am. J. Public Health 2018, 98, 1221–1227. [Google Scholar]
- Andrew, M.K.; Mitnitski, A.B.; Rockwood, K. Social vulnerability, frailty and mortality in elderly people. PLoS ONE 2008, 3, e2232. [Google Scholar] [CrossRef] [PubMed]
- Nakhla, M. Designing extended overall equipment effectiveness: Application in healthcare operations. Int. J. Manag. Sci. Eng. Manag. 2018, 13, 227–236. [Google Scholar] [CrossRef]
- Gholami, P.; Hafezalkotob, A. Maintenance scheduling using data mining techniques and time series models. Int. J. Manag. Sci. Eng. Manag. 2018, 13, 100–107. [Google Scholar] [CrossRef]
- Sergio, F.; Nicole, M.F.; Thomas, L. Unconditional quantile regressions. Econometrica 2009, 77, 953–973. [Google Scholar]
- Maclean, J.C.; Webber, D.A.; Marti, J. An application of unconditional quantile regression to cigarette taxes. J. Policy Anal. Manag. 2014, 33, 188–210. [Google Scholar] [CrossRef]
- Liou, J. Effect of income heterogeneity on valuation of mortality risk in Taiwan: An application of unconditional quantile regression method. Int. J. Environ. Res. Public Health 2019, 16, 1620. [Google Scholar] [CrossRef]
- Xiao, Z.; Zhang, C.; Zeng, Y.; Vaupel, J.; Liu, Y. Chinese Longitudinal Healthy Longevity Survey (CLHLS), Community Datasets, 1998–2014; Inter-University Consortium for Political and Social Research: Ann Arbor, MI, UDSA, 2019; Available online: https://0-doi-org.brum.beds.ac.uk/10.3886/ICPSR37227.v1 (accessed on 15 July 2019).
- Bernard, B.A.; Goldman, J.G. MMSE Mini-Mental State Examination. In Encyclopedia of Movement Disorders; Kompoliti, K., Metman, L.V., Eds.; Academic Press: Oxford, UK, 2010; pp. 187–189. [Google Scholar]
- Zhou, H.; Deng, J.; Li, J.; Wang, Y.; Zhang, M.; He, H. Study of the relationship between cigarette smoking, alcohol drinking and cognitive impairment among elderly people in China. Age Ageing 2003, 32, 205–210. [Google Scholar] [CrossRef] [PubMed] [Green Version]
- Peters, R.; Peters, J.; Warner, J.; Beckett, N.; Bulpitt, C. Alcohol, dementia and cognitive decline in the elderly: A systematic review. Age Ageing 2008, 37, 505–512. [Google Scholar] [CrossRef] [PubMed]
- Heyn, P.; Abreu, B.C.; Ottenbacher, K.J. The effects of exercise training on elderly persons with cognitive impairment and dementia: A meta-analysis. Arch. Phys. Med. Rehabil. 2004, 85, 1694–1704. [Google Scholar] [CrossRef]
- Bond, J.; Dickinson, H.O.; Matthews, F.; Jagger, C.; Brayne, C. Self-rated health status as a predictor of death, functional and cognitive impairment: A longitudinal cohort study. Eur. J. Ageing 2006, 3, 193–206. [Google Scholar] [CrossRef]
- Dai, Q.; Borenstein, A.R.; Wu, Y.; Jackson, J.C.; Larson, E.B. Fruit and vegetable juices and Alzheimer’s disease: The Kame Project. Am. J. Med. 2006, 119, 751–759. [Google Scholar] [CrossRef] [PubMed]
- Kang, J.H.; Ascherio, A.; Grodstein, F. Fruit and vegetable consumption and cognitive decline in aging women. Ann. Neurol. 2005, 57, 713–720. [Google Scholar] [CrossRef]
- Ng, T.P.; Feng, L.; Niti, M.; Kua, E.H.; Yap, K.B. Tea consumption and cognitive impairment and decline in older Chinese adults. Am. J. Clin. Nutr. 2008, 88, 224–231. [Google Scholar] [CrossRef] [PubMed]
- Mensi, W.; Hammoudeh, S.; Reboredo, J.C.; Nguyen, D.K. Do global factors impact BRICS stock markets? A quantile regression approach. Emerg. Mark. Rev. 2014, 19, 1–17. [Google Scholar] [CrossRef]
- Kim, M.Y.; Lee, E.J. Factors affecting self-care behavior levels among elderly patients with type 2 diabetes: A quantile regression approach. Medicina 2019, 55, 340. [Google Scholar] [CrossRef] [PubMed]
- Borah, B.J.; Basu, A. Highlighting differences between conditional and unconditional quantile regression approaches through an application to assess medication adherence. Health Econ. 2013, 22, 1052–1070. [Google Scholar] [CrossRef] [PubMed]
- Bonanno, A.; Bimbo, F.; Cleary, R.; Castellari, E. Food labels and adult BMI in Italy An unconditional quantile regression approach. Food Policy 2018, 74, 199–211. [Google Scholar] [CrossRef]


| ITEM (SCORE) | MEAN VALUE |
|---|---|
| Living situation: | |
| 1. Current marital status | 0.5691 |
| currently married and living with spouse (0) | |
| married but not living with spouse (0.5) | |
| divorced/widowed/never married(1) | |
| 2. Co-residence | 0.2204 |
| with household member(s) (0)/alone (1) | |
| Social support: | |
| 3. Can get adequate medical service when you are sick | 0.0323 |
| yes (0)/no (1) | |
| 4. Social service level in your community (5 levels) | 0.8013 |
| very good (0)/good (0.25)/so so (0.5)/bad (0.75)/very bad(1) | |
| 5. Residence | 0.7019 |
| city (0)/town (0.5)/rural (1) | |
| 6. Feel need more home visits | 0.8272 |
| yes (1)/no (0) | |
| 7. Feel need more social and recreation activities | 0.6433 |
| yes (1)/no (0) | |
| 8. Feel need more neighboring relations | 0.6419 |
| yes (1)/no (0) | |
| Socially oriented Activities of Daily Living: | |
| 9. Visit your neighbors by yourself | 0.1384 |
| yes, independently (0)/yes, but need some help (0.5)/no, can’t (1) | |
| 10. Go shopping by yourself | 0.2266 |
| yes, independently (0)/yes, but need some help (0.5)/no, can’t (1) | |
| 11. Walk continuously for 1 kilometer at a time by yourself | 0.3163 |
| yes, independently (0)/yes, but need some help (0.5)/no, can’t (1) | |
| 12. Take public transportation by yourself | 0.3723 |
| yes, independently (0)/yes, but need some help (0.5)/no, can’t (1) | |
| Social engagement and leisure: | |
| 13. Tours beyond home city/county have you made in the past two years | 0.9913 |
| Normalize data to 0–1 number | |
| 14. Garden work | 0.8055 |
| almost everyday (0)/once for a week (0.25)/at least once for a month (0.5) | |
| /not monthly, but sometimes (0.75)/never (1) | |
| 15. Play cards or mah-jong | 0.8635 |
| almost everyday (0)/once for a week (0.25)/at least once for a month (0.5) | |
| /not monthly, but sometimes (0.75)/never (1) | |
| 16. Social activities (organized) | 0.9177 |
| almost everyday (0)/once for a week (0.25)/at least once for a month (0.5) | |
| /not monthly, but sometimes (0.75)/never (1) | |
| Empowerment, life control: | |
| 17. Make your own decisions concerning your personal affairs | 0.3064 |
| always (0)/often (0.25)/sometimes (0.5)/seldom (0.75)/never (1) | |
| 18. Feel that you are a person of worth at least equal to others | 0.4443 |
| always (0)/often (0.25)/sometimes (0.5)/seldom (0.75)/never (1) | |
| 19. Take a positive attitude towards yourself | 0.2835 |
| always (0)/often (0.25)/sometimes (0.5)/seldom (0.75)/never (1) | |
| 20. Status of decision making on financial spending in your household | 0.4923 |
| almost all spending in my household (0) | |
| some of the main spending in my household (0.25) | |
| some of the non-main spending in my household (0.5) | |
| only on own spending (0.75) | |
| cannot make decisions on any spending (1) | |
| Socio-economic status: | |
| 21. Total income of your household last year continuous | 0.6206 |
| Normalize data to 0–1 number | |
| 22. All of the financial support is sufficient to pay for daily expenses | 0.1712 |
| yes (0)/no (1) | |
| 23. Rate your economic status compared with other local people | 0.4844 |
| very rich (0)/rich (0.25)/so so (0.5)/poor (0.75)/very poor (1) | |
| 24. Educational attainment | 0.8708 |
| Normalize data to 0-1 number | |
| 25. Occupation | 0.9121 |
| white-collar (0)/non-white-collar (1) |
| Mean | Variance | Min | Max | |
|---|---|---|---|---|
| social vulnerability | 13.6549 | 9.4382 | 3 | 23 |
| age | 83.8831 | 100.7362 | 60 | 114 |
| self-health rate | 3.3894 | 0.7573 | 1 | 5 |
| smoke | 15.7709 | 640.1702 | 0 | 99 |
| drink | 12.6304 | 548.3681 | 0 | 101 |
| exercise | 9.4722 | 345.5731 | 0 | 99 |
| depression | 0.2003 | 0.2599 | 0 | 2 |
| physical limitation | 0.3265 | 0.5312 | 0 | 5 |
| chronic disease | 0.6227 | 0.8340 | 0 | 10 |
| vegetable and fruit | 2.8740 | 0.4720 | 1 | 4 |
| vitamin intake | 1.4769 | 1.2019 | 1 | 5 |
| milk intake | 2.5549 | 2.4272 | 1 | 5 |
| tea intake | 2.1793 | 2.8196 | 1 | 5 |
| cognitive impairment | 10.3247 | 21.9063 | 5 | 30 |
| Cognitive Impairment | 5th | 10th | 25th | 50th | 75th | 90th | 95th | OLS |
|---|---|---|---|---|---|---|---|---|
| *** | *** | *** | *** | *** | *** | *** | *** | |
| *** | *** | *** | *** | *** | *** | *** | *** | |
| *** | *** | *** | *** | *** | *** | *** | *** | |
| *** | *** | *** | *** | 0.0009 | *** | *** | −0.0023 | |
| *** | *** | *** | *** | *** | *** | −0.0083 | 0.0007 | |
| *** | *** | *** | *** | *** | *** | *** | −0.0055 | |
| *** | *** | *** | *** | *** | *** | −0.0077 | −0.1171 | |
| *** | *** | *** | *** | *** | *** | *** | *** | |
| *** | ** | *** | *** | *** | * | 0.0400 | * | |
| *** | * | *** | *** | *** | *** | *** | *** | |
| *** | *** | *** | *** | *** | *** | *** | *** | |
| −0.0018 | *** | *** | *** | * | *** | *** | −0.0148 | |
| −0.0004 | *** | *** | *** | *** | *** | *** | 0.0494 | |
| −0.0161 | −0.0273 | −0.0284 | −0.0154 | −0.1035 | 0.0093 | −0.1728 | −0.0412 | |
| intercept | *** | *** | *** | *** | *** | *** | *** | *** |
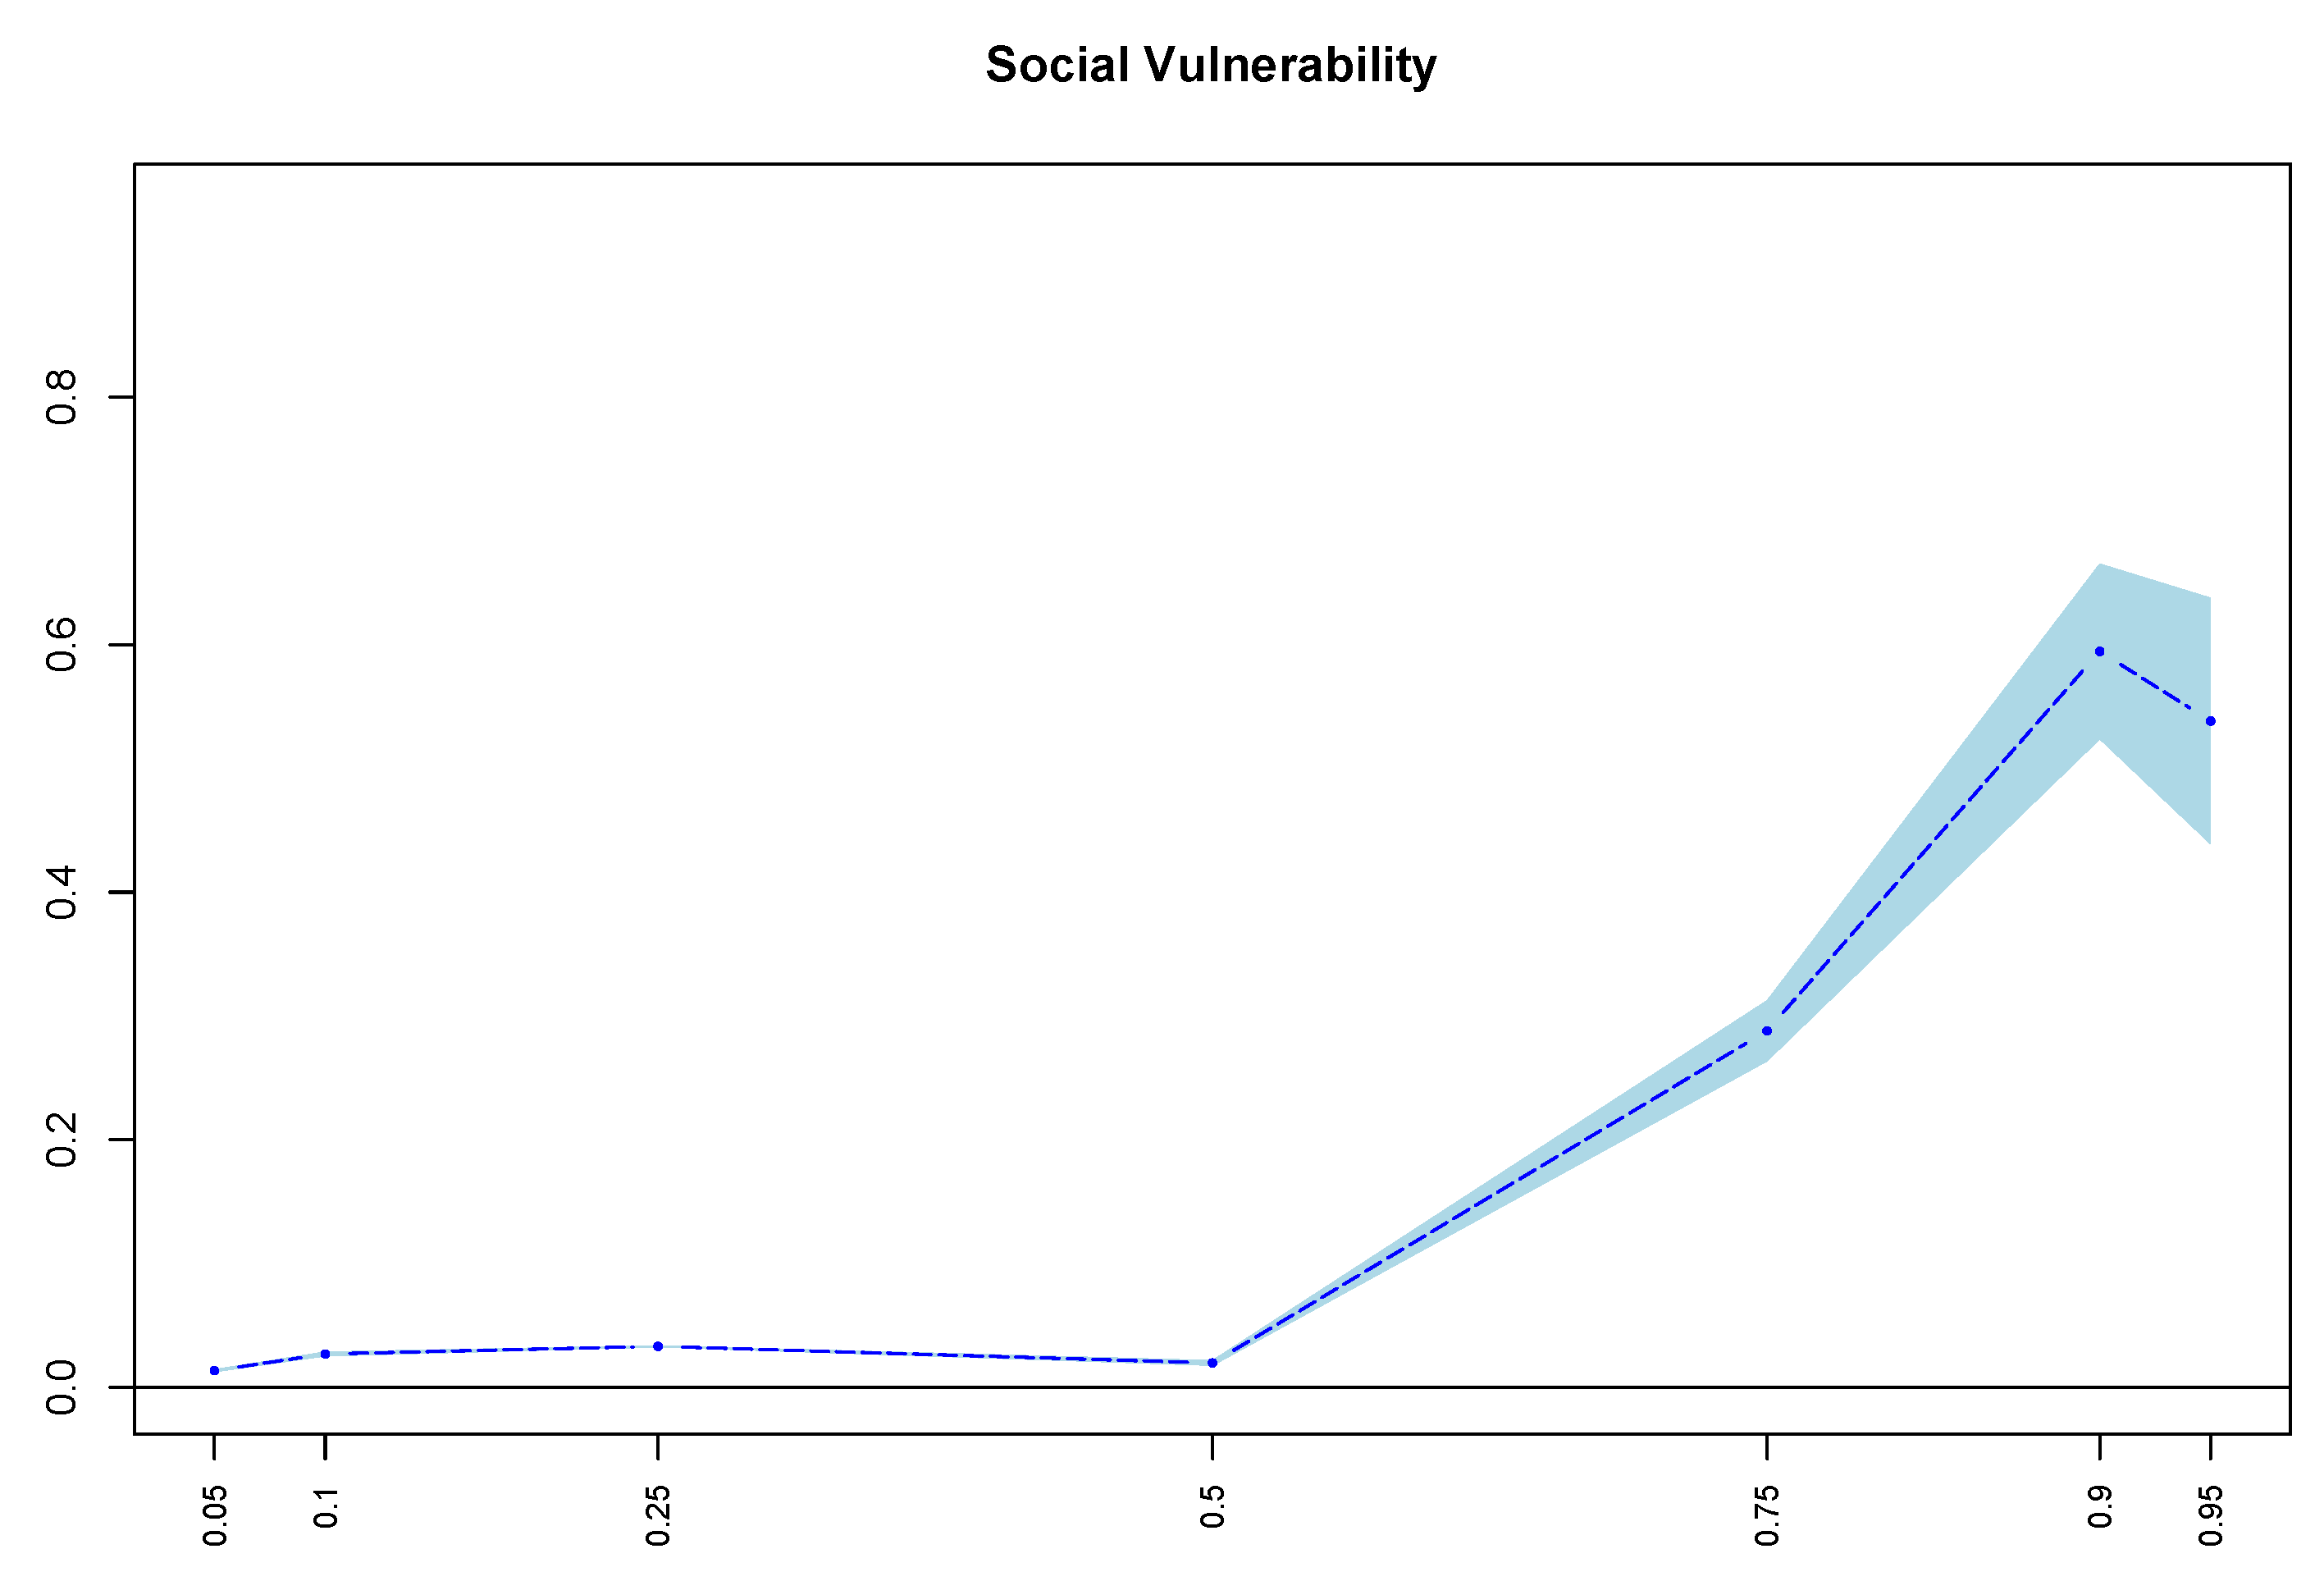
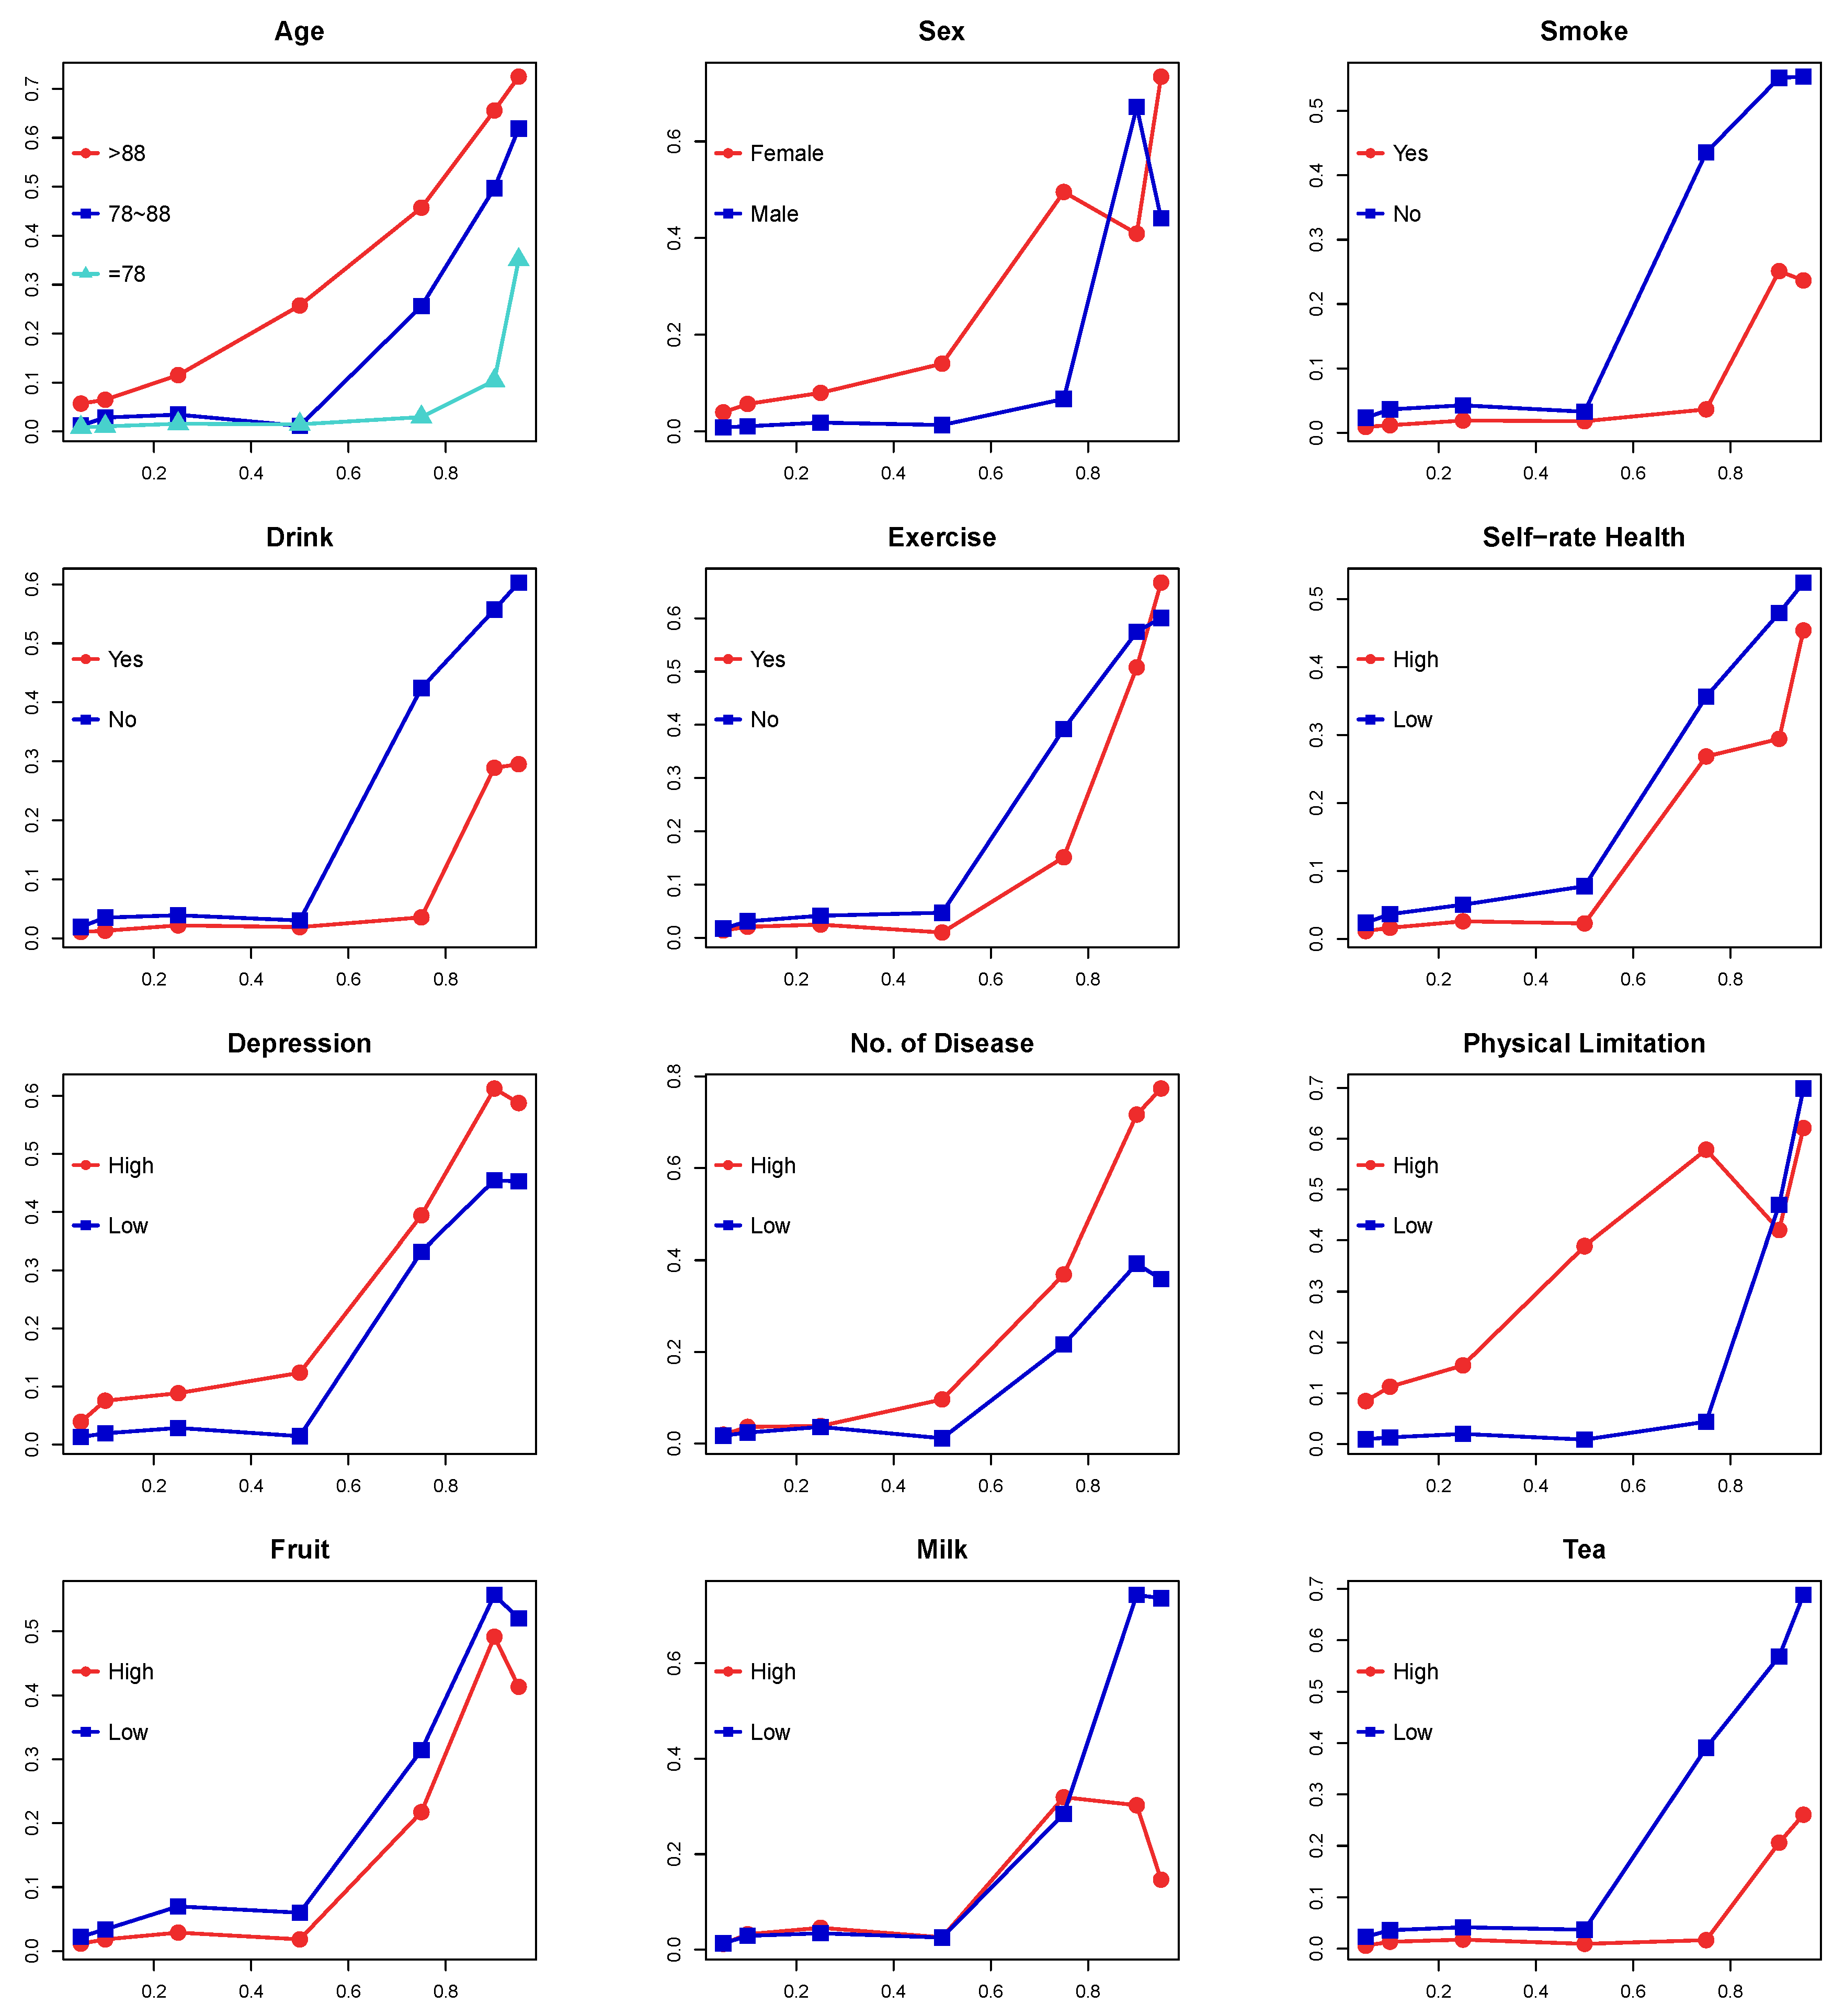
| Sample | 5th | 10th | 25th | 50th | 75th | 90th | 95th |
|---|---|---|---|---|---|---|---|
| Full sample | *** | *** | *** | *** | *** | *** | *** |
| age > 88 | *** | *** | *** | *** | *** | *** | *** |
| 78 < age <= 88 | *** | *** | *** | *** | *** | *** | *** |
| age <= 78 | *** | *** | *** | *** | *** | 0.104 | 0.351 |
| female | *** | *** | *** | *** | *** | *** | *** |
| male | *** | *** | *** | *** | *** | *** | *** |
| no smoking | *** | *** | *** | *** | *** | *** | *** |
| smoking | *** | *** | *** | *** | ** | *** | ** |
| no drinking | *** | *** | *** | *** | *** | *** | *** |
| drinking | *** | *** | *** | *** | ** | *** | *** |
| no exercising | *** | *** | *** | *** | *** | *** | *** |
| exercising | *** | *** | *** | *** | *** | *** | *** |
| low fruit and vegetable intake | *** | *** | *** | *** | *** | *** | *** |
| high fruit and vegetable intake | *** | *** | *** | *** | *** | *** | *** |
| low self-rate health | *** | *** | *** | *** | *** | *** | *** |
| high self-rate health | *** | *** | *** | *** | *** | *** | *** |
| low depression | *** | *** | *** | *** | *** | *** | *** |
| high depression | *** | *** | *** | *** | *** | *** | *** |
| less phsical function limitation | *** | *** | *** | *** | *** | *** | *** |
| more physical functional limitations | *** | *** | *** | *** | *** | *** | *** |
| less chronic diseases | *** | *** | *** | *** | *** | *** | *** |
| more chronic diseases | *** | *** | *** | *** | *** | *** | *** |
| low vitamin intake | *** | *** | *** | *** | *** | *** | *** |
| high vitamin intake | *** | *** | *** | *** | *** | *** | ** |
| low milk intake | *** | *** | *** | *** | *** | *** | *** |
| high milk intake | *** | *** | *** | *** | *** | *** | 0.147 |
| low tea intake | *** | *** | *** | *** | *** | *** | *** |
| high tea intake | *** | *** | *** | ** | 0.017 | *** | ** |
| 10th | 50th | 90th | |||||||
|---|---|---|---|---|---|---|---|---|---|
| Gau. | Optcos. | BW | Gau. | Optcos. | BW | Gau. | Optcos. | BW | |
| Social vulnerability | *** | *** | *** | *** | *** | *** | *** | *** | *** |
| Age | *** | *** | *** | *** | *** | *** | *** | *** | *** |
| Gender | *** | *** | *** | *** | *** | *** | *** | *** | *** |
| Smoke | *** | *** | *** | *** | *** | *** | *** | *** | *** |
| Drink | *** | *** | *** | *** | *** | *** | *** | *** | *** |
| Exercise | *** | *** | *** | *** | *** | *** | −0.01 *** | *** | *** |
| Self-rate health | −0.03 *** | −0.03 *** | −0.03 *** | −0.07 *** | −0.08 *** | −0.08 *** | −0.30 | −0.26 | −0.27 |
| Depression | *** | *** | *** | *** | *** | *** | *** | *** | *** |
| Chronic disease | *** | *** | *** | *** | *** | *** | *** | *** | *** |
| Physical limitation | *** | *** | *** | *** | *** | *** | *** | *** | *** |
| Fruit and | −0.02 ** | −0.02 ** | −0.02 ** | −0.08 *** | −0.09 *** | −0.09 *** | * | −0.73 | −0.76 |
| vegetable intake | |||||||||
| Vitamin intake | *** | *** | *** | *** | *** | *** | *** | *** | *** |
| Milk intake | *** | *** | *** | *** | *** | *** | *** | *** | *** |
| Tea intake | −0.03 *** | −0.03 *** | −0.03 *** | −0.02 *** | −0.02 *** | −0.02 *** | *** | *** | *** |
| Intercept | 0.37 | 0.39 | −0.87 | −1.17 | −1.10 | −17.48 | −13.64 | −14.63 | |
© 2019 by the authors. Licensee MDPI, Basel, Switzerland. This article is an open access article distributed under the terms and conditions of the Creative Commons Attribution (CC BY) license (http://creativecommons.org/licenses/by/4.0/).
Share and Cite
Zhao, J.; Zhang, X.; Li, Z. The Relationship between Cognitive Impairment and Social Vulnerability among the Elderly: Evidence from an Unconditional Quantile Regression Analysis in China. Int. J. Environ. Res. Public Health 2019, 16, 3684. https://0-doi-org.brum.beds.ac.uk/10.3390/ijerph16193684
Zhao J, Zhang X, Li Z. The Relationship between Cognitive Impairment and Social Vulnerability among the Elderly: Evidence from an Unconditional Quantile Regression Analysis in China. International Journal of Environmental Research and Public Health. 2019; 16(19):3684. https://0-doi-org.brum.beds.ac.uk/10.3390/ijerph16193684
Chicago/Turabian StyleZhao, Junkai, Xinxin Zhang, and Zongmin Li. 2019. "The Relationship between Cognitive Impairment and Social Vulnerability among the Elderly: Evidence from an Unconditional Quantile Regression Analysis in China" International Journal of Environmental Research and Public Health 16, no. 19: 3684. https://0-doi-org.brum.beds.ac.uk/10.3390/ijerph16193684