
Factors Associated with Dental Service Use Based on the Andersen Model: A Systematic Review


Abstract
:1. Introduction
2. Materials and Methods
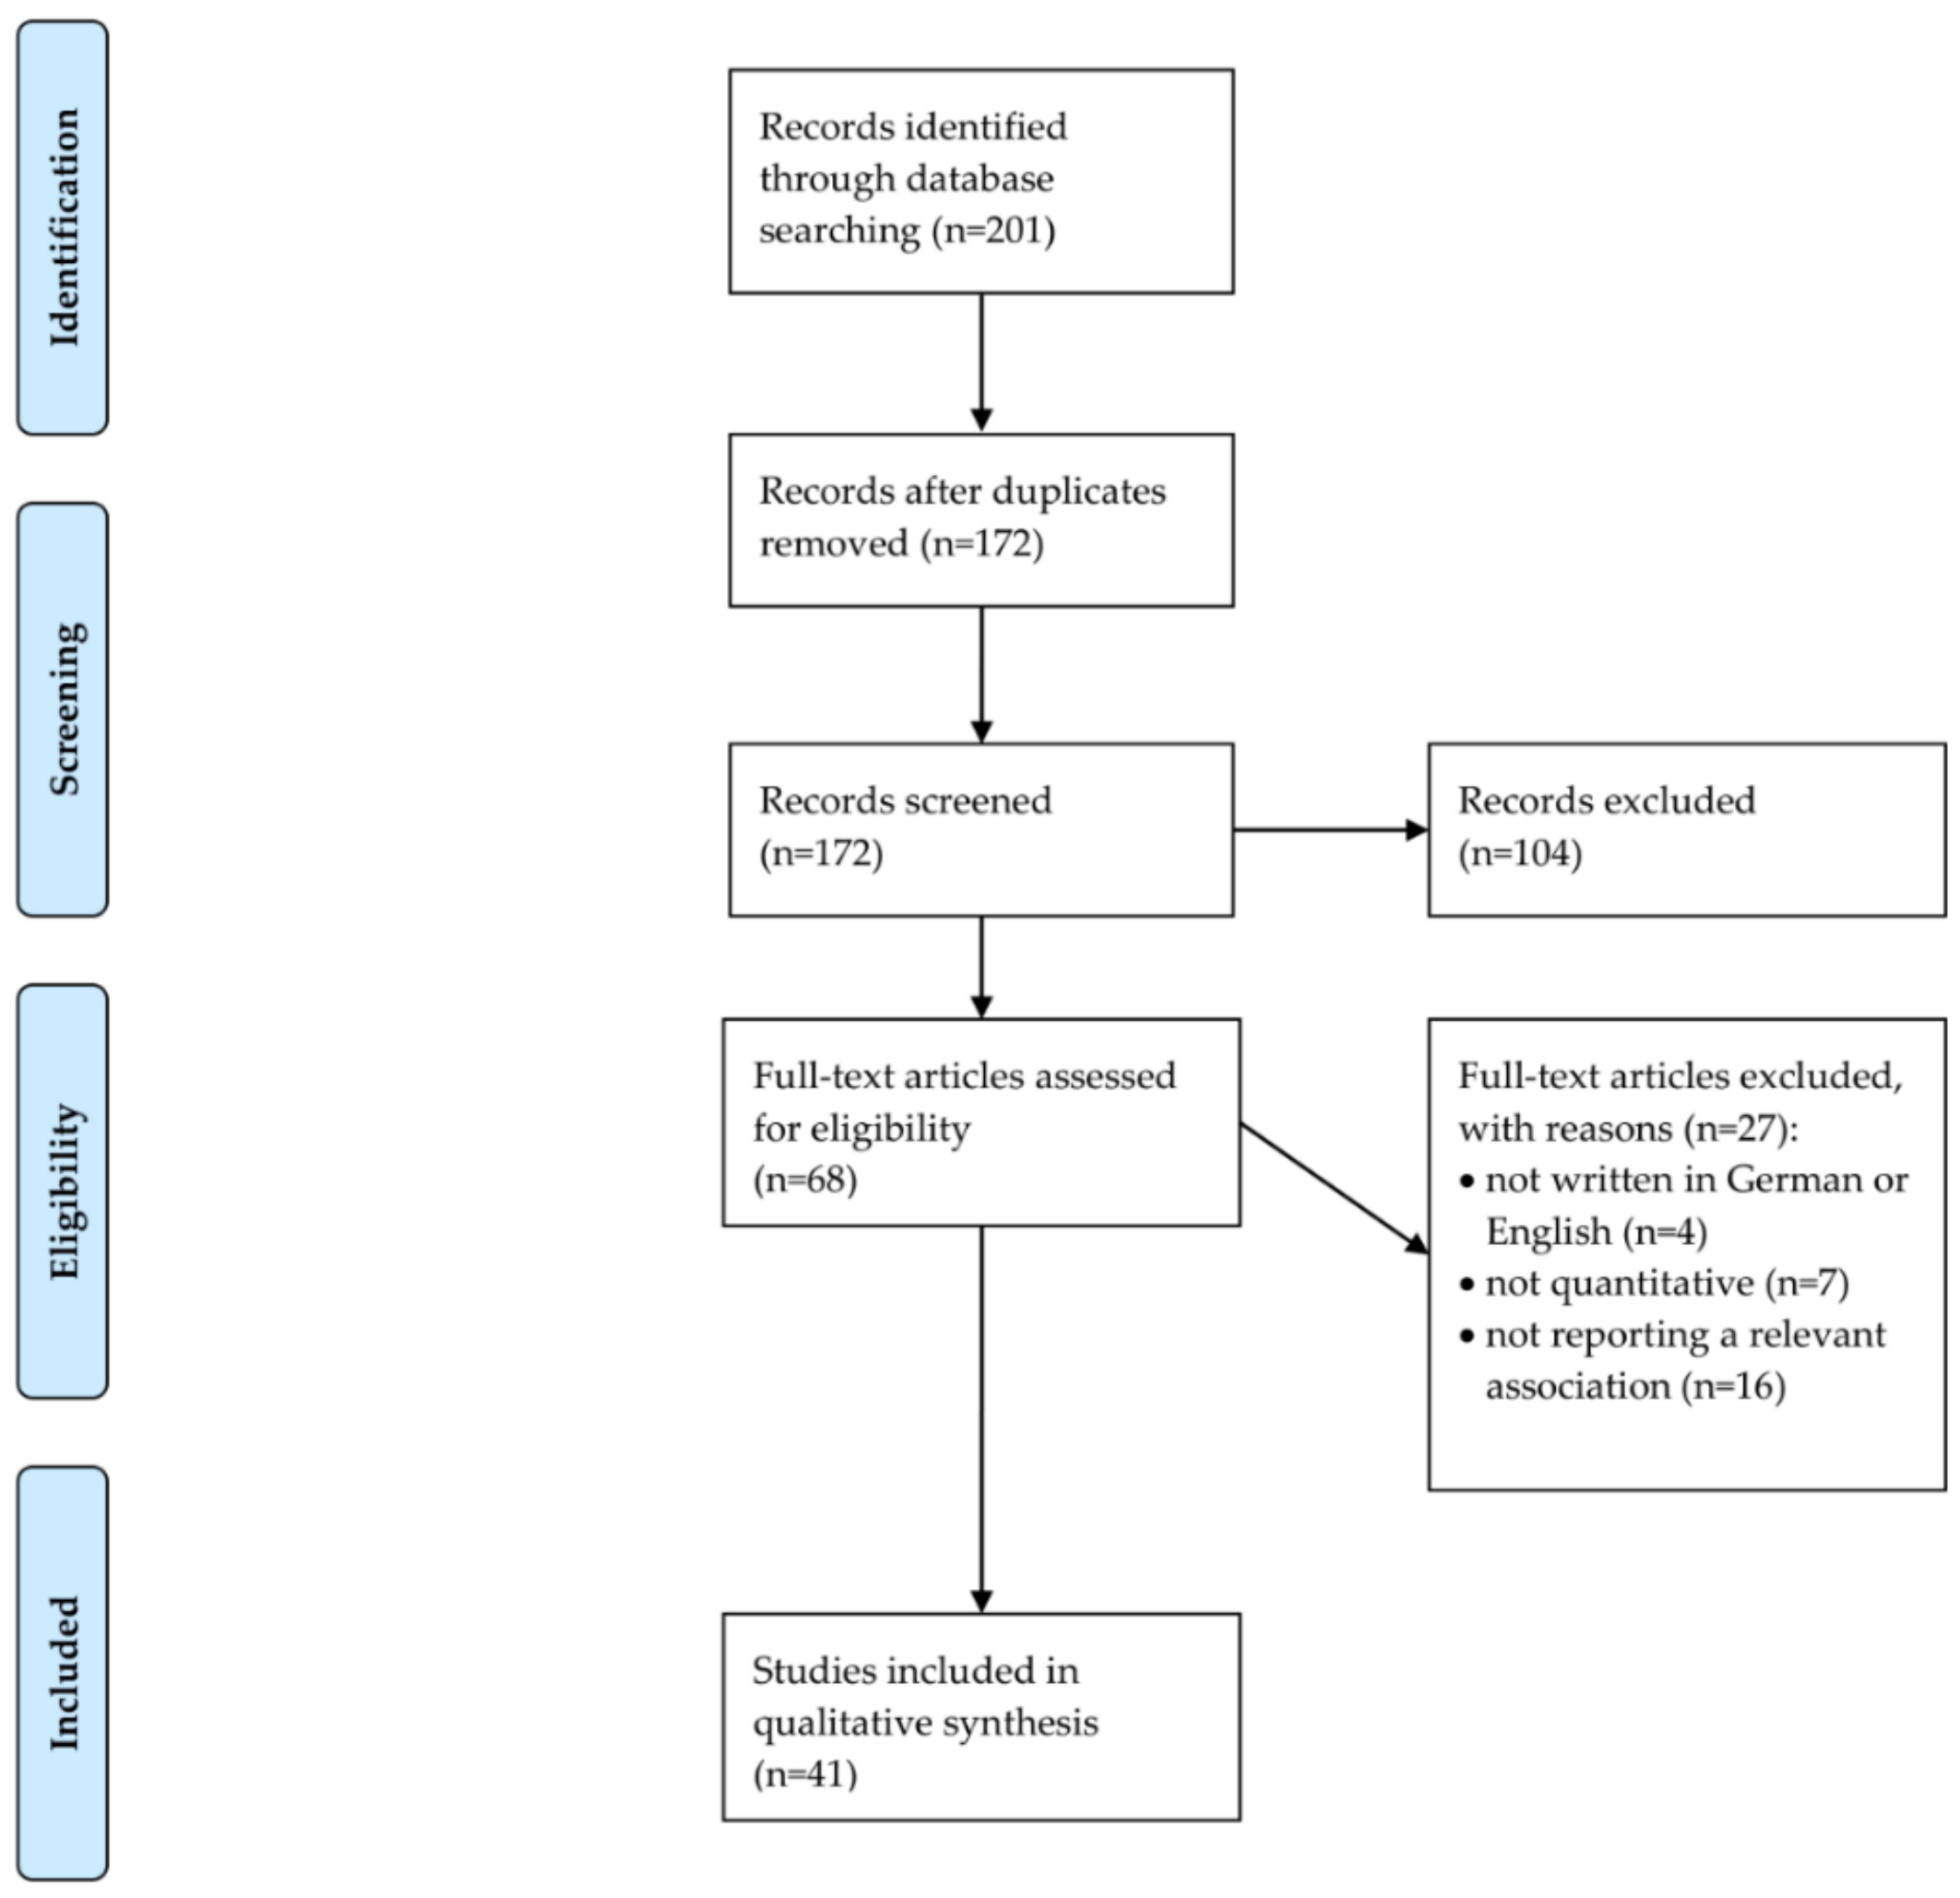
2.1. Search Strategy and Selection Criteria
2.2. Data Extraction and Analysis
2.3. Quality Assessment
3. Results
3.1. Overview of Included Studies: Children/Adolescents
3.2. Overview of Included Studies: Adults
3.3. Predisposing Characteristics
3.4. Enabling Resources
3.5. Need Factors
3.6. Psychosocial Factors/Personality Characteristics
3.7. Quality Assessment
4. Discussion
4.1. Main Findings
4.2. Children/Adolescents
4.3. Adults
4.4. Differences in Determinants of Dental Service use between Children and Adults
4.5. Comparability of Studies
4.6. Study Quality
4.7. Gaps in Knowledge and Guidance for Future Research
4.8. Strengths and Limitations
5. Conclusions
Supplementary Materials
Author Contributions
Funding
Institutional Review Board Statement
Informed Consent Statement
Data Availability Statement
Conflicts of Interest
References
- Valdez, R.; Aarabi, G.; Spinler, K.; Walther, C.; Seedorf, U.; Heydecke, G.; Buczak-Stec, E.; König, H.-H.; Hajek, A. Association between Subjective Well–Being and Frequent Dental Visits in the German Ageing Survey. Int. J. Environ. Res. Public Health 2020, 17, 3207. [Google Scholar] [CrossRef]
- Riley, P.; Worthington, H.V.; Clarkson, J.E.; Beirne, P.V. Recall intervals for oral health in primary care patients. Cochrane Database Syst. Rev. 2013. [Google Scholar] [CrossRef] [PubMed]
- Kassebaum, N.; Bernabé, E.; Dahiya, M.; Bhandari, B.; Murray, C.; Marcenes, W. Global burden of severe periodontitis in 1990–2010: A systematic review and meta–regression. J. Dent. Res. 2014, 93, 1045–1053. [Google Scholar] [CrossRef]
- Aarabi, G.; Valdez, R.; Spinler, K.; Walther, C.; Seedorf, U.; Heydecke, G.; König, H.-H.; Hajek, A. Determinants of Postponed Dental Visits Due to Costs: Evidence from the Survey of Health, Ageing, and Retirement in Germany. Int. J. Environ. Res. Public Health 2019, 16, 3344. [Google Scholar] [CrossRef] [PubMed] [Green Version]
- Valdez, R.; Aarabi, G.; Spinler, K.; Walther, C.; Kofahl, C.; Buczak-Stec, E.; Heydecke, G.; König, H.-H.; Hajek, A. Do postponed dental visits for financial reasons reduce quality of life? Evidence from the Survey of Health, Ageing and Retirement in Europe. Aging Clin. Exp. Res. 2021, 33, 437–442. [Google Scholar] [CrossRef]
- Andersen, R.M. Revisiting the behavioral model and access to medical care: Does it matter? J. Health Soc. Behav. 1995, 36, 1–10. [Google Scholar] [CrossRef] [PubMed]
- Flennert, M.; König, H.-H.; Hajek, A. The association between voluntary work and health care use among older adults in Germany. BMC Health Serv. Res. 2019, 19, 39. [Google Scholar] [CrossRef] [PubMed] [Green Version]
- Hajek, A.; König, H.-H. Beyond symptoms: Why do patients see the doctor? BJGP Open 2020. [Google Scholar] [CrossRef]
- Babitsch, B.; Gohl, D.; Von Lengerke, T. Re–revisiting Andersen’s Behavioral Model of Health Services Use: A systematic review of studies from 1998–2011. GMS Psycho-Soc. Med. 2012, 9. [Google Scholar] [CrossRef]
- Song, J.; Tomar, S.; Duncan, R.P.; Fogarty, K.; Johns, T.; Kim, J.N. The health care utilization model: Application to dental care use for Black and Hispanic children. J. Public Health Dent. 2020. [Google Scholar] [CrossRef] [PubMed]
- Due, C.; Aldam, I.; Ziersch, A. Understanding oral health help-seeking among Middle Eastern refugees and asylum seekers in Australia: An exploratory study. Community Dent. Oral Epidemiol. 2020, 48, 188–194. [Google Scholar] [CrossRef]
- Hajek, A.; Kretzler, B.; König, H.-H. Determinants of Dental Service Use Based on the Andersen Model: A Study Protocol for a Systematic Review. Healthcare 2020, 8, 333. [Google Scholar] [CrossRef]
- Cosola, S.; Marconcini, S.; Giammarinaro, E.; Poli, G.L.; Covani, U.; Barone, A. Oral health–related quality of life and clinical outcomes of immediately or delayed loaded implants in the rehabilitation of edentulous jaws: A retrospective comparative study. Minerva Stomatol. 2018, 67, 189–195. [Google Scholar]
- Slade, G.D. Derivation and validation of a short-form oral health impact profile. Community Dent. Oral Epidemiol. 1997, 25, 284–290. [Google Scholar] [CrossRef] [PubMed]
- Gülcan, F.; Ekbäck, G.; Ordell, S.; Klock, K.S.; Lie, S.A.; Åstrøm, A.N. Exploring the association of dental care utilization with oral impacts on daily performances (OIDP)–a prospective study of ageing people in Norway and Sweden. Acta Odontol. Scand. 2018, 76, 21–29. [Google Scholar] [CrossRef]
- Moher, D.; Liberati, A.; Tetzlaff, J.; Altman, D.G. Preferred reporting items for systematic reviews and meta–analyses: The PRISMA statement. PLoS Med. 2009, 6, e1000097. [Google Scholar] [CrossRef] [Green Version]
- Hajek, A.; Kretzler, B.; König, H.-H. Personality, health care use and costs. A systematic review. Healthcare 2020, 8, 329. [Google Scholar]
- Stuhldreher, N.; Konnopka, A.; Wild, B.; Herzog, W.; Zipfel, S.; Löwe, B.; König, H.H. Cost-of-illness studies and cost-effectiveness analyses in eating disorders: A systematic review. Int. J. Eat. Disord. 2012, 45, 476–491. [Google Scholar] [CrossRef] [PubMed]
- Hohls, J.K.; Koenig, H.-H.; Raynik, Y.I.; Hajek, A. A systematic review of the association of anxiety with health care utilization and costs in people aged 65 years and older. J. Affect. Disord. 2018, 232, 163–176. [Google Scholar] [CrossRef]
- Hajek, A.; Kretzler, B.; König, H.-H. Determinants of Frequent Attendance in Primary Care. A Systematic Review of Longitudinal Studies. Front. Med. 2021, 8. [Google Scholar] [CrossRef]
- Moher, D.; Liberati, A.; Tetzlaff, J.; Altman, D.G. Preferred Reporting Items for Systematic Reviews and Meta-Analyses: The PRISMA Statement. BMJ 2009, 339, b2535. [Google Scholar] [CrossRef] [Green Version]
- Al Agili, D.E.; Farsi, N.J. Need for dental care drives utilisation of dental services among children in Saudi Arabia. Int. Dent. J. 2020, 70, 183–192. [Google Scholar] [CrossRef]
- Azañedo, D.; Hernández-Vásquez, A.; Casas–Bendezú, M.; Gutiérrez, C.; Agudelo–Suárez, A.A.; Cortés, S. Factors determining access to oral health services among children aged less than 12 years in Peru. F1000Research 2017, 6. [Google Scholar] [CrossRef] [Green Version]
- Baldani, M.H.; Mendes, Y.B.E.; de Campos Lawder, J.A.; de Lara, A.P.I.; da Silva Rodrigues, M.M.A.; Antunes, J.L.F. Inequalities in dental services utilization among Brazilian low-income children: The role of individual determinants. J. Public Health Dent. 2011, 71, 46–53. [Google Scholar] [CrossRef] [PubMed]
- Baldani, M.H.; Rocha, J.S.; Fadel, C.B.; Nascimento, A.C.; Antunes, J.L.F.; Moysés, S.J. Assessing the role of appropriate primary health care on the use of dental services by Brazilian low–income preschool children. Cad. De Saude Publica 2017, 33, e00158116. [Google Scholar] [CrossRef] [Green Version]
- Chertok, I.R.; Chertok, N.; Haile, Z.T.; Chavan, B. Association of youth characteristics and recent utilization of dental services in the United States. Front. Pediatr. 2018, 6, 104. [Google Scholar] [CrossRef] [Green Version]
- Gao, X.; Ding, M.; Xu, M.; Wu, H.; Zhang, C.; Wang, X.; Feng, X.; Tai, B.; Hu, D.; Lin, H. Utilization of dental services and associated factors among preschool children in China. BMC Oral Health 2020, 20, 1–10. [Google Scholar] [CrossRef] [Green Version]
- Maffioletti, F.; Vettore, M.V.; Rebelo, M.; Herkrath, F.; Queiroz, A.; Herkrath, A.P.; Pereira, J.; Rebelo Vieira, J. Predisposing, enabling, and need characteristics of dental services utilization among socially deprived schoolchildren. J. Public Health Dent. 2020, 80, 97–106. [Google Scholar] [CrossRef]
- Naavaal, S.; Barker, L.K.; Griffin, S.O. The effect of health and dental insurance on US children’s dental care utilization for urgent and non-urgent dental problems-2008. J. Public Health Dent. 2017, 77, 54–62. [Google Scholar] [CrossRef]
- Vingilis, E.; Wade, T.; Seeley, J. Predictors of adolescent health care utilization. J. Adolesc. 2007, 30, 773–800. [Google Scholar] [CrossRef]
- Xu, M.; Yuan, C.; Sun, X.; Cheng, M.; Xie, Y.; Si, Y. Oral health service utilization patterns among preschool children in Beijing, China. BMC Oral Health 2018, 18, 31. [Google Scholar] [CrossRef] [Green Version]
- Astrom, A.N.; Ekback, G.; Nasir, E.; Ordell, S.; Unell, L. Use of dental services throughout middle and early old ages: A prospective cohort study. Community Dent. Oral Epidemiol. 2013, 41, 30–39. [Google Scholar] [CrossRef]
- Born, G.; Baumeister, S.; Sauer, S.; Hensel, E.; Kocher, T.; John, U. Merkmale von Risikogruppen einer unzureichenden Inanspruchnahme zahnmedizinischer Leistungen–Ergebnisse der Study of Health in Pomerania (SHIP). Das Gesundh. 2006, 68, 257–264. [Google Scholar] [CrossRef]
- Branch, L.; Jette, A.; Evashwick, C.; Polansky, M.; Rowe, G.; Diehr, P. Toward understanding elders’ health service utilization. J. Community Health 1981, 7, 80–92. [Google Scholar] [CrossRef]
- Brzoska, P.; Erdsiek, F.; Waury, D. Enabling and predisposing factors for the utilization of preventive dental health care in migrants and non–migrants in Germany. Front. Public Health 2017, 5, 201. [Google Scholar] [CrossRef] [Green Version]
- Davidson, P.; Andersen, R. Determinants of dental care utilization for diverse ethnic and age groups. Adv. Dent. Res. 1997, 11, 254–262. [Google Scholar] [CrossRef]
- Davidson, P.L.; Cunningham, W.E.; Nakazono, T.T.; Andersen, R.M. Evaluating the effect of usual source of dental care on access to dental services: Comparisons among diverse populations. Med. Care Res. Rev. 1999, 56, 74–93. [Google Scholar] [CrossRef]
- Ekanayake, L.; Mendis, R. Self reported use of dental services among employed adults in Sri Lanka. Int. Dent. J. 2002, 52, 151–155. [Google Scholar] [CrossRef]
- Evashwick, C.; Rowe, G.; Diehr, P.; Branch, L. Factors explaining the use of health care services by the elderly. Health Serv. Res. 1984, 19, 357. [Google Scholar]
- Finlayson, T.L.; Gansky, S.A.; Shain, S.G.; Weintraub, J.A. Dental utilization among Hispanic adults in agricultural worker families in California’s Central Valley. J. Public Health Dent. 2010, 70, 292–299. [Google Scholar] [CrossRef] [Green Version]
- Fonseca, S.G.O.D.; Fonseca, E.P.D.; Meneghim, M.D.C. Factors associated with public dental service use by adults in the state of Sao Paulo, Brazil, 2016. Ciência Saúde Coletiva 2019, 25, 365–374. [Google Scholar] [CrossRef] [PubMed]
- Herkrath, F.J.; Vettore, M.V.; Werneck, G.L. Contextual and individual factors associated with dental services utilisation by Brazilian adults: A multilevel analysis. PLoS ONE 2018, 13, e0192771. [Google Scholar]
- Herkrath, F.J.; Vettore, M.V.; Werneck, G.L. Utilisation of dental services by Brazilian adults in rural and urban areas: A multi–group structural equation analysis using the Andersen behavioural model. BMC Public Health 2020, 20, 953. [Google Scholar] [CrossRef]
- Jang, Y.; Yoon, H.; Rhee, M.K.; Park, N.S.; Chiriboga, D.A.; Kim, M.T. Factors associated with dental service use of older Korean Americans. Community Dent. Oral Epidemiol. 2019, 47, 340–345. [Google Scholar] [CrossRef] [PubMed]
- Kiyak, H.A. An explanatory model of older persons’ use of dental services: Implications for health policy. Med. Care 1987, 936–952. [Google Scholar] [CrossRef] [PubMed]
- Lee, S.-H.; Ryu, J.-I.; Jung, S.-H. Differences in Utilization of Medical and Dental Services among Homeless People in South Korea. Int. J. Environ. Res. Public Health 2020, 17, 5304. [Google Scholar] [CrossRef] [PubMed]
- Limpuangthip, N.; Purnaveja, S.; Somkotra, T. Predisposing and enabling factors associated with public denture service utilization among older Thai people: A cross–sectional population–based study. BMC Oral Health 2019, 19, 220. [Google Scholar] [CrossRef] [Green Version]
- Lo, E.C.; Schwarz, E. Determinants for dental visit behavior among Hong Kong Chinese in a longitudinal study. J. Public Health Dent. 1998, 58, 220–227. [Google Scholar] [CrossRef]
- McKernan, S.C.; Reynolds, J.C.; Ingleshwar, A.; Pooley, M.; Kuthy, R.A.; Damiano, P.C. Transportation Barriers and Use of Dental Services among Medicaid–Insured Adults. JDR Clin. Transl. Res. 2018, 3, 101–108. [Google Scholar] [CrossRef] [Green Version]
- Muirhead, V.; Quinonez, C.; Figueiredo, R.; Locker, D. Predictors of dental care utilization among working poor Canadians. Commun. Dent. Oral Epidemiol. 2009, 37, 199–208. [Google Scholar] [CrossRef]
- Nasir, E.F.; Åstrøm, A.N.; David, J.; Ali, R.W. Utilization of dental health care services in context of the HIV epidemic– a cross–sectional study of dental patients in the Sudan. BMC Oral Health 2009, 9, 30. [Google Scholar] [CrossRef]
- Pinto, R.D.S.; de Abreu, M.H.N.G.; Vargas, A.M.D. Comparing adult users of public and private dental services in the state of Minas Gerais, Brazil. BMC Oral Health 2014, 14, 100. [Google Scholar] [CrossRef] [Green Version]
- Rebelo Vieira, J.M.; Rebelo, M.A.B.; Martins, N.M.d.O.; Gomes, J.F.F.; Vettore, M.V. Contextual and individual determinants of non-utilization of dental services among Brazilian adults. J. Public Health Dent. 2019, 79, 60–70. [Google Scholar] [CrossRef] [PubMed]
- Reisine, S. A path analysis of the utilization of dental services. Community Dent. Oral Epidemiol. 1987, 15, 119–124. [Google Scholar] [CrossRef] [PubMed]
- Serna, C.A.; Sanchez, J.; Arevalo, O.; Tomar, S.L.; McCoy, V.; Devieux, J.; De La Rosa, M.; Bastida, E. Self-reported factors associated with dental care utilization among Hispanic migrant farmworkers in South Florida. J. Public Health Dent. 2020. [Google Scholar] [CrossRef]
- Silva, A.E.; Langlois Cde, O.; Feldens, C.A. Use of dental services and associated factors among elderly in southern Brazil. Rev. Bras. Epidemiol. Braz. J. Epidemiol. 2013, 16, 1005–1016. [Google Scholar] [CrossRef] [PubMed] [Green Version]
- Stapleton, S.; Finlayson, T.L.; Ohmit, A.; Hunte, H.E. Correlates of past year dental health visits: Findings from the I ndiana black men’s health study. J. Public Health Dent. 2016, 76, 157–165. [Google Scholar] [CrossRef] [PubMed]
- Suominen, A.L.; Helminen, S.; Lahti, S.; Vehkalahti, M.M.; Knuuttila, M.; Varsio, S.; Nordblad, A. Use of oral health care services in Finnish adults–results from the cross–sectional health 2000 and 2011 surveys. BMC Oral Health 2017, 17, 78. [Google Scholar] [CrossRef] [Green Version]
- Tennstedt, S.L.; Brambilla, D.L.; Jette, A.M.; McGuire, S.M. Understanding dental service use by older adults: Sociobehavioral factors vs need. J. Public Health Dent. 1994, 54, 211–219. [Google Scholar] [CrossRef] [PubMed]
- Varenne, B.; Petersen, P.E.; Fournet, F.; Msellati, P.; Gary, J.; Ouattara, S.; Harang, M.; Salem, G. Illness–related behaviour and utilization of oral health services among adult city–dwellers in Burkina Faso: Evidence from a household survey. BMC Health Serv. Res. 2006, 6, 164. [Google Scholar] [CrossRef] [Green Version]
- Xu, M.; Cheng, M.; Gao, X.; Wu, H.; Ding, M.; Zhang, C.; Wang, X.; Feng, X.; Tai, B.; Hu, D. Factors associated with oral health service utilization among adults and older adults in China, 2015-2016. Community Dent. Oral Epidemiol. 2020, 48, 32–41. [Google Scholar] [CrossRef] [PubMed]
- Zlotnick, C.; Baron-Epel, O.; Zusman, S.P.; Keinan-Boker, L. Trends and predictors of primary dental care health services for adults in Israel. Community Dent. Health 2014, 31, 212–218. [Google Scholar] [PubMed]
- Jönsson, B.; Holde, G.E.; Baker, S.R. The role of psychosocial factors and treatment need in dental service use and oral health among adults in Norway. Community Dent. Oral Epidemiol. 2020, 48, 215–224. [Google Scholar] [CrossRef] [PubMed]
- Atchison, K.A.; Gironda, M.W.; Messadi, D.; Der-Martirosian, C. Screening for oral health literacy in an urban dental clinic. J. Public Health Dent. 2010, 70, 269–275. [Google Scholar] [CrossRef] [Green Version]
- Andrus, M.R.; Roth, M.T. Health Literacy: A Review. Pharmacother. J. Human Pharmacol. Drug Ther. 2002, 22, 282–302. [Google Scholar] [CrossRef] [PubMed]
- Berkman, N.D.; Sheridan, S.L.; Donahue, K.E.; Halpern, D.J.; Crotty, K. Low health literacy and health outcomes: An updated systematic review. Ann. Intern. Med. 2011, 155, 97–107. [Google Scholar] [CrossRef] [PubMed]
- Sukumaran, I.; Taylor, S.; Thomson, W.M. The prevalence and impact of dental anxiety among adult New Zealanders. Int. Dent. J. 2020. [Google Scholar] [CrossRef]
- Bhandari, A.; Wagner, T. Self–reported utilization of health care services: Improving measurement and accuracy. Med Care Res. Rev. 2006, 63, 217–235. [Google Scholar] [CrossRef] [PubMed]
- Brüderl, J.; Ludwig, V. Fixed–effects panel regression. In The Sage Handbook of Regression Analysis and Causal Inference; Wolf, C., Ed.; SAGE: Los Angeles, CA, USA, 2015; pp. 327–357. [Google Scholar]
- Von Elm, E.; Altman, D.G.; Egger, M.; Pocock, S.J.; Gøtzsche, P.C.; Vandenbroucke, J.P. The Strengthening the Reporting of Observational Studies in Epidemiology (STROBE) statement: Guidelines for reporting observational studies. Ann. Intern. Med. 2007, 147, 573–577. [Google Scholar] [CrossRef] [PubMed] [Green Version]
- Allison, P.D. Missing Data; Sage Publications: Szende Oaks, CA, USA, 2001; Volume 136. [Google Scholar]
- Von Hippel, P.T. New confidence intervals and bias comparisons show that maximum likelihood can beat multiple imputation in small samples. Struct. Equ. Modeling Multidiscip. J. 2016, 23, 422–437. [Google Scholar] [CrossRef]
- Hajek, A.; De Bock, F.; Huebl, L.; Kretzler, B.; König, H.-H. Postponed dental visits during the COVID–19 pandemic and their correlates. Evidence from the nationally representative COVID–19 Snapshot Monitoring in Germany (COSMO). Healthcare 2021, 9, 50. [Google Scholar] [CrossRef] [PubMed]


| # | Search Term |
|---|---|
| #1 | Dental serv * |
| #2 | Dental visit * |
| #3 | Dental care u * |
| #4 | Oral health serv * |
| #5 | Dentist |
| #6 | #1 OR #2 OR #3 OR #4 OR #5 |
| #7 | Andersen model |
| #8 | Andersen’s behavioral model of health serv * |
| #9 | Andersen and Newman behavioral model of health serv * |
| #10 | #7 OR #8 OR #9 |
| #11 | #6 AND #10 |
| First Author | Country | Assessment of Dental Service Use | Study Type/ Time | Sample | Sample Size; Age; Females in Total Sample | Predisposing Factors | Enabling Factors | Need Factors |
|---|---|---|---|---|---|---|---|---|
| Al Agili (2020) [22] | Saudi Arabia | ever visited a dentist (yes/no) | cross-sectional study | third- and eighth-grade children in Jeddah, Saudi Arabia | n = 1397 <9 years: 49.8% 9–14 years: 39.4% >14 years: 10.9% 41.0% female children | Multiple logistic regressions showed that parent education (>high school, OR: 2.0 (95% CI: 1.3–3.1), compared to < high school) was associated with an increased likelihood of having ever visited a dentist among third-grade children, whereas sex and nationality were not associated with ever having visited a dentist among third-grade children. Among eighth-grade children, sex (OR: 2.4, 95% CI: 1.4–4.0) was a significant positive predictor, whereas nationality and parental education remained insignificant. | Furthermore, regressions showed that enabling factors (in terms of school type, family monthly income, government financial support and medical insurance) were not associated with the outcome measure among both third- and eighth-grade children. | Regressions showed that carrying experience was associated with an increased likelihood of having ever visited a dentist among both third-grade (OR: 2.8, 95% CI: 1.7–4.7) and eighth-grade children (OR: 2.3, 95% CI: 1.4–3.8). |
| Azañedo (2017) [23] | Peru | access to an oral health service within the previous six months (yes/no) | cross-sectional study | Survey on Demography and Family Health 2014–2015 | n = 71,614 0–2: 28.7% 3–5: 27.2% 6–11: 44.1% 49.0% female children | Poisson regression showed that age group (6–12: OR: 3.1, 95% CI: 2.9–3.2) was positively associated with dental services use. Gender was not significantly associated. | Enabling factors: Natural region of residency (jungle: OR: 0.8, 95% CI: 0.8–0.8) was negatively, the type health insurance (private: OR: 1.3, 95% CI: 1.1–1.6) was positively, the quintile of wealth (fifth quintile: OR: 1.6, 95% CI: 1.5–1.7) was positively and caregiver’s educational level (higher: OR: 1.6, 95% CI: 1.5–1.8) was also positively related to dental services use. The area of residence and the caregiver’s language were no significant predictors. | not investigated |
| Baldani (2011) [24] | Brazil | at least one dental visit in one’s lifetime (yes/no) | cross-sectional study | broad household survey in Paraná, Brazil | n = 350 0–6: 52.6% 7–14: 47.4% 51.4% female children | Logistic regression showed that never having had a dental visit was positively associated with only visiting a dentist in case of pain (OR: 4.3, 95% CI: 1.8–10.2), but not significantly with the ownership of one’s family house. | Never having had a dental visit was positively associated with not going to kindergarten or school (OR: 11.2, 95% CI: 5.7–22.1) and not having the health condition regularly monitored by a Family Help Program team (OR: 2.5, 95% CI: 1.3–4.8). | Having reported one’s child oral health problems was negatively related to never having attended a dentist (OR: 0.3, 95% CI: 0.1–0.5). |
| Baldani (2017) [25] | Brazil | having consulted a dental assistant in one’s lifetime (yes/no) | cross-sectional study | preschool children served by the Family Health Strategy in Paraná, Brazil | n = 438 3: 37.7% 4: 34.9% 5: 27.4% 50.7% female children | Poisson regression showed that age group (4: OR: 1.49, 95% CI: 1.0–2.2) was positively related to dental attendance. Household overcrowding was not significant. | Living with both parents was significantly positively associated with an increased probability of dental attendance (OR: 1.5, 95% CI: 1.0–2.2). | An oral impact on the quality of life was a positively related independent variable (OR: 1.6, 95% CI: 1.1–2.2). |
| Chertok (2018) [26] | United States | at least one dental visit during the last year (yes/no) | cross-sectional study | Youth Risk Behavior Survey (YRBS) | n = 5814 ≤14: 3.9% 15: 17.3% 16: 27.3% ≥17: 51.5% 48.3% female children | Logistic regression showed that male gender (OR: 0.9, 95% CI: 0.8–1.0), non-white ethnicity (e.g. Hispanic: OR: 0.4, 95% CI: 0.3–0.6), tobacco use (OR: 0.8, 95% CI: 0.6–0.9), substance abuse (OR: 0.8, 95% CI: 0.7–1.0), not drinking soda (OR: 0.8, 95% CI: 0.7–1.0) and never or rarely wearing a seat belt (OR: 0.5, 95% CI: 0.4, 0.7) were related to decreased odds of dental visits. | Not speaking English well was associated with a decreased likelihood of dental visits (OR: 0.2, 95% CI: 0.1–0.4). | Overweight was associated with decreased odds of dental attendance (OR: 0.7, 95% CI: 0.6–0.9). |
| Gao (2020) [27] | China | at least one dental visit during the last year (yes/no) | cross-sectional study | National Oral Health Survey | n = 40,305 3: 30.7% 4: 34.6% 5: 34.7% 49.8% females | Logistic regression showed that dental attendance was significantly associated with higher age (OR: 1.3, 95% CI: 1.2–1.5), higher parents’ education (OR: 2.3, 95% CI: 2.0–2.7), a high oral health attitude (OR: 1.6, 95% CI: 1.4-1.9) and a high oral health knowledge (OR: 1.4, 95% CI: 1.2–1.5). | Rural location (OR: 0.7, 95% CI: 0.5–0.8) and higher income (OR: 1.4, 95% CI: 1.2–1.7) significantly influenced dental attendance. | Toothache (OR: 9.7, 95% CI: 7.8–12.1) and bad oral health (OR: 3.5, 95% CI: 2.8–4.4) were associated with increased odds, a bad overall health (OR: 0.6, 95% CI: 0.4–0.8) was associated with decreased odds of dental attendance. |
| Maffioletti (2020) [28] | Brazil | at least one dental visit during the last year (yes/no) | cross-sectional study | 12-year old children enrolled in public schools located in a deprived area of the city of Manaus, Brazil | n = 358 12-year olds 58.4% female children | According to a Parsimonious model, dental attendance was associated with parents’ sense of coherence (ß = –0.1, p < 0.05). The child’s gender remained insignificant. | A higher socioeconomic status was linked to decreased odds of dental attendance (ß = −0.2, p < 0.05). | The oral clinical status was significantly related to dental visits (ß = 0.2, p < 0.05). |
| Naavaal (2017) [29] | United States | at least one dental visit during the last six months because of a dental problem (yes/no) | cross-sectional study | National Health Interview Survey | n = 2834 2–17 female: not displayed | Logistic regression showed that living in the Midwest was associated with a lower likelihood of dental attendance (OR: 0.8, 95% CI: 0.6–1.0). Age, sex, place of birth and race remained insignificant. | Parents’ college degree (OR: 1.7, 95% CI: 1.1–2.6) and a high family income (e.g. ≥ 300%: OR: 2.6, 95% CI: 1.6–3.4) were related to higher chances of dental attendance. | not investigated |
| Vingilis (2007) [30] | Canada | at least one dental visit during the last two years (yes/no) | longitudinal study | Canadian National Population Health Survey (NPHS) | n = 1493 M = 15.5 (first wave) not displayed | At the second wave, Poisson regression revealed that age, sex, family structure and school or work setting were insignificant. | Income during the first wave (ß = 0.1, p < 0.001) and social involvement during the second wave (ß = 0.1, p < 0.001) were linked to increased chances of dental attendance. | A better self-rated health (e.g. good: ß = –0.5, p < 0.01) and disability (ß = 0.2, p < 0.01) during the first wave were associated with decreased chances of dental attendance. Overall health status was not significant. |
| Xu (2018) [31] | China | at least one dental visit during the last year (yes/no) | cross-sectional study | preschool children from five kindergartens in Beijing, China | n = 1425 ≤3: 35.5% ≥4: 64.5% 48.4% females | According to negative binomial regression, being older than three years (OR: 1.5, 95% CI: 1.2–1.8), the better education of one’s parents (e.g. master: OR: 1.4, 95% CI: 1.1–1.7) and Kindergarten attendance with regular source of oral health (OR: 2.2, 95% CI: 1.8–2.8) were related to dental visits. Gender, parents’ oral health knowledge and attitude score and occupation or income remained insignificant. | not investigated | Parental perceived bad oral health status of child (OR: 2.1, 95% CI: 1.6–2.8), decayed or missing teeth (OR: 1.0, 95% CI: 1.0–1.1) and dental pain during the last twelve months (OR: 2.1, 95% CI: 1.7–2.5) were related to increased odds of dental attendance. |
| First Author | Country | Assessment of Dental Service Use | Study Type/Time | Sample | Sample Size; Age; Females in Total Sample | Predisposing Factors | Enabling Factors | Need Factors |
|---|---|---|---|---|---|---|---|---|
| Astrom (2013) [32] | Sweden | using dental services at least once a year (yes/no) | longitudinal study (four waves from 1992 to 2007) | recruited among everyone who was born in 1942 and lived in Orebro and Ostergotland, Sweden, in 1992 | n = 4143 1942 birth cohort 52.2% females | Regression analysis showed that female gender (OR: 1.4, 95% CI: 1.1–1.7) and being married (OR: 1.6, 95% CI: 1.2–2.2) were positively associated with dental services use, while the country of birth was not a significant predictor. | Good quality of dental care (OR: 1.2, 95% CI: 1.0–1.4), dental care as a child (OR: 0.7, 95% CI: 0.5–0.9) and public care (OR: 0.2, 95% CI: 0.2–0.3) were significantly positively related to dental services use, whereas the receive of information during the last visit was not significant. | Missing no teeth (OR: 1.3, 95% CI: 1.0–1.8) was positively and perceived problems (OR: 0.7, 95% CI: 0.6–0.8) was negatively associated with dental attendance. |
| Born (2006) [33] | Germany | at least one dental visit during the last year (yes/no) | cross–sectional study | Study of Health in Pomerania (SHIP) | n = 4310 M = 50.3 SD = 16.4 20–79 50.9% females | Logistic regression revealed that dental attendance was negatively related to a lower education (having completed secondary school: OR: 0.4, 95% CI: 0.2–0.6) and positively related to being female (OR: 1.5, 95% CI: 1.2–1.8). Age was no significant predictor. | Private health insurance (OR: 2.6, 95% CI: 1.5–4.4) and using a bonus booklet (OR: 8.2, 95% CI: 6.3–10.6) led to an increased likelihood of dental attendance. | Not holding regular dental attendance for important (OR: 0.1, 95% CI: 0.1–0.3) was negatively on the one side, being satisfied with one’s teeth appearance (OR: 1.7, 95% CI: 1.1–2.6), still having one’s own teeth (OR: 3.3, 95% CI: 2.2–4.8) and Caries (OR: 1.0, 95% CI; 1.0–1.0) were positively associated with dental visits. In addition, the reason for one’s last dental visit (e.g. prevention: OR: 1.4, 95% CI: 1.1–1.8) was a significant predictor. |
| Branch (1981) [34] | United States | at least one dental visit during the last year (yes/no) | cross–sectional study | noninstitutionalized elders aged 65 years or older | n = 1625 M = 73.2 ≥65 60.0% females | Regression analysis found out that education (ß = 0.1, p < 0.05) was significantly associated with dental attendance. Race, age, gender, household composition and marital status were not. | Income (ß = 0.1, p < 0.05) and occupation (ß = –0.2, p < 0.001) were significant independent variables. Insurance, transportation problems and regular physician visits were insignificant. | Perceived health status, activities of daily living, physical activity performance, ability to climb stairs or walk a half mile and health problems remained insignificant. |
| Brzoska (2017) [35] | Germany | at least one dental checkup during the last year (yes/no) | cross–sectional study | German Health Update 2009 and German Health Update 2010 | n = 41,220 age not reported 59.7% females | Regression analysis revealed that migrant status (OR: 0.7, 95% CI: 0.6–0.7), age (OR: 1.0, 95% CI: 1.0–1.0) and female sex (OR: 1.9, 95% CI: 1.8–2.0) were associated with dental visits. | High socioeconomic status (OR: 2.6, 95% CI: 2.4–2.8), private health insurance (OR: 0.8, 95% CI: 0.7–0.8), living in a partnership (OR: 1.6, 95% CI: 1.6–1.7) or in Western Germany (OR: 0.9, 95% CI: 0.8–0.9) or in an urban setting (OR: 0.9, 95% CI: 0.9, 1.0) and strong social support (OR: 1.4, 95% CI: 1.3–1.5) were significantly related to dental visits. | not investigated |
| Davidson (1997) [36] | United States | at least one dental visit during the last year (yes/no) | cross–sectional study | WHO International Collaborative Study of Oral Health Outcomes (ICS–II) | n = 4386 35–44: 52.0% 65–74: 48.0% female: not displayed | Regarding White people in Baltimore, regression showed that nine to eleven education years (OR: 0.4, 95% CI: 0.2–0.8), wearing dentures (OR: 0.5, 95% CI: 0.3–1.0) and being edentulous (OR: 0.1, 95% CI: 0.1–0.2), not being afraid of the visit (OR: 1.7, 95% CI: 1.3–2.2) and motivation to visit (OR: 2.7, 95% CI: 1.7–4.1) were associated with the chances of dental attendance. Age, gender, marital status, general health and other oral health beliefs remained insignificant. Regarding African–Americans, being edentulous (OR: 0.3, 95% CI: 0.1–0.9) and not being afraid of the visit (OR: 1.6, 95% CI: 1.1–2.2) was related to the odds of dental attendance. Age, gender, education, marital status, general health, wearing dentures and other health beliefs remained insignificant. | Among White people, the presence of a usual source of care was associated with an increased likelihood of a dental visit (OR: 30.1, 95% CI: 15.4–58.8). Income and dental benefits remained insignificant. Among African–Americans, the presence of a usual source of care was associated with increased odds of a dental visit (OR: 6.7, 95% CI: 2.9–15.5). Income and dental benefits remained insignificant. | For White people, oral pain was associated with higher chances of dental attendance (OR: 1.8, 95% CI: 1.3–2.7). Oral symptoms were not.For African Americans, oral pain was related to increased odds of dental attendance (OR: 1.7, 95% CI: 1.1–2.2). Oral symptoms remained insignificant. |
| Davidson (1999) [37] | United States | at least one dental visit during the last year (yes/no) | cross–sectional study | WHO International Collaborative Study of Oral Health Outcomes (ICS–II) | n = 4412 35–44: 60.5% 65–74: 39.5% 53.6% females | Regarding regression analysis for Baltimore, being White (OR: 2.0, 95% CI: 1.4–2.9), nine to eleven education years (OR: 0.5, 95% CI: 0.3–0.9), being edentulous (OR: 0.1, 95% CI: 0.1–0.2), not being afraid of dental visits (OR: 1.6, 95% CI: 1.3–2.0) and a motivation to visit (OR: 2.0, 95% CI: 1.5–2.8) were related to dental attendance. Age, gender, marital status, general health, dentures, thinking that oral health is important and having a dentist available remained insignificant. | With regard to Baltimore, having a usual source of care (OR: 16.9, 95% CI: 10.0–28.6) was associated with increased odds of dental attendance. Income and dental visits remained insignificant. | Referring to Baltimore, oral pain was related to increased odds of dental attendance (OR: 1.6, 95% CI: 1.2–2.3). The number of oral symptoms was not. |
| Ekanayake (2002) [38] | Sri Lanka | at least one dental visit during the last two years (yes/no) | cross–sectional study | employees of public sector institutions situated in the city of Kandy | n = 210 21–34: 27.1% 35–45: 47.6% >45: 25.3% 50.5% females | Logistic regression showed that female gender was associated with an increased likelihood of dental attendance (OR: 2.5, 95% CI: 1.4–4.7) | not investigated | Dental pain within the last six months was related to increased odds of a dental visit (OR: 2.0, 95% CI: 1.0–4.0). |
| Evashwick (1984) [39] | United States | at least one dental visit during the last 15 months (yes/no) | longitudinal study (wave 1: 1974, wave 2: 1976) | Massachusetts Health Care Panel Study | n = 1317 65–69: 36.2% 70–74: 27.4% 75–89: 19.7% ≥80: 16.7% 61.7% females | Education and preventive visits at one’s physician were associated with more dental visits, higher age with less dental visits. Widowed use and race remained insignificant, according to multiple regression analysis. | Higher income and a white collar job were significantly associated with an increased likelihood of dental attendance. Having Medicaid, a doctor or transportation problems were not predictive. | A bad health state was linked to decreased odds of dental attendance. Problems with physical activities, walking stairs or half a mile and a poor function status or physical condition were insignificant. |
| Finlayson (2010) [40] | United States | at least one dental visit during the last year (yes/no) | cross–sectional study | UC Davis Immigration to California: Agricultural Safety and Acculturation (MICASA) study | n = 326 M = 36.7 SD = 9.0 20–61 67.5% females | Regarding Generalized estimating equation logit regression, asking for the dentist’s advice was associated with a higher likelihood of dental attendance (OR: 4.6, 95% CI: 2.3–9.5). Age, gender, being married, days worked farming and fair or poor health were insignificant. | Having a regular source of dental care was related to higher chances of having had a dental visit (OR: 4.8, 95% CI: 2.5–9.4). Acculturation, education, income, household size and dental insurance status were not significant. | Self–reported symptoms were associated with decreased odds of dental attendance (OR: 0.9, 95% CI: 0.8–0.9). Untreated decay, gum bleeding on probing and subjective need remained insignificant. |
| Fonseca (2020) [41] | Brazil | at least one dental visit during the last year (yes/no) | cross–sectional study | representative sample of adults living in the State of São Paulo | n = 5709 35–39: 51.2% 40–45: 48.8% 68.0% females | Logistic regression showed that male gender (OR: 0.9, 95% CI: 0.7–1.0) and 10 or more education years (OR: 0.5, 95% CI: 0.5–0.6) were associated with decreased, and that non–white skin color (OR: 1.3, 95% CI: 1.2–1.5) and toothache (OR: 1.6, 95% CI: 1.4–1.8) were associated with increased odds of dental attendance. | Lower household income was related to increased odds of a dental visit (OR: 2.4, 95% CI: 2.1–2.7). | Endodontic treatment was significantly linked to dental attendance (OR: 1.4, 95% CI: 1.1–1.9). |
| Herkrath (2018) [42] | Brazil | at least one dental visit during the last year (yes/no) | cross–sectional study | Brazilian National Health Survey (NHS) | n = 27,017 18–21: 8.5% 22–34: 29.2% 35–44: 19.8% 45–64: 30.0% ≥65: 12.5% 55.0% females | Multilevel logistic regression revealed that higher age (e.g. 65+: OR: 3.2, 95% CI: 2.7–3.8), male gender (OR: 1.5, 95% CI: 1.4–1.6), brown race (both: OR: 1.1, 95% CI: 1.0–1.2), less years of schooling (e.g. 0–4: OR: 2.1, 95% CI: 1.9–2.4) and a low social network (OR: 1.6, 95% CI: 1.4–1.8) were related to an increased likelihood of dental visits. | Lower income (OR: 1.6, 95% CI: 1.4–1.8) and having no health insurance (OR: 1.8, 95% CI: 1.7–1.9) were significantly associated with higher odds of dental attendance. | A poor perceived dental health (OR: 1.8, 95% CI: 1.5–2.1) and missing all teeth (OR: 2.9, 95% CI: 2.4–3.3) were positively related to dental visits, while eating difficulties due to an oral problem (OR: 0.9, 95% CI: 0.8–1.0) and missing one or more teeth (OR: 0.8, 95% CI: 0.7–0.8) were negatively related. |
| Herkrath (2020) [43] | Brazil | ever visited a dentist (yes/no) | cross–sectional study | Brazilian National Health Survey (NHS) | n = 60,202 M = 42.9 95% CI: 42.9–43.0 52.9% females | Regression analysis showed that being male and being younger were related to decreased chances of dental attendance. | Living in urban areas, higher enabling financing and public health center registration were related to increased odds of dental attendance. | Higher perceived needs were associated with higher chances of dental attendance. |
| Jang (2019) [44] | United States | total count of visits to a dentist during the last year | cross–sectional study | representative sample of Korean immigrants from five cities | n = 2128 M = 73.4 SD = 8.0 60–100 66.8% females | Regarding the Poisson regression, having at least a high school degree was associated with a higher likelihood of dental attendance (OR: 1.1, 95% CI: 1.0–1.2). Age, gender, marital status and region remained insignificant. | Dental insurance coverage (OR: 1.4, 95% CI: 1.2–1.5) and the presence of a family network (OR: 1.0, 95% CI: 1.0–1.0) were significantly associated with a higher likelihood of dental visits. Acculturation and the length of stay in the United States were not significant. | A problem with teeth or gums was related to increased odds of dental attendance (OR: 1.1, 95% CI: 1.0–1.2). A fair or poor rating of one’s oral health was not significant. |
| Kiyak (1987) [45] | United States | any use of dental services during the last three years (yes/no) | cross–sectional study | low–income and middle–income elderly, recruited from medical centers with reduced service fees | n = 258 M = 73.6 71.9% females | Multiple regression revealed that one’s importance (b = –0.3, ß < 0.01) and one’s gender (b = 0.1, ß < 0.05) were significantly related to dental attendance. | One’s beliefs (b = –0.1, ß < 0.05), one’s income (b = 0.1, ß < 0.05) and one’s information (b = –0.0, ß < 0.05) were significantly associated with dental attendance. | The number of teeth (b = –0.0, ß < 0.01), one’s perceived need (b = –0.3, ß < 0.01) and wearing a denture (b = 0.2, ß < 0.05) were associated with increased or decreased odds of dental attendance. |
| Lee (2020) [46] | South Korea | any use of dental services during the last three years (yes/no) | cross–sectional study | nationwide sample of homeless people | n = 2032 <50: 26.9% ≥50: 73.1% 19.6% females | According to Poisson regression, drinking was associated with decreased odds of dental attendance (OR: 0.8, 95% CI: 0.7–1.0). Age, sex, education, duration of homelessness and smoking remained insignificant. | Shelter housing (OR: 1.6, 95% CI: 1.1–2.3) and not being employed (OR: 0.8, 95% CI: 0.7–1.0) were related to dental attendance. Income was not significant. | Subjective health and having a medical disease were not significant. |
| Limpuangthip (2019) [47] | Thailand | any use of public dental services during the last five years (yes/no) | cross–sectional study | randomly selected people aged 50 and above | n = 38,695 60–69: 55.7% 70–79: 30.7% ≥80: 13.6% 55.7% females | Binary logistic regression stated that higher age (e.g. 80+: OR: 2.0, 95% CI: 1.8–2.1), female gender (OR: 1.3, 95% CI: 1.2–1.3), a higher education (e.g. at least tertiary: OR: 1.3, 95% CI: 1.1–1.5), higher household possession (e.g. fourth quartile: OR: 2.2, 95% CI: 2.1–2.4) and dependency status (e.g. low dependency: OR: 1.3, 95% CI: 1.2–1.3) were associated with an increased likelihood of dental attendance. | Working in agricultural and related sectors (OR: 0.7, 95% CI: 0.6–0.8), health–promoting behavior (OR: 1.4, 95% CI: 1.2–1.7), alcohol drinking or smoking (OR: 0.8, 95% CI: 0.8–0.9), public healthcare service utilization for vaccination (OR: 1.2, 95% CI: 1.1–1.2) or recent illness (OR: 1.2, 95% CI: 1.1–1.2), treatment by health personnel for recent falling accident (OR: 0.8, 95% CI: 0.8–0.8), being visited by a village health volunteer (OR: 0.8, 95% CI: 0.7–0.8) and participation in a club for the elderly (OR: 1.0, 95% CI: 0.9–1.0) were related to dental attendance. Information awareness was not. | not investigated |
| Lo (1998) [48] | Hong Kong (China) | at least one dental visit during the last year (yes/no) | longitudinal study (two waves from 1991 to 1992) | random sample of 35– to 44–year–olds from two districts in Hong Kong | n = 322 35– to 44–year–olds female: not displayed | Regarding logistic regression, sex (ß = 1.0, p < 0.01) was associated with an increased likelihood of having made a dental visit. | Having a dentist as health counselor was associated with dental attendance (ß = 1.5, p < 0.01). Being a regular user and toothbrushing remained insignificant. | Need for fillings (ß = 0.9, p < 0.05), the number of filled (ß = 0.1, p < 0.01) teeth were associated with different odds of dental attendance. The number of decayed teeth was not significant. |
| McKernan (2018) [49] | United States | at least one dental visit since being enrolled in the study (yes/no) | cross–sectional study | adults enrolled in the Iowa Dental Wellness Plan | n = 1258 M = 45.2 SD = 12.4 19–64 40.3% females | Referring to a logistic regression model, female sex (OR: 0.7, 95% CI: 0.5–0.9), chronic physical conditions (OR: 1.4, 95% CI: 1.1–1.9), a high school degree (OR: 0.7, 95% CI: 0.5–0.9) and being edentulous (OR: 0.5, 95% CI: 0.2–0.8) were related to dental attendance. Age, marital status and ethnicity were not significant. | Worry about transportation costs (OR: 0.8, 95% CI: 0.7–0.9) and using public transport systems or walking (OR: 0.6, 95% CI: 0.4–0.9) were related to a decreased likelihood of dental attendance. Urban–rural character, the distance to the nearest dentist and unmet transportation needs were insignificant. | Dental problems interfere with regular activities was insignificant. |
| Muirhead (2009) [50] | Canada | at least one dental visit during the last year (yes/no) | cross–sectional study | working poor people aged between 18and 64 years from ten Canadian provinces | n = 1049 18–24: 14.6% 25–34: 19.7% 35–44: 22.4% 45–54: 22.7% 55–64: 20.6% 41.3% females | With regard to the logistic regression analysis, being male (OR: 1.6, 95% CI: 1.2–2.3) and being 25 to 34 years old (OR: 2.0, 95% CI: 1.1–3.7) was related to dental attendance. Other age groups and lone parent status were not. | Out–of–pocket dental payment (OR: 2.6, 95% CI: 1.6–3.3), competing needs (OR: 0.5, 95% CI: 0.3–0.9) and a history of welfare receipt (OR: 1.7, 95% CI: 1.1–2.6) were significantly associated with dental visits. Income was not. | Being without a functional dentition (OR: 4.2, 95% CI: 2.4–7.4) and perceived need for dental treatment (OR: 2.8, 95% CI: 2.0–3.9) were related to dental attendance. Oral health impact on sleep was not. |
| Nasir (2009) [51] | Sudan | at least one dental visit during the last two years (yes/no) | cross–sectional study | recruited from a hospital and a university | n = 1262 ≤29: 47.6% >30: 52.4% 64.8% females | Regression analysis showed being female (OR: 2.1, 95% CI: 1.4–3.2) were related to increased odds of dental attendance. Travelling outside or inside Sudan was not. | High knowledge of HIV transmission (OR: 0.5, 95% CI: 0.3–0.7) and high experience of HIV (OR: 0.8, 95% CI: 0.5–1.3) were associated with lower odds of dental attendance. Perceived personal risk and attitudes towards people infected with HIV were not. | Filled teeth (OR: 14.9, 95% CI: 3.1–72.1), good teeth condition (OR: 0.5, 95% CI: 0.3–0.8) and good health condition (OR: 0.9, 95% CI: 0.5–1.5) were significantly linked to dental attendance. |
| Pinto Rda (2014) [52] | Brazil | use of public healthcare services (yes/no) | cross–sectional study | SB Minas Gerais Project | n = 1101 35–39: 52.7% 40–44: 47.3% 65.8% females | Being dark–skinned or black (OR: 2.4, 95% CI: 1.3–4.5) and living with more than four people in a household (OR: 2.0, 95% CI: 1.4–2.9) was related to higher odds of dental attendance, according to regression analysis. | A smaller income (e.g. up to 750$: OR: 3.9, 95% CI: 1.8–9.5) and a smaller town size (OR: 3.0, 95% CI: 1.9–4.6) were linked to a higher likelihood of having had a dental visit. | Teeth needing treatment was positively associated with the likelihood of dental attendance (OR: 1.1, 95% CI: 1.0–1.2). |
| Rebelo Vieira (2019) [53] | Brazil | ever visited a dentist (yes/no) | cross–sectional study | Brazilian Oral Health Survey (SB Brazil Project) | n = 7265 35–39: 52.5% 40–44: 47.5% 69.9% females | Multilevel logistic regression showed that high longevity (OR: 0.3, 95% CI: 0.1–1.0), female sex (OR: 0.7, 95% CI: 0.5–0.8), brown skin color (OR: 0.6, 95% CI: 0.4–0.7) and less years of schooling (e.g. 5–8: OR: 1.6, 95% CI: 1.1–2.2) were related to dental non–attendance. | Lower income (e.g. ≤500R$ per month: OR: 4.9, 95% CI: 3.0–8.0) was associated with increased chances of non–attendance. | Perceived dental treatment (OR: 0.4, 95% CI: 0.3–0.6) and one or more decayed teeth (OR: 1.4, 95% CI: 1.1–1.8) were related to dental attendance. |
| Reisine (1987) [54] | United States | number of dental visits during the last two years | cross–sectional study | university employees | n = 287 M = 28.0 61.3% females | According to stepwise regression, being male was associated with increased numbers of dental visits (ß = –0.3, p < 0.05). Age, education, marital status, brushing frequency, father’s education, attitude and number of children remained insignificant. | Residence, convenience, transportation and income were not significant. | Decay (ß = –0.1, p < 0.05) and missing or filled teeth (ß = 0.2, p < 0.05) were associated with dental attendance. Fluoride, the reason for the visit and periodontal pocket measures were not. |
| Serna (2020) [55] | United States | at least one dental visit during the last year (yes/no) | cross–sectional study | HIV Risk Reduction among Hispanic Migrant Workers in South Florida | n = 278 18–49: 71.9% ≥50: 28.1% 45.7% females | A logistic regression model revealed that trying to prevent tooth decay (OR: 2.5, 95% CI: 1.1–5.7) and brushing teeth once a day (OR: 3.9, 95% CI: 1.6–9.4) were associated with an increased likelihood of dental attendance. Age, sex, country of origin, formal education, relationship status, religious beliefs and use of dental floss were not. | Employment status, medical insurance, place of medical care, social support and acculturation remained insignificant. | A good oral health condition was associated with increased odds of dental visits (OR: 3.9, 95% CI: 1.9–7.9). Need of treatment and oral health problems were not. |
| Silva (2013) [56] | Brazil | at least one dental visit during the last three years (yes/no) | cross–sectional study | users of Family Health Units in the urban area of Pelotas, Brazil | n = 438 60–69: 57.4% 70–79: 31.6% ≥80: 11.0% 68.3% females | Poisson regression explored that lower education was associated with lower odds of dental attendance (e.g. < 4 years: OR: 1.4, 95% CI: 1.0–2.0). | Being a former alcohol consumer was associated with higher chances of dental attendance (OR: 1.3, 95% CI: 1.1–1.6). | Having no teeth was related to higher odds of dental attendance (OR: 1.7, 95% CI: 1.3–2.3). |
| Stapleton (2016) [57] | United States | at least one dental visit during the last year (yes/no) | cross–sectional study | Indiana Black Men’s Health Study | n = 1444 18–34: 38.3% 35–44: 18.9% 45–64: 35.1% ≥65: 7.7% 0.0% females | According to multilevel regression, being married (OR: 1.4, 95% CI: 1.1–1.6) was associated with increased chances of dental attendance. Age remained insignificant. | Being a college graduate (OR: 1.8, 95% CI: 1.2–2.8) or employed (OR: 0.7, 95% CI: 0.5–1.0), a higher income (e.g. > $35,000: OR: 1.9, 95% CI: 1.1–3.2), health insurance (OR: 1.7, 95% CI: 1.2–2.3) and high social support (OR: 1.9, 95% CI: 1.3–2.8) were related to dental visits. Smoking and the place of sick care were not. | Three or more fruit servings per day were related to an increased likelihood of dental attendance (OR: 1.8, 95% CI: 1.2–2.8). Self–rated health status, poor mental health days and vegetable servings remained insignificant. |
| Suominen (2017) [58] | Finland | at least one dental visit during the last year (yes/no) | cross–sectional study | National Health 2000 and 2011 Surveys | n = 12,759 aged 30 and older not displayed | In 2011, regarding logistic regression, being female was associated with increased odds of dental visits (OR: 1.2, 95% CI: 1.0–1.4). Age was not significant. | The presence of waiting lists (OR: 1.2, 95% CI: 1.0–1.5) or high costs (OR: 0.5, 95% CI: 0.4–0.8), as a barrier to care, regular check–ups (OR: 3.9, 95% CI: 3.2–4.7), dental fear (OR: 1.1, 95% CI: 1.0–1.3) and being recalled (OR: 1.6, 95% CI: 1.3–2.0) were associated with dental attendance. Poor connection as a barrier to care was not. | Perceived need for care was related to decreased odds of dental attendance (OR: 0.6, 95% CI: 0.5–0.7). Self–rated oral health and wearing removable dentures were not. |
| Tennstedt (1994) [59] | United States | number of dental visits during the last year | cross–sectional study | community–dwelling, noninstitutionalized elders aged 70 and older, living within the six New England states in the United States | n = 3668 M = 77.5 SD = 5.5 70–96 57.0% females | Ordinal logistic regression found out that higher age was associated with a lower number of dental visits (OR: 0.8, p < 0.01). | Dental hygiene practices (OR: 1.5, p < 0.001), higher education (OR: 1.2, p < 0.01) and the presence of a usual source of care (OR: 45.9, p < 0.001) were related to dental visits. | Perceived need for care (OR: 0.7, p < 0.05), the number of caries (OR: 0.9, p < 0.05) and the number of filled teeth (OR: 1.5, p < 0.001) was linked to dental attendance. |
| Varenne (2006) [60] | Burkina Faso | at least one dental visit during the last year (yes/no) | cross–sectional study | people who had an oral problem from four areas representative of different stages of urbanization of Ouagadougou, Burkina Faso | n = 809 15–24: 8.8% 25–34: 22.8% 35–44: 34.1% 45–54: 17.3% ≥55: 17.0% 67.4% females | According to logistic regression, being 25 to 34 years old (OR: 2.7, 95% CI: 1.5–4.7), being Christian (OR: 1.8, 95% CI: 1.3–2.6), higher material living conditions of one’s household (e.g. high: OR: 3.4, 95% CI: 2.1–5.4), agreeing that oral diseases are as important as other health problems (OR: 2.1, 95% CI: 1.2–3.6) and disagreeing that going to the dentist is synonymous with pain (OR: 0.5, 95% CI: 0.3–0.7) were related to dental attendance. | Active participation in one’s social network (OR: 1.8, 95% CI: 1.1–3.0) and using a moped or vehicle (OR: 2.2, 95% CI: 1.4–3.2) were associated with an increased likelihood of dental visits. | Oral problem causing limitation or stopping any of usual activities were related to increased odds of dental visits (OR: 3.4, 95% CI: 2.4–4.9). |
| Xu (2020) [61] | China | at least one dental visit during the last year (yes/no) | cross–sectional study | National Oral Health Survey | n = 7206 35–44: 50.9% 65–74: 49.1% 48.9% females | Poisson regression showed that among 35–44–years old people, being female (OR: 1.2, 95% CI: 1.0–1.3) and having a high knowledge about oral health (OR: 1.3, 95% CI: 1.1–1.6) were related to an increased likelihood of dental attendance. Education was not. Regarding 65–74 years old people, being female (OR: 1.3, 95% CI: 1.1–1.6) and having a high education (OR: 1.4, 95% CI: 1.1–1.7) were linked to increased odds of dental attendance. Oral health knowledge remained insignificant. | Location, income, public medical insurance coverage and private medical insurance were not significant among the 35–44–years old. Concerning 65–74 years old, higher income (e.g. third tercile: OR: 1.5, 95% CI: 1.2–2.0) and some kinds of public health insurance (e.g. UEBMI: OR: 1.7, 95% CI: 1.3–2.2) were associated with higher odds of dental visits. | Among 35–44 years old people, worse perceived oral health status (OR: 2.5, 95% CI: 2.0–3.2) and a worse carious status (OR: 1.5, 95% CI: 1.1–2.1) were related to higher chances of dental attendance. Among 65–74 years old people, poor perceived oral health (OR: 1.5, 95% CI: 1.2–2.0) was associated with a higher probability of dental attendance, carious status remained insignificant. |
| Zlotnick (2014) [62] | Israel | utilization of primary dental care (yes/no) | cross–sectional study | nationwide sample | n = 7068 2000 sample: 18–24: 7.9% 25–34: 21.4% 35–44: 19.4% 45–54: 18.8% 55–64: 14.5% ≥65: 18.0% 2010 sample: 18–24: 6.0% 25–34: 15.8% 35–44: 26.0% 45–54: 21.2% 55–64: 16.7% ≥65: 14.2% 2000 sample: 54.8% females 2010 sample: 53.2% females | According to logistic regression, in 2010, regarding Israeli–Jews, being born in Israel was associated with higher odds of dental attendance (OR: 1.5, 95% CI: 1.2–1.8). Among Israeli–Arabs, being older than 65 was related to a higher chance of dental attendance (OR: 0.5, 95% CI: 0.2–1.0). Age remained insignificant. | Among Israeli–Jews, having visited high school (OR: 1.6, 95% CI: 1.2–2.1), being employed (OR: 1.3, 95% CI: 1.1–1.6) having an over average income (OR: 1.9, 95% CI: 1.5–2.3) and flosses (OR: 1.8, 95% CI: 1.4–2.2) were associated with a higher probability of dental attendance. With regard to Israeli–Arabs, having visited high school (OR: 1.6, 95% CI: 1.2–2.2), an over average income (OR: 1.6, 95% CI: 1.3–2.1) and flosses (OR: 2.2, 95% CI: 1.5–3.1) were related to a higher likelihood of dental attendance. | Pain (OR: 0.5, 95% CI: 0.0–0.1), a normal BMI (OR: 1.3, 95% CI: 1.1–1.6) and being a smoker (OR: 0.7, 95% CI: 0.5–0.9) were significantly associated with dental attendance among Israeli–Jews. Among Israeli–Arabs, pain (OR: 0.4, 95% CI: 0.2–0.5) was related to lower chances of dental attendance. |
| Factors | Number of Studies | Positive Relationship | Negative Relationship | No Relationship |
|---|---|---|---|---|
| Predisposing characteristics | 10 | |||
| Age | 6 | 4 | 0 | 2 |
| Sex (female, ref.: male) | 7 | 2 | 0 | 5 |
| Enabling resources | 9 | |||
| Family income | 5 | 4 | 0 | 1 |
| Need factors | 8 | |||
| Oral health problem | 4 | 4 | 0 | 0 |
| Factors | Number of Studies | Positive Relationship | Negative Relationship | No Relationship |
|---|---|---|---|---|
| Predisposing characteristics | 31 | |||
| Age | 21 | 5 | 2 | 14 |
| Sex (female, ref.: male) | 24 | 11 | 6 | 7 |
| Education | 16 | 8 | 4 | 3 |
| Enabling resources | 30 | |||
| Income or wealth | 17 | 8 | 3 | 6 |
| Need factors | 29 | |||
| Oral health problems | 10 | 6 | 0 | 4 |
| First Author (Year) | Study Objective | Inclusion and Exclusion Criteria | Dental Visits Description | Data Source | Missing Data | Statistics | Consideration of Confounders | Sensitivity Analysis | Sample Size (Subgroup) | Demographics | Results Discussed with Respect to Other Studies | Results Discussed Regarding Generalizability | Limitations | Conclusion Supported by Data | Conflict of Interest/Funders |
|---|---|---|---|---|---|---|---|---|---|---|---|---|---|---|---|
| Al Agili (2020) [22] | X | X | X | X | X | X | X | X | X | X | X | X | X | X | X |
| Astrom (2013) [32] | X | X | X | X | X | X | X | X | X | X | X | X | X | X | X |
| Azañedo (2017) [23] | X | X | X | X | X | X | X | X | X | X | X | X | X | X | |
| Baldani (2011) [24] | X | X | X | X | X | X | X | X | X | X | X | X | X | X | |
| Baldani (2017) [25] | X | X | X | X | X | X | X | X | X | X | X | X | X | X | X |
| Born (2006) [33] | X | X | X | X | X | X | X | X | X | X | X | X | |||
| Branch (1981) [34] | X | X | X | X | X | X | X | X | X | X | X | X | X | X | |
| Brzoska (2017) [35] | X | X | X | X | X | X | X | X | X | X | X | X | X | X | |
| Chertok (2018) [26] | X | X | X | X | X | X | X | X | X | X | X | X | X | X | |
| Davidson (1997) [36] | X | X | X | X | X | X | X | X | X | X | X | X | X | X | |
| Davidson (1999) [37] | X | X | X | X | X | X | X | X | X | X | X | X | X | X | X |
| Ekanayake (2002) [38] | X | X | X | X | X | X | X | X | X | X | X | X | X | ||
| Evashwick (1984) [39] | X | X | X | X | X | X | X | X | X | X | X | X | X | X | X |
| Finlayson (2010) [40] | X | X | X | X | X | X | X | X | X | X | X | X | X | X | X |
| Fonseca (2020) [41] | X | X | X | X | X | X | X | X | X | X | X | X | X | ||
| Gao (2020) [27] | X | X | X | X | X | X | X | X | X | X | X | X | X | X | X |
| Herkrath (2018) [42] | X | X | X | X | X | X | X | X | X | X | X | X | X | X | |
| Herkrath (2020) [43] | X | X | X | X | X | X | X | X | X | X | X | X | X | X | X |
| Jang (2019) [44] | X | X | X | X | X | X | X | X | X | X | X | X | X | X | |
| Jönsson (2020) [63] | X | X | X | X | X | X | X | X | X | X | X | X | X | X | X |
| Kiyak (1987) [45] | X | X | X | X | X | X | X | X | X | X | X | X | X | X | |
| Lee (2020) [46] | X | X | X | X | X | X | X | X | X | X | X | X | X | X | X |
| Limpuangthip (2019) [47] | X | X | X | X | X | X | X | X | X | X | X | X | X | ||
| Lo (1998) [48] | X | X | X | X | X | X | X | X | X | X | X | X | X | X | X |
| Maffioletti (2020) [28] | X | X | X | X | X | X | X | X | X | X | X | X | X | X | |
| McKernan (2018) [49] | X | X | X | X | X | X | X | X | X | X | X | X | X | ||
| Muirhead (2009) [50] | X | X | X | X | X | X | X | X | X | X | X | X | |||
| Naavaal (2017) [29] | X | X | X | X | X | X | X | X | X | X | X | X | X | ||
| Nasir (2009) [51] | X | X | X | X | X | X | X | X | X | X | X | X | X | ||
| Pinto Rda (2014) [52] | X | X | X | X | X | X | X | X | X | X | X | X | X | X | |
| Rebelo Vieira (2019) [53] | X | X | X | X | X | X | X | X | X | X | X | X | X | X | X |
| Reisine (1987) [54] | X | X | X | X | X | X | X | X | X | X | X | X | X | ||
| Serna (2020) [55] | X | X | X | X | X | X | X | X | X | X | X | X | X | ||
| Silva (2013) [56] | X | X | X | X | X | X | X | X | X | X | X | X | X | ||
| Stapleton (2016) [57] | X | X | X | X | X | X | X | X | X | X | X | X | X | X | X |
| Suominen (2017) [58] | X | X | X | X | X | X | X | X | X | X | X | X | X | X | |
| Tennstedt (1994) [59] | X | X | X | X | X | X | X | X | X | X | X | X | X | X | |
| Varenne (2006) [60] | X | X | X | X | X | X | X | X | X | X | X | X | X | X | |
| Vingilis (2007) [30] | X | X | X | X | X | X | X | X | X | X | X | X | X | X | X |
| Xu (2018) [31] | X | X | X | X | X | X | X | X | X | X | X | X | X | X | |
| Xu (2020) [61] | X | X | X | X | X | X | X | X | X | X | X | X | X | X | X |
| Zlotnick (2014) [62] | X | X | X | X | X | X | X | X | X | X | X | X | X | X | |
| 100 | 100 | 100 | 100 | 49.5 | 100 | 100 | 85.7 | 100 | 100 | 100 | 100 | 97.6 | 100 | 81.0 |
Publisher’s Note: MDPI stays neutral with regard to jurisdictional claims in published maps and institutional affiliations. |
© 2021 by the authors. Licensee MDPI, Basel, Switzerland. This article is an open access article distributed under the terms and conditions of the Creative Commons Attribution (CC BY) license (http://creativecommons.org/licenses/by/4.0/).
Share and Cite
Hajek, A.; Kretzler, B.; König, H.-H. Factors Associated with Dental Service Use Based on the Andersen Model: A Systematic Review. Int. J. Environ. Res. Public Health 2021, 18, 2491. https://0-doi-org.brum.beds.ac.uk/10.3390/ijerph18052491
Hajek A, Kretzler B, König H-H. Factors Associated with Dental Service Use Based on the Andersen Model: A Systematic Review. International Journal of Environmental Research and Public Health. 2021; 18(5):2491. https://0-doi-org.brum.beds.ac.uk/10.3390/ijerph18052491
Chicago/Turabian StyleHajek, André, Benedikt Kretzler, and Hans-Helmut König. 2021. "Factors Associated with Dental Service Use Based on the Andersen Model: A Systematic Review" International Journal of Environmental Research and Public Health 18, no. 5: 2491. https://0-doi-org.brum.beds.ac.uk/10.3390/ijerph18052491