Article

Insights into Vibrio parahaemolyticus CHN25 Response to Artificial Gastric Fluid Stress by Transcriptomic Analysis

1
Key Laboratory of Quality and Safety Risk Assessment for Aquatic Products on Storage and Preservation (Shanghai), China Ministry of Agriculture College of Food Science and Technology, Shanghai Ocean University, 999 Hu Cheng Huan Road, Shanghai 201306, China
2
College of Information Technology, Shanghai Ocean University, 999 Hu Cheng Huan Road, Shanghai 201306, China
3
Archaea Centre, Department of Biology, University of Copenhagen, Ole Maaløes Vej 5, DK2200 Copenhagen N, Denmark
*
Author to whom correspondence should be addressed.
These authors contributed equally to this work.
Int. J. Mol. Sci. 2014, 15(12), 22539-22562; https://0-doi-org.brum.beds.ac.uk/10.3390/ijms151222539
Submission received: 30 September 2014 / Revised: 24 November 2014 / Accepted: 1 December 2014 / Published: 5 December 2014
(This article belongs to the Section Biochemistry)

Abstract

:
Vibrio parahaemolyticus is the causative agent of food-borne gastroenteritis disease. Once consumed, human acid gastric fluid is perhaps one of the most important environmental stresses imposed on the bacterium. Herein, for the first time, we investigated Vibrio parahaemolyticus CHN25 response to artificial gastric fluid (AGF) stress by transcriptomic analysis. The bacterium at logarithmic growth phase (LGP) displayed lower survival rates than that at stationary growth phase (SGP) under a sub-lethal acid condition (pH 4.9). Transcriptome data revealed that 11.6% of the expressed genes in Vibrio parahaemolyticus CHN25 was up-regulated in LGP cells after exposed to AGF (pH 4.9) for 30 min, including those involved in sugar transport, nitrogen metabolism, energy production and protein biosynthesis, whereas 14.0% of the genes was down-regulated, such as ATP-binding cassette (ABC) transporter and flagellar biosynthesis genes. In contrast, the AGF stress only elicited 3.4% of the genes from SGP cells, the majority of which were attenuated in expression. Moreover, the number of expressed regulator genes was also substantially reduced in SGP cells. Comparison of transcriptome profiles further revealed forty-one growth-phase independent genes in the AGF stress, however, half of which displayed distinct expression features between the two growth phases. Vibrio parahaemolyticus seemed to have evolved a number of molecular strategies for coping with the acid stress. The data here will facilitate future studies for environmental stresses and pathogenicity of the leading seafood-borne pathogen worldwide.

1. Introduction

Vibrio parahaemolyticus, autochthonous to estuarine, marine, and coastal environments worldwide, is the causative agent of food-borne gastroenteritis disease and even death [1]. V. parahaemolyticus was first identified in 1950 in Osaka, Japan, where an outbreak of acute gastroenteritis following the consumption of semidried juvenile sardines sickened 272 and killed 20 individuals [2]. To date, more than eighty V. parahaemolyticus serotypes have been described on the basis of the somatic (O) and capsular (K) antigens [1]. Epidemic V. parahaemolyticus O3:K6 emerged in Calcutta, India in 1996 [3], was subsequently isolated in many Asian countries, and recently reported in Europe, Africa and America [1,4], arguing a pandemic of V. parahaemolyticus worldwide.
V. parahaemolyticus is a Gram-negative bacterium that is able to grow at pH 5–11, 1%–7% NaCl, 22–42 °C [5,6]. Once consumed with raw, undercooked or mishandled seafood, V. parahaemolyticus is challenged with the extremely low pH environment in the human stomach (pH of the human stomach normally ranges from 1–3 but can rise above 6.0 after food consumption) [7,8], before reaching the human gastrointestinal tract where it elicits gastroenteritis [9]. The molecular mechanisms of acid stress response in some Gram positive and Gram-negative bacteria (e.g., Escherichia coli, Salmonella enterica) have been reported, such as the pumping out of protons, production of ammonia and proton-consuming decarboxylation reactions, as well as modifications of the lipid content in the membrane (for a review, see [10]).
To date, the general stress response of Vibrionaceae-related bacteria under detrimental acid conditions remains largely unknown, despite their great significance in human health and economy in aquaculture industry. Some studies have revealed that Vibrios have a similar lysine-decarboxylation pathway in response to acid stress as E. coli, which consists of a lysine decarboxylase (CadA) and a lysine/cadaverine antiporter (CadB). The cadA and cadB genes were transcribed at low constitutive levels in an acid-independent manner and induced during infection and acid tolerance in Vibrio cholerae [11], and the genes were activated sequentially by two transcriptional regulators AphB and CadC of Vibrio vulnifus in acid stress [12]. Short preadaptation to a 6% salt concentration increased survival of the wild-type strain but not that of a cadA mutant of V. parahaemolyticus under lethal acid conditions [13]. Previous research on specific genes also revealed a few regulatory proteins (e.g., ToxRS and OmpU) involved in V. parahaemolyticus response to acid, bile salts, and sodium dodecyl sulfate stresses (e.g., [14]). In this study, for the first time, we investigated global-level gene expression profiles of V. parahaemolyticus CHN25 in response to artificial gastric fluid (AGF) stress by using full-genome microarray analysis. The information will facilitate our better understanding of molecular mechanisms underlying environmental stresses and pathogenicity of the leading seafood-borne pathogen worldwide.

2. Results and Discussion

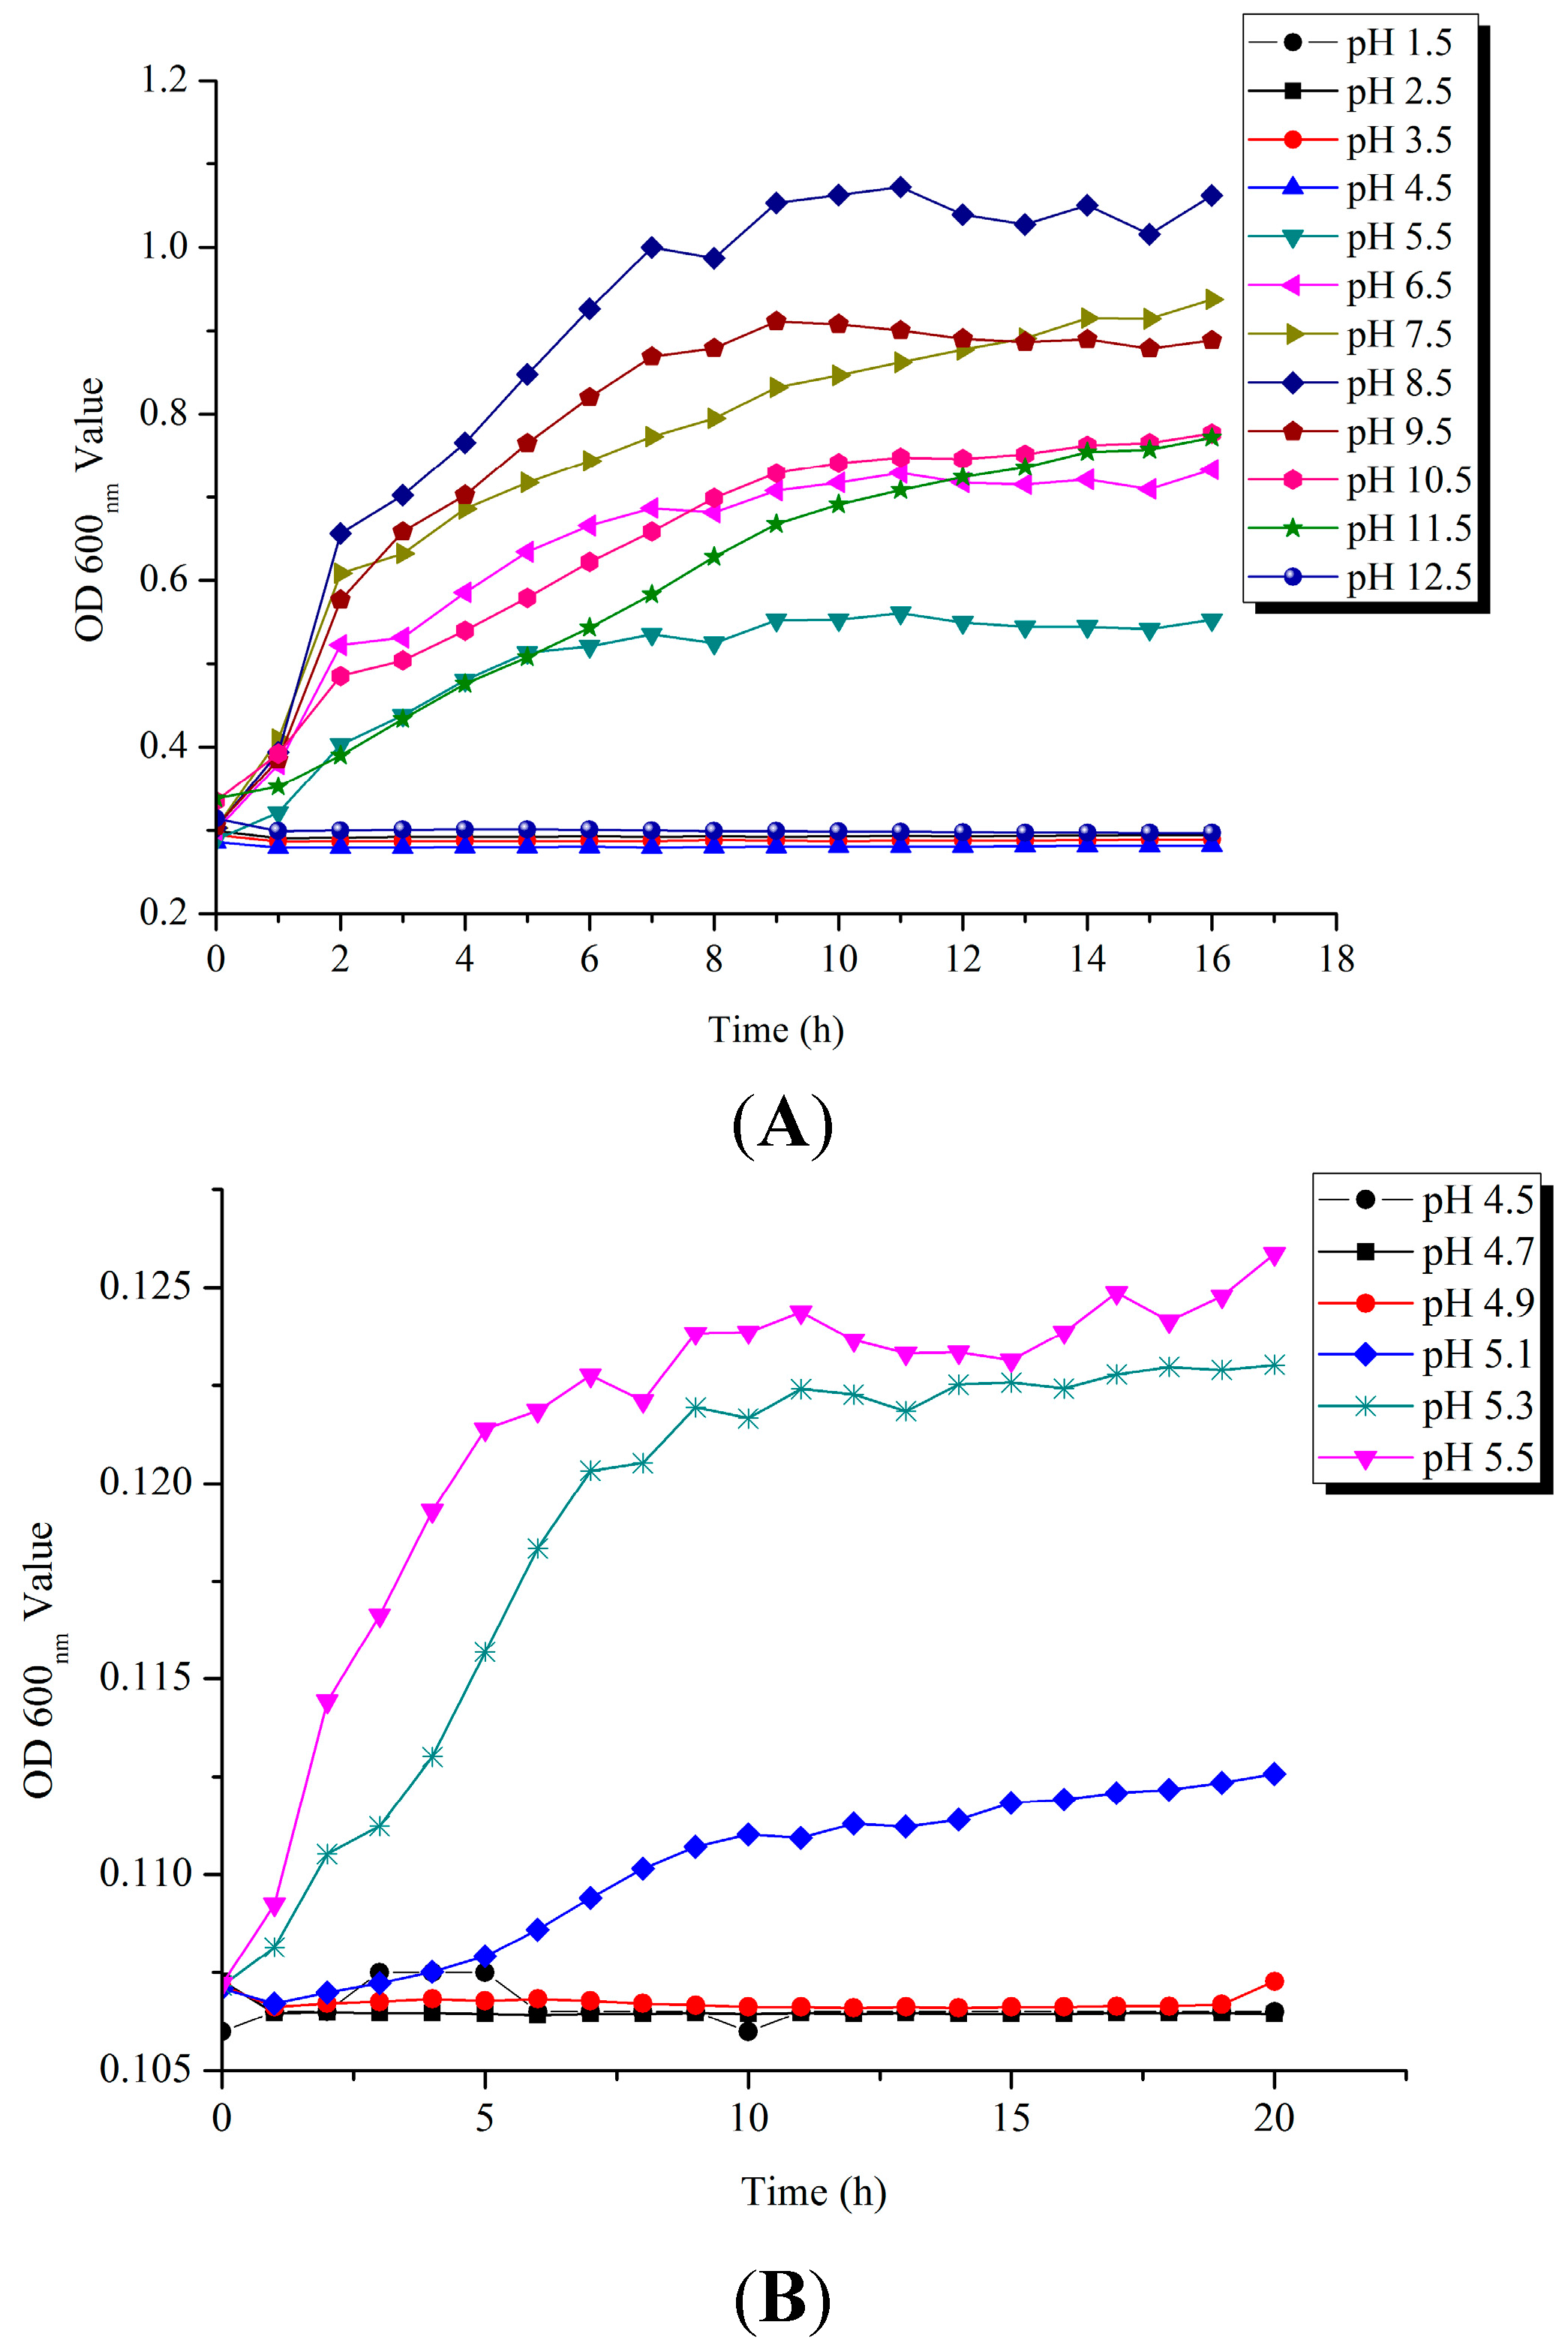
2.1. Survival of V. parahaemolyticus CHN25 under Acid pH Conditions

To gain an insight into the V. parahaemolyticus CHN25 tolerance to acid conditions, we determined growth curves of the bacterium, recently isolated and identified by Song et al. [15], in Tryptic Soy Broth (TSB) with the pH range of 1.5–12.5 at 37 °C. As illustrated in Figure 1A, V. parahaemolyticus CHN25 grows at pH 5.5–11.5, optimally at pH 8.5, demonstrating it is a moderately basophilic bacterium, consistent with previous studies (e.g., [5]). No cell growth was observed under more acidic conditions with pH values lower than 4.5. More detailed tests on the pH range between 4.5 and 5.5 revealed that V. parahaemolyticus CHN25 was able to grow at pH 5.0, but not at pH ≤ 4.9 (Figure 1B), suggesting the latter being a sub-lethal pH condition for V. parahaemolyticus CHN25.
Figure 1. Survival of V. parahaemolyticus CHN25 under different pH conditions. The bacterium was grown in TSB liquid medium at pH 1.5–12.5 (A) and pH 4.5–5.5 (B), 37 °C, and growth curves were determined using a BioScreener.
Ijms 15 22539 g001

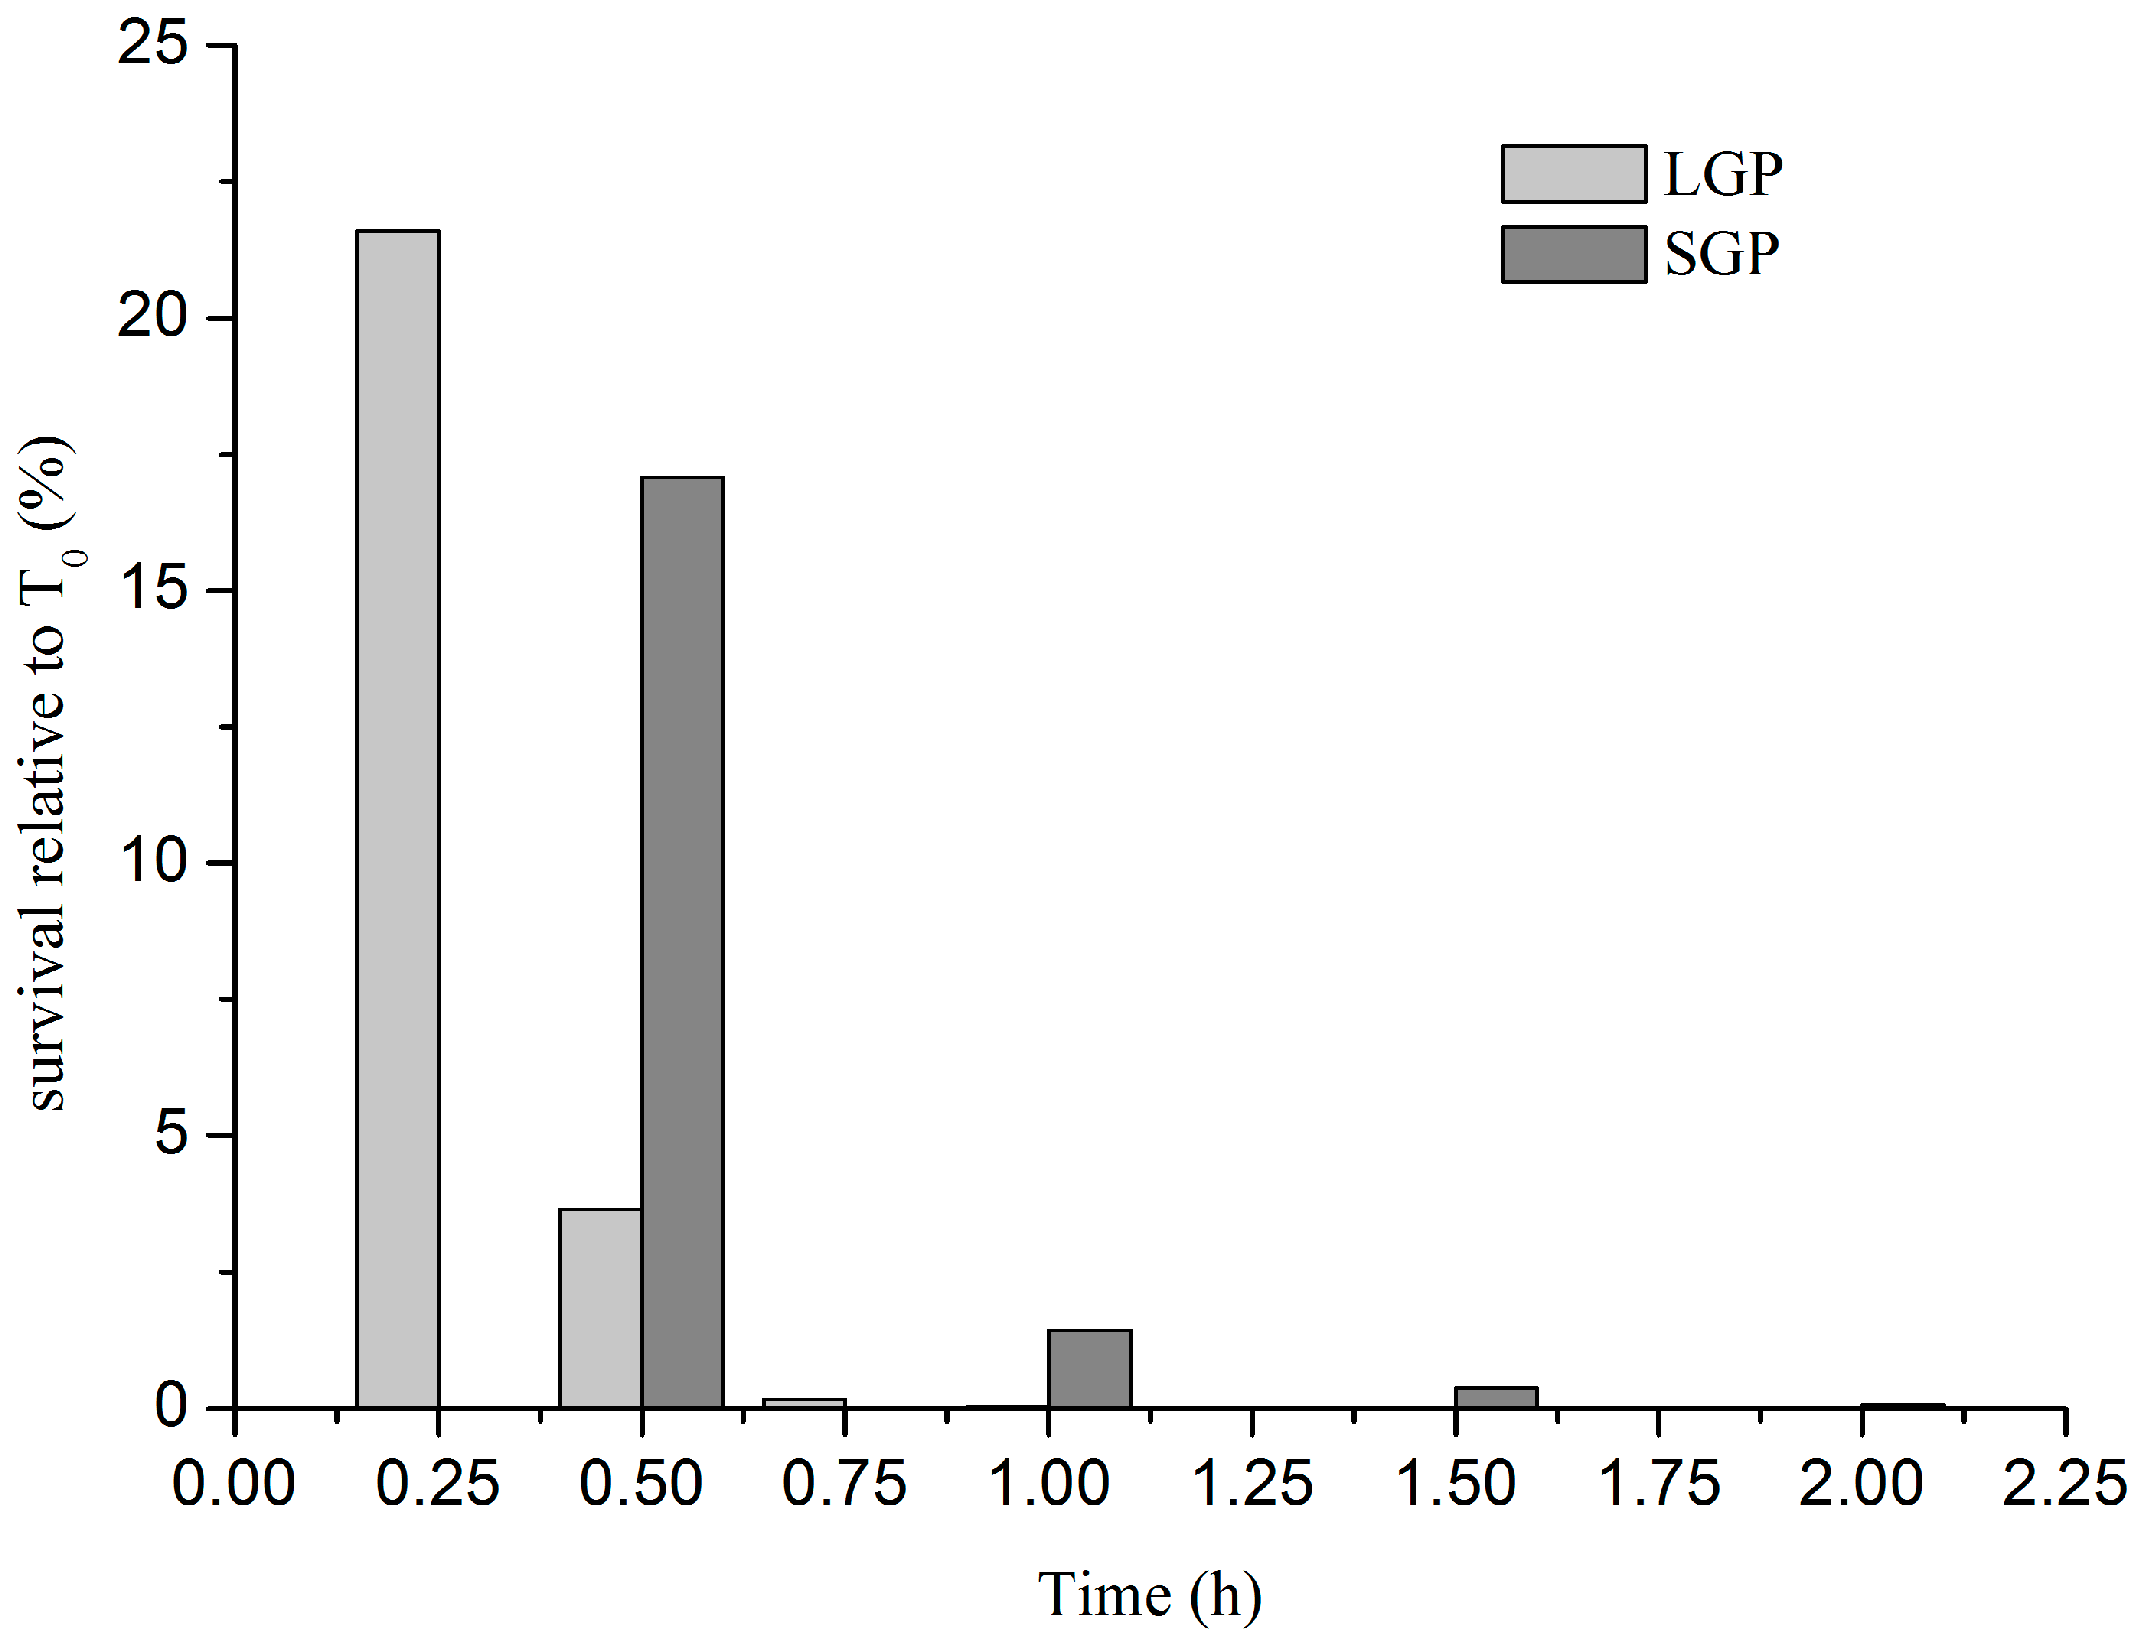
2.2. Tolerance of V. parahaemolyticus CHN25 at Logarithmic Growth Phase (LGP) and Stationary Growth Phase (SGP) to the AGF (Artificial Gastric Fluid) Stress

To investigate the possible effects of the human acidic stomach environment in vivo on V. parahaemolyticus CHN25 survival, we utilized the AGF (pH 4.9) to treat the bacterium in vitro grown to LGP and SGP in TSB (pH 8.5) at 37 °C, respectively. As shown in Figure 2, V. parahaemolyticus CHN25 cells at LGP displayed relatively lower survival rates when compared to the bacterial cells at SGP. Treating the LGP cells for 15 min resulted in a significantly decreased survival rate (21.6%), and further elevating exposure time (≥30 min) yielded a steep reduction in the survival (≤3.7%). For the SGP cells, the relative survival rate was 17.0% after exposed to AGF for 30 min, which was 4.6-fold higher than that for LGP cells. Nevertheless, the SGP cells also showed considerable loss in culturability after 30 min exposure to AGF. Thus, we extracted total RNA of the samples at both growth phases in TSB after treated for 30 min with AGF (pH 4.9) for the further transcriptomic analysis (see below). The samples cultured under the same condition without the AGF treatment were used as a control, respectively.
Figure 2. Tolerance of V. parahaemolyticus CHN25 at LGP (logarithmic growth phase) and SGP (stationary growth phase) to the AGF (artificial gastric fluid) (pH 4.9) stress.
Ijms 15 22539 g002

2.3. Transcriptome Profiles of V. parahaemolyticus CHN25 in the Response to the AGF Stress

We determined the global-level gene expression profiles of V. parahaemolyticus CHN25 after the AGF treatment by using full-genome microarray chips (see the Experimental Section). This analysis revealed a considerable number of differentially expressed genes involved in the response to acid stress in the bacterium. A total of 1210 genes were significantly changed when V. parahaemolyticus CHN25 grown to LGP in the AGF stress, which represented approximately 25.6% of the expressed genes in the bacterium. Of these, a total of 547 genes showed higher transcriptional levels (change ≥ 2.0-fold), whereas the expression of a total of 663 genes were down-regulated (change ≤ 0.5-fold). All the genes were grouped into ninety four gene functional catalogues identified in the Kyoto Encyclopedia of Genes and Genomes (KEGG) database (data not shown). When V. parahaemolyticus CHN25 grown to SGP, the AGF stress only elicited 160 differentially expressed genes, accounting for 3.4% of the expressed genes in the bacterium, which consisted of 52 up-regulated and 108 down-regulated genes falling into twenty two gene functional catalogues (data not shown). A complete list of the differentially expressed genes at both growth phases is available in NCBI Gene Expression Omnibus under the accession number GSE63167, of which 10.9% were annotated as hypothetical proteins with currently unknown functions in the public databases. To validate the transcriptome data, we chose eleven representative genes for quantitative real-time reverse transcription PCR (qRT-PCR) analysis. The resulting data were correlated with those yielded from the transcriptomic analysis (Table S1).
Consistent with previous studies (e.g., [16]), the majority of the expressed genes remained unaltered in SGP cells in the AGF stress, in which substrate metabolism, energy production, and cell division were turned down. Nevertheless, the transcriptome profile at this growth phase indeed provided a comparative mode to investigate growth-phase independent acid stress response in V. parahaemolyticus CHN25. Comparison of the transcriptome data revealed forty-one differentially expressed genes that were synchronously elicited from both LGP and SGP cells in the AGF stress, however, approximately half of which coded for hypothetical proteins. Of these, interestingly, almost half displayed different expression features between the two growth phases, e.g., the genes encoding the fructose-specific Enzyme IIABC subunits and prophage-associated proteins (see below). Overall, our data highlighted characteristic and distinct gene expression patterns of V. parahaemolyticus CHN25 with considerable variation over growth phases in the AGF stress.

2.4. Major Metabolic Pathways Involved in the Response of V. parahaemolyticus CHN25 to the AGF Stress

2.4.1. Major Metabolic Pathways Involved in V. parahaemolyticus CHN25 Cells at LGP in the AGF Stress

Based on gene set enrichment analysis (GSEA) of the transcriptome data against the KEGG database, nine significantly affected metabolic pathways with enrichment test p value below 0.05 were identified in LGP cells after exposed to the AGF stress (Table 1). They included the phosphotransferase system (PTS); galactose, nitrogen, fructose and mannose, and pyruvate metabolisms; ribosome and aminoacyl-tRNA biosynthesis; glycolysis/gluconeogenesis; and oxidative phosphorylation. The significantly changed metabolic pathways have also been reported in some other bacteria under acid conditions (e.g., [16,17,18,19,20]).
The phosphoenolpyruvate-dependent PTS is known as a major sugar transport multicomponent system in bacteria, by which many sugars are transported into bacteria, concomitantly phosphorylated, and then fed into glycolysis [21]. In this study, thirteen genes in the PTS were significantly up-regulated in LGP cells in the AGF stress, which coded for glucose-, fructose-, mannitol-, cellobiose-, ascorbate-, and N-acetylglucosamine-specific enzyme II components. One of these genes, VPA1424 encoding fructose-specific enzyme II ABC subunits, was strongly up-regulated for 27.97-fold in mRNA level, suggesting extremely active transport and utilization of the fructose in the AGF stress. In addition, interestingly, two genes encoding glucose-specific enzyme II BC subunits were identified in V. parahaemolyticus CHN25, one of which (VP2046) was induced with a minor increase of 2.62-fold, whereas the other (VPA1667) strikingly displayed a 25-fold decrease in expression, implying possible unknown regulation mechanisms underlying the transport of the key sugar in central carbohydrate metabolism in the AGF stress.
Table 1. Major metabolic pathways and cellular functions involved in the response of V. parahaemolyticus CHN25 at LGP and SGP to the AGF (pH 4.9) stress for 30 min.
Metabolic Pathway/Cellular FunctionLocus/Gene in V. parahaemolyticusFold ChangeDescription of Encoded Protein
RIMD2210633CHN25
LGP cells
Phosphotransferase system (PTS)VPA1667Chn25A_15550.0384Glucose-specific IIBC component
VPA1424Chn25A_131227.9696Fructose-specific IIABC component
VPA1422Chn25A_13102.2688Nitrogen regulatory IIA component
VPA1421Chn25A_13092.3425Fructose-specific IIB component
VPA1420Chn25A_13082.8724Fructose-specific IIABC component
VPA0501Chn25A_11962.6299Mannitol-specific enzyme II component
VPA0500Chn25A_11972.6362Mannitol-specific enzyme II component
VPA0297Chn25A_03028.029fructose-specific IIBC component
VPA0298Chn25A_03032.8846Fructose-specific IIA component
VPA0231Chn25A_02322.0079Phosphotransferase enzyme II, A component
VPA0230Chn25A_02315.501Putative sugar phosphotransferase component II B
VP2637Chn25_25662.2518Cellobiose-specific IIB component
VP2636Chn25_25652.6756Cellobiose-specific IIC component
VP2046Chn25_19322.6196Glucose-specific IIBC components
VP0831Chn25_08264.8477N-acetylglucosamine-specific IIABC component
VP0370Chn25_03562.7113Mannitol-specific IIABC component
VPA0229 (ulaA)Chn25A_02306.4614Ascorbate-specific enzyme IIC
VP0366Chn25_03523.2996Putative PTS, enzyme I
Galactose metabolismVPA0879Chn25A_08280.3848UDP-glucose 4-epimerase
VP2400Chn25_22644.517UDP-glucose 4-epimerase
VP2400Chn25A_10713.5838UDP-glucose 4-epimerase
VP2399Chn25A_10704.4699Galactose-1-phosphate uridylyltransferase
VP2398Chn25_22623.8991Galactokinase
VP2398Chn25A_10692.497Galactokinase
VP2077Chn25_19632.0087Maltodextrin glucosidase
Galactose metabolismVP0839Chn25_08342.4836Phosphoglucomutase
VP2403 (ebgA)Chn25_22662.4115Cryptic beta-d-galactosidase subunit alpha
VP2404 (ebgC)Chn25_22672.9965Cryptic beta-d-galactosidase subunit beta
VP2397 (galM)Chn25_22612.1978Aldose 1-epimerase
VP2855 (pfkA)Chn25_27760.31956-phosphofructokinase
Ribosome biosynthesisVP2772Chn25_26983.067330S ribosomal protein S7
VP1210Chn25_12172.632950S ribosomal protein L25
VP2925 (rplA)Chn25_28322.332950S ribosomal protein L1
VP2926 (rplK)Chn25_28332.186650S ribosomal protein L11
VP2923 (rplL)Chn25_28302.737850S ribosomal protein L7/L12
VP0264 (rplP)Chn25_02552.224250S ribosomal protein L16
VP1282 (rplT)Chn25_12896.511350S ribosomal protein L20
VP0262 (rplV)Chn25_02532.518150S ribosomal protein L22
VP0259 (rplW)Chn25_02502.271950S ribosomal protein L23
VP0329 (rpmA)Chn25_03175.573850S ribosomal protein L27
VP0185 (rpmB)Chn25_01812.739250S ribosomal protein L28
VP0265 (rpmC)Chn25_02562.532350S ribosomal protein L29
VP0255 (rpmE)Chn25_02465.019350S ribosomal protein L31
VP0186 (rpmG)Chn25_01827.219250S ribosomal protein L33
VP2030 (rpsA)Chn25_19183.986630S ribosomal protein S1
VP0263 (rpsC)Chn25_02542.607430S ribosomal protein S3
VP2740 (rpsF)Chn25_26682.81830S ribosomal protein S6
VP0439 (rpsI)Chn25_03982.145530S ribosomal protein S9
VP2453 (rpsO)Chn25_23913.722130S ribosomal protein S15
VP0266Chn25_02573.3225Ribosomal protein S17
VP0531 (rpsT)Chn25_04816.12730S ribosomal protein S20
Fructose and mannose metabolismVPA1425Chn25A_131323.9303Mannose-6-phosphate isomerase
VP2599Chn25_25280.2922Fructose-bisphosphate aldolase
VP2488Chn25_24264.6724Putative phosphoglucomutase/phosphomannomutase
Amino sugar and nucleotide sugar metabolismVP0543Chn25_04932.2962N-acetylmuramic acid-6-phosphate etherase
VPA0833 (glgC)Chn25A_07800.4431Glucose-1-phosphate adenylyltransferase
VP1023 (glgC)Chn25_10472.336Glucose-1-phosphate adenylyltransferase
VP0829 (nagA)Chn25_08252.027N-acetylglucosamine-6-phosphate deacetylase
VPA0038 (nagB)Chn25A_00332.5647Glucosamine-6-phosphate deaminase
Glycolysis/gluconeogenesisVPA0566Chn25A_11365.8196Alcohol dehydrogenase
VPA0180Chn25A_01822.2002Phospho-beta-glucosidase B
VP2157Chn25_20264.6439Glyceraldehyde-3-phosphate dehydrogenase
Aminoacyl-tRNA biosynthesisVP2470Chn25_24072.0793Tyrosyl-tRNA synthetase
VP1280Chn25_12860.4891Threonyl-tRNA synthetase
VP2548 (alaS)Chn25_24822.6177Alanyl-tRNA synthetase
VP0861 (argS)Chn25_08542.7778Arginyl-tRNA synthetase
VP1150 (cysS)Chn25_11592.0297Cysteinyl-tRNA synthetase
VP0021 (glyS)Chn25_00103.0031Glycyl-tRNA synthetase subunit beta
VP0534 (ileS)Chn25_04842.3183Isoleucyl-tRNA synthetase
VP0727 (leuS)Chn25_06852.1816Leucyl-tRNA synthetase
VP2069 (metG)Chn25_19552.2087Methionyl-tRNA synthetase
VP1291 (pheT)Chn25_12985.4809Phenylalanyl-tRNA synthetase subunit beta
VP2646 (valS)Chn25_25752.077Valyl-tRNA synthetase
Pyruvate metabolismVPA1567Chn25A_14562.1699Putative pyruvate formate lyase
VPA1123Chn25A_05600.4528Putative acyl-CoA thiolase
VPA0823Chn25A_07712.0537Pyruvate kinase
VPA0646Chn25A_10100.3383Putative pyruvate dehydrogenase E1 component, beta subunit
Pyruvate metabolismVPA0620Chn25A_10340.4695Putative acyl-CoA thiolase
VPA0611Chn25A_10910.3706Acetate kinase
VPA0372Chn25A_03673.9537Phosphoenolpyruvate synthase
VPA0144Chn25A_01450.4364d-lactate dehydrogenase
VP2881Chn25_28013.0293Acetyl-CoA carboxylase, biotin carboxylase subunit
VP2878Chn25_27982.514Acetyl-CoA synthetase
VP2545Chn25_24792.1607Oxaloacetate decarboxylase subunit gamma
VP2517Chn25_24513.4256Dihydrolipoamide dehydrogenase
VP2039Chn25_19272.6156Pyruvate kinase II
VP1627Chn25_16203.6175Acylphosphatase
VP1258Chn25_12642.6731Malate dehydrogenase
VP0325Chn25_03133.5504Malate dehydrogenase
VP2519 (aceE)Chn25_24532.132Pyruvate dehydrogenase subunit E1
VPA1499 (lldD)Chn25A_13898.5267l-lactate dehydrogenase
Oxidative phosphorylationVPA0631Chn25A_10230.464Putative protoheme IX farnesyltransferase
VPA0544Chn25A_11560.4221Protoheme IX farnesyltransferase
VP2841Chn25_27632.102Fumarate reductase iron-sulfur subunit
VPA0539Chn25A_11610.2437Cytochrome c oxidase, subunit III
VP1543Chn25_15212.2303Cytochrome c oxidase, subunit CcoO
VP1541Chn25_15192.2683Cytochrome c oxidase, subunit CcoP
VP1054Chn25_10742.0957Cytochrome d ubiquinol oxidase, subunit II
VP1053Chn25_10732.3358Cytochrome d ubiquinol oxidase, subunit I
VPA0628Chn25A_10262.0087Cytochrome o ubiquinol oxidase, subunit I
VP1165Chn25_11742.4205Putative manganese-dependent inorganic pyrophosphatase
VP0443Chn25_04012.4995Ubiquinol-cytochrome c reductase, cytochrome c1
VP0442Chn25_04002.0404Ubiquinol-cytochrome c reductase, cytochrome b
Oxidative phosphorylationVP3076Chn25_29760.4698F0F1 ATP synthase subunit I
VP3068 (atpC)Chn25_29683.0803F0F1 ATP synthase subunit epsilon
VP0844Chn25_08392.0288Succinate dehydrogenase, hydrophobic membrane anchor protein
VP0843 (sdhC)Chn25_08382.1718Succinate dehydrogenase cytochrome b556 large membrane subunit
Ciliary or bacterial-type flagellar motilityVP0772 (flgA)Chn25_07670.2303Flagellar basal body P-ring biosynthesis protein FlgA
VP2235 (flhA)Chn25_21020.4555Flagellar biosynthesis protein FlhA
VP2236 (flhB)Chn25_21030.463Flagellar biosynthesis protein FlhB
VP2255Chn25_21220.436Polar flagellar rod protein FlaI
VP2256 (fliD)Chn25_21230.4776Flagellar capping protein
VP2257Chn25_21242.0357Flagellar protein FlaG
VP2261Chn25_21270.2235Flagellin
VPA0263Chn25A_02640.3335Flagellar basal body P-ring biosynthesis protein
Polyamine transportVP1332Chn25_13340.4055Binding protein component of ABC transporter
VP1336Chn25_13370.3839ABC transporter ATP-binding protein
VP1337Chn25_13380.419Putative permease of ABC transporter
VP1338Chn25_13390.371ABC transporter permease
d-ribose transportVPA1087Chn25A_059312.5376d-ribose pyranase
VPA1086Chn25A_059414.963d-ribose transporter ATP binding protein
VPA1086 (rbsC)Chn25A_05958.678Ribose ABC transporter permease protein
VPA1084Chn25A_05967.7049d-ribose transporter subunit RbsB
Maltose transportVPA1399 (malG)Chn25A_10762.0352Maltose transporter permease
VPA1400 (malF)Chn25A_10772.8009Maltose transporter membrane protein
VPA1401(malE)Chn25A_10783.0226Maltose ABC transporter periplasmic protein
VPA1402Chn25A_10792.561Maltose/maltodextrin transporter ATP-binding protein
VPA1644 (lamB)Chn25A_15323.35Maltoporin
SGP cells
Pyrimidine and purine metabolismVPA1243Chn25A_04420.491Cytosine deaminase
VP0524 (thyA)Chn25_04762.1909Thymidylate synthase
VP1760Chn25_13872.1851Putative adenylate cyclase
VPA1159Chn25A_05270.4775Guanosine 5'-monophosphate oxidoreductase
VPA0855Chn25A_08010.3912Putative 5'-nucleotidase
VPA0074Chn25A_00692.3652Putative DNA polymerase III, epsilon subunit
VP2303 (dnaE)Chn25_21690.4586DNA polymerase III subunit alpha
Iron ion transportVP2491Chn25_24290.4159Iron (III) ABC transporter, periplasmic Iron-compound-binding protein
VPA0310Chn25A_03162.1424Hypothetical protein
PTSVP2674Chn25_26022.2237Phosphocarrier protein NPr
VPA0297Chn25A_03020.4786PTS system, fructose-specific IIBC component
VPA0298Chn25A_03030.4004PTS system, fructose-specific IIA component
VPA1424Chn25A_13120.3946PTS system, fructose-specific IIABC component
Quaternary ammonium group transportVPA1111Chn25A_05710.453Putative glycine betaine-binding ABC transporter
Aromatic compound catabolic processVP0240Chn25_02312.2949Putative 5-carboxymethyl-2-hydroxymuconate delta isomerase
Glycine betaine biosynthetic process from cholineVPA1114Chn25A_05680.4435Transcriptional regulator BetI
VPA1112Chn25A_05700.3776Choline dehydrogenase
PilusVPA0725Chn25A_06703.0408Putative TadB
ATP bindingVPA0380Chn25A_03750.481Hypothetical protein
VPA1302Chn25A_04000.2424Hypothetical protein
Outer membrane-bounded periplasmic space and nitrite reductase activityVP1928Chn25_18162.0205Cytochrome c nitrite reductase pentaheme subunit
CytolysisVP3048Chn25_29472.0825Putative hemolysin III
Betaine-aldehyde dehydrogenase activityVPA1113Chn25A_05690.3189Betaine aldehyde dehydrogenase
Phosphoglycerate transportVPA0825Chn25A_07730.3614Putative phosphoglycerate transport regulatory protein PgtC
NADPH dehydrogenase activityVPA0465Chn25A_12332.0487Putative NAD(P)H oxidoreductase
Regulation of DNA repairVP2945Chn25_28522.205LexA repressor
3-isopropylmalate dehydratase complex and 3-isopropylmalate dehydratase activityVP0343Chn25_03312.0142Isopropylmalate isomerase large subunit
Triglyceride lipase activityVP1181Chn25_11902.2305lactonizing lipase
Lactoylglutathione lyase activityVP2166Chn25_20340.3883Putative lactoylglutathione lyase
Anaerobic electron transport chain and nitrogen compound metabolic processVP1928Chn25_18162.0205Cytochrome c nitrite reductase pentaheme subunit
Alkaline phosphatase activityVP2163Chn25_20320.4035Alkaline phosphatase
Zinc ion transmembrane transporter activityVPA1287Chn25A_04160.2585Putative transporter
Transmembrane transportVP1359Chn25_17452.0727Hypothetical protein
The Leloir pathway for the catabolism of d-galactose was positively affected in the AGF stress, which produces UDP-glucose, an important building block for glycogen biosynthesis. Consistent with previous research (e.g., [16]), the genes encoding the pathway components were significantly up-regulated in the AGF stress (Table 1).
Approximately half of the genes linked to nitrogen metabolism were significantly changed by the AGF stress, the majority of which showed higher transcriptional levels. Interestingly, four enzymes: 2-nitropropane dioxygenase (VPA0296) catalyzing nitroalkane to nitrite; NrfBD (VP0987) and NrfAH (VP1989) involved in the conversion of nitrite to ammonia in dissimilar nitrate reduction; and nitrite reductase large subunit (VPA0987) involved in the catalysis of nitrite to ammonia, were significantly up-regulated. Moreover, the gene encoding a glutamate dehydrogenase (VP1602) that catalyzes l-glutamate to ammonia was up-regulated as well, suggesting possibly increased amount of ammonia in LGP cells that likely combined with intracellular protons to yield the ammonium ion and alkalized intracellular environment in the AGF stress [10]. On the other hand, the gene (VP0483) involved in the conversions of ammonia to l-glutamine and to l-glutamate was significantly down-regulated, implying perhaps attenuated ammonia utilization in the AGF stress. In addition, a carbonic anhydrase (VP2514) that converts carbon dioxide to HCO3 was notably down-regulated (5.27-fold), suggesting the repressed production of electrically negative acid ions in LGP cells, which may facilitate to maintain intracellular pH homeostasis in the AGF stress. To our knowledge, no linking to acid stress of the latter two genes has been described previously.
Bacterial ribosome consists of two major subunits, each of which is composed of a variety of proteins. Inconsistent with some previous studies showing down-regulated ribosomal genes under acidic conditions (e.g., [20]), in this study, twelve genes encoding the large 50S ribosomal subunit component were up-regulated (2.19–7.22-fold) in LGP cells after exposed to the AGF stress. Similarly, seven components of the small 30S subunit were also up-regulated in expression (2.15–6.13-fold) (Table 1). Despite a highly conserved translational machinery with invariable rRNA and protein components, the formation of distinct ribosomal subpopulations has been reported in bacteria when encountered adverse conditions, e.g., the S21, L2 and L20 subpopulations at pH 4.5 urea condition in E. coli [22,23]. In this study, L20 and some other components (S20, L27, L31 and L33) were highly up-regulated for more than 5.0-fold in the AGF stress. It will be interesting to elucidate biological significance of the enhanced ribosome synthesis and possible ribosomal subpopulations in V. parahaemolyticus CHN25 to the AGF stress in future research.
In the fructose and mannose metabolisms, two enzymes, bifunctional phosphomannomutase/phosphoglucomutase (VPA2488) and mannose-6-phosphate isomerase (VPA1425) that functioned in the conversions of d-mannose-1 phosphate to β-d-fructose-6 phosphate, were up-regulated in LGP cells. Interestingly, the latter exhibited a 23.93-fold enhanced expression, which reinforced the extremely active fructose metabolism in the AGF stress. All the differentially expressed genes in aminoacyl-tRNA biosynthesis were also up-regulated (2.01–5.48-fold), except the gene (VP1289) with a minor decrease (Table 1).
In the glycolysis/gluconeogenesis, the pfkA (VP2855) gene encoding a 6-phosphofructokinase that catalyzes the second rate-limiting reaction in glycolysis was down-regulated. The following reaction catalyzed by a fructose-bisphosphate aldolase (VP2599) was repressed as well. In contrast, three genes (VP2157, VPA0823, VP2039) in the pathway were up-regulated, the latter two of which coded for pyruvate kinases catalyzing the last rate-limiting reaction in glycolysis, suggesting possibly active pyruvate metabolism in LGP cells in the AGF stress.
Approximately 20 genes linked to the pyruvate metabolism were significantly elicited from LGP cells by the AGF stress. Of these, five genes were down-regulated, and the others were up-regulated. Interestingly, the lldD (VPA1499) gene encoding an l-lactate dehydrogenenase displayed an increase of 8.53-fold in expression, which degrades l-lactate to pyruvate. Moreover, the conversion of malate to pyruvate catalyzed by a malate oxidoreductase (VP1258) was also enhanced. The increased amount of pyruvate was actively metabolized by a phosphoenolpyruvate synthase (VPA0372) to produce phosphoenolpyruvic acid that enters into glycolysis. Similarly, the acetyl-CoA synthetase (VP2878) that catalyzes acetate to acetyl-CoA, an efficient substrate for tricarboxylic acid (TCA) cycle, was also up-regulated. These data suggested active l-lactate, malate and acetate metabolisms in LGP cells in the acid stress, consistent with previous research (e.g., [17]).
In oxidative phosphorylation, strikingly, the most enhanced was the atpC gene (VP3068), encoding ε subunit of a multisubunit F0F1-ATPase, which synthesizes ATP aerobically, as a result of protons passing into the cell, or hydrolyzes ATP for the expulsion of protons from cytoplasm anaerobically [24]. The up-regulated F0F1-ATPase gene operon has been reported in some other bacteria in bile and acid stresses (e.g., [20]). In this study, the enhanced expression of ε subunit of the F0F1-ATPase, which is located in a common central stalk linking the F0 and F1 rotary motors [25], suggested perhaps active pumping of excessive protons from LGP cells after exposed to a sub-lethal acid condition (pH 4.9).

2.4.2. Major Metabolic Pathways Involved in V. parahaemolyticus CHN25 Cells at SGP in the AGF Stress

Based on the GESA-KEEG analysis, only four metabolic pathways, including pyrimidine, purine, as well as fructose and mannose metabolisms and the PTS, were identified to be significantly changed in SGP cells after exposed to the AGF stress (p < 0.05) (Table 1). Distinct from LGP cells, the genes encoding fructose-specific Enzyme IIA subunit (VPA0298) and fructose-specific enzyme II ABC subunits (VPA1424) involved in the PTS and fructose and mannose metabolisms were significantly down-regulated, indicating possibly reduced fructose transport in SGP cells in the AGF stress. In addition, consistent with some previous studies (e.g., [17]), the majority of the differentially expressed genes involved in pyrimidine and purine metabolisms were also down-regulated, e.g., DNA polymerase III α and ε subunits (VP2303, VPA0074), suggesting likely reduced DNA synthesis in SGP cells in the AGF stress.

2.5. Other Altered Biological Functions in V. parahaemolyticus CHN25 in the Response to the AGF Stress

The GSEA of the differentially expressed genes against the Go Ontology (GO) database revealed several significantly affected biological functions (p < 0.05) in LGP cells in the AGF stress (Table 1). Of these, the d-ribose and maltose/maltodextrin transport systems were significantly enhanced. The ATP-binding cassette (ABC) transporters are known as molecular pumps that harness the chemical energy of ATP hydrolysis to translocate solutes across the membrane [26]. Significantly changed ABC transporters have been reported in some other bacteria after acid shock (e.g., [17]). In this study, expression of the rbsABCD operon encoding d-ribose transporter components was strongly enhanced for 7.70–14.96-fold. Enhanced expression of several genes involved in sugar transport and utilization (e.g., ribose) has also been observed in Lactobacillus plantarum in the gastrointestinal tract of mice [27]. Similarly, five genes in the maltose/maltodextrin transport system were also up-regulated (Table 1). These data suggested active d-ribose and maltose/maltodextrin ABC transport systems in the AGF stress.
In contrast, two biological functions were significantly repressed in LGP cells in the AGF stress. One of these was the flagellar biosynthesis and motility, in which all the eight differently expressed genes were notably down-regulated (2.08–4.55-fold), except the flaG gene encoding a distal rod protein with a minor increase in mRNA level. They included the flhA, flhB, flicC, flicD, flgA, VPA0263 and VP2255. Flagellum motility is generally thought to be extremely energy consumptive under detrimental conditions. Albeit previous studies gave different expression characteristics of the genes involved in flagellar biosynthesis and motility under acidic conditions (e.g., [18,28,29,30]), our data strongly suggested the reduced biosynthesis of the flagellum structure and or flagellum motibity in V. parahaemolyticus CHN25 cells at LGP in the AGF stress. In addition, the polyamine transporter system was repressed as well, in which ATP-binding protein (VP1332), ABC transporter binding protein and permeases (VP1336–VP1338) were significantly down-regulated.
Based on the GSEA-GO analysis, a number of significantly changed biological functions were identified in SGP cells (p < 0.05) (Table 1), the majority of which were repressed in the AGF stress. Of these, the most down-regulated was a putative transporter (VPA1287) involved in Zn2+ transmembrane transport system. Likewise, the gene (VP2491) encoding a periplasmic iron-compound-binding protein in Fe3+ transport system was also significantly down-regulated. Low pH is thought to increase metal ion toxicity in bacteria, and an excess of metal ions causes oxidative damage [17]. Our data suggested perhaps decreased transport of the metal ions (Zn2+, Fe3+) into SGP cells after exposed to the AGF stress. In addition, three genes in the glycine betaine (GB) biosynthesis were down-regulated, which are involved in the conversions of choline to betaine aldehyde and betain aldehyde to GB. Among the most up-regulated biological functions in SGP cells was the pilus biosynthesis. The gene (VPA0725), encoding a putative TadB involved in Flp pili biogenesis [31], was up-regulated (3.04-fold) in the AGF stress, suggesting possibly enhanced biofilm formation to protect the bacterium from the detrimental acid stress.
Activation of phage-associated genes at low pH stress has been reported in Lactobacillus reuteri [20]. Strikingly, in this study, three genes (VPA1173–1175) encoding phage major capsid protein, phage capsid scaffolding protein and putative bacteriophage protein showed unusual expression features between the two growth-phases cells of V. parahaemolyticus CHN25 in the AGF stress. They were induced with a minor increase of 2.06–2.19-fold in LGP cells, but highly down-regulated in SGP cells, particularly the capsid-related genes showing strongly 40-fold reduced expression. In addition, expression of the bacteriophage Mu tail sheath protein (GpL, VP2725) was slightly repressed at both growth phases. It will be interesting to elucidate biological significance of the differently expressed phage-associated genes in the AGF stress in future studies.

2.6. Regulators Involved in the Response of V. parahaemolyticus CHN25 to the AGF Stress

The genome-wide transcriptome data also revealed a total of sixty-nine and nine changed regulators in V. parahaemolyticus CHN25 cells at LGP and SGP in the AGF stress, respectively (Table S2). They globally or specifically regulate a wide variety of cellular processes including environmental stresses in bacteria, such as DNA-binding transcriptional or response regulators; LysR-type transcriptional regulators (LTTRs); AraC/XylS-, AsnC-, LacI-, LuxR-, MarR- and TetR-family of regulators; and some other regulators involved in multiple metabolism pathways. Of these, the majority were down-regulated in LGP cells, whereas opposite expression characteristics were observed in SGP cells in the AGF stress.
Interestingly, several differentially expressed regulators were identified from the cells at the two growth phases, suggesting the growth phase-independent and AGF-dependent regulation in V. parahaemolyticus CHN25. Of these, the genes encoding a LacI-family transcriptional regulator (VP2393), repressing a lac operon in E. coli [32], and a putative transcriptional regulator (VPA0593) showed higher expression levels in the AGF stress. In contrast, expression of a regulator BetI (VPA1114) was repressed, which negatively regulated the betT and betIBA genes that govern GB biosynthesis from choline in response to choline in E. coli [33]. The repressed BetI perhaps in turn acivated the target genes in the AGF stress, which perhaps led to increased amount of GB to maintain the integrity of cell membranes against the damaging effects of the AGF stress, as in other stress responses to excessive salt, cold, heat and freezing in bacteria [34]. The possible link between the acid stress and GB, an osmoprotectant in osmotic stress, has also been reported in Streptococcus pneumoniae [16]. The molecular responses of bacteria to external environment signals are complex, but in which the two-component transduction systems have been known to play an important role [35]. Consistent with previous studies, a response regulator (VPA0737) belonging to the two-component signaling systems, which enable bacteria to sense, respond, and adapt to a wide range of environments, stressors, and growth conditions [35], was elicited by the AGF stress in V. parahaemolyticus CHN25. However, distinct responses of the regulator were detected, which was up- and down-regulated in expression in LGP and SGP cells, respectively, implying different regulatory strategies adopted by the bacterium for dealing with the same stressor between the two growth phases. In addition, interestingly, two AsnC-family transcriptional regulators (VPA1717, VPA0091), known as feast/famine regulatory proteins specifically involved in multiple cellular metabolisms in bacteria, displayed 5.0- and 3.5-fold increased expression in LGP and SGP cells, respectively, suggesting possible regulation functions in the AGF stress as those in the feast/famine stress [36].
Among the differentially expressed regulators in LGP cells, the LTTRs were the most abundant in the AGF stress, except putative regulators with currently unknown regulatory functions in the public databases. The LTTRs represent the most abundant type of globally transcriptional regulators in bacteria, which are involved in a wide range of cellular processes, e.g., cell division, quorum sensing, oxidative stress, virulence, motility, attachment and secretion [37]. In this study, a total of ten LTTRs were identified in LGP cells in the AGF stress, however, all of which were significantly repressed in expression, except the one (VP0067) with an opposite minor increase. Similarly, expression of several regulators were suppressed as well, all of which have been reported to directly regulate gene expression in response to environmental stimuli or coordinately regulate in a complex network in bacteria [38,39,40]. For example, an AraC/XylS-family regulator (VPA0531), one of the most common positive regulators in bacteria, showed a decrease of 5.26-fold in the AGF stress. Regulators belonging to this family have three major regulatory functions including stress responses to alkylating agents, antibiotics, organic solvents and heavy metals, as well as the transition from LGP to SGP [38]. In addition, approximately a dozen regulators controlling multiple metabolic pathways were also repressed in the AGF stress, e.g., the DNA-binding transcriptional regulators AraC, HexR and YidZ (VPA1678, VP1236 and VPA1575), the key components in bacterial gene regulatory networks that can sense fluctuations under internal and external conditions [41,42,43]. In contrast, 26.1% of the differentially expressed regulators in LGP cells displayed significantly enhanced expression in the AGF stress. Of these, the regulator (VP2866) belonging to the LuxR-family transcriptional regulators, which are key players in quorum sensing and coordinate gene expression in a variety of cellular functions [44], showed a higher expression level. Similarly, expression of an osmolarity response regulator OmpR (VP0154) involved in the EnvZ/OmpR signal transduction system was also enhanced in the AGF stress, which positively or negatively modulates multiple gene expression implicated in the control of Y. enterocolitica adaptation to high osmolarity, oxidative and low pH stresses [45].
For the SGP cells, expression of a regulator belonging to the LTTRs (VP1316) and a putative transcriptional regulator (VPA1689) were significantly increased, whereas expression of a phospoglycerate transport regulatry protein PgtC (VPA0825) and a putative transcriptional regulator (VP1154) were decreased in the AGF stress.
Taken together, the transcriptome data figured out a complex molecular regulatory network in V. parahaemolyticus CHN25 after exposed to the AGF stress, which lead to three major molecular snapshots. A number of regulators, acting as activators and or repressors of single or operonic genes or a series of regulatory cascades under different environmental stresses in bacteria, were elicited from LGP cells, which perhaps globally or specifically triggered cell responses to the AGF stress and controlled intracellular processes. In contrast, a considerable number of regulators remained unchanged in SGP cells under the same stress condition, which was consistent with the turndown feature at this growth phase. In addition, some growth-phase independent regulators were identified, which likely played crucial roles specifically in the AGF stress response in V. parahaemolyticus CHN25. Finally, the AGF stress appeared to mediate cross-talk regulation with some other environmental stimuli, e.g., osmotic and feast/famine stresses. An in-depth regulatory network in future studies will allow for better understanding of acid stress mechanisms in V. parahaemolyticus.

2.7. Possible Acid Stress Mechanisms in V. parahaemolyticus CHN25

In this study, expression of the genes directly or indirectly associated with the pumping out of protons (e.g., F1F0-ATPase) was significantly enhanced in LGP cells after exposed to a sub-lethal acid condition (pH 4.9). Moreover, two genes (VP2125 and VP2718) encoding Na+/H+ antiporters were also up-regulated, which are important not only for energy transduction, but also for intracellular pH regulation, extrusion of toxic Li+ (and Na+) and cell volume regulation in bacteria [46].
Production of ammonia has been known to be one of the major mechanisms in acid stress response in bacteria. In this study, a number of up-regulated genes involved in nitrogen metabolism (e.g., NrfBD, NrfAH, a glutamate dehydrogenase) were identified, which likely increased intracellular ammonia in LGP cells in the AGF stress. Moreover, expression of the aspA (VP2863) and hutH (VP1273) genes encoding aspartate ammonia-lyase and histidine ammonia-lyase, as well as the gene (VPA0254) encoding l-serine dehydratase 1 that converts serine into ammonia and pyruvate were also significantly increased. In contrast, alanine dehydrogenase (VP1103) and d-amino acid dehydrogenase small subunit (VP0623) showed down-regulated expression. In addition, the nagE (VPA0038) gene encoding a glucosamine-6-phosphate deaminase that converts fructose-6-phpsphate to glucN-phosphate were up-regulated in the AGF stress. It has been reported that urease located on bacterial cell surface may create a neutral microenvironment by hydrolysis of urea to carbon dioxide and ammonia [47]. Unexpectedly, no urease-related genes were identified in V. parahaemolyticus CHN25 in the AGF stress. Overall, these data may have supposed a strong link between the enhanced ammonia production via multiple metabolic pathways in LGP cells and the acid stress imposed on the bacterium.
One interesting observation from the transcriptome data was that the regulator AphB (VP2184) belonging to the LTTRs was not significantly elicited by the AGF stress. Moreover, unexpectedly, expression of the cadAB operon (VP2890–VP2891) involved in the proton-consuming lysine-decarboxylation pathway was strikingly down-regulated (20–25-fold) in LGP cells. This finding was inconsistent with previous studies (e.g., [12,48,49]). We questioned whether the saline concentration of the AGF resulted in the distinct observation, since it has been reported that V. parahaemolyticus RIMD2210633 grown in Luria-Bertani (LB) supplemented with 3% NaCl induced a stronger cadA response after acidification than cells grown in LB with 1% NaCl [50]. To address the interesting result, we treated V. parahaemolyticus CHN25 grown to LGP with the AGF supplemented with 3% NaCl instead of 0.21% NaCl, and then determined the cadAB gene expression by qRT-PCR analysis. The resulting data revealed that both cadA and cadB genes were highly up-regulated in mRNA levels (data not shown). Our data, coupled with the previous results, demonstrated that environmental saline concentration likely mediated an important cross-regulation in acid stress response in V. parahaemolyticus.
In addition, consistent with previous research, the toxS (VP0819) gene was significantly up-regulated in the AGF stress, which belongs to the ToxR-ToxS signal transduction system required for the acid stress response in V. cholerae [11]. In addition, our transcriptome data also revealed some other possible mechanisms in V. parahaemolyticus CHN25, such as the attenuated consumption of ammonia (e.g., VP0483) and enhanced production of HCO3 (e.g., VP2514), to maintain intracellular pH homeostasis in the AGF stress.

3. Experimental Section

3.1. Bacterial Growth Conditions

V. parahaemolyticus CHN25 bearing a SXT/R391-like integrative and conjugative element has recently been characterized by Song et al. [15]. The bacterium was detected positive for the tlh gene, but featured no toxic tdh and trh genes. V. parahaemolyticus CHN25 was streaked from a frozen stock at −80 °C in our laboratory onto LB solid medium [51] adjusted to pH 8.5, 3% NaCl, and incubated at 37 °C overnight. One colony was then inoculated into 5 mL TSB liquid medium (pH 8.5, 3% NaCl) (Beijing Land Bridge Technology Co., Ltd., Beijing, China), and aerobically cultured at 37 °C with shaking at 175 rpm. The overnight culture was diluted 1:100 (v/v) into fresh TSB liquid medium adjusted to the pH range of 1.5–12.5 with 1 M HCl or 6 M NaOH, respectively, and incubated at 37 °C for 16–20 h. The growth curves were determined using a BioScreener (BioScreen, Helsinki, Finland).

3.2. AGF Survival Assay

The AGF survival assay was performed according to the method described previously [19] with slight modifications. Briefly, V. parahaemolyticus CHN25 was incubated in TSB liquid medium at 37 °C to LGP and SGP, defined as an optical density at 600 nm (OD600 nm) of 0.7 and 1.3, respectively. An aliquot of the bacterial culture (1 mL) was centrifuged at 3500 rpm for 2 min, and the cell pellet was resuspended with 1 mL of 1× AGF, containing 8.3 g proteose peptone, 3.5 g d-glucose, 2.05 g NaCl, 0.6 g KH2PO4, 0.147 g CaCl2, and 0.37 g KCl per/L [19]. The cell suspension was added into 4 mL of 1× AGF, and the acid-exposed cells were incubated at 37 °C for 0–60 min or 0–2 h for LGP and SGP cells, respectively. Culturable bacterial cells were enumerated at different time points via plating appropriate dilutions of cell culture onto LB solid medium.

3.3. RNA Extraction and Microarray Analysis

Total RNA preparation was performed using RNeasy Protect Bacterial Mini Kit (QIAGEN Biotech Co., Ltd., Hilden, Germany) according to the manufacturer’s instructions. The DNA was removed from the samples using RNase-Free DNase Set (QIAGEN, Hilden, Germany), and its quality and quantity was assessed using the Agilent Bioanalyzer 2100 system (Agilent Technologies, Santa Clara, CA, USA). Two independently prepared RNA samples were used in each microarray experiment [52].
Microarray chip design, cRNA labeling, hybridization, scanning and analyses were conducted at Shanghai Biotechnology Co., Ltd. (Shanghai, China). An array of 15,000 specific 60-m oligonucleotides was designed based on predicted coding sequences from V. parahaemolyticus RIMD2210633 and V. parahaemolyticus CHN25, respectively. It contained 4711 probes and covered 99.72% of the genes in V. parahaemolyticus CHN25. A sample of 2 μg RNA was used to synthesize cDNA, which was further transcribed into cRNA using a transcription mix containing aa-UTP and T7 RNA polymerase. Cyanine-3 (Cy3) labeled cRNA was performed by Low Input Quick Amp Labeling Kit, One-Color (Agilent), followed by purification using RNeasy mini kit (QIAGEN), according to the manufacturer’s instructions. Each slide was hybridized with 600 ng Cy3-labeled cRNA using Gene Expression Hybridization Kit (Agilent) in an Agilent Microarray Hybridization Chamber (Agilent) at 65 °C. After 17 h hybridization, slides were washed with Gene Expression Wash Buffer Kit (Agilent) following the manufacturer’s instructions. Microarrays were scanned using Agilent Microarray Scanner (Agilent) and the data were extracted with Feature Extraction software version 10.7 (Agilent). Raw data were normalized by Quantile algorithm, Gene Spring software version 11.0 (Agilent). The average coefficient of variation (CV) was <0.15 as recommended by Agilent for the quality control. Normalized expression ratios were calculated for each gene and tested for significance with the criteria |fold change| > 2.0 and p < 0.05. The GSEA of differently expressed genes was supported by the eBioservice (http://sas.ebioservice.com/portal/root/molnet_shbh/index.jsp) (Shanghai Biotechnology Co., Ltd., Shanghai, China) against the GO (http://geneontology.org/) and KEGG (http://www.genome.jp/kegg/) database, respectively.

3.4. qRT-PCR Analysis

Selected differentially expressed genes and/or significantly enriched genes in microarray chip analysis were validated by qRT-PCR. Oligonucleotide primers were synthesized by Shanghai Sangon Biological Engineering Technology Services Co., Ltd. (Shanghai, China). The reverse transcription reaction was performed using PrimeScript RT reagent Kit With gDNA Eraser (Perfect Real Time) (Japan TaKaRa BIO, Dalian Company, Dalian, China) according to the manfacturer’s protocol. A 20 μL reaction volume contained 10 μL FastStart Universal SYBR Green Master (ROX), 5 μM each of the oligonucleotide primers, 2 μL template cDNA and appropriate volume of sterile ddH2O (Roche, Basel, Switzerland). All qRT-PCR reactions were performed in a 7500 Fast Real-Time PCR System (Applied Biosystems, Foster City, CA, USA) under the following conditions: initial denaturation at 95 °C for 10 min, followed by 40 cycles of denaturation at 95 °C for 15 s, and primer annealing at 60 °C for 60 s, according to the manufacturer’s instructions. The pvuA gene was used as the qRT-PCR reference gene as previously described [53,54]. Expression level of the pvuA gene in V. parahemolyticus CHN25 grown in TSB to LGP and SGP was used as a reference/baseline, respectively. The data were analyzed using the Applied Biosystems 7500 software, and the relative expression ratio was calculated for each gene by using the delta-delta threshold cycle (Ct) method [55].

3.5. Microarray Data Accession Number

The microarray data have been deposited in the NCBI Gene Expression Omnibus (http://0-www-ncbi-nlm-nih-gov.brum.beds.ac.uk/geo/) under the accession number GSE63167.

4. Conclusions

This study constitutes the first investigation of Vibrio parahaemolyticus CHN25 response to the AGF under a sub-lethal acid condition using genome-wide microarray analysis. The transcriptome data revealed global-level distinct gene expression profiles of the bacterium with considerable variation over growth phases after exposed to the AGF (pH 4.9) for 30 min. Vibrio parahaemolyticus seemed to have evolved a number of molecular strategies for coping with the acid stress in a complex gene regulation network. Our data in this study will highly facilitate the in-depth research of environmental stresses and pathogenicity of the leading seafood-borne pathogen worldwide.

Supplementary Materials

Acknowledgments

The work was supported by the Grants No. B-9500-10-0004, No. 13YZ098 and No. ZZhy12028 from Shanghai Municipal Education Commission, and a Grant No. 31271830 from National Natural Science Foundation of China.

Author Contributions

Xuejiao Sun, Taigang Liu, Xu Peng and Lanming Chen participated in the design and or discussion of the study. Xuejiao Sun carried out the major experiments. Xuejiao Sun, Taigang Liu and Lanming Chen analyzed the data. Lanming Chen wrote the manuscript, and Xu Peng revised it for important improvement. All authors read and approved the final manuscript.

Conflicts of Interest

The authors declare no conflict of interest.

References

  1. Ceccarelli, D.; Hasan, N.A.; Huq, A.; Colwell, R.R. Distribution and dynamics of epidemic and pandemic Vibrio parahaemolyticus virulence factors. Front. Cell. Infect. Microbiol. 2013, 3. [Google Scholar] [CrossRef] [PubMed]
  2. Fujino, T.; Okuno, Y.; Nakada, D.; Aoyama, A.; Fukai, K.; Mukai, T.; Ueho, T. On the bacteriological examination of Shirasu food poisoning. Med. J. Osaka Univ. 1953, 4, 299–304. [Google Scholar]
  3. Okuda, J.; Ishibashi, M.; Hayakawa, E.; Nishino, T.; Takeda, Y.; Mukhopadhyay, A.K.; Garg, S.; Bhattacharya, S.; Nair, G.B.; Nishibuchi, M. Emergence of a unique O3:K6 clone of Vibrio parahaemolyticus in Calcutta, India, and isolation of strains from the same clonal group from Southeast Asian travelers arriving in Japan. J. Clin. Microbiol. 1997, 35, 3150–3155. [Google Scholar] [PubMed]
  4. Velazquez-Roman, J.; León-Sicairos, N.; de Jesus Hernández-Díaz, L.; Canizalez-Roman, A. Pandemic Vibrio parahaemolyticus O3:K6 on the American continent. Front. Cell. Infect. Microbiol. 2013, 3. [Google Scholar] [CrossRef] [PubMed]
  5. Twedt, R.M.; Spaulding, P.L.; Hall, H.E. Morphological, cultural, biochemical, and serological comparison of Japanese strains of Vibrio parahemolyticus with related cultures isolated in the United States. J. Bacteriol. 1969, 98, 511–518. [Google Scholar] [PubMed]
  6. Joseph, S.W.; Colwell, R.R.; Kaper, J.B. Vibrio parahaemolyticus and related halophilic Vibrios. Crit. Rev. Microbiol. 1982, 10, 77–124. [Google Scholar] [CrossRef] [PubMed]
  7. Schubert, M.L. Gastric exocrine and endocrine secretion. Curr. Opin. Gastroenterol. 2009, 25, 529–536. [Google Scholar] [CrossRef] [PubMed]
  8. Russell, T.L.; Berardi, R.R.; Barnett, J.L.; Dermentzoglou, L.C.; Jarvenpaa, K.M.; Schmaltz, S.P.; Dressman, J.B. Upper gastrointestinal pH in seventy-nine healthy, elderly, North American men and women. Pharm. Res. 1993, 10, 187–196. [Google Scholar] [CrossRef] [PubMed]
  9. O’Boyle, N.; Boyd, A. Manipulation of intestinal epithelial cell function by the cell contact-dependent type III secretion systems of Vibrio parahaemolyticus. Front. Cell. Infect. Microbiol. 2013, 3. [Google Scholar] [CrossRef] [PubMed]
  10. Lund, P.; Tramonti, A.; Biase, D. Coping with low pH: Molecular strategies in neutralophilic bacteria. FEMS Microbiol. Rev. 2014, 38. [Google Scholar] [CrossRef]
  11. Merrell, D.S.; Camilli, A. Regulation of Vibrio cholerae genes required for acid tolerance by a member of the “ToxR-like” family of transcriptional regulators. J. Bacteriol. 2000, 182, 5342–5350. [Google Scholar] [CrossRef] [PubMed]
  12. Rhee, J.E.; Jeong, H.G.; Lee, J.H.; Choi, S.H. AphB influences acid tolerance of Vibrio vulnificus by activating expression of the positive regulator CadC. J. Bacteriol. 2006, 188, 6490–6497. [Google Scholar] [CrossRef] [PubMed]
  13. Kalburge, S.S.; Whitaker, W.B.; Boyd, E.F. High-salt preadaptation of Vibrio parahaemolyticus enhances survival in response to lethal environmental stresses. J. Food Prot. 2014, 77, 246–253. [Google Scholar] [CrossRef] [PubMed]
  14. Whitaker, W.B.; Parent, M.A.; Boyd, A.; Richards, G.P.; Boyd, E.F. The Vibrio parahaemolyticus ToxRS regulator is required for stress tolerance and colonization in a novel orogastric streptomycin-induced adult murine model. Infect Immun. 2012, 80, 1834–1845. [Google Scholar] [CrossRef] [PubMed]
  15. Song, Y.; Yu, P.; Li, B.; Pan, Y.; Zhang, X.; Cong, J.; Zhao, Y.; Wang, H.; Chen, L. The mosaic accessory gene structures of the SXT/R391-like integrative and conjugative elements derived from Vibrio spp. isolated from aquatic products and environment in the Yangtze River estuary, China. BMC Microbiol. 2013, 13. [Google Scholar] [CrossRef]
  16. Martín-Galiano, A.J.; Overweg, K.; Ferrándiz, M.J.; Reuter, M.; Wells, J.M.; Adela, G. Transcriptional analysis of the acid tolerance response in Streptococcus pneumoniae. Microbiology 2005, 151, 3935–3946. [Google Scholar] [CrossRef] [PubMed]
  17. Bore, E.; Langsrud, S.; Langsrud, Ø.; Rode, T.M.; Holck, A. Acid-shock responses in Staphylococcus aureus investigated by global gene expression analysis. Microbiology 2007, 153, 2289–2303. [Google Scholar] [CrossRef]
  18. Hellweg, C.; Pühler, A.; Weidner, S. The time course of the transcriptome response of Sinorhizobium meliloti 1021 following a shift to acidic pH. BMC Microbiol. 2009, 9. [Google Scholar] [CrossRef]
  19. Ivy, R.A.; Wiedmann, M.; Boor, K.J. Listeria monocytogenes grown at 7 °C shows reduced acid survival and an altered transcriptional response to acid shock compared to L. monocytogenes grown at 37 °C. Appl. Environ. Microbiol. 2012, 78, 3824–3836. [Google Scholar] [CrossRef] [PubMed]
  20. Wall, T.; Båth, K.; Britton, R.A.; Jonsson, H.; Versalovic, J.; Roos, S. The early response to acid shock in Lactobacillus reuteri involves the ClpL chaperone and a putative cell wall-altering esterase. Appl. Environ. Microbiol. 2007, 73, 3924–3935. [Google Scholar] [CrossRef] [PubMed]
  21. Postma, P.; Lengeler, J.; Jacobson, G. Phosphoenolpyruvate: Carbohydrate phosphotransferase systems of bacteria. Microbiol. Rev. 1993, 57, 543–594. [Google Scholar] [PubMed]
  22. Bickle, T.A.; Howard, G.A.; Traut, R.R. Ribosome heterogeneity the nonuniform distribution of specific ribosomal proteins among different functional classes of ribosomes. J. Biol. Chem. 1973, 248, 4862–4864. [Google Scholar] [PubMed]
  23. Moll, I.; Engelberg-Kulka, H. Selective translation during stress in Escherichia coli. Trends Biochem. Sci. 2012, 37, 493–498. [Google Scholar] [CrossRef] [PubMed]
  24. Okuno, D.; Iino, R.; Noji, H. Rotation and structure of FoF1-ATP synthase. J. Biochem. 2011, 149, 655–664. [Google Scholar] [CrossRef] [PubMed]
  25. Zhang, J.; Li, Z.; Zhang, H.; Wang, J.; Liu, Y.; Chen, G. Rapid detection of several foodborne pathogens by F0F1-ATPase molecular motor biosensor. J. Microbiol. Methods 2013, 93, 37–41. [Google Scholar] [CrossRef] [PubMed]
  26. Oldham, M.L.; Chen, S.; Chen, J. Structural basis for substrate specificity in the Escherichia coli maltose transport system. Proc. Natl. Acad. Sci. USA 2013, 110, 18132–18137. [Google Scholar] [CrossRef] [PubMed]
  27. Bron, P.A.; Grangette, C.; Mercenier, A.; de Vos, W.M.; Kleerebezem, M. Identification of Lactobacillus plantarum genes that are induced in the gastrointestinal tract of mice. J. Bacteriol. 2004, 186, 5721–5729. [Google Scholar] [CrossRef]
  28. De Jonge, R.; Ritmeester, W.S.; van Leusden, F.M. Adaptive responses of Salmonella enterica serovar Typhimurium DT104 and other S. Typhimurium strains and Escherichia coli O157 to low pH environments. J. Appl. Microbiol. 2003, 94, 625–632. [Google Scholar] [CrossRef]
  29. Hickey, E.W.; Hirshfield, I.N. Low-pH-induced effects on patterns of protein synthesis and on internal pH in Escherichia coli and Salmonella typhimurium. Appl. Environ. Microbiol. 1990, 56, 1038–1045. [Google Scholar] [PubMed]
  30. Maurer, L.M.; Yohannes, E.; Bondurant, S.S.; Radmacher, M.; Slonczewski, J.L. pH regulates genes for flagellar motility, catabolism, and oxidative stress in Escherichia coli K-12. J. Bacteriol. 2005, 187, 304–319. [Google Scholar] [CrossRef] [PubMed]
  31. Tomich, M.; Fine, D.H.; Figurski, D.H. The TadV protein of Actinobacillus actinomycetemcomitans is a novel aspartic acid prepilin peptidase required for maturation of the Flp1 pilin and TadE and TadF pseudopilins. J. Bacteriol. 2006, 188, 6899–6914. [Google Scholar] [CrossRef] [PubMed]
  32. Swint-Kruse, L.; Matthews, K.S. Allostery in the LacI/GalR family: Variations on a theme. Curr. Opin. Microbiol. 2009, 12, 129–137. [Google Scholar] [CrossRef] [PubMed]
  33. Rkenes, T.; Lamark, T.; Strøm, A.R. DNA-binding properties of the BetI repressor protein of Escherichia coli: The inducer choline stimulates BetI-DNA complex formation. J. Bacteriol. 1996, 178, 1663–1670. [Google Scholar] [PubMed]
  34. Sakamoto, A.; Murata, N. The role of glycine betaine in the protection of plants from stress: Clues from transgenic plants. Plant. Cell Environ. 2002, 25, 163–171. [Google Scholar] [CrossRef] [PubMed]
  35. Laub, M.T.; Goulian, M. Specificity in two-component signal transduction pathways. Annu. Rev. Genet. 2007, 41, 121–145. [Google Scholar] [CrossRef] [PubMed]
  36. Deng, W.; Wang, H.; Xie, J. Regulatory and pathogenesis roles of Mycobacterium Lrp/AsnC family transcriptional factors. J. Cell. Biochem. 2011, 112, 2655–2662. [Google Scholar] [CrossRef] [PubMed]
  37. Maddocks, S.E.; Oyston, P.C. Structure and function of the LysR-type transcriptional regulator (LTTR) family proteins. Microbiology 2008, 154, 3609–3623. [Google Scholar] [CrossRef] [PubMed]
  38. Gallegos, M.T.; Schleif, R.; Bairoch, A.; Hofmann, K.; Ramos, J.L. Arac/XylS family of transcriptional regulators. Microbiol. Mol. Biol. Rev. 1997, 61, 393–410. [Google Scholar] [PubMed]
  39. Ramos, J.L.; Martínez-Bueno, M.; Molina-Henares, A.J.; Terán, W.; Watanabe, K.; Zhang, X.; Gallegos, M.T.; Brennan, R.; Tobes, R. The TetR family of transcriptional repressors. Microbiol. Mol. Biol. Rev. 2005, 69, 326–356. [Google Scholar] [CrossRef] [PubMed]
  40. Bakhlanova, I.; Dudkina, A.; Baĭtin, D. Enzymatic control of homologous recombination in Escherichia coli cells and hyper-recombination. Mol. Biol. 2012, 47, 205–217. [Google Scholar]
  41. Brinkrolf, K.; Brune, I.; Tauch, A. The transcriptional regulatory network of the amino acid producer Corynebacterium glutamicum. J. Biotechnol. 2007, 129, 191–211. [Google Scholar] [CrossRef] [PubMed]
  42. Justino, G.C.; Santos, M.R.; Canário, S.; Borges, C.; Florêncio, M.H.; Mira, L. Plasma quercetin metabolites: Structure-antioxidant activity relationships. Arch. Biochem. Biophys. 2004, 432, 109–121. [Google Scholar] [CrossRef] [PubMed]
  43. Leyn, S.A.; Li, X.; Zheng, Q.; Novichkov, P.S.; Reed, S.; Romine, M.F.; Fredrickson, J.K.; Yang, C.; Osterman, A.L.; Rodionov, D.A. Control of proteobacterial central carbon metabolism by the HexR transcriptional regulator a case study in shewanella oneidensis. J. Biol. Chem. 2011, 286, 35782–35794. [Google Scholar] [CrossRef] [PubMed]
  44. Chen, J.; Xie, J. Role and regulation of bacterial LuxR-like regulators. J. Cell. Biochem. 2011, 112, 2694–2702. [Google Scholar] [CrossRef] [PubMed]
  45. Brzostek, K.; Skorek, K.; Raczkowska, A. OmpR, a central integrator of several cellular responses in Yersinia enterocolitica. In Advances in Yersinia Research; Springer-Verlag: New York, NY, USA, 2012; pp. 325–334. [Google Scholar]
  46. Padan, E.; Schuldiner, S. Molecular physiology of the Na+/H+ antiporter in Escherichia coli. J. Exp. Biol. 1994, 196, 443–456. [Google Scholar] [PubMed]
  47. Merrell, D.S.; Camilli, A. Acid tolerance of gastrointestinal pathogens. Curr. Opin. Microbiol. 2002, 5, 51–55. [Google Scholar] [CrossRef] [PubMed]
  48. Kovacikova, G.; Lin, W.; Skorupski, K. The LysR-type virulence activator AphB regulates the expression of genes in Vibrio cholerae in response to low pH and anaerobiosis. J. Bacteriol. 2010, 192, 4181–4191. [Google Scholar] [CrossRef] [PubMed]
  49. Tanaka, Y.; Kimura, B.; Takahashi, H.; Watanabe, T.; Obata, H.; Kai, A.; Morozumi, S.; Fujii, T. Lysine decarboxylase of Vibrio parahaemolyticus: Kinetics of transcription and role in acid resistance. J. Appl. Microbiol. 2008, 104, 1283–1293. [Google Scholar] [CrossRef] [PubMed]
  50. Whitaker, W.B.; Parent, M.A.; Naughton, L.M.; Richards, G.P.; Blumerman, S.L.; Boyd, E.F. Modulation of responses of Vibrio parahaemolyticus O3:K6 to pH and temperature stresses by growth at different salt concentrations. Appl. Environ. Microbiol. 2010, 76, 4720–4729. [Google Scholar] [CrossRef] [PubMed]
  51. Sambrook, J.; Russell, D.W. Molecular Cloning: A Laboratory Manual; Cold Spring Harbor Press: New York, NY, USA, 2001. [Google Scholar]
  52. Tessema, G.T.; Moretro, T.; Snipen, L.; Heir, E.; Holck, A.; Naterstad, K.; Axelsson, L. Microarray-based transcriptome of Listeria monocytogenes adapted to sublethal concentrations of acetic acid, lactic acid, and hydrochloric acid. Can. J. Microbiol. 2012, 58, 1112–1123. [Google Scholar] [CrossRef] [PubMed]
  53. Coutard, F.; Lozach, S.; Pommepuy, M.; Hervio-Heath, D. Real-time reverse transcription-PCR for transcriptional expression analysis of virulence and housekeeping genes in viable but nonculturable Vibrio parahaemolyticus after recovery of culture ability. Appl. Environ. Microbiol. 2007, 73, 5183–5189. [Google Scholar] [CrossRef] [PubMed]
  54. Funahashi, T.; Moriya, K.; Uemura, S.; Miyoshi, S.I.; Shinoda, S.; Narimatsu, S.; Yamamoto, S. Identification and characterization of pvuA, a gene encoding the ferric vibrioferrin receptor protein in Vibrio parahaemolyticus. J. Bacteriol. 2002, 184, 936–946. [Google Scholar] [CrossRef] [PubMed]
  55. Pfaffl, M.W. A new mathematical model for relative quantification in real-time RT-PCR. Nucleic Acids Res. 2001, 29. [Google Scholar] [CrossRef] [PubMed]

