
SpidermiR: An R/Bioconductor Package for Integrative Analysis with miRNA Data

 , , , ,
  and
and
Abstract
:
1. Introduction
2. Results and Discussion
2.1. Key Features
2.2. Benchmarking
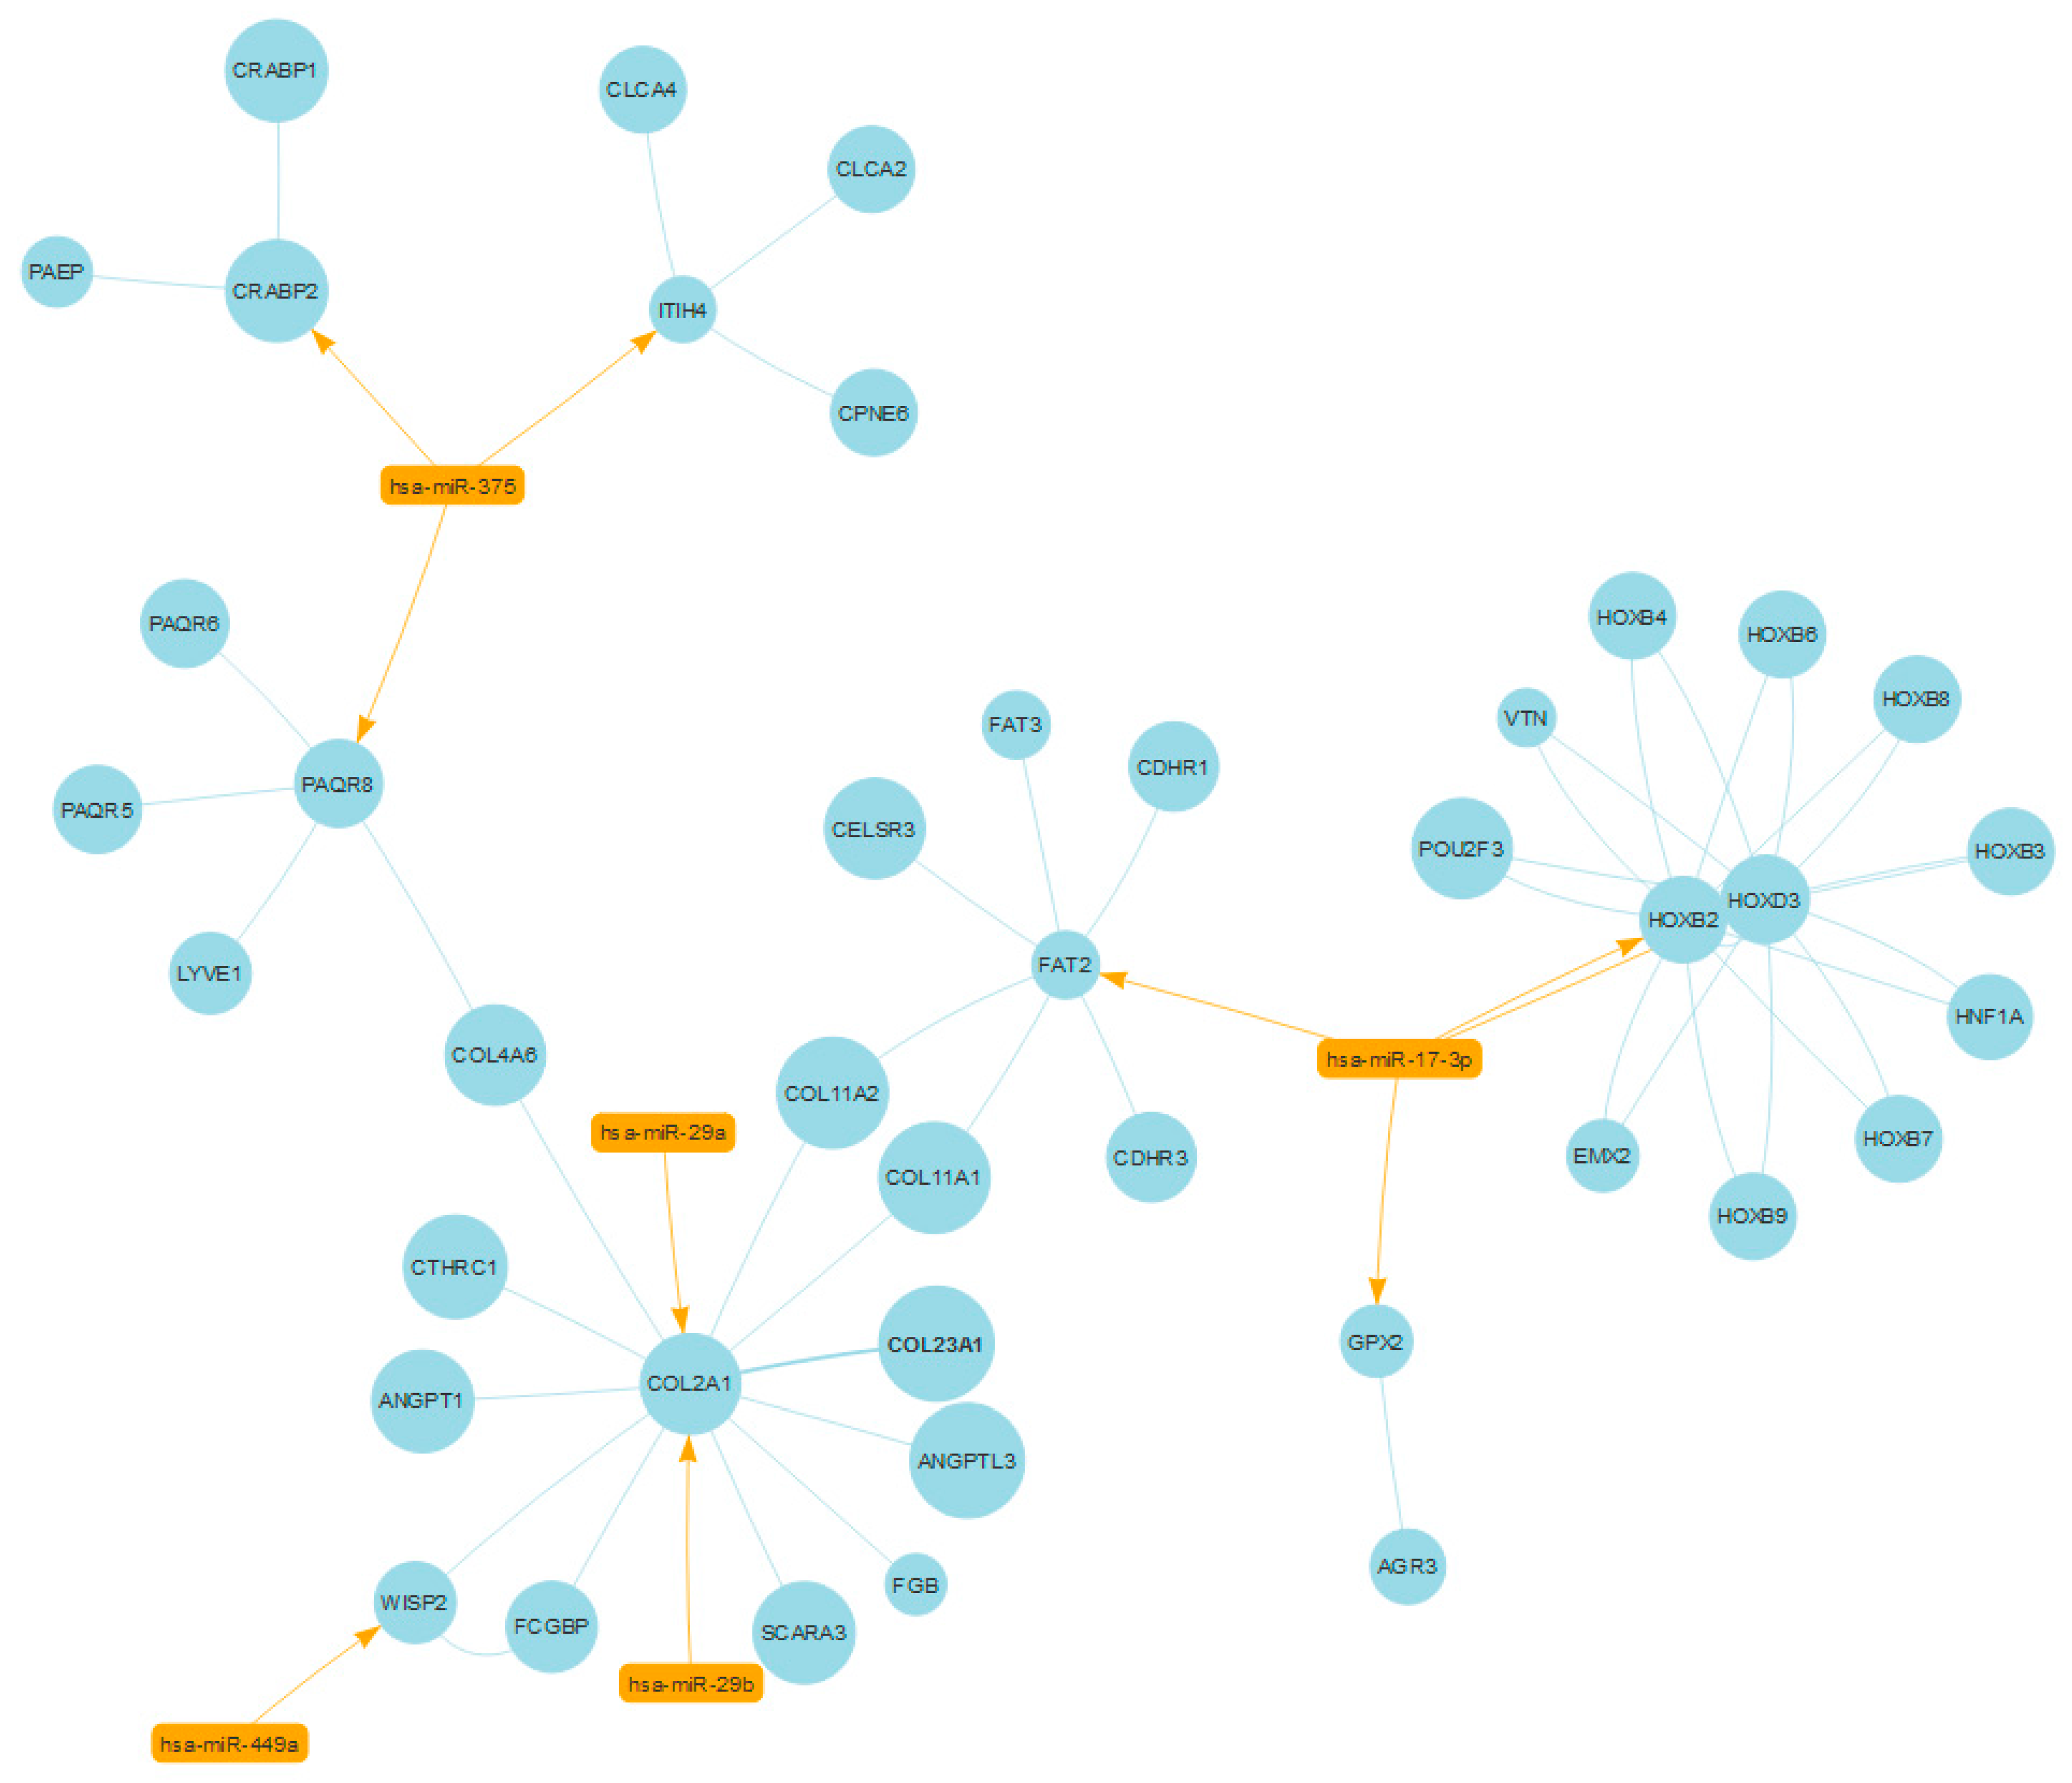
2.3. Case Study No. 1. Prostate Cancer: Role of miRNAs in Shared Protein Domains
2.4. Case Study No. 2. Breast Cancer: The Role of miRNAs in Regulating High Degree Centrality Proteins in Physical Interactions
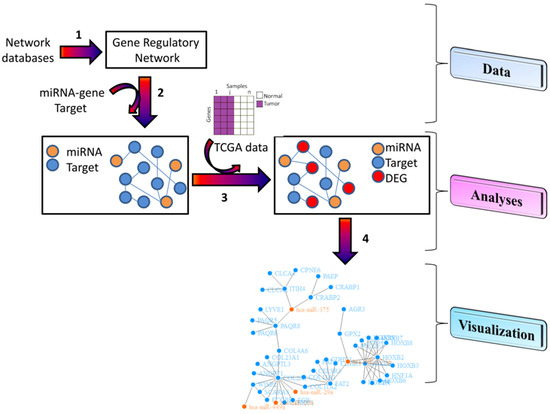
3. Materials and Methods
3.1. Data
- (i)
- “Query” enables users to query: (1) recent and archived data and to identify the elements to download; and (2) species and network type via GeneMANIA database.
- (ii)
- “Download” enables users to download: (1) gene–gene networks as previously queried; (2) miRNA validated data targets using miRTar and miRWalk databases [10,11]; (3) miRNA predicted data targets using DIANA, Miranda, PicTar, and TargetScan databases [12,13,14,15]; (4) extracellular/circulating miRNAs using the miRandola database [16]; (5) the associations among miRNAs, genes, and diseases, using the miR2Disease database [17], and among miRNAs, genes and drugs, using the Pharmaco-miR database [18].
- (iii)
- “Harmonization” enables users to process the data for downstream analyses and it prepares a matrix of gene networks by mapping Ensembl Gene ID to gene symbols. Gene symbols are needed to integrate miRNAdata.
3.2. Analyses
- (i)
- “Enrichment” enables users to: (1) enrich the networks with some further biological information. For example, for each network users can integrate miRNA databases (validated or predicted) in order to find miRNA–gene target interactions in the downloaded gene network; (2) retrieve the information on miRNA–gene and gene-pharmaco from the Pharmaco-miR database; (3) retrieve the extracellular/circulating miRNA database in order to find miRNA–gene target interactions in the downloaded gene network; (4) enrich a chosen network with DEGs. Users can simply choose the type of tumor, platform, and the ID samples from the TCGA portal and then obtain the directed interactions of DEG among them [23,24].In the enrichment step, SpidermiR combines interactions found in all validated databases, and it combines only interactions commonly found in at least two predicted databases.
- (ii)
- “Interaction Selection”. In this step, users can play with the obtained network. For example, user can: (1) find sub-networks including all direct interactions involving at least one of the biomarkers of interest (BIs)—this is carried out on the basis of a set of BIs, genes, miRNA, or both; (2) search for sub-networks including all direct interactions involving only BIs; (3) can search for sub-networks including all direct and indirect interactions involving at least one of the BIs; (4) find the number of direct neighbors of a BI and select those BIs with a number of direct neighbours higher than a given cut-off value.
- (iii)
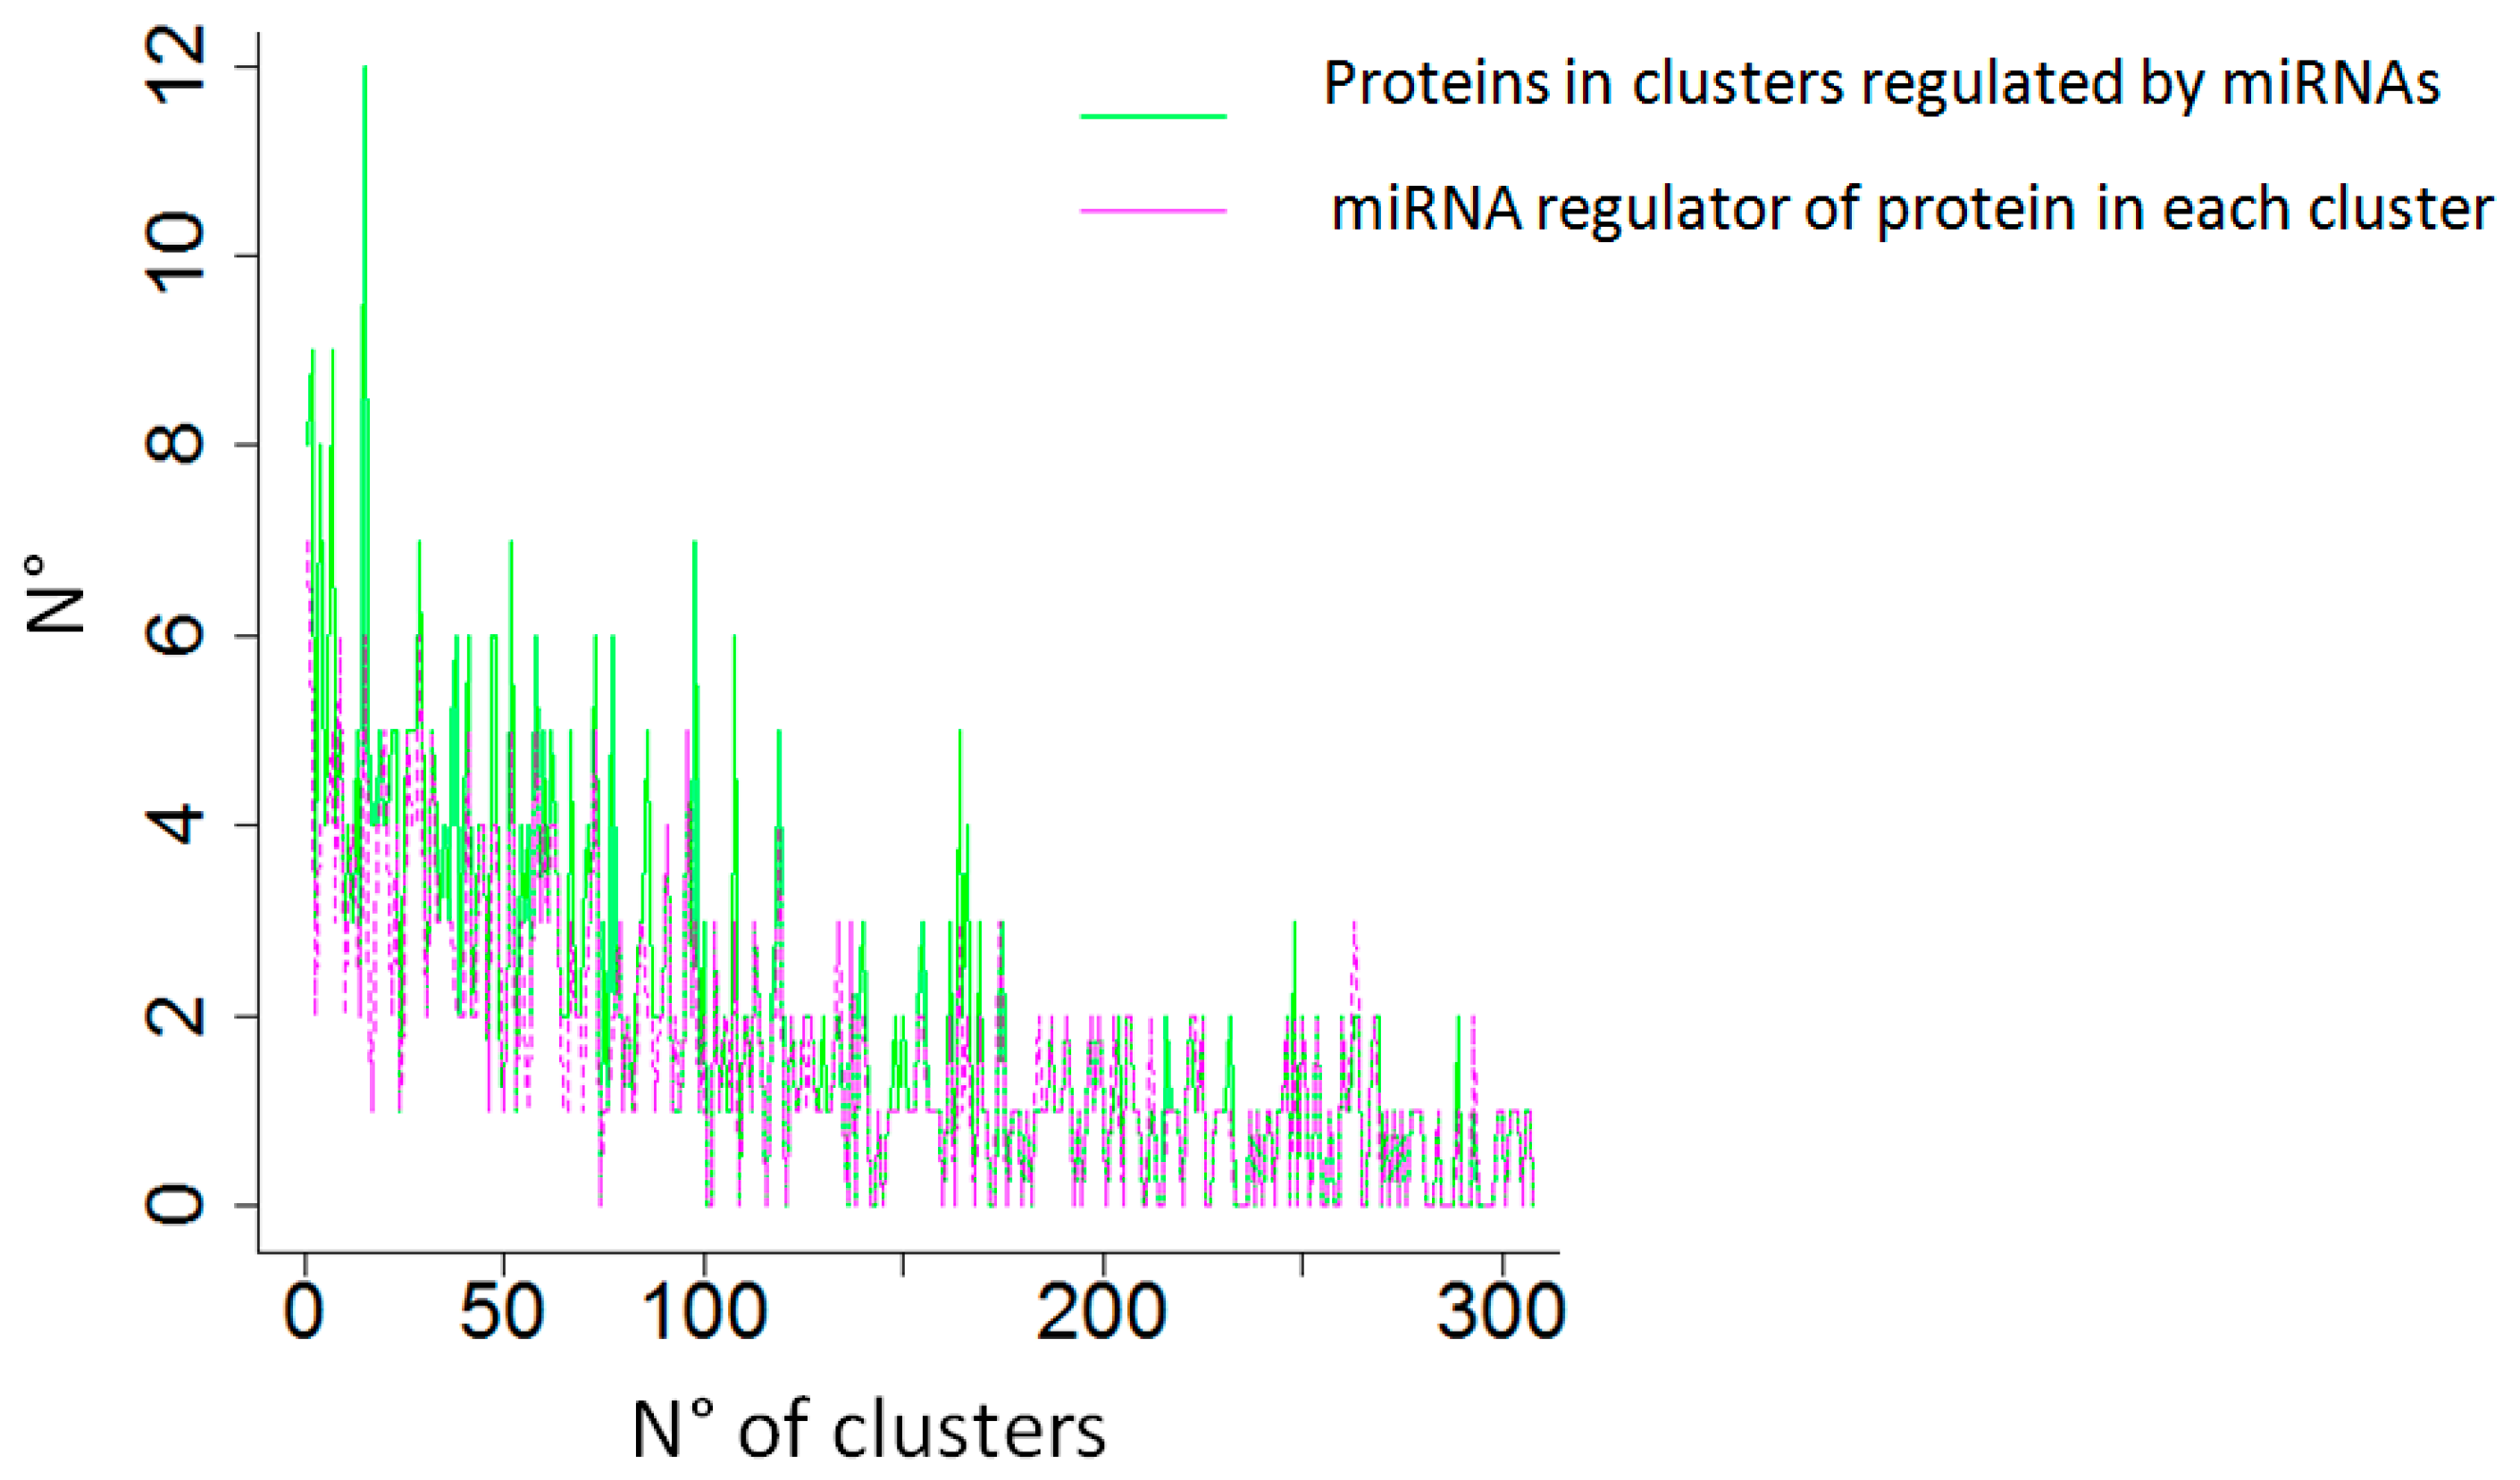
- “Community detection”. In this step, users can analyze the network to detect communities using algorithms developed in the study by Csardi et al. [47], and characterize them in terms of the number of community elements (both genes and miRNAs). On the basis of a community to which some BIs belong, the community can be characterized as a network of elements (both genes and miRNAs), and users can find out whether or not a set of BIs is included within such a community.
3.3. Visualization
4. Conclusions
Acknowledgments
Author Contributions
Conflicts of Interest
Abbreviations
| GRNs | Gene Regulatory Networks |
| miRNAs | MicroRNAs |
| TCGA | The Cancer Genome Atlas |
| PC | Prostate cancer |
| BC | Breast cancer |
| PI | Physical interaction |
| BI | Biomarker of interest |
References
- Warde-Farley, D.; Donaldson, S.L.; Comes, O.; Zuberi, K.; Badrawi, R.; Chao, P.; Franz, M.; Grouios, C.; Kazi, F.; Lopes, C.T.; et al. The GeneMANIA prediction server: Biological network integration for gene prioritization and predicting gene function. Nucleic Acids Res. 2010, 38, W214–W220. [Google Scholar] [CrossRef] [PubMed]
- Jacobsen, A.; Silber, J.; Harinath, G.; Huse, J.T.; Schultz, N.; Sander, C. Analysis of microRNA-target interactions across diverse cancer types. Nat. Struct. Mol. Biol. 2013, 20, 1325–1332. [Google Scholar] [CrossRef] [PubMed]
- Flynt, A.S.; Lai, E.C. Biological principles of microRNA-mediated regulation: Shared themes amid diversity. Nat. Rev. Genet. 2008, 9, 831–842. [Google Scholar] [CrossRef] [PubMed]
- Bertoli, G.; Cava, C.; Castiglioni, I. MicroRNAs: New Biomarkers for Diagnosis, Prognosis, Therapy Prediction and Therapeutic Tools for Breast Cancer. Theranostics 2015, 5, 1122–1143. [Google Scholar] [CrossRef] [PubMed]
- Bertoli, G.; Cava, C.; Castiglioni, I. MicroRNAs as Biomarkers for Diagnosis, Prognosis and Theranostics in Prostate Cancer. Int. J. Mol. Sci. 2016, 17, 421. [Google Scholar] [CrossRef] [PubMed]
- Yuan, X.; Liu, C.; Yang, P.; He, S.; Liao, Q.; Kang, S.; Zhao, Y. Clustered microRNAs′ coordination in regulating protein–protein interaction network. BMC Syst. Biol. 2009, 3, 65. [Google Scholar] [CrossRef] [PubMed]
- Lim, L.P.; Lau, N.C.; Garrett-Engele, P.; Grimson, A.; Schelter, J.M.; Castle, J.; Bartel, D.P.; Linsley, P.S.; Johnson, J.M. Microarray analysis shows that some microRNAs downregulate large numbers of target mRNAs. Nature 2005, 433, 769–773. [Google Scholar] [CrossRef] [PubMed]
- Lancichinetti, A.; Kivelä, M.; Saramäki, J.; Fortunato, S. Characterizing the community structure of complex networks. PLoS ONE 2010, 5, e11976. [Google Scholar] [CrossRef] [PubMed]
- Jeong, H.; Mason, S.P.; Barabási, A.L.; Oltvai, Z.N. Lethality and centrality in protein networks. Nature 2001, 411, 41–42. [Google Scholar] [CrossRef] [PubMed]
- Hsu, J.B.; Chiu, C.M.; Hsu, S.D.; Huang, W.Y.; Chien, C.H.; Lee, T.Y.; Huang, H.D. miRTar: An integrated system for identifying miRNA-target interactions in human. BMC Bioinform. 2011, 12, 300. [Google Scholar] [CrossRef] [PubMed]
- Dweep, H.; Sticht, C.; Pandey, P.; Gretz, N. miRWalk—Database: Prediction of possible miRNA binding sites by “walking” the genes of three genomes. J. Biomed. Inform. 2011, 44, 839–847. [Google Scholar] [CrossRef] [PubMed]
- Maragkakis, M.; Vergoulis, T.; Alexiou, P.; Reczko, M.; Plomaritou, K.; Gousis, M.; Kourtis, K.; Koziris, N.; Dalamagas, T.; Hatzigeorgiou, A.G. DIANA-microT Web server upgrade supports Fly and Worm miRNA target prediction and bibliographic miRNA to disease association. Nucleic Acids Res. 2011, 39, W145–W148. [Google Scholar] [CrossRef] [PubMed]
- Enright, A.J.; John, B.; Gaul, U.; Tuschl, T.; Sander, C.; Marks, D.S. MicroRNA targets in Drosophila. Genome Biol. 2003, 5, R1. [Google Scholar] [CrossRef] [PubMed]
- Krek, A.; Grün, D.; Poy, M.N.; Wolf, R.; Rosenberg, L.; Epstein, E.J.; MacMenamin, P.; da Piedade, I.; Gunsalus, K.C.; Stoffel, M.; et al. Combinatorial microRNA target predictions. Nat Genet. 2005, 37, 495–500. [Google Scholar] [CrossRef] [PubMed]
- Bartel, D.P. MicroRNAs: Target recognition and regulatory functions. Cell 2009, 136, 215–233. [Google Scholar] [CrossRef] [PubMed]
- Russo, F.; Di Bella, S.; Nigita, G.; Macca, V.; Laganà, A.; Giugno, R.; Pulvirenti, A.; Ferro, A. miRandola: Extracellular circulating microRNAs database. PLoS ONE 2012, 7, e47786. [Google Scholar] [CrossRef] [PubMed]
- Jiang, Q.; Wang, Y.; Hao, Y.; Juan, L.; Teng, M.; Zhang, X.; Li, M.; Wang, G.; Liu, Y. miR2Disease: A manually curated database for microRNA deregulation in humandisease. Nucleic Acids Res. 2009, 37, D98–D104. [Google Scholar] [CrossRef] [PubMed]
- Rukov, J.L.; Wilentzik, R.; Jaffe, I.; Vinther, J.; Shomron, N. Pharmaco-miR: Linking microRNAs and drug effects. Brief. Bioinform. 2014, 15, 648–659. [Google Scholar] [CrossRef] [PubMed]
- Pajak, M.; Simpson, T.I. miRNAtap:miRNAtap:microRNA Targets—Aggregated Predictions. Available online: https://bioconductor.org/packages/release/bioc/html/miRNAtap.html (accessed on 10 September 2016).
- Ru, Y.; Kechris, K.J.; Tabakoff, B.; Hoffman, P.; Radcliffe, R.A.; Bowler, R.; Mahaffey, S.; Rossi, S.; Calin, G.A.; Bemis, L.; et al. The multiMiR R package and database: Integration of microRNA–target interactions along with their disease and drug associations. Nucleic Acids Res. 2014, 42, e133. [Google Scholar] [CrossRef] [PubMed]
- Bisognin, A.; Sales, G.; Coppe, A.; Bortoluzzi, S.; Romualdi, C. MAGIA²: From miRNA and genes expression data integrative analysis to microRNA-transcription factor mixed regulatory circuits (2012 update). Nucleic Acids Res. 2012, 40, W13–W21. [Google Scholar] [CrossRef] [PubMed]
- Cancer Genome Atlas Research Network; Weinstein, J.N.; Collisson, E.A.; Mills, G.B.; Shaw, K.R.; Ozenberger, B.A.; Ellrott, K.; Shmulevich, I.; Sander, C.; Stuart, J.M. The Cancer Genome Atlas Pan-Cancer analysis project. Nat. Genet. 2013, 45, 1113–1120. [Google Scholar] [PubMed]
- Colaprico, A.; Silva, T.C.; Olsen, C.; Garofano, L.; Cava, C.; Garolini, D.; Sabedot, T.S.; Malta, T.M.; Pagnotta, S.M.; Castiglioni, I.; et al. TCGAbiolinks: An R/Bioconductor package for integrative analysis of TCGA data. Nucleic Acids Res. 2016, 44, e71. [Google Scholar] [CrossRef] [PubMed]
- Silva, T.C.; Colaprico, A.; Olsen, C.; D’Angelo, F.; Bontempi, G.; Ceccarelli, M.; Noushmehr, H. TCGA Workflow: Analyze cancer genomics and epigenomics data using Bioconductor packages [version 1; referees: 1 approved, 1 approved with reservations]. F1000Research 2016. [Google Scholar] [CrossRef]
- Cava, C.; Colaprico, A.; Graudenzi, A.; Bertoli, G.; Silva, T.C.; Olsen, C.; Noushmehr, H.; Bontempi, G.; Mauri, G.; Castiglioni, I. SpidermiR: Application Examples. Available online: https://www.bioconductor.org/packages/release/bioc/vignettes/SpidermiR/inst/doc/SpidermiRcasestudy.pdf (accessed on 10 September 2016).
- Cava, C.; Colaprico, A.; Graudenzi, A.; Bertoli, G.; Silva, T.C.; Olsen, C.; Noushmehr, H.; Bontempi, G.; Mauri, G.; Castiglioni, I. Working with SpidermiR package. Available online: https://www.bioconductor.org/packages/release/bioc/vignettes/SpidermiR/inst/doc/SpidermiR.html (accessed on 10 September 2016).
- Sales, G.; Coppe, A.; Bisognin, A.; Biasiolo, M.; Bortoluzzi, S.; Romualdi, C. MAGIA, A web-based tool for miRNA and Genes Integrated Analysis. Nucleic Acids Res. 2010, 38, W352–W359. [Google Scholar] [CrossRef] [PubMed]
- Cohen-Gihon, I.; Nussinov, R.; Sharan, R. Comprehensive analysis of co-occurring domain sets in yeast proteins. BMC Genom. 2007, 8, 161. [Google Scholar] [CrossRef] [PubMed]
- Hegyi, H.; Gerstein, M. Annotation transfer for genomics: Measuring functional divergence in multi-domain proteins. Genome Res. 2001, 11, 1632–1640. [Google Scholar] [PubMed]
- Sen, B.; Johnson, F.M. Regulation of SRC family kinases in human cancers. J. Signal Transduct. 2011, 2011, 865819. [Google Scholar] [CrossRef] [PubMed]
- Yang, X.; Du, W.W.; Li, H.; Liu, F.; Khorshidi, A.; Rutnam, Z.J.; Yang, B.B. Both mature miR-17-5p and passenger strand miR-17-3p target TIMP3 and induce prostate tumor growth and invasion. Nucleic Acids Res. 2013, 41, 9688–9704. [Google Scholar] [CrossRef] [PubMed]
- Nishikawa, R.; Goto, Y.; Kojima, S.; Enokida, H.; Chiyomaru, T.; Kinoshita, T.; Sakamoto, S.; Fuse, M.; Nakagawa, M.; Naya, Y.; et al. Tumor-suppressive microRNA-29s inhibit cancer cell migration and invasion via targeting LAMC1 in prostate cancer. Int. J. Oncol. 2014, 45, 401–410. [Google Scholar] [CrossRef] [PubMed]
- Li, J.; Wan, X.; Qiang, W.; Li, T.; Huang, W.; Huang, S.; Wu, D.; Li, Y. MiR-29a suppresses prostate cell proliferation and induces apoptosis via KDM5B protein regulation. Int. J. Clin. Exp. Med. 2015, 8, 5329–5339. [Google Scholar] [PubMed]
- Ru, P.; Steele, R.; Newhall, P.; Phillips, N.J.; Toth, K.; Ray, R.B. miRNA-29b suppresses prostate cancer metastasis by regulating epithelial-mesenchymal transition signaling. Mol. Cancer Ther. 2012, 11, 1166–1173. [Google Scholar] [CrossRef] [PubMed]
- Javed, S.; Langley, S.E. Importance of HOX genes in normal prostate gland formation, prostate cancer development and its early detection. BJU Int. 2014, 113, 535–540. [Google Scholar] [CrossRef] [PubMed]
- Morgan, R.; Boxall, A.; Harrington, K.J.; Simpson, G.R.; Michael, A.; Pandha, H.S. Targeting HOX transcription factors in prostate cancer. BMC Urol. 2014, 14, 17. [Google Scholar] [CrossRef] [PubMed]
- Katoh, Y.; Katoh, M. Comparative integromics on FAT1, FAT2, FAT3 and FAT4. Int. J. Mol. Med. 2006, 18, 523–528. [Google Scholar] [CrossRef] [PubMed]
- Dang, T.T.; Westcott, J.M.; Maine, E.A.; Kanchwala, M.; Xing, C.; Pearson, G.W. ΔNp63α induces the expression of FAT2 and Slug to promote tumor invasion. Oncotarget 2016, 7, 28592–28611. [Google Scholar] [CrossRef] [PubMed]
- Katoh, M. Function and cancer genomics of FAT family genes (review). Int. J. Oncol. 2012, 41, 1913–1918. [Google Scholar] [CrossRef] [PubMed]
- Smolski, M.; Turo, R.; Whiteside, S.; Bromage, S.; Collins, G.N. Prevalence of prostatic calcification subtypes and association with prostate cancer. Urology 2015, 85, 178–181. [Google Scholar] [CrossRef] [PubMed]
- Dudley, A.C.; Khan, Z.A.; Shih, S.C.; Kang, S.Y.; Zwaans, B.M.; Bischoff, J.; Klagsbrun, M. Calcification of multipotent prostate tumor endothelium. Cancer Cell 2008, 14, 201–211. [Google Scholar] [CrossRef] [PubMed]
- Beyer, A.; Bandyopadhyay, S.; Ideker, T. Integrating physical and genetic maps: From genomes to interaction networks. Nat. Rev. Genet. 2007, 8, 699–710. [Google Scholar] [CrossRef] [PubMed]
- Liang, H.; Li, W.H. MicroRNA regulation of human protein protein interaction network. RNA 2007, 13, 1402–1408. [Google Scholar] [CrossRef] [PubMed]
- Lyu, S.; Yu, Q.; Ying, G.; Wang, S.; Wang, Y.; Zhang, J.; Niu, Y. Androgen receptor decreases CMYC and KRAS expression by upregulating let-7a expression in ER−, PR−, AR+ breast cancer. Int. J. Oncol. 2014, 44, 229–237. [Google Scholar] [PubMed]
- Kim, S.J.; Oh, J.S.; Shin, J.Y.; Lee, K.D.; Sung, K.W.; Nam, S.J.; Chun, K.H. Development of microRNA-145 for therapeutic application in breast cancer. J. Control. Release 2011, 155, 427–434. [Google Scholar] [CrossRef] [PubMed]
- Maqbool, R.; Rashid, R.; Ismail, R.; Niaz, S.; Chowdri, N.A.; Hussain, M.U. The carboxy-terminal domain of connexin 43 (CT-Cx43) modulates the expression of p53 by altering miR-125b expression in low-grade human breast cancers. Cell. Oncol. 2015, 38, 443–451. [Google Scholar] [CrossRef] [PubMed]
- Csardi, G.; Nepusz, T. The igraph software package for complex network research. Int. J. Complex Syst. 2006, 1695, 1–9. [Google Scholar]
- Gandrud, C.; Allaire, J.J.; Russell, K.; Lewis, B.W.; Kuo, K.; Sese, C.; Ellis, P.; Owen, J.; Rogers, J. NetworkD3: D3 JavaScript Network Graphs from R 2015. Available online: https://CRAN.R-project.org/package=networkD3 (accessed on 10 September 2016).


| Features | Sub-Features | SpidermiR | GeneMANIA | miRNATap | multiMir | Magia2 |
|---|---|---|---|---|---|---|
| Availability | Platform | B | W | B | R | W |
| Functions for data query/download/annotation harmonization | ● | ● | ● | ● | ||
| Functions for GRNs enrichment | ● | ● | ||||
| Functions for interaction selection | ● | ● | ||||
| Functions for community detection | ● | |||||
| Functions for miRNA–GRNs graphics | ● | ● | ||||
| Functions for computation of miRNA–GRNs metrics | ● | ● | ||||
| Expression level | ● | ● | ||||
| Interaction Type | Predicted miRNA–gene | ● | ● | ● | ● | |
| Validated miRNA–gene | ● | ● | ● | |||
| Disease–miRNA | ● | ● | ||||
| miRNA–gene–drug | ● | ● | ||||
| Extracellular/circulating miRNA | ● | |||||
| Predicted gene–gene | ● | ● | ● * | |||
| Validated gene–gene | ● ** | ● ** | ||||
| Validated protein–protein | ● *** | ● *** | ||||
| Validated gene–gene–miRNA | ● | |||||
| Validated protein–protein–miRNA | ● | |||||
| Predicted gene–gene–miRNA | ● | ● * |
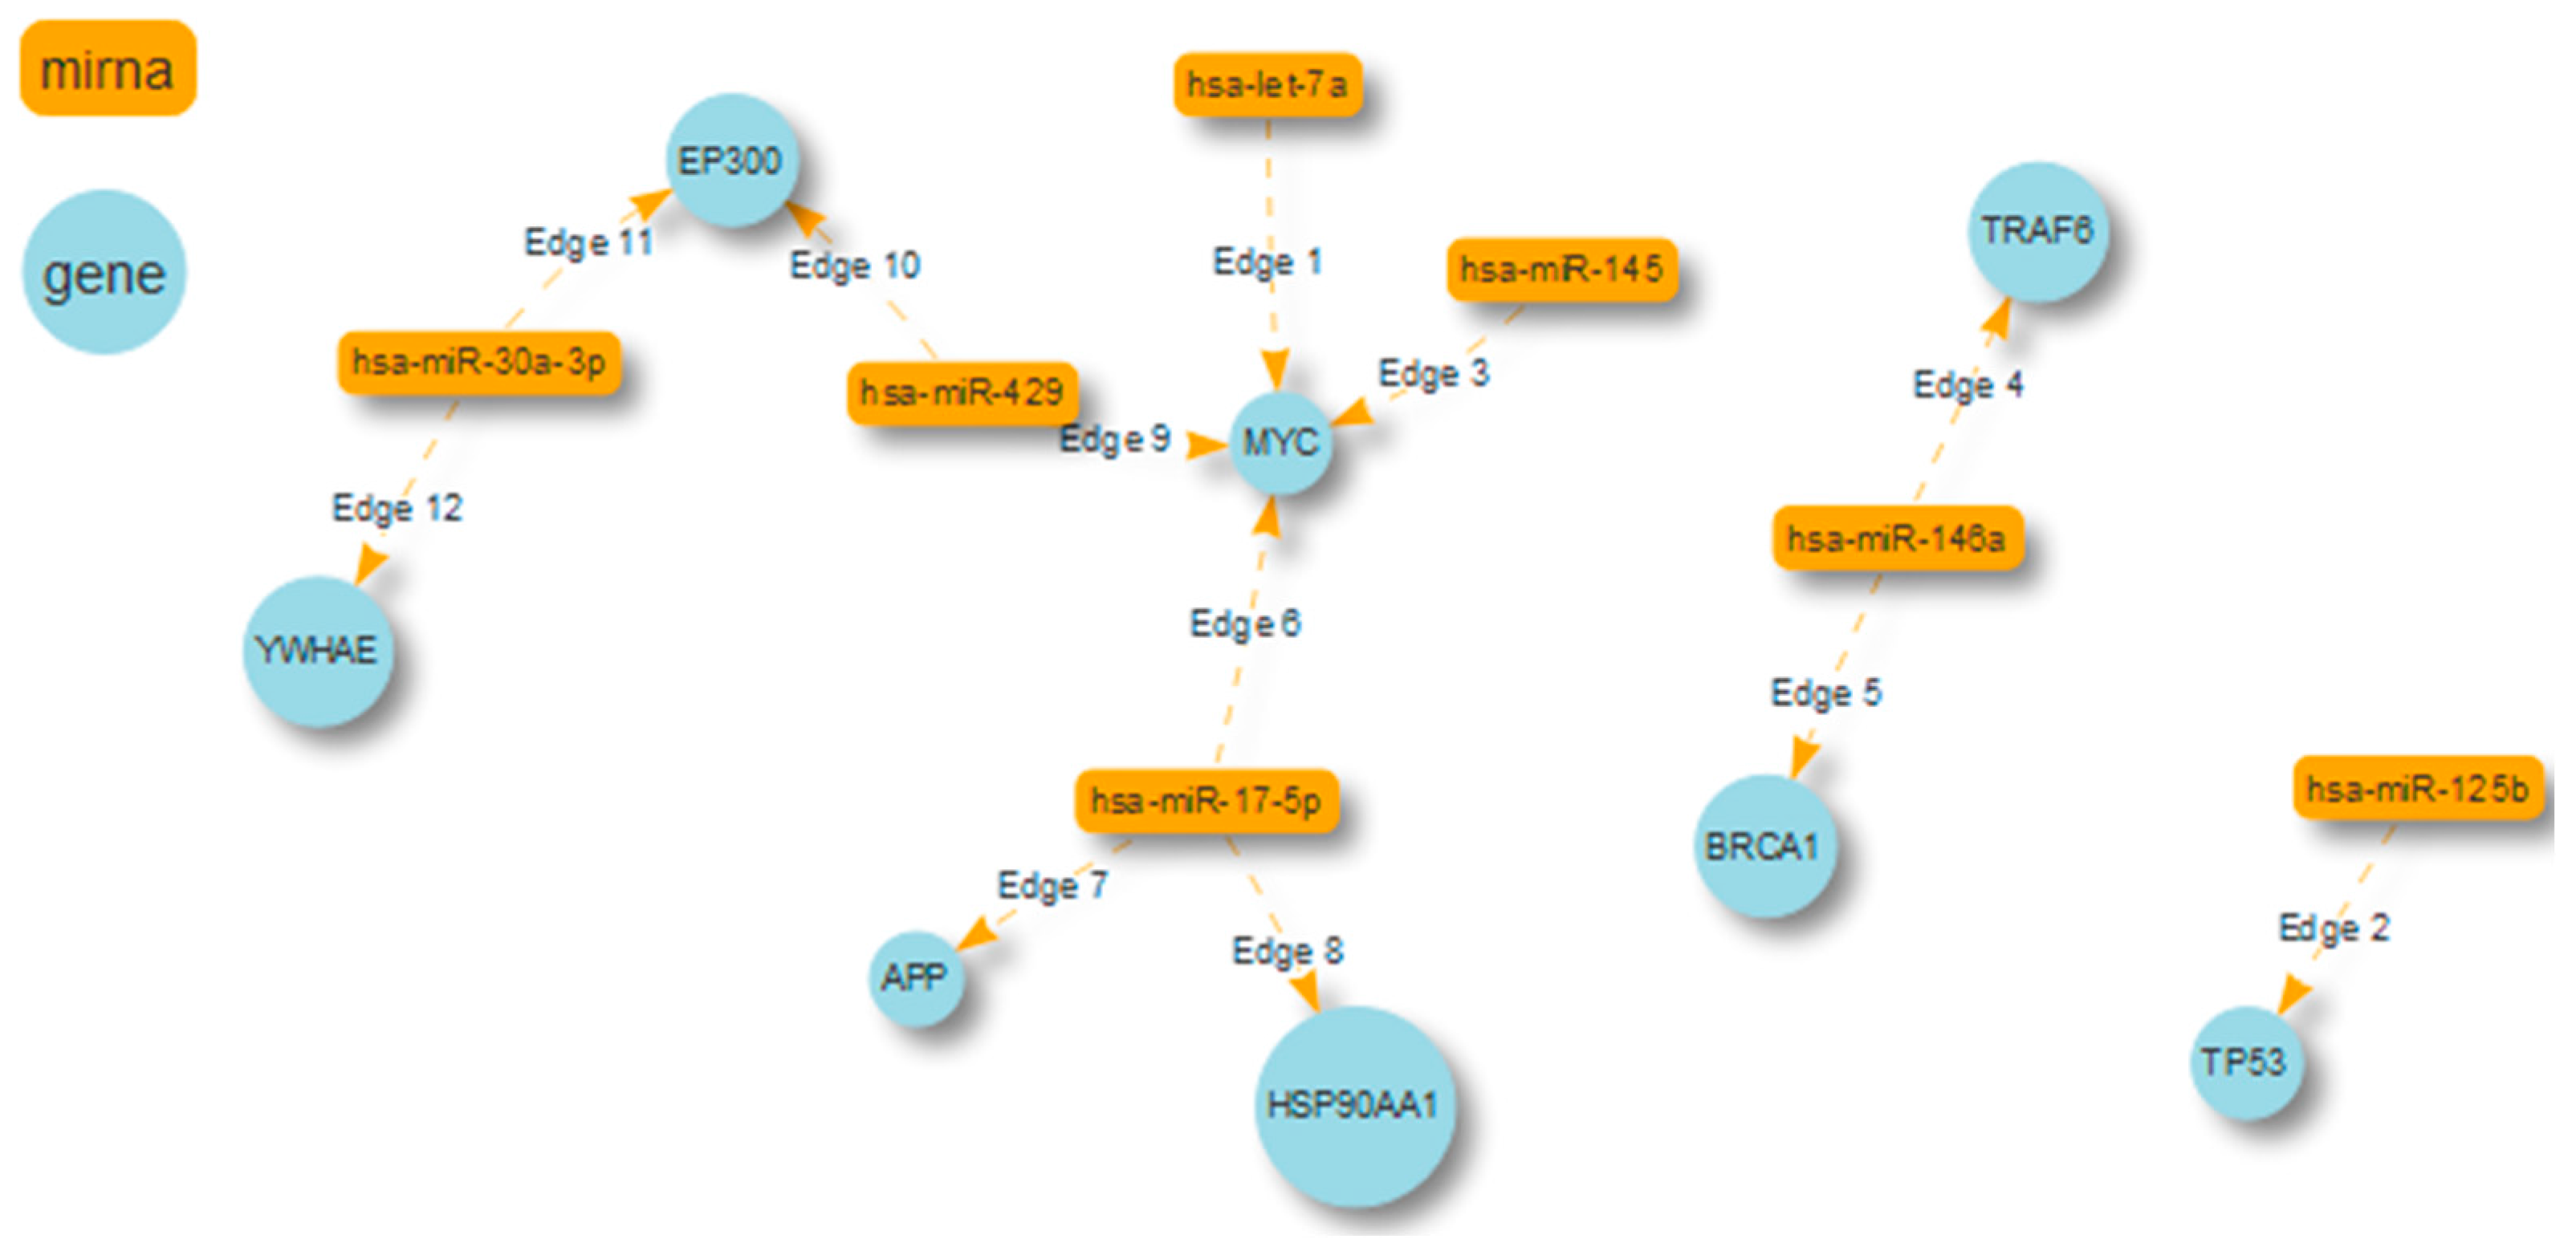
| miRNA | Target Protein |
|---|---|
| miR-17-5p (d.c.296) | APP (d.c. 2008) HSP90AA1 (d.c. 773) MYC (d.c. 570) |
| miR-125b (d.c.55) | TP53 (d.c. 630) |
| miR-146a (d.c.38) | TRAF6 (d.c. 517) BRCA1 (d.c. 416) |
| miR-30a-3p (d.c.28) | EP300 YWHAE (d.c. 390) |
| let-7a (d.c. 26) | MYC (d.c. 570) |
| miR-429 (d.c.26) | MYC EP300 (d.c. 492) |
| miR-145 (d.c.23) | MYC |
© 2017 by the authors. Licensee MDPI, Basel, Switzerland. This article is an open access article distributed under the terms and conditions of the Creative Commons Attribution (CC BY) license ( http://creativecommons.org/licenses/by/4.0/).
Share and Cite
Cava, C.; Colaprico, A.; Bertoli, G.; Graudenzi, A.; Silva, T.C.; Olsen, C.; Noushmehr, H.; Bontempi, G.; Mauri, G.; Castiglioni, I. SpidermiR: An R/Bioconductor Package for Integrative Analysis with miRNA Data. Int. J. Mol. Sci. 2017, 18, 274. https://0-doi-org.brum.beds.ac.uk/10.3390/ijms18020274
Cava C, Colaprico A, Bertoli G, Graudenzi A, Silva TC, Olsen C, Noushmehr H, Bontempi G, Mauri G, Castiglioni I. SpidermiR: An R/Bioconductor Package for Integrative Analysis with miRNA Data. International Journal of Molecular Sciences. 2017; 18(2):274. https://0-doi-org.brum.beds.ac.uk/10.3390/ijms18020274
Chicago/Turabian StyleCava, Claudia, Antonio Colaprico, Gloria Bertoli, Alex Graudenzi, Tiago C. Silva, Catharina Olsen, Houtan Noushmehr, Gianluca Bontempi, Giancarlo Mauri, and Isabella Castiglioni. 2017. "SpidermiR: An R/Bioconductor Package for Integrative Analysis with miRNA Data" International Journal of Molecular Sciences 18, no. 2: 274. https://0-doi-org.brum.beds.ac.uk/10.3390/ijms18020274