Article

Validation and Evaluation of Reference Genes for Quantitative Real-Time PCR in Macrobrachium Nipponense

1
Wuxi Fishery College, Nanjing Agricultural University, Wuxi 214081, China
2
Key Laboratory of Freshwater Fisheries and Germplasm Resources Utilization, Ministry of Agriculture, Freshwater Fisheries Research Center, Chinese Academy of Fishery Sciences, Wuxi 214081, China
*
Author to whom correspondence should be addressed.
Int. J. Mol. Sci. 2018, 19(8), 2258; https://0-doi-org.brum.beds.ac.uk/10.3390/ijms19082258
Submission received: 28 June 2018 / Revised: 26 July 2018 / Accepted: 30 July 2018 / Published: 1 August 2018
(This article belongs to the Section Biochemistry)

Abstract

:
Quantitative real-time PCR (qPCR) is widely used in molecular biology, although the accuracy of the quantitative results is determined by the stability of the reference genes used. Recent studies have investigated suitable reference genes for some crustaceans under various conditions, but studies in Macrobrachium nipponense are currently lacking. In this study, we selected the following seven genes from among 35 commonly used housekeeping genes as candidate qPCR reference genes for temporal and spatial expression: EIF (eukaryotic translation initiation factor 5A), 18S (18S ribosomal RNA), EF-1α (elongation factor-1α), GAPDH (glyceraldehyde-3-phosphate dehydrogenase), TUB (α-tubulin), β-act (β-actin), and RPL18 (Ribosomal protein L18). The stability of each reference gene was evaluated by GeNorm, NormFinder, BestKeeper, and comparative ∆C t methods, and was comprehensively ranked using RefFinder. RPL18 was shown to be the most suitable reference gene for adult M. nipponense tissues, while EIF was the most stable in different ovarian and embryo stages and in white spot syndrome virus infection, and β-act was the most stable reference gene under hypoxia stress. The reliability of the rankings was confirmed by RNA interference experiments. To the best of our knowledge, this represents the first systematic analysis of reference genes for qPCR experiments in M. nipponense, and the results will provide invaluable information for future research in closely related crustaceans.

Graphical Abstract

1. Introduction

Quantitative real-time PCR (qPCR) is a widely used technique for investigating gene expression levels, with high accuracy and sensitivity, as well as a wide application. Real-time PCR can involve relative or absolute quantification methods, of which the relative quantification is simple and accurate [1,2]. Housekeeping genes (HKGs), as known as reference genes [3], are used to account for alignment errors (e.g., as a result of the differences in RNA concentration, efficiencies, and reverse transcription), thus allowing the expression levels of the target gene to be calculated relative to the housekeeping gene [4,5,6]. However, the appropriate reference genes need to be searched and used for specific experimental conditions, because there is no perfect reference gene that maintains a stable expression in all of the tissues and conditions [7,8]. Furthermore, the use of inappropriate reference genes may result in conflicting gene expression data for different tissues or situations [9,10].
Molecular research in crustacean has become popular in recent years, and numerous studies have examined the growth, development, reproduction, and sex differentiation of crustaceans [11]. qPCR has been widely used in these studies, and some research has been carried out to screen and identify suitable reference genes in crustaceans. One study showed that the commonly used reference gene β-act was not the most stable reference gene in Penaeus stylirostris infected with white spot syndrome virus (WSSV) [12]. In Peneaus monodon, the appropriate reference gene for the reproductive gene expression profile was identified [13]. Furthermore, the reference genes were screened before starting a quantitative study of heat-shock responses in Palaemonetes varians [14], while studies in Macrobrachium rosenbergii and Macrobrachium olfersii showed that reference genes were not universal, and the most appropriate reference gene depended on the specific conditions [15,16].
The oriental river prawn Macrobrachium nipponense is widely distributed in freshwater and low-salinity estuarine regions in China, and is of great market value. Although many molecular studies have investigated the reproduction, sexual control, stress, and nutrition in M. nipponense [17,18,19], most qPCR studies were performed using reference genes from other similar species without identification and verification, potentially leading to inaccurate results. It is therefore essential to screen for suitable specific reference genes in M. nipponense under different experimental conditions.
In the current study, we investigated several reference genes based on other model animals and crustaceans. After comparing them with the M. nipponense transcriptome data and gel electrophoresis detection, we identified seven candidate reference genes in the M. nipponense transcriptome library. We then measured the expression stability of those genes in different adult tissues, ovarian and embryo stages, under hypoxia stress, and in white spot syndrome virus (WSSV) infection, and analyzed the results using GeNorm [20], NormFinder [20], BestKeeper [21], and the comparative ∆Ct method [22], and ranked them using the web-based comprehensive tool RefFinder [23]. We also performed RNA interference (RNAi) experiments to verify the accuracy of the screened reference genes by detecting the expression of SST (slow-tonic S2 tropomyosin) gene before and after the RNAi, using difference reference genes for normalization. This study represents the first comprehensive systematic screening of reference genes for M. nipponense based on experiments involving temporal and spatial expression and stress. Furthermore, it also provides the first results of the reference gene screening and the verification of reference genes by RNAi experiments in crustaceans. The results of this study fill a gap in the M. nipponense-related research, thus increasing the accuracy and reliability of future research into the expression of target genes, and providing a useful reference for studies in other crustaceans.

2. Results

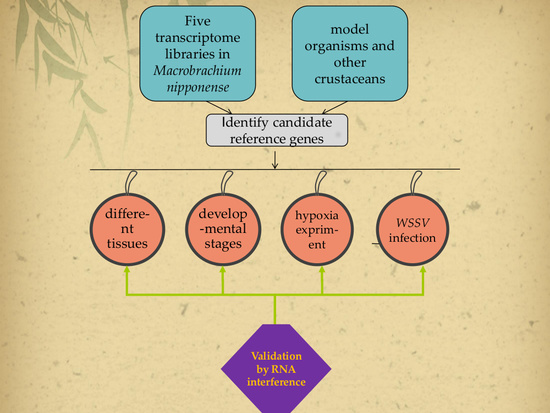
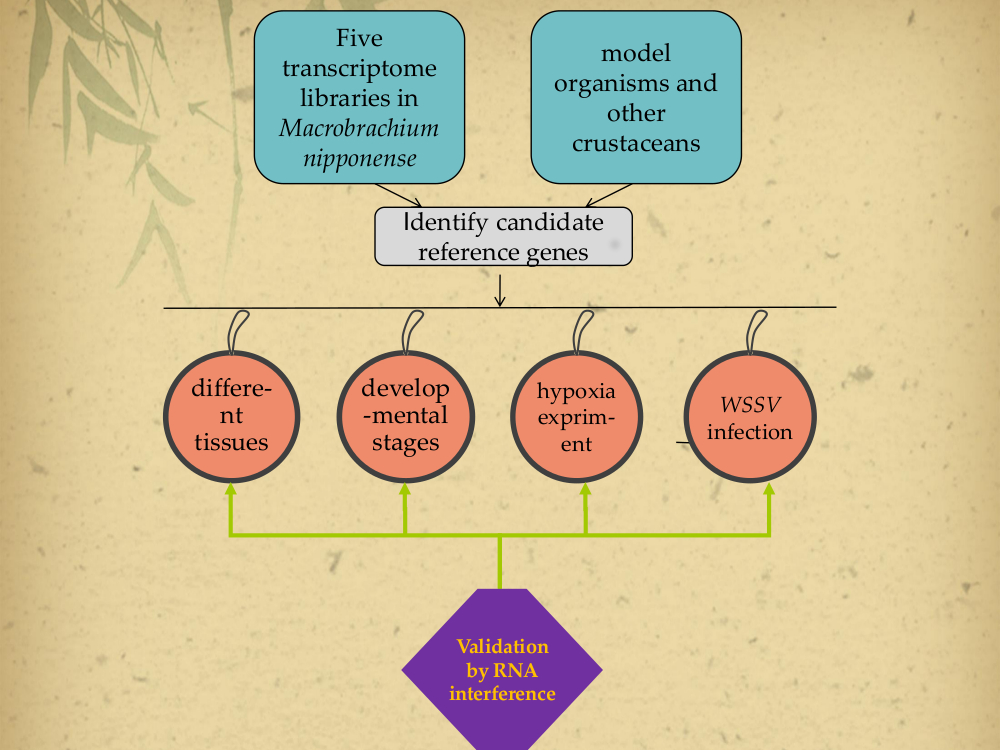
2.1. Selection of Target Internal Reference Genes

Based on previous research in model organisms (Danio rerio, Mice, Bactrocera dorsalis, and Oryza sativa) and crustaceans (Procambarus clarkia, Macrobrachium rosenbergii, and Macrophthalmus japonicas), we screened 35 candidate genes in the transcriptome libraries of M. nipponense [24,25,26,27]. Fifteen of the genes were ubiquitously expressed in different tissue libraries and passed the BLAST test. Further screening identified seven reference genes with effective specificity and amplification, EIF (eukaryotic translation initiation factor 5A), 18S (18S ribosomal RNA), EF-1α (elongation factor-1α), GAPDH (glyceraldehyde-3-phosphate dehydrogenase), TUB (α-tubulin), β-act (β-actin), and RPL18 (Ribosomal protein L18). The open reading frames of these sequences were verified using the primers in Table A1. The sequences of the candidate genes were submitted to NCBI GenBank (Table A1).

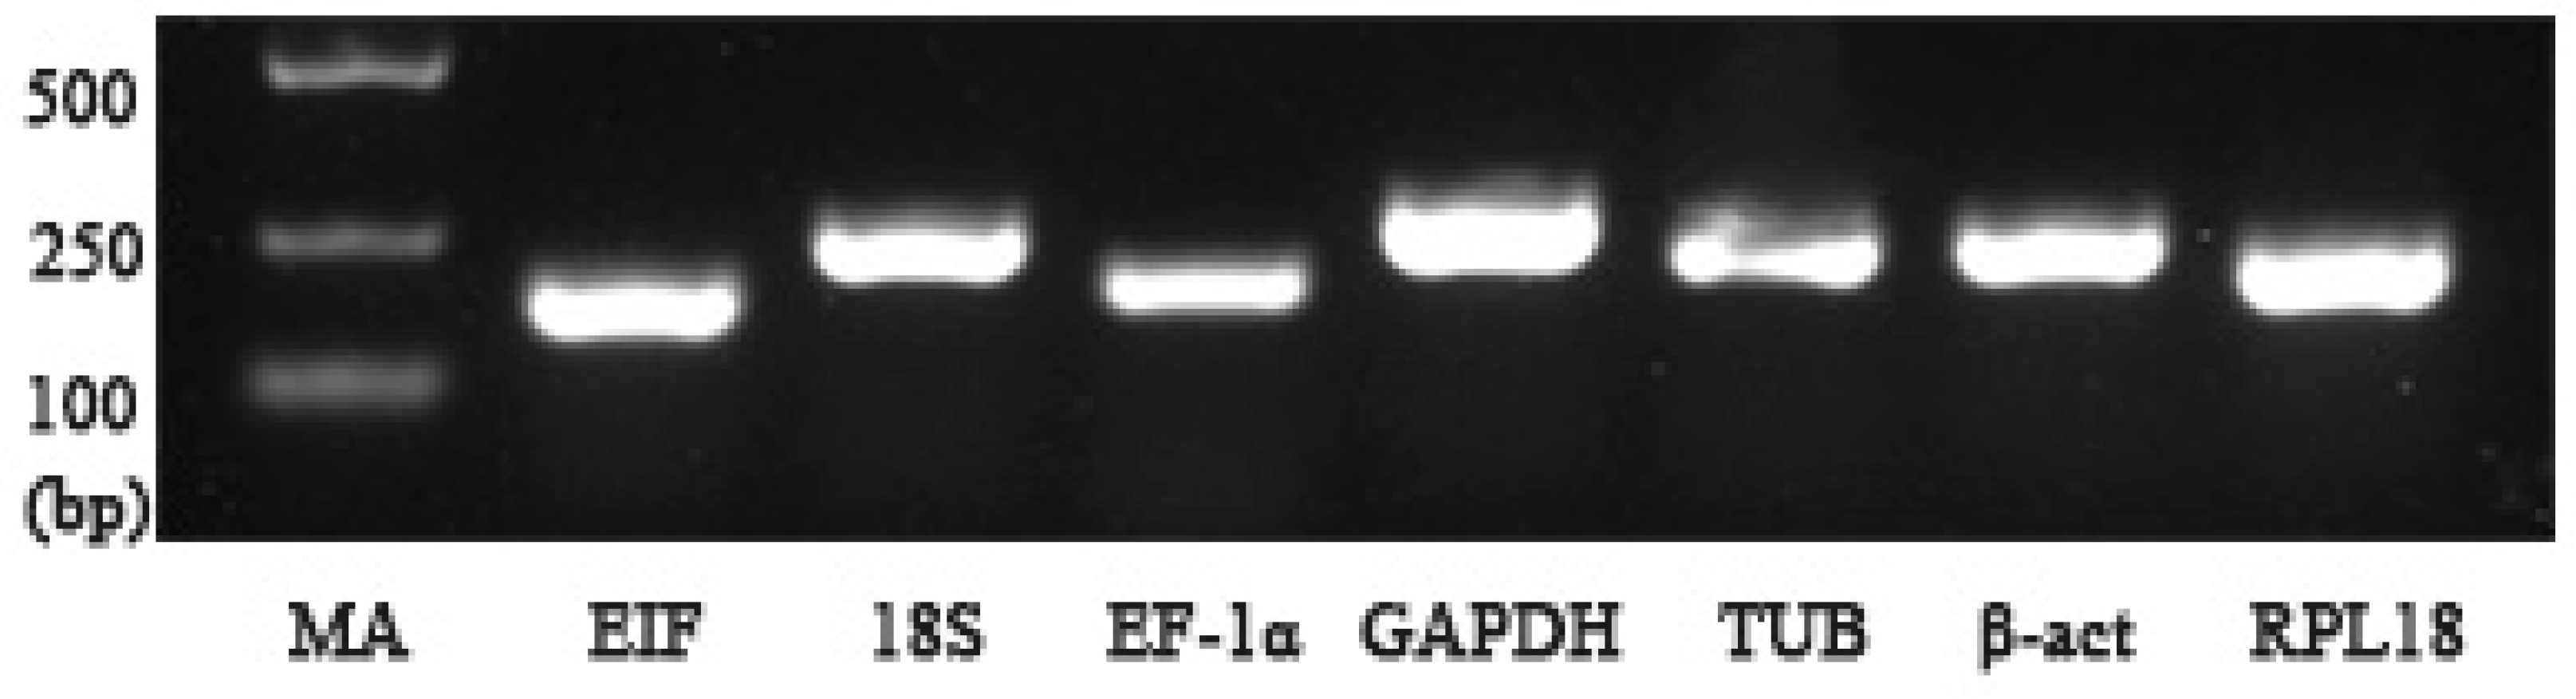
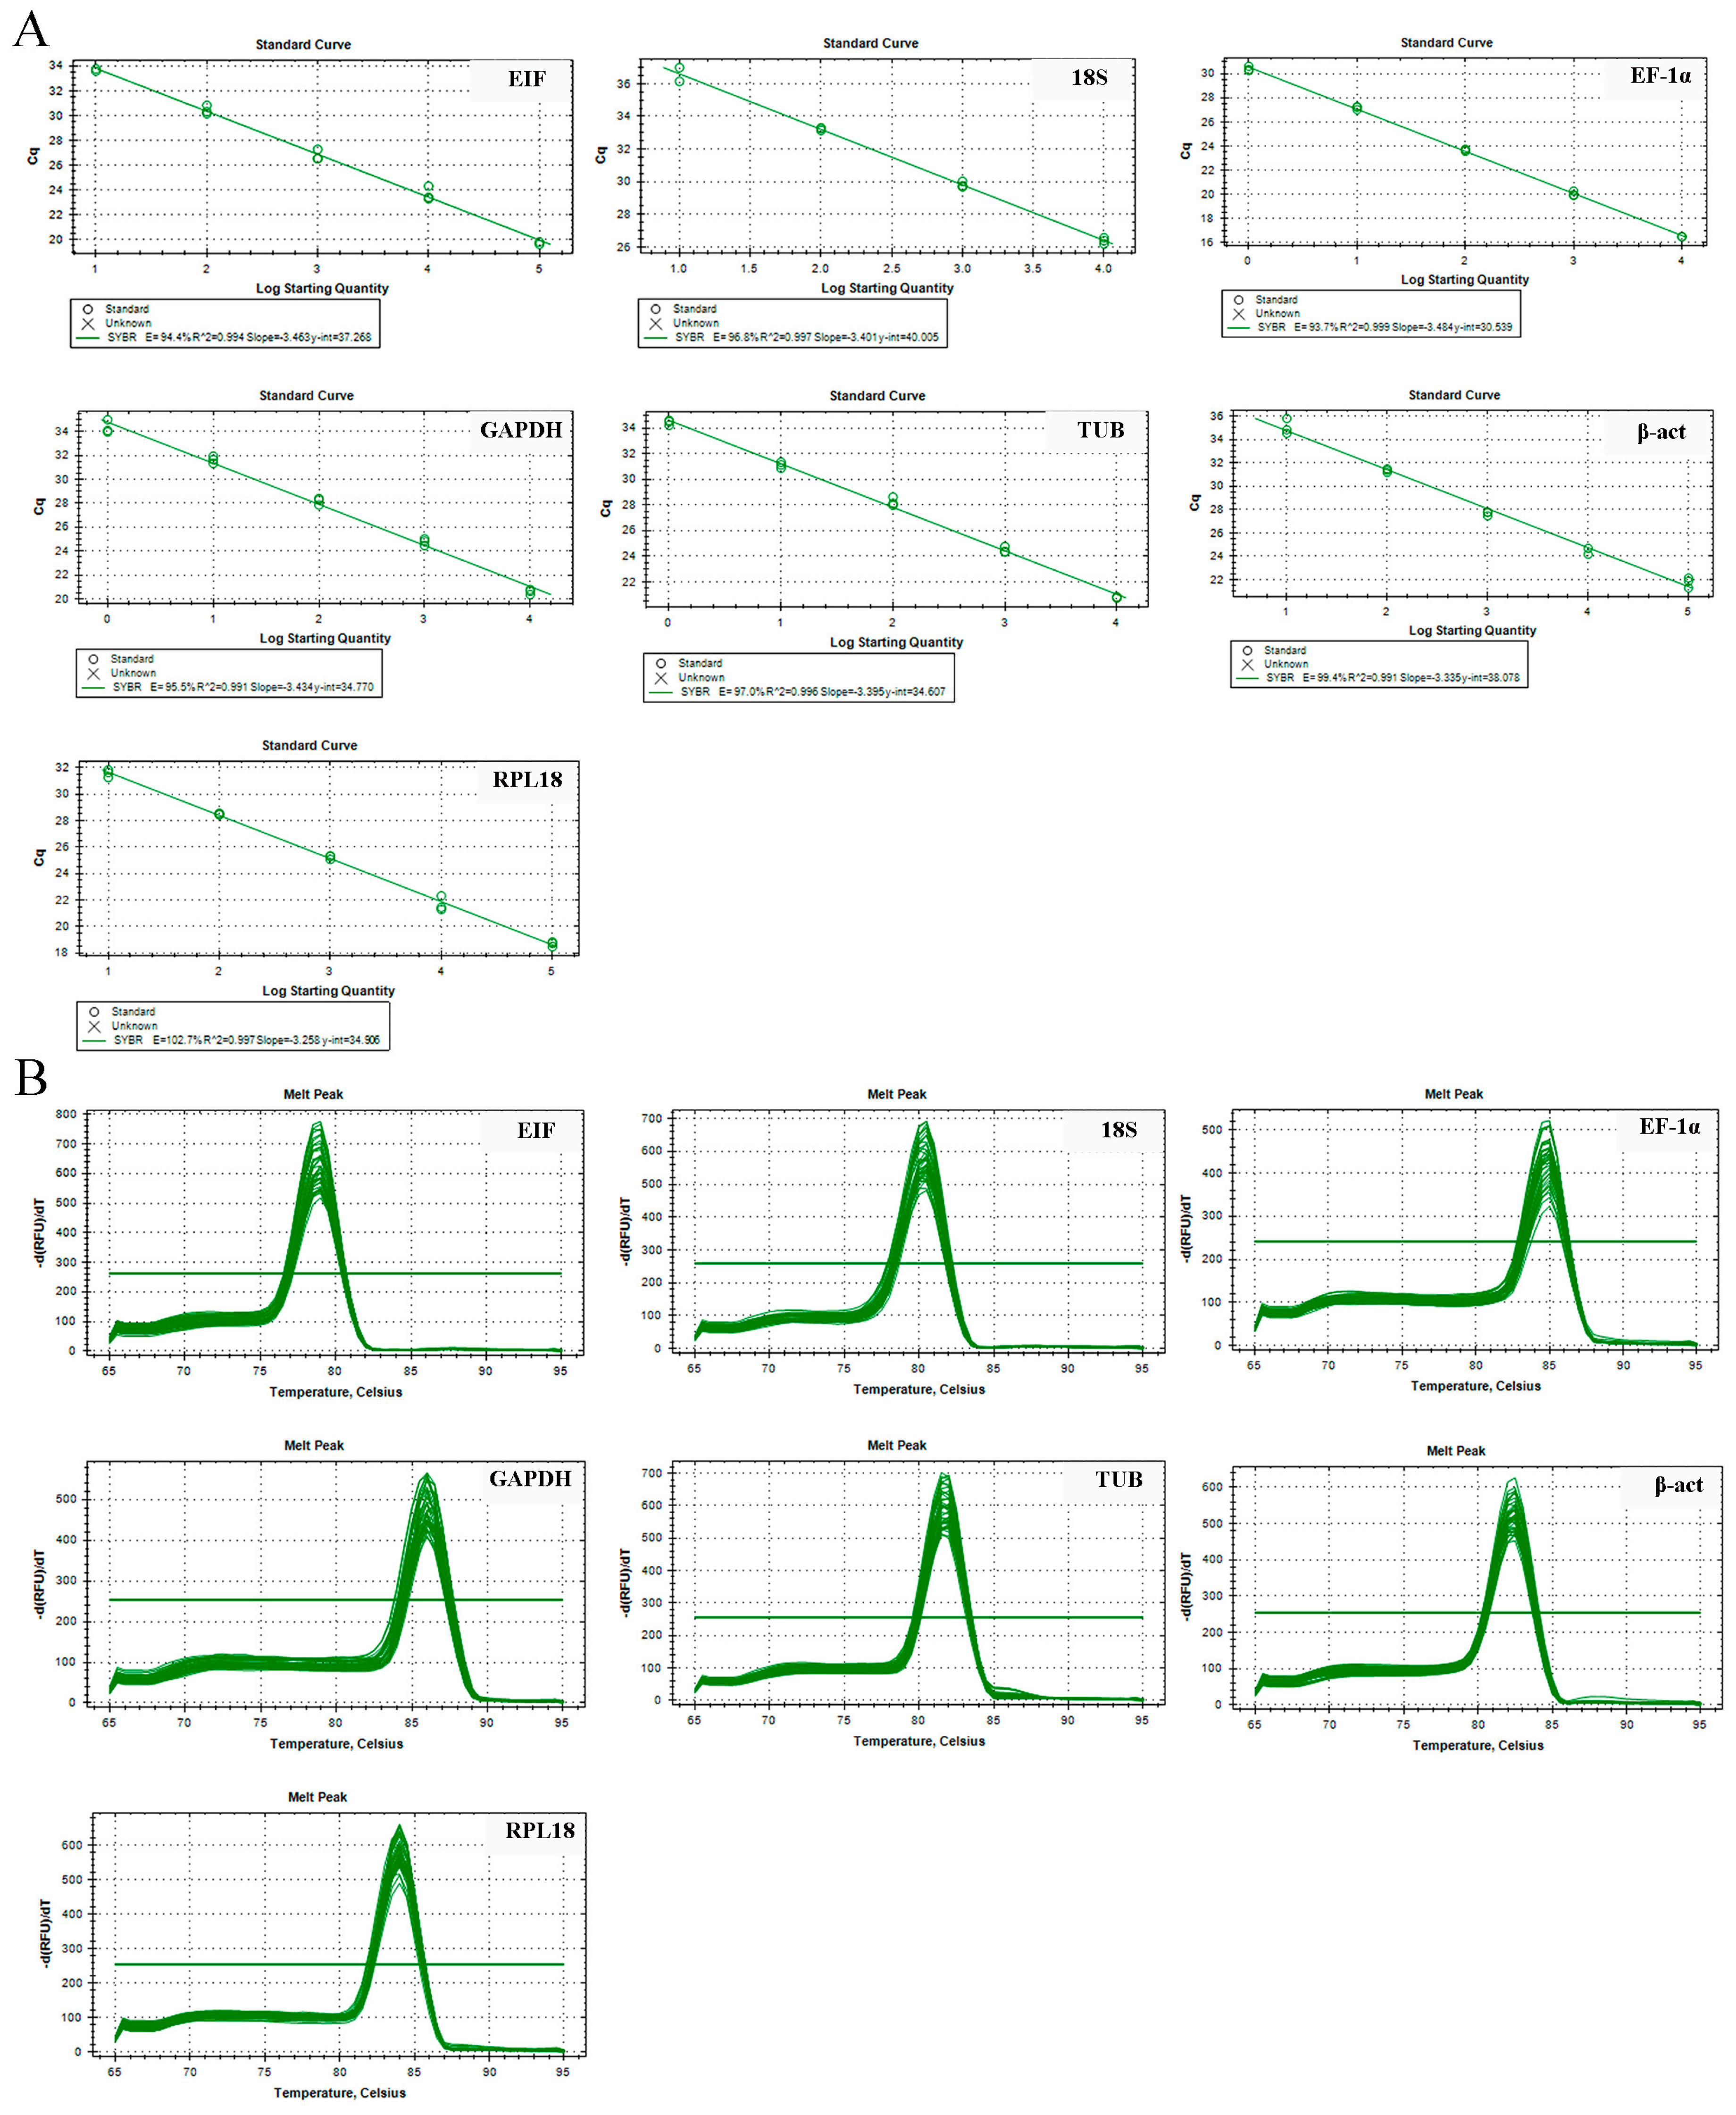
2.2. Primer Specificity and Amplification Efficiency for qPCR

The qPCR primer pairs of each reference gene are presented in Table 1. The specificity of each single PCR product was confirmed by 1.2% agarose gel electrophoresis (Figure 1), and was matched with their sizes. The amplification efficiencies of these primers ranged from 0.93–1.02 (Table 1) and the standard curve for each gene from the cDNA dilutions displayed R2 > 0.99 (Figure 2A); each primer produced a single melting peak (Figure 2B), reflecting their stability and specificity [3].

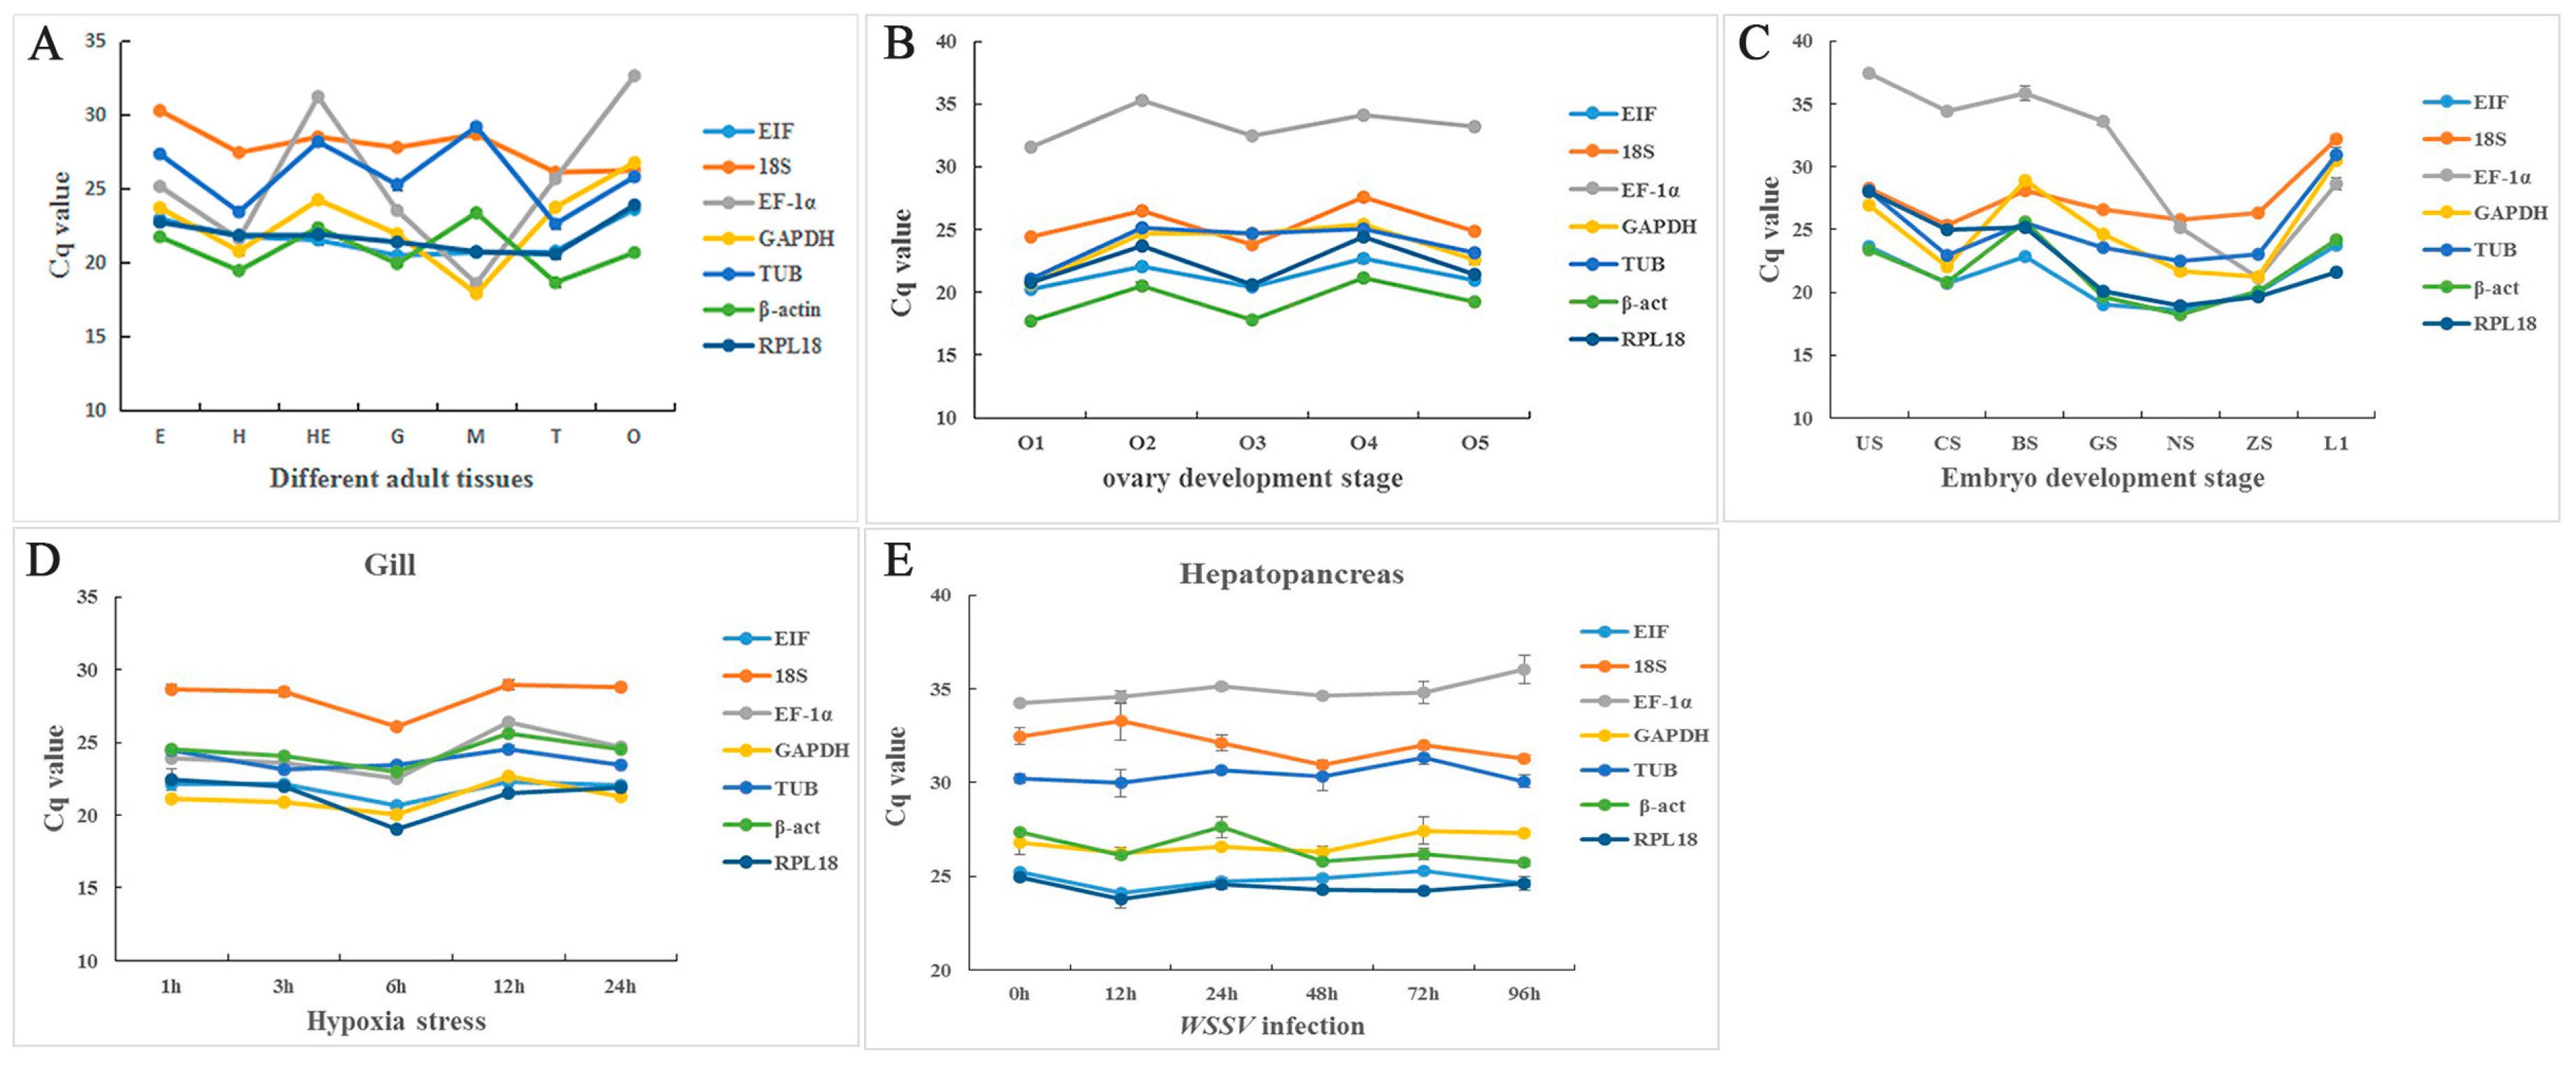
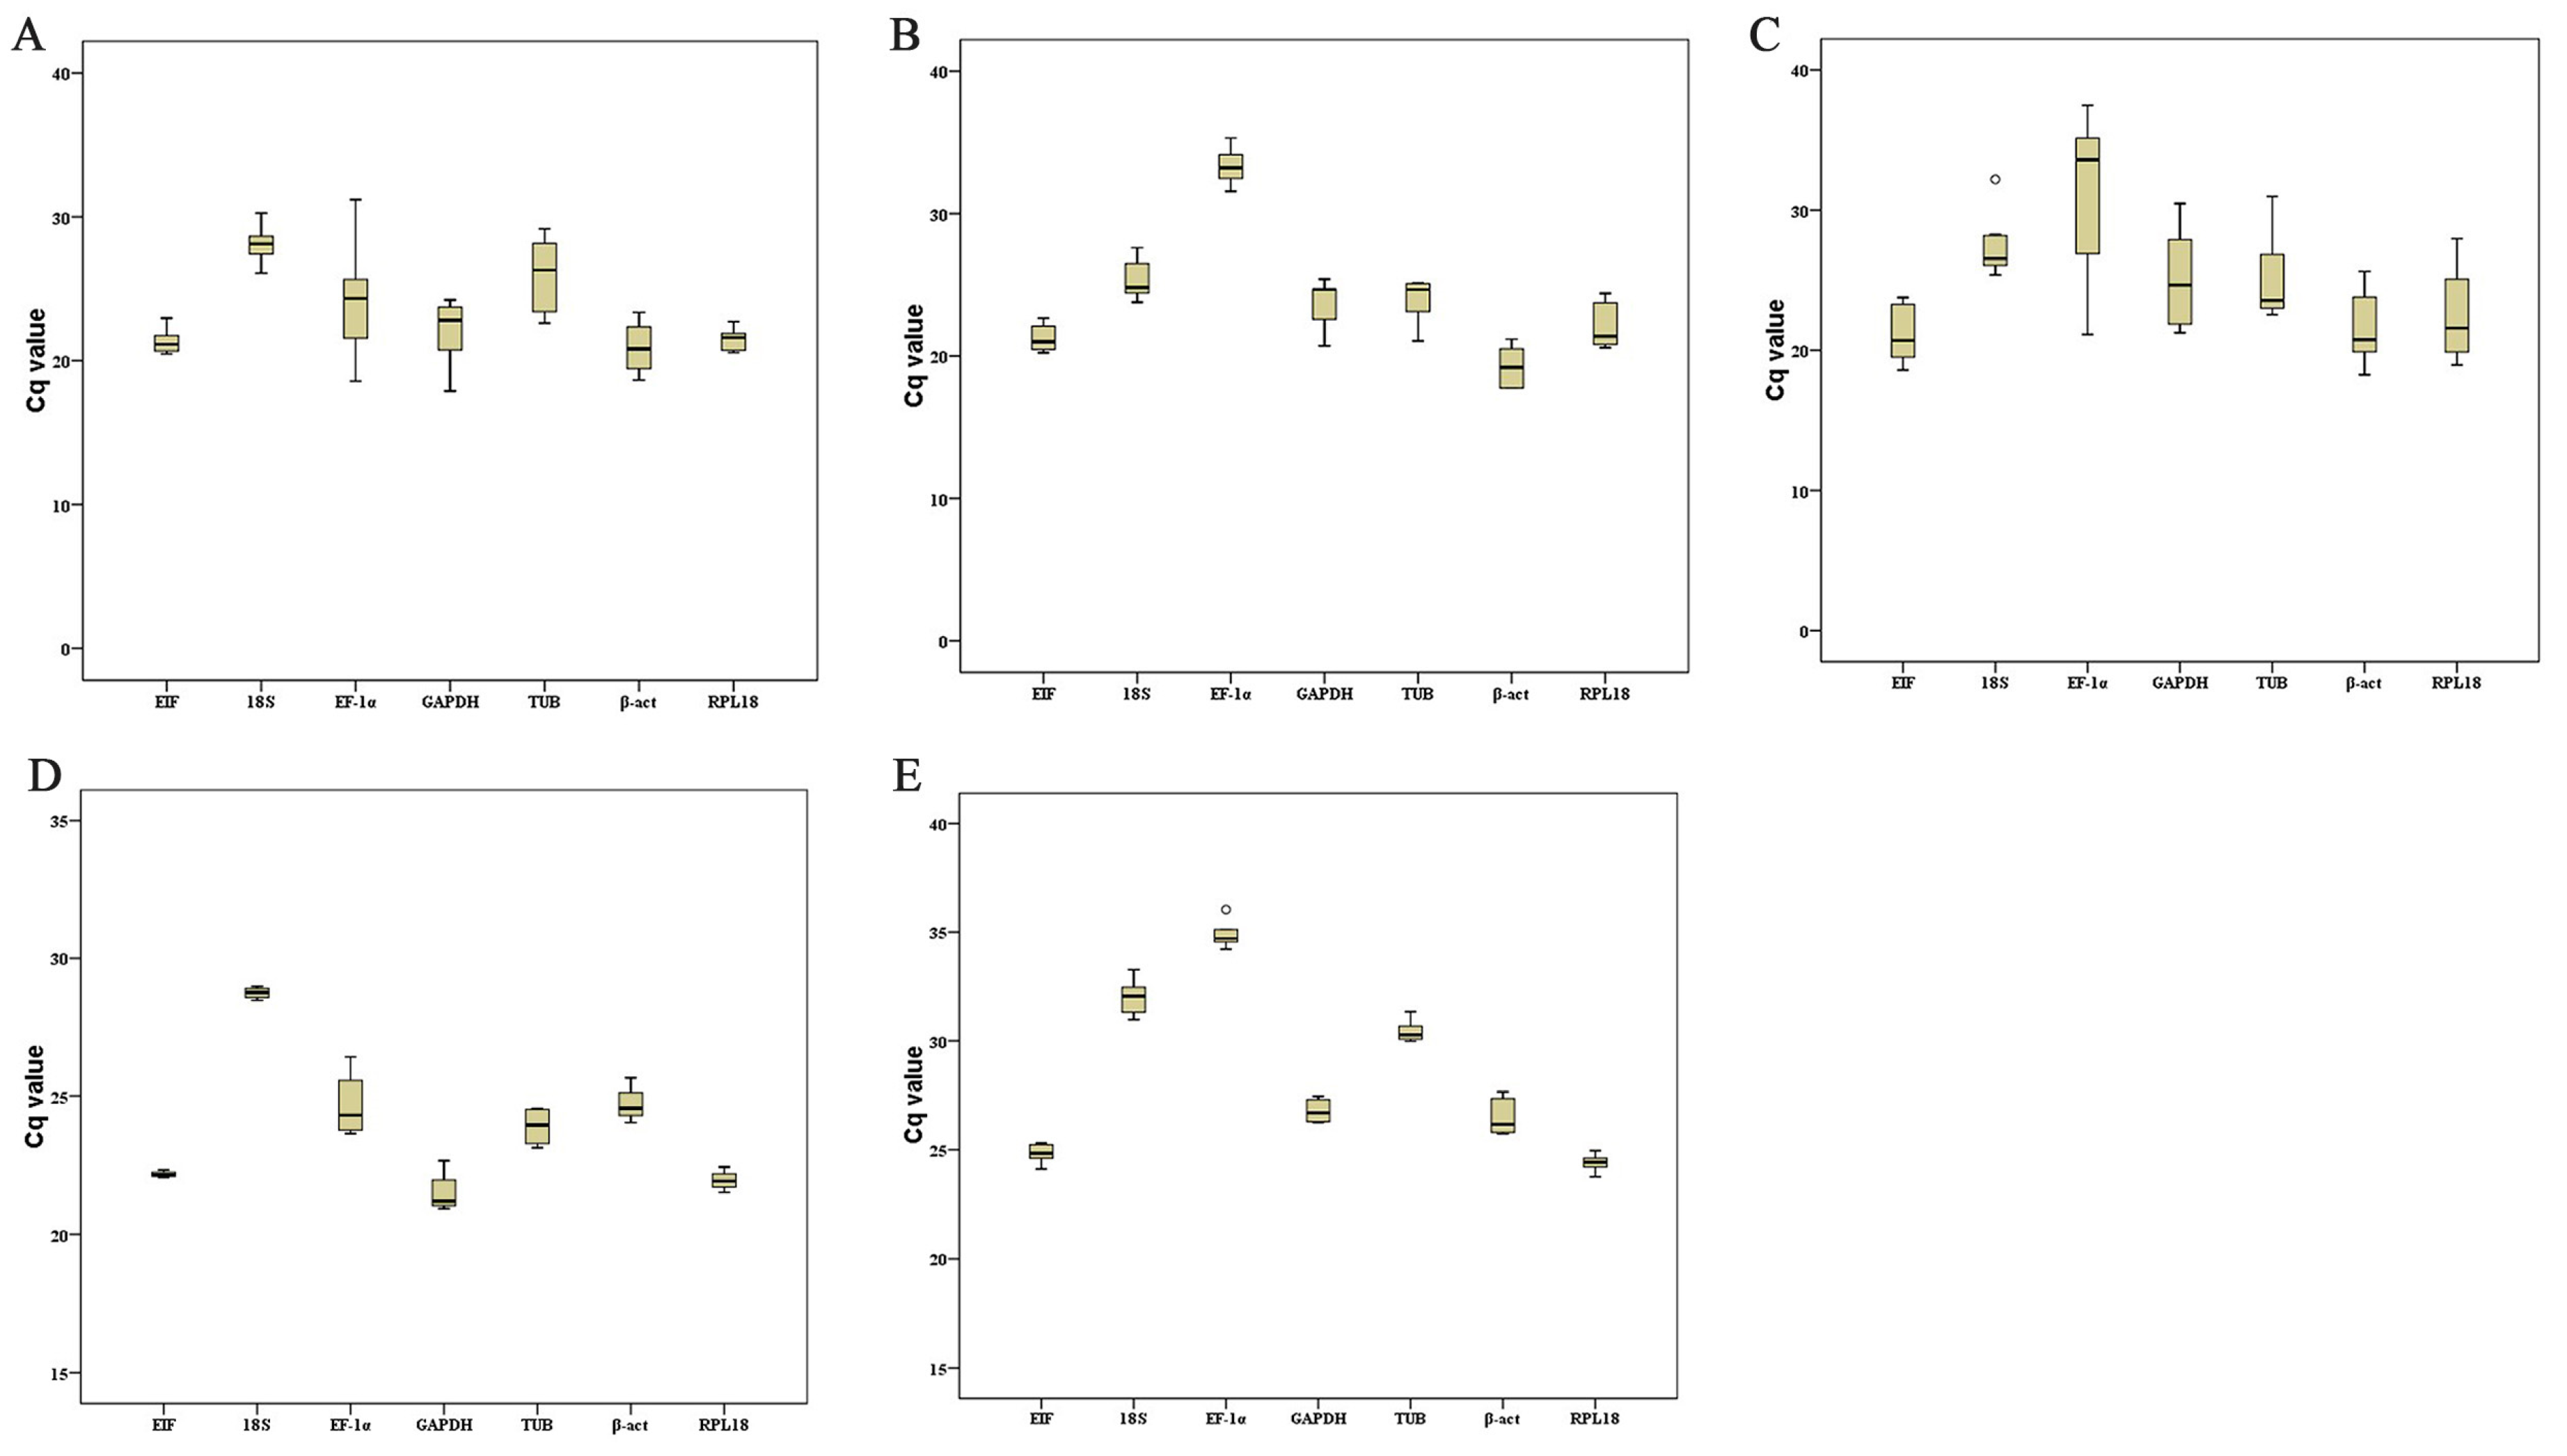
2.3. Distribution of Cycle Threshold (Cq) Values

The detailed Cq values are presented in Table 2. The Cq values of these candidates’ reference genes ranged from 17.75 (β-act) and 37.48 (EF-1α). A high Cq value represented a low expression level [3], indicating that in seven genes, EIF, β-act, and RPL18 had the highest expression levels, and EF-1α and 18S had the lowest levels.
The quantitative expression levels of each reference gene under various tissues and conditions, according to their Cq value, were represented by line charts and boxplots. The line charts showed that the reference genes remained stable within each tissue under different conditions, while some genes varied widely among different tissues, such as EF-1α in adult and embryonic tissue (Figure 3). The overall distribution and data dispersion [28] are illustrated by boxplots. These plots indicated that EIF, RPL18, β-act, and TUB showed small discrete fluctuations, while EF-1α and GAPDH varied widely between the adult tissues and embryo development stages (Figure 4).

2.4. Stability Analysis

We analyzed the stabilities of the reference genes using four commonly used methods, comparative ∆Ct, BestKeeper, NormFinder, and GeNorm [20,21,22,23] (Table A2 and Table A3). Comparative ∆Ct, BestKeeper, and NormFinder recommended RPL18 as the most stable reference gene in different adult tissues, while GeNorm identified that the combination of EIF and RPL18 as the most stable genes. TUB, GAPDH, and EF-1α were the least stable genes according to all four methods. The comparative ∆Ct identified β-act as the most stable gene in the different ovarian stages, while BestKeeper and NormFinder considered EIF to be the best, and GeNorm considered the combination of 18S/RPL18 as the most stable target. GAPDH was the least stable gene according to all of these methods. Comparative ∆Ct and NormFinder considered EIF as the best reference gene in different embryonic stages, while BestKeeper picked 18S and GeNorm chose the combination of 18S/TUB. GAPDH, RPL18, and EF-1α were ranked the least stable. The comparative ∆Ct and NormFinder ranked β-act as the most stable reference gene in the M. nipponense gills under various durations of hypoxic stress, compared with EIF and GAPDH/β-act, according to GeNorm. EF-1α was not considered to be suitable in this situation. In the case of a WSSV infection, BestKeeper and NormFinder selected RPL18, comparatively ∆Ct picked EIF, and GeNorm selected EIF/TUB as the best reference genes, while all four ranked β-act and 18S as the least stable.
The comprehensive scores for these methods were ranked using RefFinder to give a total ranking (Figure 5) [23]. The genes ranked from most- to least-stable in the adult M. nipponense tissues were RPL18, EIF, 18S, β-act, TUB, GAPDH, and EF-1α. The equivalent ranking in the different ovarian stages was EIF, β-act, RPL18, 18S, EF-1α, TUB, and GAPDH, while that in the different embryonic stages was EIF, 18S, β-act, TUB, GAPDH, RPL18, and EF-1α. The most- to least-stable genes under hypoxic stress were β-act, GAPDH, EIF, 18S, TUB, EF-1α, and RPL18. EIF and RPL18 were ranked highly under WSSV infection, followed by TUB and GAPDH, while EF-1α, β-act, and 18S were not considered to be stable.

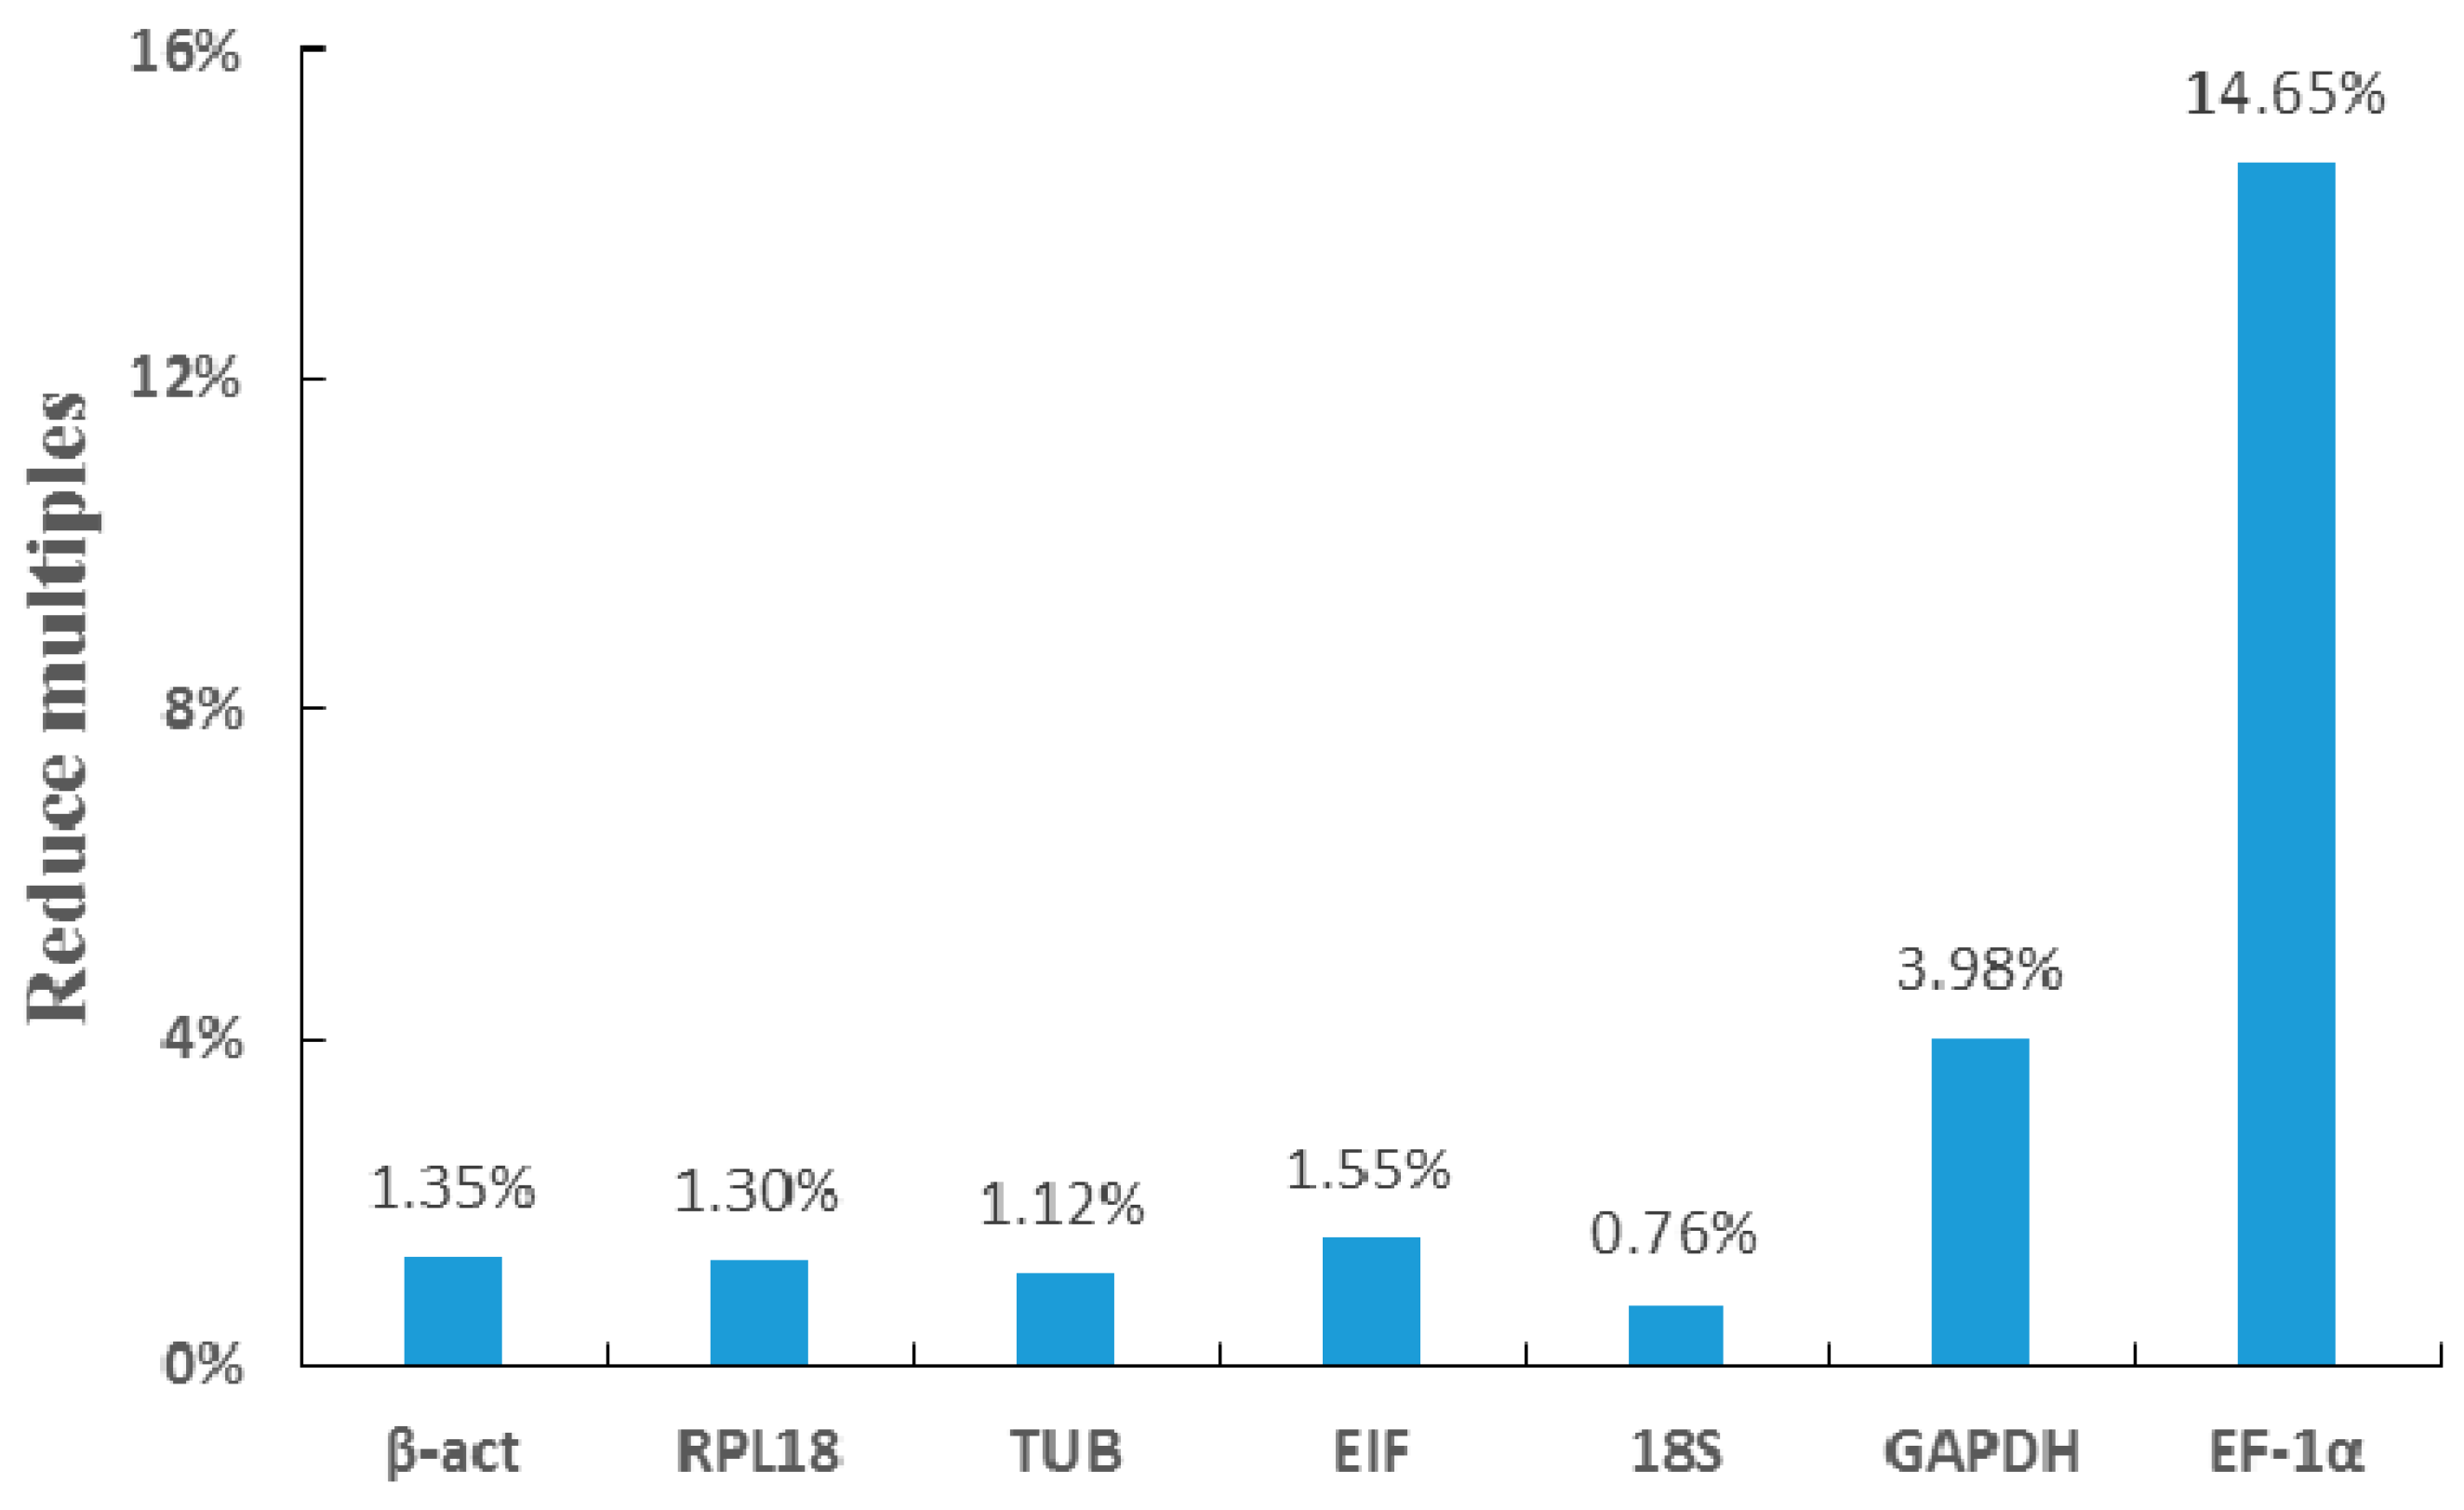
2.5. Validation of the Selected Reference Genes by RNAi

We confirmed the selected reference genes and verified their rankings based on qPCR by RNAi, which could reliably decrease the expression level of the target gene in M. nipponense [29,30]. The SST expression in the androgenic glands in M. nipponense was predicted to decrease by >90% over seven days after RNAi. qPCR was performed to measure the expression difference in the expression levels based on different reference genes. The Cq values show that the difference in the tissue expression was not significant before and after the experiment, except EF-1α and GAPDH (Table 3). The three most stable reference genes were β-act, RPL18, and TUB (Table 4, Figure 6), and the expression of SST, measured using different reference genes, were reduced to 1.35%, 1.20%, and 1.12%, respectively (Figure 7), which confirms the success of the interference experiment. β-act was chosen as the best reference gene, which indicated a decrease in expression of SST to 1.35%. EF-1α was considered the least stable gene, and indicated a decrease in SST to 14.65% (Figure 7).

3. Discussion

Molecular studies in crustaceans have indicated that many genes tend to change their expression levels under different situations or in different stages of development [29,31]. qPCR is a useful tool for analyzing gene expression, with good specificity, accuracy, efficiency, and reproducibility. However, numerous studies have shown that the reference genes, such as GAPDH and β-act, that are used to normalize the data in qPCR studies may not remain stable under all conditions [10,32,33].
In this study, we screened out seven reference genes (EIF, β-act, RPL18, 18S, EF-1α, TUB, and GAPDH), and ranked and evaluated them in M. nipponense under different situations. We initially chose candidate reference genes based on the recommended gene studied in the model organisms and other crustaceans. It is interesting that, although there are evolutionary and organizational differences in the different species, reference genes like alpha-1,2-mannosyltransferase in Saccharomyces cerevisiae [34], heterogeneous nuclear ribonucleoprotein 27C and TBC1 domain family member 22A in Oryza sativa [35], 60S ribosomal protein L13a in Danio rerio [36], TATA-box binding protein, and eukaryotic translation elongation factor 2 in Mus musculus [32] can be found in the mRNA transcriptomes studied in our lab. The genes were further selected after following inspection with gel electrophoresis and sequencing. For example, the TATA-binding protein was eliminated because the PCR product was too weak in the gel electrophoresis and it was not widely present in all organizations. These results indicated that some genes considered as classical reference genes in some species may not be suitable in other species. Previous studies of crustaceans, especially shrimps, identified EIF and 18S as the most stable reference genes in different tissues in Procambarus clarkii [9], while GAPDH and β-act were chosen in different male tissues in Macrobrachium rosenbergii [15], and EF-1α in the reproductive system in the Peneaus monodon [13] and the infected experiment in Penaeus stylirostris [12]. However, EF-1α was almost the least stable in all situations, including in WSSV-infected experiment in M. nipponense, suggesting that reference genes are not necessarily interchangeable in different shrimp, even under the same conditions. RPL18 has rarely been used as a reference gene in crustaceans, although it was selected as a reference gene in different developmental stages and tissues in Solenopsis invicta [37], and in the different developmental stages in Anastrepha obliqua [38]. RPL18 performed well in seven adult tissues in the current study, but was the least stable gene in the different embryo stages, suggesting that some reference genes only performed well in specific tissues or conditions. These results demonstrate the need to screen for specific suitable reference genes before conducting qPCR studies under new experimental conditions or means of stress. The Cq values and stability rankings of GAPDH and EF-1α both varied widely under different experimental conditions, and it is therefore not recommended to use them as reference genes in qPCR of M. nipponense. In contrast, EIF performed well in most of the stability rankings and should therefore be considered as a conventional reference gene for qPCR studies in M. nipponense.
An experiment with significant differences was designed and performed to further confirm the reliability of the screening results. Previous researchers in our lab have proved that RNAi is able to significantly reduce the expression of specific genes in M. nipponense [29,30]. The SST gene is specifically expressed in androgenic glands [39], and its expression was predicted to decrease by >90% by seven days after the injection. We analyzed this decrease using each of the seven candidate reference genes and showed that β-act and RPL18 were the most stable reference genes, with similar ratings, followed by TUB and EIF tied for third, and then 18S, GAPDH, and EF-1α. According to the qPCR data, the expression of SST in the androgenic glands dropped to 1.3%, based on the two most stable reference genes, compared with a drop to 14.6% compared with the least stable gene, EF-1α. This result was in accord with the stability rankings. A previous study identified EF-1α as the most suitable reference gene for measuring moderate and highly expressed genes in the infected P. stylirostris, while GAPDH was a better control for the lower expressed genes, corresponding to the expressions of EF-1α and GAPDH [12]. The current study showed that 18S, with EIF, nearly showed (0.58 and 0.44) a difference in the mean Cq values, and a much slighter difference than GAPDH (1.80), but the rank score much lower (5.233 and 3.13) and the qPCR data shows its decline difference (0.76% and 1.5%), which might indicate that, according to the expression level of the target gene, a medium high expression abundance of the reference gene was better. This suggests that some low-ranked genes may be suitable reference genes if the expression level of the target gene is very high or very low, depending on the Cq of the target gene. For example, 18S may be suitable for target genes with low expression levels in adult tissues and under hypoxic stress, and β-act may be for highly expressed target genes in different ovarian stages in M. nipponese (Figure 3, Figure 4 and Figure 5).
In this study, we screened seven potential reference genes’ potential for M. nipponense from a large number of candidate genes, and analyzed their stability under various tissues and under different stresses using qPCR. EIF was stable in different situations, especially in WSSV infection and in different ovarian and embryo stages, while RPL18 was the most stable reference gene in the adult tissues, and β-act was the best reference gene under hypoxia stress and RNAi. The five tools (GeNorm, NormFinder, BestKeeper, the comparative ∆Ct method, and RefFinder) used in this research for analyzing the stability rankings of the reference gene were widely used in crustaceans [12,13,14,15,16], but the reference genes have rarely been screened for conditions of hypoxia and RNAi. The current reference genes, identified under different conditions in M. nipponense, will thus provide a useful references for qPCR experiments in other crustaceans.

4. Materials and Methods

4.1. Selection of Reference Genes and Primer Design

The candidate gene selection was chosen from the reference genes that had been studied in other model animals and similar species. Then, their names were used to search the existing transcriptome libraries and the genes that were extensive in organizations were selected. The sequences were obtained from the transcriptome library. Nucleotide sequences were analyzed based on the nucleotide and protein databases using the BLASTX and BLASTN programs (http://0-www-ncbi-nlm-nih-gov.brum.beds.ac.uk/BLAST/). The protein prediction was performed using the open reading frame (ORF) finder (http://0-www-ncbi-nlm-nih-gov.brum.beds.ac.uk/gorf/). Multiple alignments of amino acid sequences’ encoding were created using DNAMAN 6.0 [30].
All of the primers for the experiments were designed based on the open reading frame and using Primer-Blast tools in NCBI (http://0-www-ncbi-nlm-nih-gov.brum.beds.ac.uk/tools/primer-blast/). A reaction without RNA templates was used as the negative control. The primers were designed to verify the ORFs of those sequences. After getting reliable ORFs, the primers for qPCR were designed considering the following parameters: primer size, 22–24 bp; product size, 150–300 bp; annealing temperature, 59–61 (°C) and a GC(composition) content of 40–60%. In order to get the most suitable primers, three attempts were taken to design and each time, with four pairs of primers design per gene.

4.2. Amplification Efficiency and Primers Specificity of Reference Genes

The specificity must be validated empirically with direct experimental evidence (electrophoresis gel, melting profile, DNA sequencing, amplicon size, and/or restriction enzyme digestion) [3]. The melting curve was measured to evaluate the specificity of the reference genes. The efficiency was based on the slope of a linear regression model and was calculated from the slope of a standard curve. The efficiencies (E) and correlation coefficients (R2) were calculated for each reference gene [40]. The PCR efficiencies of the primer pairs were determined by qPCR, using a serial dilution of pooled hepatopancreas cDNA samples (×1, ×10, ×100, ×1000, and ×10000 dilutions).

4.3. Animals, Stress Experiments, and Tissue Collection

Our study does not involve endangered or protected species. This study was approved by the Institutional Animal Care and Use Ethics Committee of the Freshwater Fisheries Research Center, the Chinese Academy of Fishery Sciences (Wuxi, China, FFRC125, 26 August 2016). All of the prawns were obtained from the Freshwater Fisheries Research Center, the Chinese Academy of Fishery Sciences, Wuxi, China (120°13′44″ E, 31°28′22″ N) [30].
In the spatiotemporal expression study, after one week, the laboratory culture, ovary, testis, gill, muscle, eyestalk, hepatopancreas, and heart were dissected out of the mature prawns (n = 3). The developmental stage of the embryo was classified into seven stages based on the criteria of Qiao et al. (2015) [41]. The ovarian cycle of the prawns was classified into five stages based on the previous results Gao et al., (2006) [42].
For the hypoxia stress experiment, every 30 shrimp in three tanks were maintained within the treatment tanks for 0, 3, 6, 12, and 24 h by nitrogen-filled manipulation in the hypoxic conditions (2.0 ± 0.2 mg O2 L−1). The hypoxic dissolved oxygen value was set on the basis of the previous observations of juvenile M. nipponense [43]. A gill of five time points of these shrimp was collected and all of the exposures were conducted in triplicate.
In the white spot syndrome virus (WSSV) infection, every 20 healthy shrimp in three tanks were bred for seven days in a laboratory condition, before infection. All of the experimental materials and methods are referenced from Zhao et al. (2017) [44]. The injection positions were between the third and fourth abdominal segments. Hepatopancreas was collected in triplicate at 0, 12, 24, 48, 72, and 96 h after post-inoculation (hpi) with WSSV.

4.4. RNA Extraction and cDNA Synthesis

All of the samples mentioned above were dissected out and frozen immediately in liquid nitrogen, and stored at −80 °C until processed. The total RNA was isolated from the different tissues of the prawns using RNAiso Plus Reagent (TaKaRa, Kusatsu, Japan), according to the manufacturer’s protocols. At least three shrimp were analyzed for each type of tissue. For all of the RNA samples, the A260/A280 ratios were in the range of 1.9–2.1, and the RNA integrity was verified by 1.2% agarose gel electrophoresis and stored at 80 °C.
Approximately 1 μg of the total RNA from each tissue was reverse-transcribed by the iScript™ cDNA Synthesis Kit Perfect Real Time (BIO-RAD, Hercules, CA, USA), according to the manufacturerr’s instructions. Synthesized cDNA were diluted to 2-fold and stored at −20 °C until use.

4.5. Quantitative Real-Time PCR (qPCR)

The qPCR amplification was performed in a total volume of 25 μL, which contained 1 μL cDNA (50 ng), 10 μL SsoFast™ EvaGreen Supermix (BIO-RAD, Hercules, CA, USA), 0.5 μL (10 μM) of the primers (Table 1), and 13 μL of nuclease-free water. The reaction mixture was initially incubated at 95 °C for 30 s to activate the Hot Start Taq DNA polymerase, followed by 40 cycles at 95 °C for 10 s and 60 °C for 10 s, and a melting cure analysis was performed at the end of the qPCR reaction at 65–95 °C (with increments of 0.5 °C) for 10 s. The differences of the expressions turned out to be significant (p < 0.05).

4.6. Methods for Analyzing Stability of Reference Genes

The expression stabilities of the candidate reference genes for the tissues and embryos were analyzed separately using RefFinder, an algorithm that integrates four widely used computational programmes for the analysis of the expression stability, namely GeNorm, NormFinder, BestKeeper, and the comparative ∆Ct method. Briefly, based on the rankings provided by individual programmes, RefFinder assigns an appropriate weight to each gene and calculates the geometric mean of the weights, in order to give an overall ranking [23].

4.7. Validation of Reference Genes by SST Gene RNA Interference

For the in vivo dsRNA injection experiment, 50 healthy mature male prawns (weights of 2.4 ± 0.6 g) were assigned to two groups. The experimental group (N = 25) was injected with SST dsRNA. Each prawn was injected with SST dsRNA through the pericardial cavity membrane of the carapace at a dose of 4 μg/g.b.w. The control group (N = 25) was injected with diethy pyrocarbonate water at volumes equivalent to those applied to the experimental group (based on gram body weight). After the injection, 10 prawns from each group were randomly collected on the seventh day. The primer for the dsRNA of the SST, named dsSST, was designed using Snap Dragon tools (available online: http://www.flyrnai.org/cgi-bin/RNAi_find_primers.pl), and it is displayed in Table A1. The primers used for the qPCR of the SST was referred to in Jin et al. (2014) [39]. The purity and integrity of the double-stranded RNA (dsRNA) followed the instructions of the Transcript AidTMT7 High Yield Transcription kit (Fermentas, Waltham, USA).

Author Contributions

Conceived and designed the experiments: Y.H., H.F., H.Q., and S.S. Performed the experiments: Y.H., W.Z., and S.J. Analyzed the data: Y.H. Contributed reagents/materials/analysis tools: S.J., Y.G., Y.X., and Y.W.

Funding

This research was supported by grants from the Special Items of Basic Research Projects of the National Natural Science Foundation of China (Grant No. 31572617); the Central Public-Interest Scientific Institution Basal Research Fund CAFS (2017JBFZ05); the New Varieties Creation Major Project in Jiangsu province (PZCZ201745); the Science and Technology Supporting Program of Jiangsu Province (BE2016308), China, the Agriculture Research System-48 (CARS-48); the Central Public-Interest Scientific Institution Basal Research Fund CAFS (2017JBFZ05); and the Science and Technology Development Fund of Wuxi (CLE02N1514).

Conflicts of Interest

The authors declare no conflict of interest.

Abbreviations

qPCRquantitative real-time reverse transcription PCR
ORFopen reading frame
RNAiRNA interference
M. nipponenseMacrobrachium nipponense

Appendix A

Table A1. Primers for validating open reading frames.
AbbreviationGene NamePrimer Sequence (5′–3′) Forward/ReverseGenbank Accession No.
EIFeukaryotic translation initiation factor 5AGTTGTATGCAGTCGGCCATATTT
TGTCCTGAAGGTGGTGATAATGA
MH540106
18S18S ribosomal RNACTCCCCCTGAAGTGTATTATGGA
GCGAATCTTTTTCAGTTGTTCCC
MH540107
EF-1αelongation factor 1-alphaCCTGGTATGGTTGTCACTTTTGC
CTCCTTCTTCGACACCTCTTTGA
MH540108
GAPDHglyceraldehyde-3-phosphate dehydrogenaseCCAAGGACATGAAGGTAGTCTCC
TTCTGCATGTGCTTCAACAAGTC
MH540109
TUBα-tubulinGGTCTGGAATTCAGTCAAGTCG
AGTGCATCTCAGTTCATGTTGG
MH540110
β-actβ-actinCTCTTCTTCCCTGGAGAAGTCTTA
ATCCACATCTGTTGGAAGGTAGA
MH540111
RPL18ribosomal protein L18ACTTTTTGTACCCACAGCTTGAC
GTGAAGGGCGAATCTTTGTTGTT
MH540112
dsSSTslow-tonic S2 tropomyosinTAATACGACTCACTATAGGGCGAGAGGTCTGAGGAACGAC
TAATACGACTCACTATAGGGTAAGCTTCCTCACGCTGGTT
Table A2. Ranking of reference genes under different conditions by different methods.
Experimental ConditionsMethodRank
1234567
Different adult tissuesComparative ∆CtRPL18EIFβ-act18STUBGAPDHEF-1α
BestKeeperRPL18EIF18Sβ-actTUBGAPDHEF-1α
NormFinderRPL18EIFβ-act18SGAPDHTUBEF-1α
GeNormEIF/RPL18 18Sβ-actTUBGAPDHEF-1α
Recommended comprehensive rankingRPL18EIF18Sβ-actTUBGAPDHEF-1α
Different ovarian stagesComparative ∆Ctβ-actEIFRPL1818SEF-1αTUBGAPDH
BestKeeperEIFEF-1αβ-act18STUBRPL18GAPDH
NormFinderEIFβ-actEF-1αRPL1818STUBGAPDH
GeNorm18S/RPL18 β-actEIFEF-1αTUBGAPDH
Recommended comprehensive rankingEIFβ-actRPL1818SEF-1αTUBGAPDH
Different embryo stagesComparative ∆CtEIFβ-actTUB18SGAPDHRPL18EF-1α
BestKeeper18SEIFβ-actTUBRPL18GAPDHEF-1α
NormFinderEIFβ-actGAPDHTUB18SRPL18EF-1α
GeNorm18S/TUB EIFβ-actGAPDHRPL18EF-1α
Recommended comprehensive rankingEIF18Sβ-actTUBGAPDHRPL18EF-1α
Hypoxia stressComparative ∆Ctβ-actGAPDHEIF18SEF-1αTUBRPL18
BestKeeperEIFTUBGAPDHβ-act18SRPL18EF-1α
NormFinderβ-actGAPDHEIF18STUBEF-1αRPL18
GeNormGAPDH/β-act EIF18SEF-1αTUBRPL18
Recommended comprehensive rankingβ-actGAPDHEIF18STUBEF-1αRPL18
WSSV infectionComparative ∆CtEIFRPL18GAPDHTUBEF-1αβ-act18S
BestKeeperRPL18EIFTUBGAPDHEF-1α18Sβ-act
NormFinderRPL18EIFGAPDHTUBβ-actEF-1α18S
GeNormEIF /TUB GAPDHRPL18EF-1αβ-act18S
Recommended comprehensive rankingEIFRPL18TUBGAPDHEF-1αβ-act18S
Table A3. Reference gene expression stability values based on several programs.
Rank∆CtBestKeeperNormFinderGeNorm
GenesAverage of Std devGenesStd devGenesStability IndexGenesStability Value
Different adult tissues1RPL182.22RPL180.83RPL180.252EIF/RPL180.392
2EIF2.24EIF0.94EIF0.542
3β-act2.5218S1.10β-act1.76718S1.354
418S2.66β-act1.3818S1.934β-act1.55
5TUB2.91TUB1.93GAPDH2.128TUB1.705
6GAPDH3.07GAPDH2.16TUB2.369GAPDH2.192
7EF-1α4.65EF-1α3.74EF-1α4.462EF-1α2.895
Different ovarian stages1β-act0.85EIF0.87EIF0.43918S/RPL180.319
2EIF0.88EF-1α1.11β-act0.506
3RPL180.91β-act1.25EF-1α0.609β-act0.388
418S0.9518S1.3RPL180.637EIF0.513
5EF-1α0.99TUB1.3818S0.749EF-1α0.653
6TUB1.2RPL181.5TUB1.032TUB0.892
7GAPDH1.33GAPDH1.57GAPDH1.218GAPDH1.016
Different embryo stages1EIF2.3718S1.89EIF0.64218S/TUB1.165
2β-act2.47EIF1.73β-act0.786
3TUB2.74β-act5.07GAPDH1.775EIF1.44
418S2.77TUB3.11TUB1.906β-act1.578
5GAPDH2.84RPL182.5518S2.059GAPDH1.724
6RPL183.36GAPDH2.3RPL182.295RPL182.24
7EF-1α5.35EF-1α2.92EF-1α5.137EF-1α3.129
Hypoxia stress1β-act0.6EIF0.49β-act0.092GAPDH/β-act0.185
2GAPDH0.66TUB0.57GAPDH0.316
3EIF0.7GAPDH0.61EIF0.323EIF0.434
418S0.74β-act0.6718S0.4518S0.532
5EF-1α0.9518S0.85TUB0.822EF-1α0.631
6TUB0.97RPL180.93EF-1α0.828TUB0.72
7RPL181.01EF-1α1.06RPL180.912RPL180.803
WSSV infection1EIF0.66RPL180.31RPL180.297EIF/TUB0.397
2RPL180.67EIF0.32EIF0.334
3GAPDH0.69TUB0.38GAPDH0.391GAPDH0.454
4TUB0.72GAPDH0.41TUB0.424RPL180.489
5EF-1α0.91EF-1α0.46β-act0.737EF-1α0.593
6β-act0.9218S0.6EF-1α0.748β-act0.703
718S1.06β-act0.6818S0.92918S0.805

References

  1. Bustin, S.A. Quantification of mRNA using real-time reverse transcription PCR (RTPCR): Trends and problems. J. Mol. Endocrinol. 2002, 29, 23–39. [Google Scholar] [CrossRef] [PubMed]
  2. Bustin, S.A.; Nolan, T. Pitfalls of quantitative real-time reverse-transcription polymerase chain reaction. J. Biomol. Tech. 2004, 15, 155–166. [Google Scholar] [PubMed]
  3. Bustin, S.A.; Benes, V.; Garson, J.A.; Hellemans, J.; Huggett, J.; Kubista, M.; Mueller, R.; Nolan, T.; Pfaffl, M.W.; Shipley, G.L.; et al. The MIQE guidelines: Minimum information for publication of quantitative real-time PCR experiments. Clin. Chem. 2009, 55, 611–622. [Google Scholar] [CrossRef] [PubMed]
  4. Radonić, A.; Thulke, S.; Mackay, I.M.; Landt, O.; Siegert, W.; Nitsche, A. Guideline to reference gene selection for quantitative real-time PCR. Biochem. Biophys. Res. Commun. 2004, 313, 856–862. [Google Scholar] [CrossRef] [PubMed]
  5. Thellin, O.; Zorzi, W.; Lakaye, B.; De Borman, B.; Coumans, B.; Hennen, G.; Grisar, T.; Igout, A.; Heinen, E. Housekeeping genes as internal standards: Use and limits. J. Biotechnol. 1999, 75, 291–295. [Google Scholar] [CrossRef]
  6. Vandesompele, J.; De Preter, K.; Pattyn, F.; Poppe, B.; Van Roy, N.; De Paepe, A.; Speleman, F. Accurate normalization of real-time quantitative RT-PCR data by geometric averaging of multiple internal control genes. Genome Biol. 2002, 3, 1–12. [Google Scholar] [CrossRef] [Green Version]
  7. Huggett, J.; Dheda, K.; Bustin, S.; Zumla, A. Real-time RT-PCR normalisation; strategies and considerations. Genes Immun. 2005, 6, 279–284. [Google Scholar] [CrossRef] [PubMed] [Green Version]
  8. Zhang, S.; An, S.; Li, Z.; Wu, F.; Yang, Q.; Liu, Y.; Cao, J.; Zhang, H.; Zhang, Q.; Liu, X. Identification and validation of reference genes for normalization of gene expression analysis using qRT-PCR in Helicoverpa armigera (Lepidoptera: Noctuidae). Gene 2015, 555, 393–402. [Google Scholar] [CrossRef] [PubMed]
  9. Jiang, H.; Qian, Z.; Lu, W.; Ding, H.; Yu, H.; Wang, H.; Li, J. Identification and characterization of reference genes for normalizing expression data from red swamp crawfish Procambarus clarkii. Int. J. Mol. Sci. 2015, 16, 21591–21605. [Google Scholar] [CrossRef] [PubMed]
  10. Wang, E.; Wang, K.; Chen, D.; Wang, J.; He, Y.; Long, B.; Yang, L.; Yang, Q.; Geng, Y.; Huang, X.; et al. Evaluation and selection of appropriate reference genes for real-time quantitative PCR analysis of gene expression in Nile tilapia (Oreochromis niloticus) during vaccination and infection. Int. J. Mol. Sci. 2015, 16, 9998–10015. [Google Scholar] [CrossRef] [PubMed]
  11. Subramoniam, T. Sexual Biology and Reproduction in Crustaceans, 1st ed.; Academic Press: Amsterdam, The Netherlands, 2016. [Google Scholar]
  12. Dhar, A.K.; Bowers, R.M.; Licon, K.S.; Veazey, G.; Read, B. Validation of reference genes for quantitative measurement of immune gene expression in shrimp. Mol. Immunol. 2009, 46, 1688–1695. [Google Scholar] [CrossRef] [PubMed]
  13. Leelatanawit, R.; Klanchui, A.; Uawisetwathana, U.; Karoonuthaisiri, N. Validation of reference genes for real-time PCR of reproductive system in the black tiger shrimp. PLoS ONE 2012, 7, 1–10. [Google Scholar] [CrossRef] [PubMed]
  14. Cottin, D.; Shillito, B.; Chertemps, T.; Thatje, S.; Léger, N.; Ravaux, J. Comparison of heat-shock responses between the hydrothermal vent shrimp Rimicaris exoculata and the related coastal shrimp Palaemonetes varians. J. Exp. Marine Biol. Ecol. 2010, 393, 9–16. [Google Scholar] [CrossRef]
  15. Priyadarshi, H.; Das, R.; Kumar, A.P.; Babu-Gireesh, P.; Javed, H.; Krishna, G.; Marappan, M.; Chaudhari, A. Characterization and evaluation of selected house-keeping genes for quantitative RT-PCR in Macrobrachium rosenbergii morphotypes. Fish. Technol. 2015, 52, 177–183. [Google Scholar]
  16. Jaramillo, M.L.; Ammar, D.; Quispe, R.L.; Guzman, F.; Margis, R.; Nazari, E.M.; Müller, Y.M. Identification and evaluation of reference genes for expression studies by RT-qPCR during embryonic development of the emerging model organism, Macrobrachium olfersii. Gene 2017, 598, 97–106. [Google Scholar] [CrossRef] [PubMed]
  17. Jin, S.; Fu, H.; Sun, S.; Jiang, S.; Xiong, Y.; Gong, Y.; Qiao, H.; Zhang, W.; Wu, Y. Integrated analysis of microRNA and mRNA expression profiles during the sex-differentiation sensitive period in oriental river prawn, Macrobrachium nipponense. Sci. Rep. 2017, 7, 12011. [Google Scholar] [CrossRef] [PubMed]
  18. Sun, S.; Xuan, F.; Fu, H.; Ge, X.; Zhu, J.; Qiao, H.; Jin, S.; Zhang, Y. Comparative proteomic study of the response to hypoxia in the muscle of Oriental River prawn (Macrobrachium nipponense). J. Proteom. 2016, 138, 115–123. [Google Scholar] [CrossRef] [PubMed]
  19. Zhang, W.Y.; Jiang, S.F.; Xiong, Y.W.; Fu, H.T.; Qiao, H.; Sun, S.M.; Gong, Y.S.; Jin, S.B. Molecular cloning and expression analysis of female sterile homeotic gene (fsh) in the oriental river prawn Macrobrachium nipponense. Genet. Mol. Res. 2015, 14, 4318–4330. [Google Scholar] [CrossRef] [PubMed]
  20. Andersen, C.L.; Jensen, J.L.; Ørntoft, T.F. Normalization of real-time quantitative reverse transcription-PCR data: A model-based variance estimation approach to identify genes suited for normalization, applied to bladder and colon cancer data sets. Cancer Res. 2004, 64, 5245–5250. [Google Scholar] [CrossRef] [PubMed]
  21. Pfaffl, M.W.; Tichopad, A.; Prgomet, C.; Neuvians, T.P. Determination of stable housekeeping genes, differentially regulated target genes and sample integrity: BestKeeper—Excel-based tool using pair-wise correlations. Biotechnol. Lett. 2004, 26, 509–515. [Google Scholar] [CrossRef] [PubMed]
  22. Silver, N.; Best, S.; Jiang, J.; Thein, S.L. Selection of housekeeping genes for gene expression studies in human reticulocytes using real-time PCR. BMC Mol. Biol. 2006, 7, 33. [Google Scholar] [CrossRef] [PubMed]
  23. Xie, F.; Xiao, P.; Chen, D.; Xu, L.; Zhang, B. miRDeepFinder: A miRNA analysis tool for deep sequencing of plant small RNAs. Plant Mol. Biol. 2012, 80, 75–84. [Google Scholar] [CrossRef] [PubMed]
  24. Qiao, H.; Fu, H.; Xiong, Y.; Jiang, S.; Zhang, W.; Sun, S.; Jin, S.; Gong, Y.; Wang, Y.; Shan, D.; et al. Molecular insights into reproduction regulation of female Oriental River prawns Macrobrachium nipponense through comparative transcriptomic analysis. Sci. Rep. 2017, 7, 12161. [Google Scholar] [CrossRef] [PubMed]
  25. Gu, X.; Fu, H.; Sun, S.; Qiao, H.; Zhang, W.; Jiang, S.; Xiong, Y.; Jin, S.; Gong, Y.; Wu, Y. Dietary cholesterol-induced transcriptome differences in the intestine, hepatopancreas, and muscle of Oriental River prawn Macrobrachium nipponense. Comp. Biochem. Physicol. Part D Genom. Proteom. 2017, 23, 39–48. [Google Scholar] [CrossRef] [PubMed]
  26. Qiao, H.; Fu, H.; Jin, S.; Wu, Y.; Jiang, S.; Gong, Y.; Xiong, Y. Constructing and random sequencing analysis of normalized cDNA library of testis tissue from oriental river prawn (Macrobrachium nipponense). Comp. Biochem. Physicol. Part D Genom. Proteom. 2012, 7, 268–276. [Google Scholar] [CrossRef] [PubMed]
  27. Jin, S.; Fu, H.; Zhou, Q.; Sun, S.; Jiang, S.; Xiong, Y.; Gong, Y.; Qiao, H.; Zhang, W. Transcriptome analysis of androgenic gland for discovery of novel genes from the oriental river prawn, Macrobrachium nipponense, using Illumina Hiseq 2000. PLoS ONE 2013, 8, e76840. [Google Scholar] [CrossRef] [PubMed]
  28. Krzywinski, M.; Altman, N. Points of significance: Visualizing samples with box plots. Nat. Methods 2014, 11, 119–120. [Google Scholar] [CrossRef] [PubMed]
  29. Bai, H.; Qiao, H.; Li, F.; Fu, H.; Sun, S.; Zhang, W.; Jin, S.; Gong, Y.; Jiang, S.; Xiong, Y. Molecular characterization and developmental expression of vitellogenin in the oriental river prawn Macrobrachium nipponense and the effects of RNA interference and eyestalk ablation on ovarian maturation. Gene 2015, 562, 22–31. [Google Scholar] [CrossRef] [PubMed]
  30. Li, F.; Qiao, H.; Fu, H.; Sun, S.; Zhang, W.; Jin, S.; Jiang, S.; Gong, Y.; Xiong, Y.; Wu, Y.; et al. Identification and characterization of opsin gene and its role in ovarian maturation in the oriental river prawn Macrobrachium nipponense. Comp. Biochem. Phys. Part B Biochem. Mol. Biol. 2018, 218, 1–12. [Google Scholar] [CrossRef] [PubMed]
  31. Subramoniam, T. Mechanisms and control of vitellogenesis in crustaceans. Fish. Sci. 2011, 77, 1–21. [Google Scholar] [CrossRef]
  32. Eissa, N.; Hussein, H.; Wang, H.; Rabbi, M.F.; Bernstein, N.; Ghia, J.-E. Stability of reference genes for messenger RNA quantification by real-time PCR in mouse dextran sodium sulfate experimental colitis. PLoS ONE 2016, 11, e0156289. [Google Scholar] [CrossRef] [PubMed]
  33. Zhang, Y.; Han, X.; Chen, S.; Zheng, L.; He, X.; Liu, M.; Qiao, G.; Wang, Y.; Zhuo, R. Selection of suitable reference genes for quantitative real-time PCR gene expression analysis in Salix matsudana under different abiotic stresses. Sci. Rep. 2017, 7, 40290. [Google Scholar] [CrossRef] [PubMed]
  34. Teste, M.A.; Duquenne, M.; François, J.M.; Parrou, J.L. Validation of reference genes for quantitative expression analysis by real-time RT-PCR in Saccharomyces cerevisiae. BMC Mol. Biol. 2009, 10, 99. [Google Scholar] [CrossRef] [PubMed]
  35. Maksup, S.; Supaibulwatana, K.; Selvaraj, G. High-quality reference genes for quantifying the transcriptional responses of Oryza sativa L. (ssp. indica and japonica) to abiotic stress conditions. Chin. Sci. Bull. 2013, 58, 1919–1930. [Google Scholar]
  36. Xu, H.; Li, C.; Zeng, Q.; Agrawal, I.; Zhu, X.; Gong, Z. Genome-wide identification of suitable zebrafish Danio rerio reference genes for normalization of gene expression data by RT-qPCR. J. Fish Biol. 2016, 88, 2095–2110. [Google Scholar] [CrossRef] [PubMed]
  37. Cheng, D.; Zhang, Z.; He, X.; Liang, G. Validation of reference genes in Solenopsis invicta in different developmental stages, castes and tissues. PLoS ONE 2013, 8, e57718. [Google Scholar] [CrossRef] [PubMed]
  38. Nakamura, A.M.; Chahad-Ehlers, S.; Lima, A.L.; Taniguti, C.H.; Sobrinho, I., Jr.; Torres, F.R.; de Brito, R.A. Reference genes for accessing differential expression among developmental stages and analysis of differential expression of OBP genes in Anastrepha obliqua. Sci. Rep. 2016, 6, 17480. [Google Scholar] [CrossRef] [PubMed]
  39. Jin, S.; Jiang, S.; Xiong, Y.; Qiao, H.; Sun, S.; Zhang, W.; Li, F.; Gong, Y.; Fu, H. Molecular cloning of two tropomyosin family genes and expression analysis during development in oriental river prawn, Macrobrachium nipponense. Gene 2014, 546, 390–397. [Google Scholar] [CrossRef] [PubMed]
  40. Kubista, M.; Andrade, J.M.; Bengtsson, M.; Forootan, A.; Jonák, J.; Lind, K.; Sindelka, R.; Sjöback, R.; Sjögreen, B.; Strömbom, L.; et al. The real-time polymerase chain reaction. Mol. Asp. Med. 2006, 27, 95–125. [Google Scholar] [CrossRef] [PubMed]
  41. Qiao, H.; Xiong, Y.; Zhang, W.; Fu, H.; Jiang, S.; Sun, S.; Bai, H.; Jin, S.; Gong, Y. Characterization, expression, and function analysis of gonad-inhibiting hormone in Oriental River prawn, Macrobrachium nipponense and its induced expression by temperature. Comp. Biochem. Physiol. Part A Mol. Integr. Physiol. 2015, 185, 1–8. [Google Scholar] [CrossRef] [PubMed]
  42. Gao, X.G.; Liu, H.; Xu, J.N.; Cai, S.L. Study on site of vitellogenin synthesis in the freshwater prawn Macrobrachium nipponese. Biotechnol. Bull. 2006, 438–444. Available online: http://en.cnki.com.cn/Article_en/CJFDTotal-SWJT2006S1096.htm (accessed on 1 August 2018). (In Chinese).
  43. Sun, S.M.; Xuan, F.J.; Ge, X.P.; Fu, H.T.; Zhu, J.; Zhang, S.Y. Identification of differentially expressed genes in hepatopancreas of oriental river prawn, Macrobrachium nipponense exposed to environmental hypoxia. Gene 2014, 534, 298–306. [Google Scholar] [CrossRef] [PubMed]
  44. Zhao, C.; Fu, H.; Sun, S.; Qiao, H.; Zhang, W.; Jin, S.; Jiang, S.; Xiong, Y.; Gong, Y. Experimental inoculation of oriental river prawn Macrobrachium nipponense with white spot syndrome virus (WSSV). Dis. Aquat. Organ. 2017, 126, 125–134. [Google Scholar] [CrossRef] [PubMed]
Figure 1. Agarose gel electrophoresis of qPCR primers amplification of the candidate reference genes using hepatopancreas cDNA as a template. MA means DNA marker DL2000, which is in the left side and shows their expected sizes. EIF—eukaryotic translation initiation factor 5A; 18S18S ribosomal RNA; EF-1αelongation factor-1α; GAPDHglyceraldehyde-3-phosphate dehydrogenase; TUBα-tubulin; β-actβ-actin; RPL18Ribosomal protein L18.
Ijms 19 02258 g001
Figure 2. Dissolution and standard curve to verify the gene amplification efficiency and uniformity. (A) Dissolution curve of candidate reference genes. (B) Standard curve of candidate reference genes.
Ijms 19 02258 g002
Figure 3. Variation in the reference genes expression using distribution of cycle threshold (Cq) values in line charts. (A) Different tissues in adult shrimps. (B) Five different ovary development stages, O1–5: Stage I, Stage II, Stage III, Stage IV, and Stage V of ovary. (C) Different embryo development stages, US—unfertilized egg stage; CS—cleavage stage; BS—blastula stage; GS—gastrul stage; NS—nauplius stage; ZS—zoea stage; L1—one day after larvae hatched. (D) Different times after hypoxia stress in gill. (E) Different times after infection in hepatopancreas.
Ijms 19 02258 g003
Figure 4. Variation in the reference genes expression using Cq values with boxplot. (A) Different tissues in adult shrimps. (B) Five different ovary development stages. (C) Different embryo development stages. (D) Different times after hypoxia stress in gill. (E) Different times after infection in hepatopancreas. Upper and lower whiskers mean maximum and minimum values, except outliers, and using a circle to mark the mild outliers and an asterisk to mark the extreme outliers. The upper and lower edges of the box represent the upper and lower quartiles, the middle black line is the median, and the whiskers represent the maximum and minimum values. Mild and extreme outliers are marked by circles and asterisks, respectively. The length of each graphic reflects its variation.
Ijms 19 02258 g004
Figure 5. Comprehensive ranking of the reference genes under different conditions by RefFinder. (A) Different tissues in adult shrimps. (B) Five different ovary development stages. (C) Different embryo development stages. (D) Different times after hypoxia stress in gill. (E) Different times after infection in hepatopancreas. From left to right means the most suitable to the least suitable.
Ijms 19 02258 g005
Figure 6. Comprehensive ranking of reference genes of RNAi.
Ijms 19 02258 g006
Figure 7. Using different genes as the reference gene for the reduce multiples of the SST gene expression, relative to the original level after interference.
Ijms 19 02258 g007
Table 1. Primer pairs for qPCR of candidate reference genes. EIF—eukaryotic translation initiation factor 5A; 18S—18S ribosomal RNA; EF-1α—elongation factor-1α; GAPDH—glyceraldehyde-3-phosphate dehydrogenase; TUB—α-tubulin; β-act—β-actin; RPL18—Ribosomal protein L18.
GenePrimer Sequence (5′–3′) Forward/ReverseLength (bp)PCR Efficiency
(%)
Correlation Coefficient (R2)
EIFCATGGATGTACCTGTGGTGAAAC
CTGTCAGCAGAAGGTCCTCATTA
17994.40.994
18SGTTGGATGTTGCTGTTGAGAGAG
CTGGGCATCATTCTCTGGGTAAA
25096.80.997
EF-1αCAAGGATCTGAAACGTGGCTTC
GTACGTCTGTCGATCTTGGTCAG
19893.70.999
GAPDHGTCGGTAAGGTCATTCCAGAGC
CGAAAGTTTTGCTGAGCTGGAT
27495.50.991
TUBAGGAATGGAAAATCAGGAAGCCC
GTTTGTCGATCTGGAACCCTCT
22497.00.996
β-actCACGAGACCACCTACAATTCCA
ATAGAGAAGCCAAGATAGAACCGC
22699.40.991
RPL18CTTTTTGTACCCACAGCTTGACC
CACTTTTGATGTATTGGCCCGTC
202102.70.997
Table 2. Detailed distribution of cycle threshold (Cq) value information.
Experimental ConditionsStatisticsReference Gene
EIF18SEF-1αGAPDHTUBβ-actRPL18
Hypoxia stressGroup5555555
Mean21.8628.1924.2021.1923.8024.3521.33
Min Cq20.6426.0822.5020.0223.1323.0119.03
Max Cq22.3328.9826.4222.6624.5625.6622.43
WSSV infectionGroup6666666
Mean24.8232.0234.8926.7830.4426.4724.40
Min Cq24.1230.9734.2226.2629.9825.7223.76
Max Cq25.3033.2836.0427.4431.3427.6424.96
Different adult tissuesGroup7777777
Mean21.6527.8125.0522.5525.8620.8221.83
Min Cq20.4726.0918.5717.9022.6118.6420.56
Max Cq23.5930.2632.6226.7429.1723.3623.88
Different ovarian stagesGroup5555555
Mean21.2925.4233.3423.6123.8119.2822.18
Min Cq20.2423.7731.5620.7121.0617.7520.59
Max Cq22.6627.6235.3225.4025.1121.1924.40
Different embryo stagesGroup7777777
Mean21.2327.5130.9025.1325.2521.7122.63
Min Cq18.5825.3721.1221.2522.5318.2618.95
Max Cq23.7732.1037.4830.4730.9825.6227.97
‘Group’ in this table represents how many states or tissues the genes are studied in. Each means five time points during hypoxia stress, six time points during WSSV infection, seven different organizations in adult tissues study, five different ovarian stages, and seven different embryo stage. WSSV—white spot syndrome virus.
Table 3. Detailed Cq value sorting of RNAi.
Experimental ConditionsStatisticsReference Gene
EIF18SEF-1αGAPDHTUBβ-actRPL18
RNAi (Androgenic glands)Group2222222
Mean21.2927.6224.5122.1423.4619.1120.58
Min Cq21.0727.3322.6321.3423.4018.9920.55
Max Cq21.5127.9126.3823.1423.5119.2320.62
‘Group 2’ in this table represents two states, before and after the RNAi experiment.
Table 4. Ranking of reference genes of RNAi by different methods.
Experimental ConditionsMethodRank
1234567
RNAi (Androgenic glands)Comparative ∆Ctβ-actRPL18EIFTUB18SGAPDHEF-1α
BestKeeperRPL18TUBβ-actEIF18SGAPDHEF-1α
NormFinderβ-actEIFRPL18TUBGAPDH18SEF-1α
GeNormβ-act/RPL18 TUBEIF18SGAPDHEF-1α
Recommended comprehensive rankingβ-actRPL18TUBEIF18SGAPDHEF-1α

