Complete Chloroplast Genome Sequence and Phylogenetic Analysis of Quercus acutissima


1
Co-Innovation Center for Sustainable Forestry in Southern China, College of Biology and the Environment, Key Laboratory of State Forestry Administration on Subtropical Forest Biodiversity Conservation, Nanjing Forestry University, 159 Longpan Road, Nanjing 210037, China
2
Genepioneer Biotechnologies Co. Ltd., Nanjing 210014, China
*
Author to whom correspondence should be addressed.
Int. J. Mol. Sci. 2018, 19(8), 2443; https://0-doi-org.brum.beds.ac.uk/10.3390/ijms19082443
Submission received: 13 July 2018
/
Revised: 14 August 2018
/
Accepted: 16 August 2018
/
Published: 18 August 2018
(This article belongs to the Special Issue Chloroplast)
Abstract
:Quercus acutissima, an important endemic and ecological plant of the Quercus genus, is widely distributed throughout China. However, there have been few studies on its chloroplast genome. In this study, the complete chloroplast (cp) genome of Q. acutissima was sequenced, analyzed, and compared to four species in the Fagaceae family. The size of the Q. acutissima chloroplast genome is 161,124 bp, including one large single copy (LSC) region of 90,423 bp and one small single copy (SSC) region of 19,068 bp, separated by two inverted repeat (IR) regions of 51,632 bp. The GC content of the whole genome is 36.08%, while those of LSC, SSC, and IR are 34.62%, 30.84%, and 42.78%, respectively. The Q. acutissima chloroplast genome encodes 136 genes, including 88 protein-coding genes, four ribosomal RNA genes, and 40 transfer RNA genes. In the repeat structure analysis, 31 forward and 22 inverted long repeats and 65 simple-sequence repeat loci were detected in the Q. acutissima cp genome. The existence of abundant simple-sequence repeat loci in the genome suggests the potential for future population genetic work. The genome comparison revealed that the LSC region is more divergent than the SSC and IR regions, and there is higher divergence in noncoding regions than in coding regions. The phylogenetic relationships of 25 species inferred that members of the Quercus genus do not form a clade and that Q. acutissima is closely related to Q. variabilis. This study identified the unique characteristics of the Q. acutissima cp genome, which will provide a theoretical basis for species identification and biological research.
1. Introduction
Oak trees provide humans with materials used in food, clothing, and houses, while oak forests supply living organisms and animals with comfortable habitats, good air, and sufficient and pure moisture. Oak trees are linked to Chinese culture, and are also often called eucalyptus or pecking trees. In China, eucalyptus is regarded as a mysterious tree, growing silently, watching its ancestors forge ahead, and passing through generation to generation. Many countries regard oaks as sacred trees, and consider them to be magical and a symbol of longevity, strength, and pride.
The genus Quercus L. (Oak) contains more than 400 species that are widespread in the northern hemisphere [1]. These species play important roles in China’s forest ecosystem. Quercus L. (Oak)’s taxonomy, genetic structure, and breeding is complicated because of its wide variety of species, diverse forms, complex habitat conditions, and gene exchanges between species. Many studies have used nuclear simple sequence repeat (SSR) chloroplast DNA makers to study phylogeny and population variation [2,3]. Previously, studies found a conflict (inconsistency) between the phylogeny of plastid data and nuclear data in Senecioneae and Neotropical Catasetinae [4,5]. Therefore, it is not sufficient to study Quercus simply by using plastid regions. With the rapid development of next-generation sequencing, genome acquisition is now cheaper and faster than traditional Sanger sequencing. Complete chloroplast (cp) genome size data will be necessarily used to infer the phylogenetic relationship of Quercus or Fagaceae in future studies.
The genus is characterized by a high variability of morphological and ecological traits, the occurrence of mixed stands, the presence of large population sizes, and high levels of gene flow within the Quercus complex [6,7,8,9,10,11]. A new classification of Quercus L. was proposed by Denk with eight sections: Cyclobalanopsis, Cerris, Ilex, Lobatae, Quercus, Ponticae, Protobalanus, and Virentes [12]. In China, Quercus is divided into five morphology-based sections: Quercus, Aegilops, Heterobalanus, Engleriana, and Echinolepides [13,14,15]. Due to incomplete sampling and the use of markers with insufficient phylogenetic signals and complex evolutionary problems, the relationships among Quercus species are not fully understood.
Q. acutissima is an ecological and economic tree species in deciduous broad-leaved forests in the temperate zone of East Asia, widely distributed on the Hu Huanyong line or in Southeast China (latitude from 18° to 41° N and longitude from 91° to 123° E) [16]. This line from Heilongjiang Province to Tengchong, Yunnan Province, is roughly inclined in a 45° straight line. The development, origin, and reproduction of China are linked with Q. acutissima. Therefore, we need to protect, cultivate, and utilize Q. acutissima, and this has received substantial attention in phylogeny and biogeography studies. Most previous studies have focused on its population structure [17], breeding [18], forest management [19], and physiology [20]. Studies on the genetic variation of Q. acutissima using simple sequence repeat (SSR) and cpDNA makers have been carried out in China and South Korea [16,21]. According to this research, the distribution of Q. acutissima often overlaps with other oak trees, i.e., Q. variabilis and Q. chenii [22]. There is often a variety of species found in the population, although this has usually been determined from a comparison of morphology, rather than at a molecular level. Therefore, an analysis of the complete cp genome of Q. acutissima will help to identify the species further.
In the present study, we constructed the whole chloroplast genome of Q. acutissima by using next-generation sequencing and applying a combination of de novo and reference-guided assembly. Here, we describe the whole chloroplast genome sequence of Q. acutissima and the characterization of long repeats and simple sequence repeats (SSRs). We compare and analyze the chloroplast genome of Q. acutissima and the chloroplast genome of other members of Fagaceae. It is expected that the results will provide a theoretical basis for the determination of phylogenetic status and future scientific research.
2. Results and Discussion
2.1. Features of Q. Acutissima cpDNA
A total number of 63 million pair-end reads were produced with 9.82 Gb of clean data. Data from all of the reads were deposited in the NCBI Sequence Read Archive (SRA) under accession number MH607377. The size of the complete cp genome is 161,124 bp (Figure 1). The cp genome displayed a typical quadripartite structure, including a pair of IR (25,816 bp) separated by the large single copy (LSC; 90,423 bp) and small single copy (SSC; 19,069 bp) regions (Figure 1 and Table 1). The DNA G + C contents of the LSC, SSC, and IR regions, and the whole genome are 34.62, 30.84, 42.78, and 36.08 mol %, respectively, which is also similar to the chloroplast genomes of other Quercus species (Figure A1; Table 2). The DNA G + C content is a very important indicator of species affinity [23]. It is obvious that the DNA G + C content of the IR region is higher than that of other regions (LSC, SSC). This phenomenon is very common in other plants [23,24]. GC skewness has been shown to be an indicator of DNA lead chains, lag chains, replication origin, and replication terminals [25,26,27].
Plant chloroplast genomes may have 63–209 genes, but most are concentrated between 110 and 130, with a highly conserved composition and arrangement, including photosynthetic genes, chloroplast transcriptional expression-related genes, and some other protein-coding genes [28]. In the Q. acutissima chloroplast genome, 136 functional genes were predicted and divided into six groups, including eight rRNA genes, 40 tRNA genes, and 88 protein-coding genes (Table 1 and Table 3). In addition, 14 tRNA genes, eight rRNA genes, and 15 protein-coding genes are duplicated in the IR regions (Figure 1). The LSC region includes 62 protein-coding and 25 tRNA genes, while the SSC region includes 13 protein-coding genes (Table A1).
Based on the protein-coding sequences and tRNA genes, the frequency of codon usage was estimated for the Q. acutissima cp genome and is summarized in Table A2. In total, all genes are encoded by 6311 codons. Among these, leucine, with 2824 (44.4%) codons, is the most frequent amino acid in the cp genome, and cysteine, with 293 (1.1%), is the least frequent (Table 3). A- and U-ending codons are common. The most preferred synonymous codons (relative synonymous codon usage values (RSCU) > 1) end with A or U [23,29].
In total, we found 23 intron-containing genes, including 15 protein-coding genes, and eight tRNA genes (Table 4). 21 genes (13 protein-coding and eight tRNA genes) contain one intron, and two genes (ycf3 and clpP) contain two introns. The trnK-UUU has the largest intron (2505 bp), and the trnL-UAA has the smallest intron (483bp). Studies have shown that ycf3 is required for stable accumulation of photosystem I complexes [30]. Therefore, we speculate that the ycf3 intron gain of Q. acutissima may be helpful for further study of the mechanism of photosynthesis evolution.
2.2. Comparative Analysis of Genomic Structure
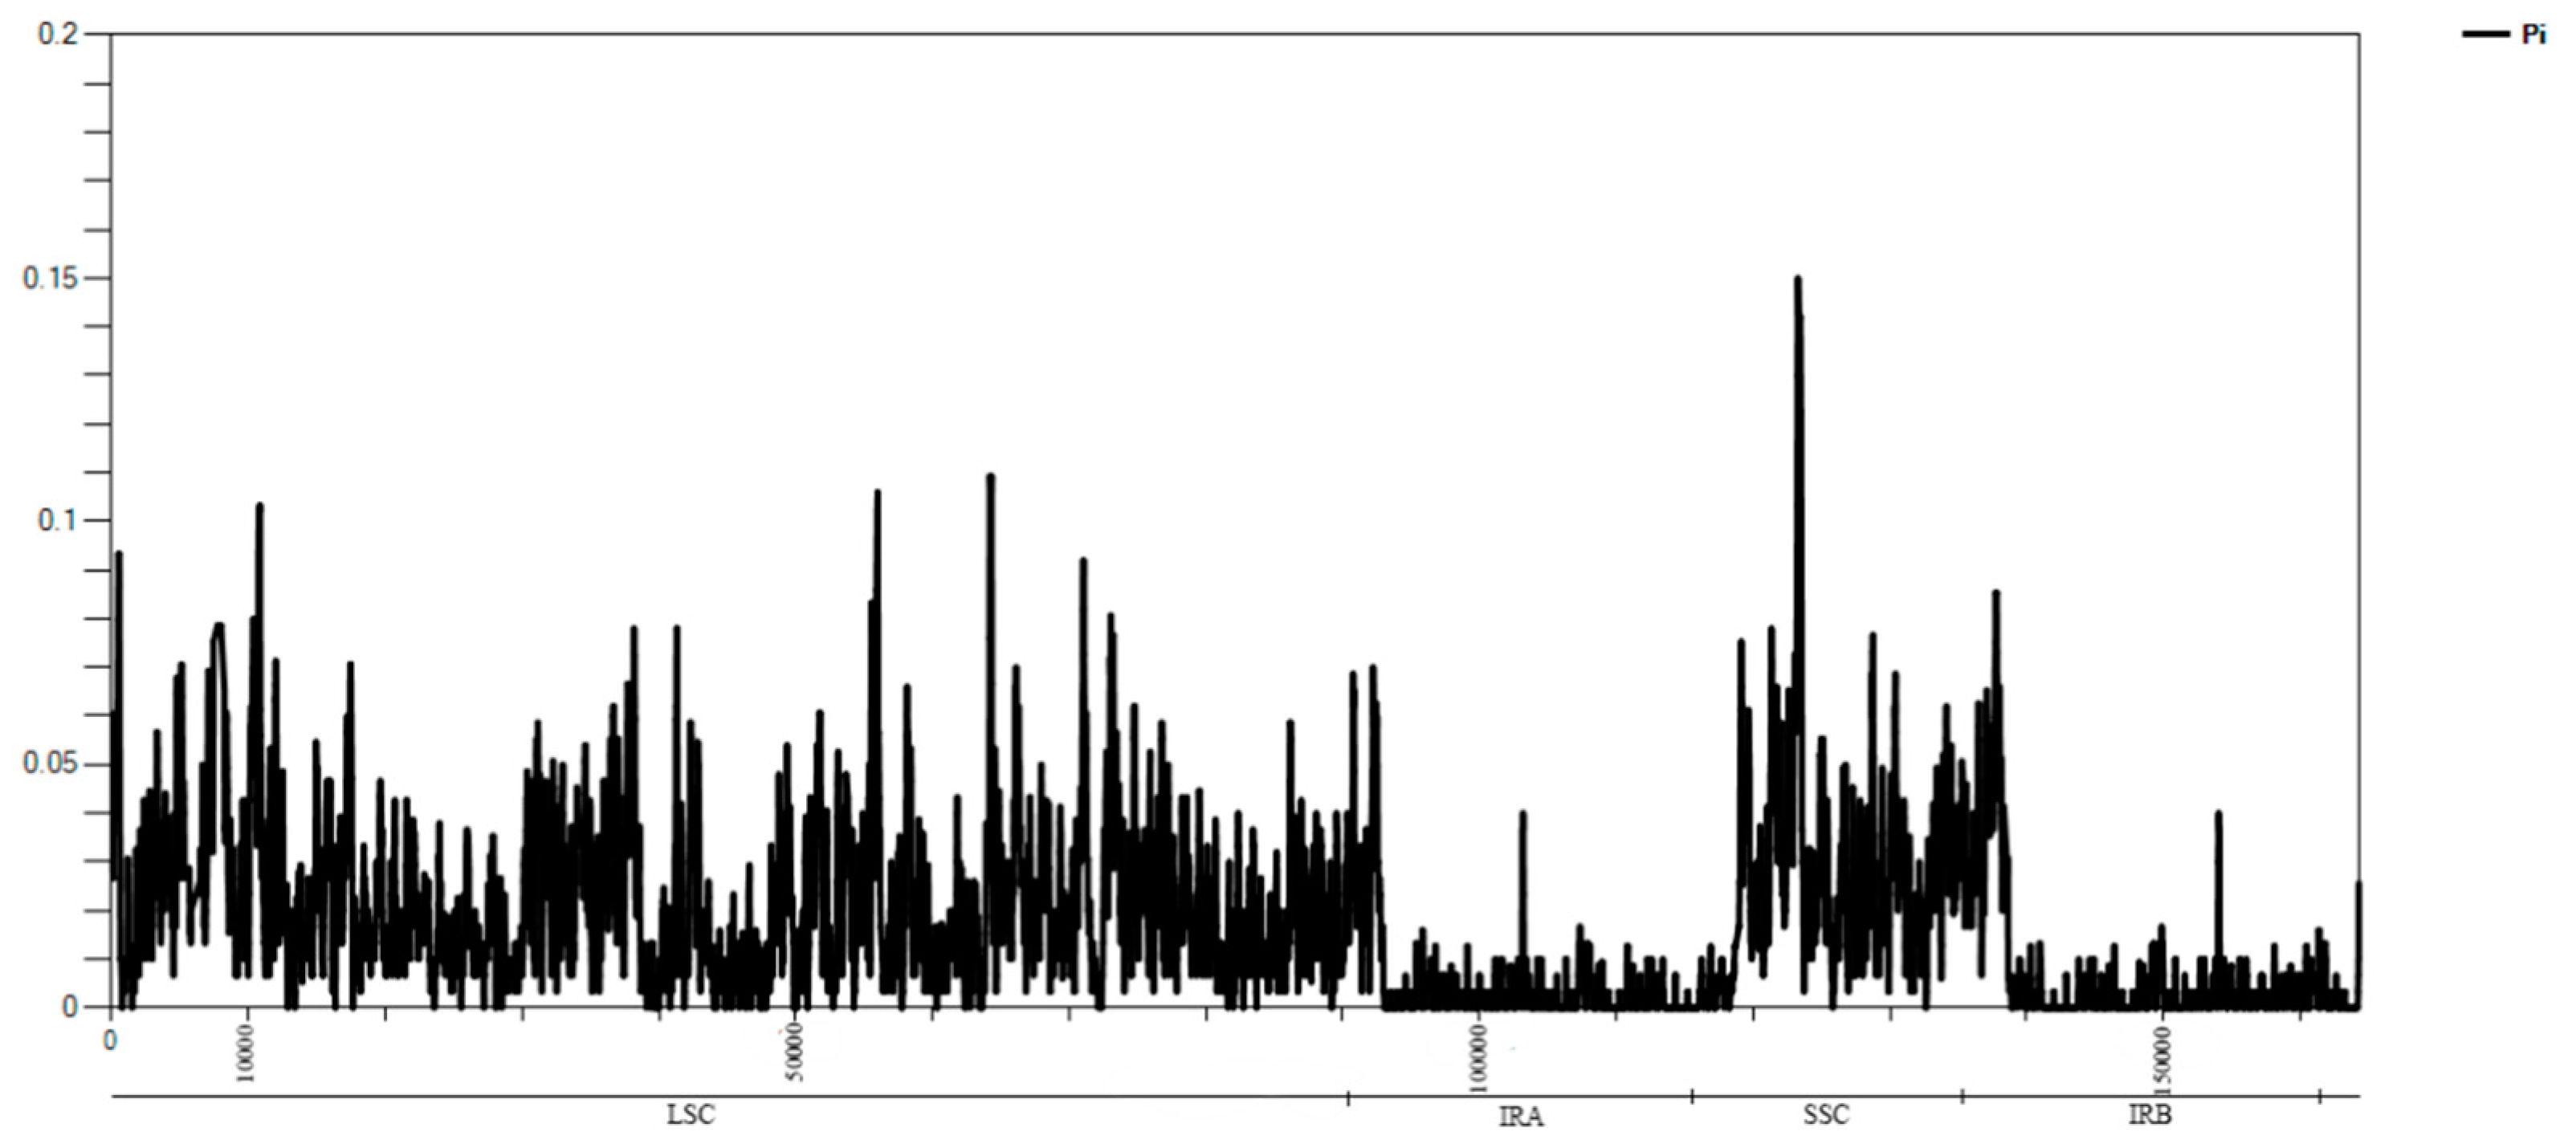
The chloroplast sequence are often used to measure the genetic diversity within a species, the gene flow between species, and the size of ancestral populations of separated sister species [31]. Thus, it is necessary to understand the chloroplast differences between species. The complete cp genome sequence of Q. acutissima was compared to those of Q. variabilis, Q. dolicholepis, Castanea mollissima, Lithocarpus balansae, and Fagus engleriana. F. engleriana has the smallest cp genome with the largest IR region (51,784 bp), and Q. dolicholepis has the largest cp genome (Table 1). We assumed that the different lengths of the SSC and IR regions is the main reason for variety in sequence lengths. To verify the possibility of genome divergence, sequence identity was calculated for six species’ chloroplast DNA using the program mVISTA with Q. variabilis as a reference (Figure 2). The results of this comparison revealed that LSC regions are more divergent than SSC and IR regions and that higher divergence is found in noncoding than in coding regions. The complete cp genome sequence of F. engleriana is quite different from the five other plants. There was no significant difference between the chloroplast genome sequences of evergreen and deciduous trees. At the same time, the results of the sliding window indicated that the location of the variation in the cp genome among the six species occurred in the LSC and SSC regions (Figure A2). Significant variation was found in coding regions of some genes, including psbI, rpl33, petB, rpl2, rps16, rpoC2, ndhK, ycf2, ycf1, and ndhI. The highest divergence in noncoding regions was found in the intergenic regions of trnK-rps16, rps 16-trnQ, psbK-psbI, trnS-trnG, atpH-atpI, atpI-rps2, rpoB-trnC, trnC-petN, psbM-trnD, trnD-trnY, trnE-trnM, trnT-petD, psbZ-trnG, trnT-trnL, trnF-ndhJ, rbcL-accD, psaI-ycf4, ycf4-cemA, petA-psbL, psaJ-rpl33, clpP-psbB, rpl14-rpl16, ndhF-rpl32, ccsA-ndhD, ndhD-psaC, and rps15-ycf1.
The contraction and expansion of the IR region at the borders play important roles in evolution. They are common evolutionary events and a major cause of changes in the size of the chloroplast genome. They may also cause variation in the length of angiosperm plastid genome [32,33,34]. Detailed comparisons of the IR–SSC and IR–LSC boundaries among the cp genomes of the above six Fagaceae species were presented in Figure 3. The IR regions are relatively highly conserved in the Quercus genus—the rpl2 gene in the Quercus cp genome is shifted by 62 bp from IRb to LSC at the LSC/IRb border, and by 62 bp from IRa to LSC at the IRa/LSC border. Compared to other species in the genus, the range of the IRa/SSC regions changes greatly. Compared with evergreen and deciduous species, we found significant differences in IRb/SSC. Some reports showed that ycf1 is necessary for plant viability and encodes Tic214, an important component of the Arabidopsis TIC complex [35,36]. The ycf1 gene crossed the SSC/IRb region, with 1041bp of ycf1_like within IRb (incompletely duplicated in IRb). The SSC/IRa junction is located in the ycf1 region in all Fagaceae species chloroplast genomes and extends into the SSC region by different lengths depending on the genome (Q. acutissima, 4619 bp; Q. variabilis, 4620 bp; Q. dolicholepis, 4611 bp; C. mollissima, 4623 bp; L. balansae, 4626 bp; F. engleriana, 4633 bp); the IRa region includes 1041, 1041, 1068, 1059, 828, and 1049 bp of the ycf1 gene.
2.3. Long-Repeat and SSR Analysis
For the repeat structure analysis (Table 5), 31 forward and 22 inverted repeats were detected in the Q. acutissima cp genome. Most of these repeats are between 19 and 46 bp. The longest forward repeat is 46 bp in length and is located in the LSC region. A total of 35, 18, and eight repeats were found in the LSC, SSC, IR regions, respectively. Seven forward repeats were located in IR, including one repeat associated with ycf1 genes and one repeat related to the trnV-UAC and trnA-UGC genes. Most repeats in the intergenic spacers are distributed in the LSC region. Ten repeats are distributed in the SSC region, and only four of them are in the intergenic spacers.
As chloroplast-specific SSRs are uniparentally inherited and are inclined to undergo slipped-strand mispairing, they are often used in population genetics, species identification, and evolutionary process research of wild plants [37,38]. In addition, chloroplast genome sequences are highly conserved, and the SSR primer for chloroplast genomes can be transferred across species and genera. Yoko et al. used six maternally inherited chloroplast (cpDNA) simple sequence repeat (SSR) markers to study the genetic variation in Q. acutissima [39]. In this study, a total of 65 SSRs were found in Q. acutissima, most of them distributed in LSC and SSC and partly distributed in IR. These included 61 mononucleotide SSRs (93.85%) and four dinucleotide SSRs (6.15%) (Table 6). Compared with other Quercus species, fewer types of SSRs were identified in Q. acutissima [40]. Among them, two SSRs belonged to the C type, and the others all belonged to the A/T types. These results are consistent with the hypothesis that cpSSRs are generally composed of short polyadenine (polyA) or polythymine (polyT) repeats and rarely contain tandem guanine (G) or cytosine (C) repeats [41]. We also found that 12 SSRs were located in genes, and the remaining were all located in intergenic regions. These cpSSR markers could be used to examine the genetic structure, diversity, differentiation, and maternity in Q. acutissima and its relative species in future studies.
2.4. Phylogenetic Analysis
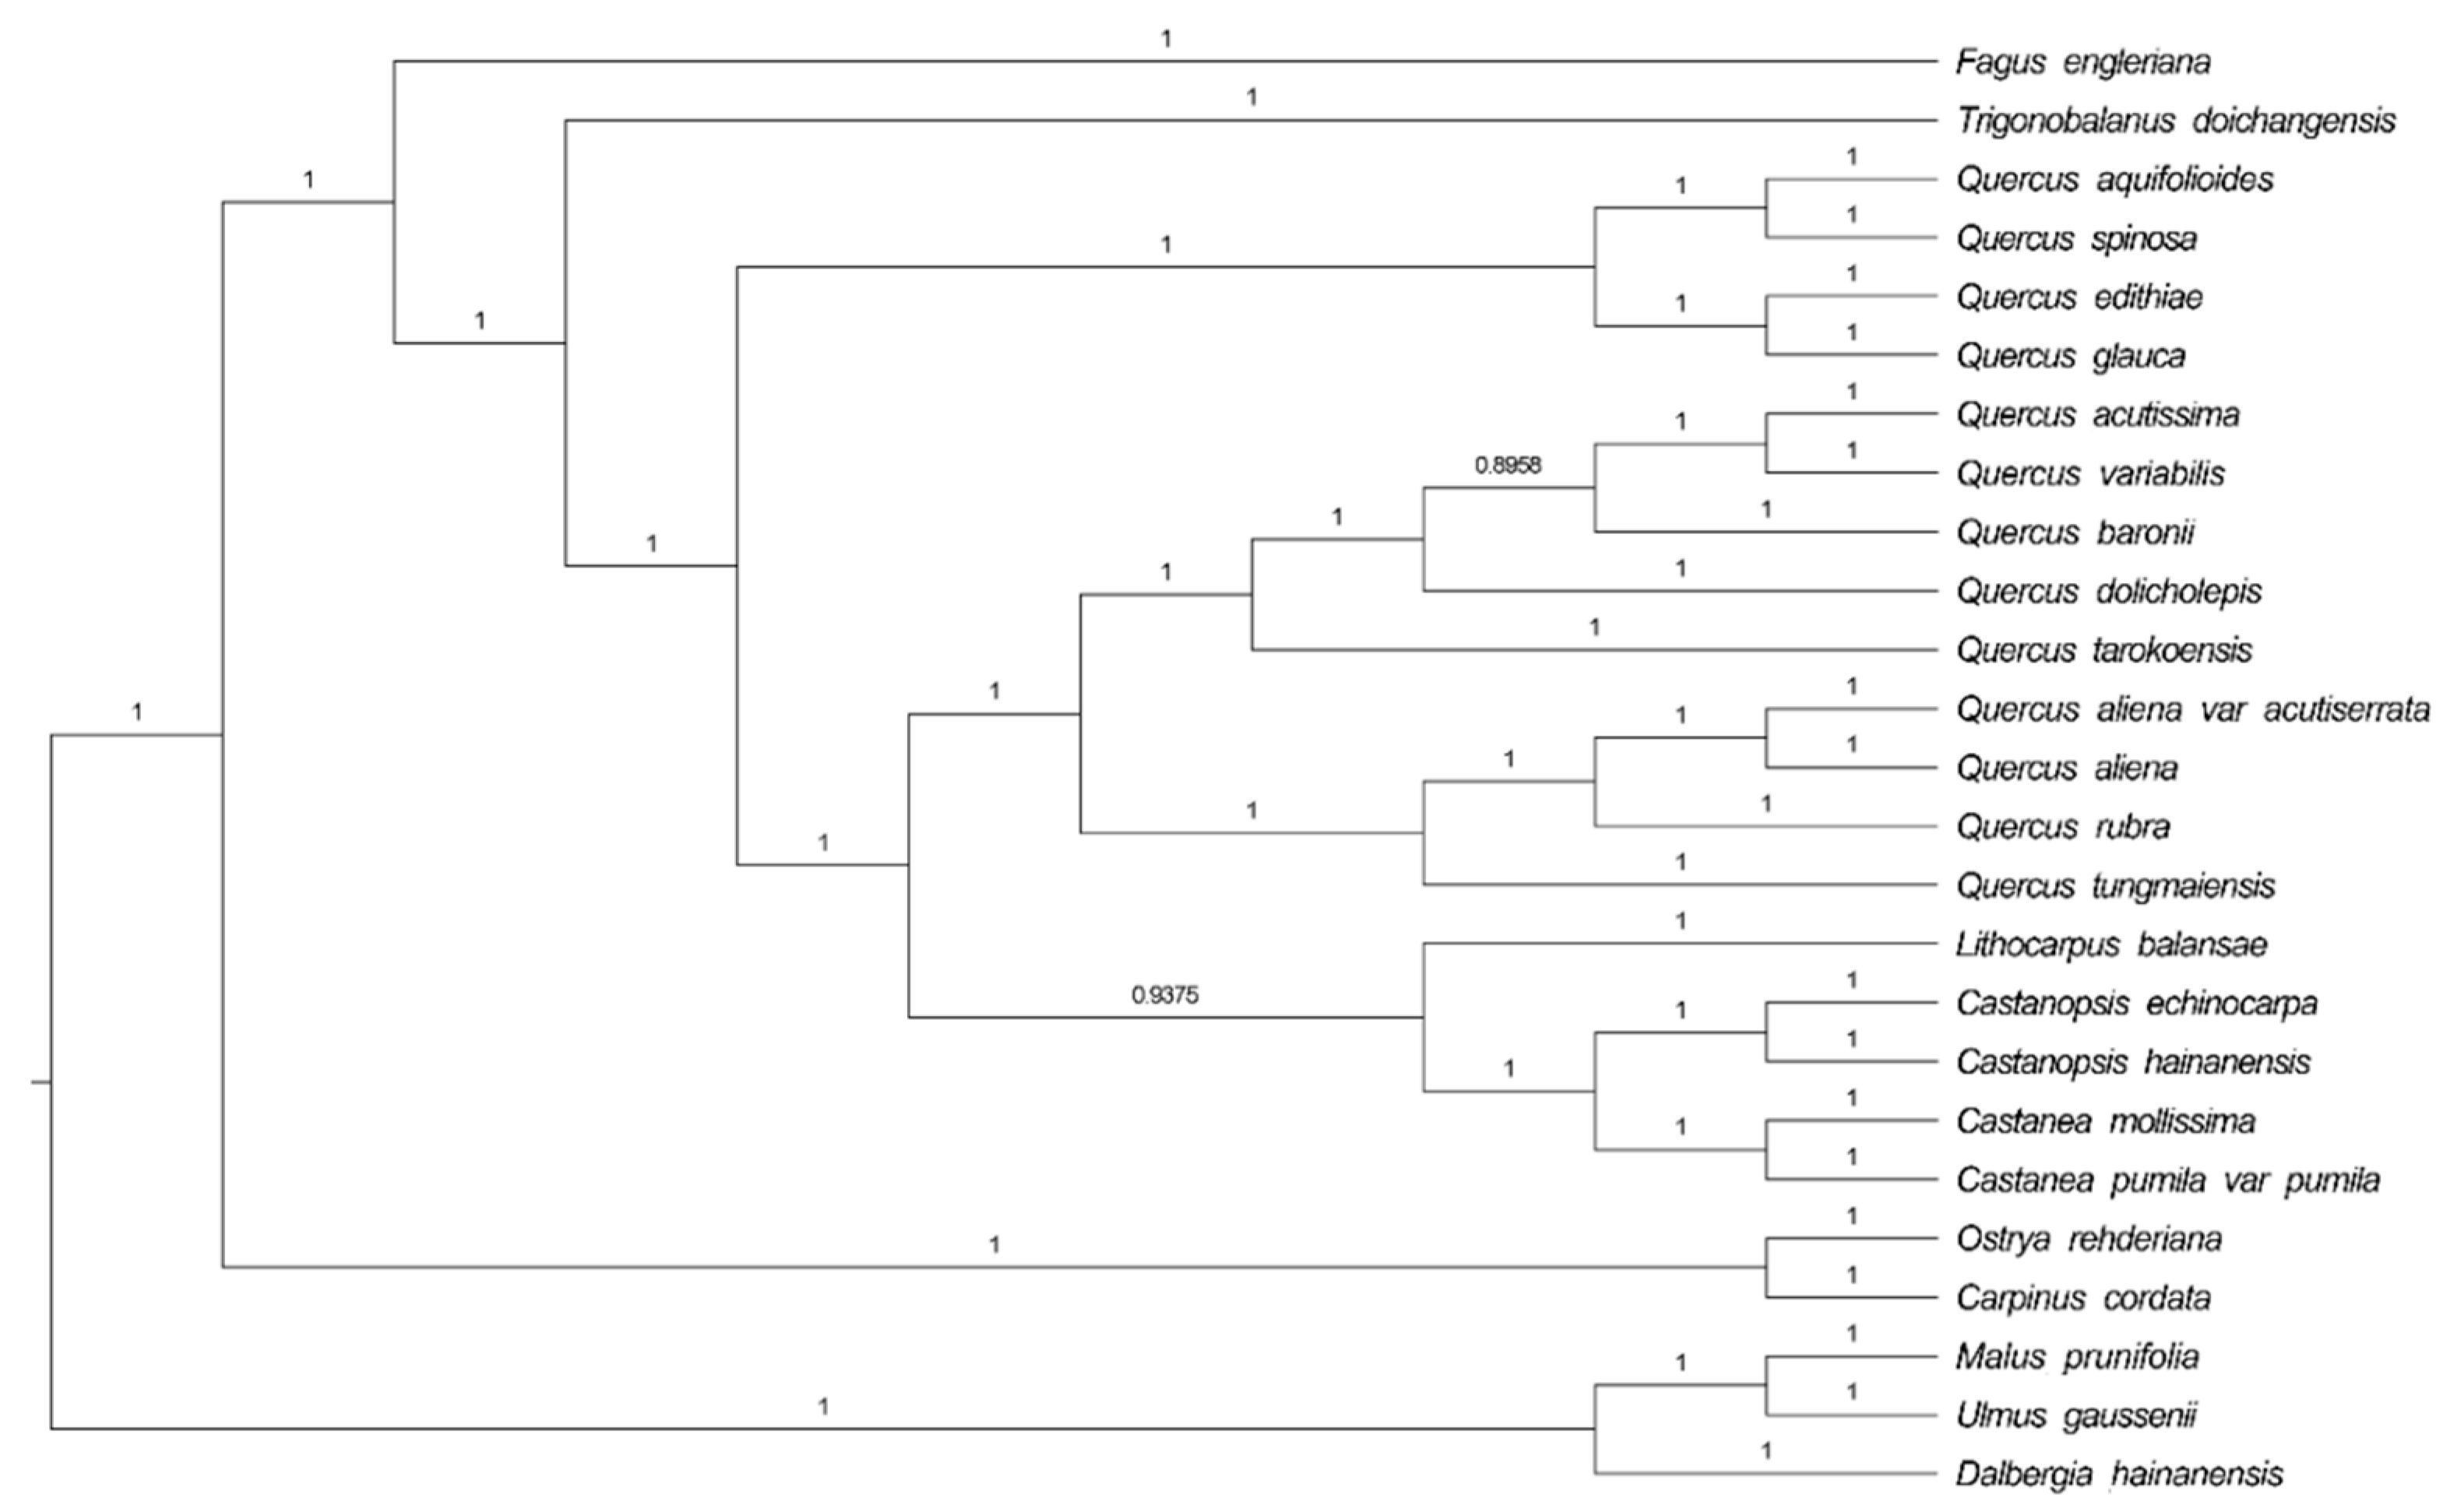
Phylogenetic analysis was completed on an alignment of concatenated nucleotide sequences of all chloroplast genomes from 25 angiosperm species (Figure 4). We used the Bayesian inference (BI) method based on RAxML to build a phylogenetic tree, and Malus prunifolia and Ulmus gaussenii were used as the outgroup. Support is generally high for almost all relationships inferred from all chloroplast genome data based on BI methods (the support values have a range of 0.8956 to 1). It is noteworthy that the species in genus Quercus do not form a clade. Several evergreen tree species gather together to form one clade. Q. acutissima and Q. variabilis are sister species and are frequently mixed in Chinese endemic species; the second clade splits into two subclades. F. engleriana is in the top position, while Q. acutissima appears to be more closely related to Q. variabilis, Q. dolicholepis, and Q. baronii. In general, the topologies of the other branches (genus Fagus, Trigonobalanus, Lithocarpus, and Castanopsis) are almost the same based on two nuclear loci (ITS and CRC) [3].
3. Materials and Methods
3.1. Sampling, DNA Extraction, Sequencing, and Assembly
Q. acutissima was planted in Nanjing Forestry University and Zijin Mountain in Nanjing, China (32°04′ N, 118°48′ E; 32°04′ N, 118°50′ E), respectively. Fresh leaves were collected and wrapped in ice and immediately stored at −80 °C until analysis. Genomic DNA was isolated by the modified method CTAB [42]. Agarose gel electrophoresis and one drop spectrophotometer (OD-1000, Shanghai Cytoeasy Biotech Co., Ltd., Shanghai, China) were used to detect DNA integrity and quality. Shotgun libraries (250 bp) were constructed using pure DNA according to the manufacturer’s instructions. Sequencing was performed with an Illumina Hiseq 2500 platform (Nanjing, China), yielding at least 9.82 GB of clean data for Q. acutissima. Firstly, all of the raw reads were trimmed by Fastqc. Next, we performed a BLAST analysis between trimmed reads and references (Q. variabilis and Q. dolicholepis) to extract cp-like reads. Finally, we used the chloroplast-like reads to assemble sequences using NOVOPlasty [43]. NOVOPlasty assembled part reads and stretched as far as possible until a circular genome formed. When the assembly result was within the expected range, the overlap was larger than 200 bp, and the assembly formed a ring.
3.2. Annotation and Analysis of the cpDNA Sequences
CpGAVAS was used to annotate the sequences; DOGMA (http://dogma.ccbb.utexas.edu/) and BLAST were used to check the results of the annotation [44,45]. tRNAscanSE was used to identify the tRNAs [46]. The circular gene maps of the species of Q. acutissima were drawn using the OGDRAWv1.2 program [47] (http://ogdraw.mpimp-golm.mpg.de/). An analysis of variation in synonymous codon usage, relative synonymous codon usage values (RSCU), codon usage, and the GC content of the complete plastid genomes and commonly analyzed CDS was conducted. MISA(available online: http://pgrc.ipk-gatersleben.de/misa/misa.html) [48] and REPuter (available online: https://bibiserv.cebitec.uni-bielefeld.de/reputer/) [49] was used to visualize the SSRs and long repeats, respectively.
3.3. Genome Comparison
MUMmer [50] was used for pairing sequence alignment of the cp genome. The mVISTA [51] program was applied to compare the complete cp genome of Q. acutissima to the other published cp genomes of its related species, i.e., Q. variabilis (KU240009), Q. dolicholepis (KU240010), C. mollissima (HQ336406), L. balansae (KP299291), and F. engleriana (KX852398) with the shuffle-LAGAN mode [52], using the annotation of Q. variabilis as a reference.
3.4. Phylogenetic Analysis
Phylogenies were constructed by Bayesian inference (BI) analysis using the 25 cp genome of the Fagaceae species sequences from the NCBI Organelle Genome and Nucleotide Resources database. The sequences were initially aligned using MAFFT [53]. Then, the visualization and manual adjustment of multiple sequence alignment were conducted in BioEdit [54]. An IQ-tree was used to select the best-fitting evaluation of models of nucleotide sequences [55]. TVM + F + R4 and GTR + G were selected as the best substitution models for the BI analyses. BI analyses were conducted using Mrbayes [56]. Malus prunifolia (NC_031163), and the Ulmus gaussenii (NC_037840) were used as the outgroups.
4. Conclusions
In this study, we reported and analyzed the complete cp genome of Q. acutissima, an endemic and ecological tree species in China. The chloroplast genome was shown to be more conservative with similar characteristics to other genus Quercus species. Compared to the cp genomes of five other oak species, its LSC were shown to be more divergent among the four regions, and noncoding regions showed higher divergence. An analysis of the phylogenetic relationships among six species found Q. acutissima to be closely related to Q. variabilis. The developmental position of the tree in the Fagaceae family is consistent with previous studies. The results of this study provide an assembly of a whole chloroplast genome of Q. acutissima which might facilitate genetics, breeding, and biological discoveries in the future.
Author Contributions
X.L. performed most of the experiments, data analysis, and the writing of the manuscript; Y.L. participated in the data analysis; M.Z. and M.L. participated in the preprocessing of data; and Y.F. supervised the project and provided suggestions for the manuscript.
Acknowledgments
This research was supported by the National Natural Science Foundation of China (31770699, 31370666), the Priority Academic Program Development of Jiangsu Higher Education Institutions (PAPD), and the Nanjing Forestry University Excellent Doctoral Thesis Fund.
Conflicts of Interest
The authors declare no conflict of interest.
Abbreviations
| LSC | Large single copy |
| SSC | Small single copy |
| IR | Inverted repeat |
| Cp | Chloroplast |
| BI | Bayesian inference |
| A | Adenine |
| T | Thymine |
| G | Guanine |
| C | Cytosine |
Appendix A

Table A1.
The number of genes in the Q. acutissima cp genome.
| Region | Number of CDS | Number of tRNA | Number of rRNA | Total |
|---|---|---|---|---|
| LSC region | 62 | 25 | 0 | 87 |
| SSC region | 13 | 1 | 0 | 14 |
| IRA region | 6 | 7 | 4 | 17 |
| IRB region | 7 | 7 | 4 | 18 |
Table A2.
Codon-anticodon recognition patterns and codon usage of the Q. acutissima chloroplast genome.
Table A2.
Codon-anticodon recognition patterns and codon usage of the Q. acutissima chloroplast genome.
| Amino Acid | Codon | No. | RSCU | tRNA | Amino Acid | Codon | No. | RSCU | tRNA |
|---|---|---|---|---|---|---|---|---|---|
| Ala | GCG | 164 | 0.47 | Pro | CCA | 313 | 1.13 | trnP-TGG | |
| Ala | GCC | 224 | 0.64 | Pro | CCC | 226 | 0.82 | ||
| Ala | GCU | 630 | 1.79 | Pro | CCU | 409 | 1.48 | ||
| Ala | GCA | 388 | 1.1 | Pro | CCG | 161 | 0.58 | ||
| Cys | UGU | 221 | 1.44 | Gln | CAG | 215 | 0.45 | ||
| Cys | UGC | 86 | 0.56 | trnC-GCA | Gln | CAA | 731 | 1.55 | trnQ-TTG |
| Asp | GAC | 209 | 0.39 | trnD-GTC | Arg | CGU | 337 | 1.26 | trnR-ACG |
| Asp | GAU | 870 | 1.61 | Arg | AGA | 500 | 1.87 | trnR-TCT | |
| Glu | GAA | 1064 | 1.5 | trnE-TTC | Arg | CGA | 358 | 1.34 | |
| Glu | GAG | 357 | 0.5 | Arg | AGG | 183 | 0.68 | ||
| Phe | UUU | 983 | 1.3 | Arg | CGG | 118 | 0.44 | ||
| Phe | UUC | 535 | 0.7 | trnF-GAA | Arg | CGC | 109 | 0.41 | |
| Gly | GGU | 580 | 1.27 | Ser | AGC | 125 | 0.37 | trnS-GCT | |
| Gly | GGG | 330 | 0.72 | Ser | UCU | 557 | 1.66 | ||
| Gly | GGA | 706 | 1.55 | Ser | UCA | 397 | 1.18 | trnS-TGA | |
| Gly | GGC | 206 | 0.45 | trnG-GCC | Ser | UCC | 349 | 1.04 | trnS-GGA |
| His | CAU | 486 | 1.54 | Ser | AGU | 391 | 1.17 | ||
| His | CAC | 145 | 0.46 | trnH-GTG | Ser | UCG | 193 | 0.58 | |
| Ile | AUC | 458 | 0.58 | Thr | ACU | 538 | 1.6 | ||
| Ile | AUA | 758 | 0.97 | Thr | ACG | 160 | 0.48 | ||
| Ile | AUU | 1139 | 1.45 | Thr | ACC | 247 | 0.73 | trnT-GGT | |
| Lys | AAG | 379 | 0.5 | Thr | ACA | 402 | 1.19 | trnT-TGT | |
| Lys | AAA | 1062 | 1.4 | Val | GUU | 508 | 1.41 | ||
| Leu | UUG | 572 | 1.22 | trnL-CAA | Val | GUC | 181 | 0.5 | trnV-GAC |
| Leu | UUA | 894 | 1.9 | Val | GUA | 547 | 1.52 | ||
| Leu | CUU | 583 | 1.24 | Val | GUG | 207 | 0.57 | ||
| Leu | CUA | 373 | 0.79 | trnL-TAG | Trp | UGG | 462 | 1 | trnW-CCA |
| Leu | CUC | 204 | 0.43 | Tyr | UAC | 212 | 0.42 | trnY-GTA | |
| Leu | CUG | 198 | 0.42 | Tyr | UAU | 792 | 1.58 | ||
| Met | AUG | 620 | 1 | trnI-CAT | Stop | UAA | 47 | 1.6 | |
| Asn | AAU | 1004 | 1.5 | Stop | UAG | 22 | 0.75 | ||
| Asn | AAC | 304 | 0.46 | Stop | UGA | 19 | 0.65 |
RSCU: Relative Synonymous Codon Usage.
Figure A1.
BLAST result of the chloroplast genome and the GC stew of Q. acutissima. BlAST 1 represents L. balansae; BlAST 2 represents Q. variabilis; BlAST 3 represents Q. dolicholepis.
Figure A1.
BLAST result of the chloroplast genome and the GC stew of Q. acutissima. BlAST 1 represents L. balansae; BlAST 2 represents Q. variabilis; BlAST 3 represents Q. dolicholepis.

Figure A2.
Percentage of variation in the complete cp genomes of the six species. The regions are oriented according to their locations in the genome.
Figure A2.
Percentage of variation in the complete cp genomes of the six species. The regions are oriented according to their locations in the genome.

References
- Aldrich, P.R.; Cavender-Bares, J. Quercus. Wild Crop Relat. Genom. Breed. Resour. 2011, 89–129. [Google Scholar] [CrossRef]
- Manos, P.S.; Cannon, C.H.; Oh, S.H. Phylogenetic relationships and taxonomic status of the paleoendemic Fagaceae of western North America: Recognition of a new genus, Notholithocarpus. Madroño 2008, 55, 181–190. [Google Scholar] [CrossRef]
- Oh, S.H.; Manos, P.S. Molecular phylogenetics and cupule evolution in Fagaceae as inferred from nuclear crabs claw sequences. Taxon 2008, 57, 434–451. [Google Scholar]
- Pelser, P.B.; Kennedy, A.H.; Tepe, E.J.; Shidler, J.B.; Nordenstam, B.; Kadereit, J.W.; Watson, L.E. Patterns and causes of incongruence between plastid and nuclear Senecioneae (Asteraceae) phylogenies. Am. J. Bot. 2010, 97, 856–873. [Google Scholar] [CrossRef] [PubMed]
- Pérezescobar, O.A.; Balbuena, J.A.; Gottschling, M. Rumbling orchids: How to assess divergent evolution between chloroplast endosymbionts and the nuclear host. Syst. Biol. 2016, 65, 51. [Google Scholar] [CrossRef] [PubMed]
- Curtu, A.L.; Gailing, O.; Leinemann, L.; Finkeldey, R. Genetic variation and differentiation within a natural community of five oak species (Quercus spp.). Plant Biol. 2006, 9, 116–126. [Google Scholar] [CrossRef] [PubMed]
- Kleinschmit, J.; Kleinschmit, J.G.R.; Vukelic, J.; Anic, I. Quercus robur-Quercus petraea: A critical review of the species concept. Glasnik Za Šumske Pokuse 2000, 37, 441–452. [Google Scholar]
- Denk, T.; Grimm, G.W. The oaks of western Eurasia: Traditional classifications and evidence from two nuclear markers. Taxon 2010, 59, 351–366. [Google Scholar]
- Kremer, A.; Abbott, A.G.; Carlson, J.E.; Manos, P.S.; Plomion, C.; Sisco, P.; Staton, M.E.; Ueno, S.; Vendramin, G.G. Genomics of Fagaceae. Tree Genet. Genomes 2012, 8, 583–610. [Google Scholar] [CrossRef] [Green Version]
- Simeone, M.C.; Piredda, R.; Papini, A.; Vessella, F.; Schirone, B. Application of plastid and nuclear markers to DNA barcoding of Euro-Mediterranean oaks (Quercus, Fagaceae): Problems, prospects and phylogenetic implications. Bot. J. Linn. Soc. 2013, 172, 478–499. [Google Scholar] [CrossRef]
- Hipp, A.L. Should hybridization make us skeptical of the oak phylogeny? Int. Oaks 2015, 26, 9–17. [Google Scholar]
- Denk, T.; Grimm, G.W.; Manos, P.S.; Deng, M.; Hipp, A.L. An updated infrageneric classification of the oaks: Review of previous taxonomic schemes and synthesis of evolutionary patterns. In Oaks Physiological Ecology. Exploring the Functional Diversity of Genus Quercus L.; Springer: Cham, Switzerland, 2017; pp. 13–38. [Google Scholar]
- Zhou, Z.; Wilkinson, H.; Wu, Z. Taxonomical and evolutionary implications of the leaf anatomy and architecture of Quercus L. Subgenus Quercus from China. Cathaya 1995, 7, 1–34. [Google Scholar]
- Pu, C.; Zhou, Z.; Luo, Y. A cladistic analysis of Quercus (Fagaceae) in China based on leaf epidermic and architecture. Acta Bot. Yunnanica 2002, 24, 689–698. [Google Scholar]
- Peng, Y.S.; Chen, L.; Li, J.Q. Study on Numerical Taxonomy of Quercus L. (Fagaceae) in China. J. Plant Sci. 2007, 25, 149–157. [Google Scholar]
- Zhang, X.; Yao, L.I.; Fang, Y. Geographical distribution and prediction of potential ranges of Quercus acutissima in China. Acta Bot. Boreali-Occident. Sin. 2014, 34, 1685–1692. [Google Scholar]
- Zhang, X.; Li, Y.; Liu, C.; Xia, T.; Zhang, Q.; Fang, Y. Phylogeography of the temperate tree species Quercus acutissima in China: Inferences from chloroplast DNA variations. Biochem. Syst. Ecol. 2015, 63, 190–197. [Google Scholar] [CrossRef]
- Hui, L.; Xie, H.; Jiang, Z.; Li, C.; Zhang, G. Photosynthetic response of potted Quercus acutissima Carruth seedlings under different soil moisture conditions. Sci. Soil Water Conserv. 2013, 11, 93–97. [Google Scholar]
- Fang, S.; Liu, Z.; Cao, Y.; Liu, D.; Yu, M.; Tang, L. Sprout development, biomass accumulation and fuelwood characteristics from coppiced plantations of Quercus acutissima. Biomass Bioenergy 2011, 35, 3104–3114. [Google Scholar] [CrossRef]
- Wu, T.; Wang, G.G.; Wu, Q.; Cheng, X.; Yu, M.; Wang, W.; Yu, X. Patterns of leaf nitrogen and phosphorus stoichiometry among Quercus acutissima provenances across China. Ecol Complex. 2014, 17, 32–39. [Google Scholar] [CrossRef]
- Choi, H.S.; Kim, Y.Y.; Hong, K.N.; Hong, Y.P.; Hyun, J.O. Genetic structure of a population of Quercus acutissima in Korea revealed by microsatellite markers. Korean J. Genet. 2005, 27, 267–271. [Google Scholar]
- Huang, L.; Xiao, L.I.; Yan, J. Studies on Introduction of North American Oaks. China Forestry Science and Technology. 2005. Available online: http://xueshu.baidu.com/s?wd=paperuri%3A%2866d7b49f4975cf2de13aa699e48387b1%29&filter=sc_long_sign&tn=SE_xueshusource_2kduw22v&sc_vurl=http%3A%2F%2Fen.cnki.com.cn%2FArticle_en%2FCJFDTOTAL-LKKF200501009.htm&ie=utf-8&sc_us=11198188077522908127 (accessed on 16 August 2018).
- Shen, X.; Wu, M.; Liao, B.; Liu, Z.; Bai, R.; Xiao, S.; Li, X.; Zhang, B.; Xu, J.; Chen, S. Complete chloroplast genome sequence and phylogenetic analysis of the medicinal plant Artemisia annua. Molecules 2017, 22, 1330. [Google Scholar] [CrossRef] [PubMed]
- Guo, S.; Guo, L.; Zhao, W.; Xu, J.; Li, Y.; Zhang, X.; Shen, X.; Wu, M.; Hou, X. Complete chloroplast genome sequence and phylogenetic analysis of Paeonia ostii. Molecules 2018, 23, 246. [Google Scholar] [CrossRef] [PubMed]
- Lobry, J.R. Asymmetric substitution patterns in the two DNA strands of bacteria. Mol. Biol. Evol. 1996, 13, 660–665. [Google Scholar] [CrossRef] [PubMed] [Green Version]
- Necsulea, A.; Lobry, J. A new method for assessing the effect of replication on DNA base composition asymmetry. Mol. Biol. Evol. 2007, 24, 2169–2179. [Google Scholar] [CrossRef] [PubMed]
- Tillier, E.R.; Collins, R.A. The contributions of replication orientation, gene direction, and signal sequences to base-composition asymmetries in bacterial genomes. J. Mol. Evol. 2000, 50, 249–257. [Google Scholar] [CrossRef] [PubMed]
- Jansen, R.K.; Raubeson, L.A.; Boore, J.L.; Depamphilis, C.W.; Chumley, T.W.; Haberle, R.C.; Wyman, S.K.; Alverson, A.J.; Peery, R.; Herman, S.J. Methods for obtaining and analyzing whole chloroplast genome sequences. Method Enzymol. 2005, 395, 348. [Google Scholar]
- Shetty, S.M.; Md Shah, M.U.; Makale, K.; Mohd-Yusuf, Y.; Khalid, N.; Othman, R.Y. Complete chloroplast genome sequence of Musa balbisiana corroborates structural heterogeneity of inverted repeats in wild progenitors of cultivated bananas and plantains. Plant Genome 2016, 9. [Google Scholar] [CrossRef] [PubMed]
- Boudreau, E.; Takahashi, Y.; Lemieux, C.; Turmel, M.; Rochaix, J.D. The chloroplast ycf3 and ycf4 open reading frames of Chlamydomonas reinhardtii are required for the accumulation of the photosystem I complex. Embo J. 1997, 16, 6095–6104. [Google Scholar] [CrossRef] [PubMed]
- Cavender Bares, J.; González Rodríguez, A.; Eaton, D.A.R.; Hipp, A.A.L.; Beulke, A.; Manos, P.S. Phylogeny and biogeography of the American live oaks (Quercus subsection Virentes): A genomic and population genetics approach. Mol Ecol. 2015, 24, 3668–3687. [Google Scholar] [CrossRef] [PubMed]
- Kode, V.; Mudd, E.A.; Iamtham, S.; Day, A. The tobacco plastid accD gene is essential and is required for leaf development. Plant J. 2005, 44, 237–244. [Google Scholar] [CrossRef] [PubMed]
- Raubeson, L.A.; Peery, R.; Chumley, T.W.; Dziubek, C.; Fourcade, H.M.; Boore, J.L.; Jansen, R.K. Comparative chloroplast genomics: Analyses including new sequences from the angiosperms Nuphar advena and Ranunculus macranthus. BMC Genom. 2007, 8, 174. [Google Scholar] [CrossRef] [PubMed]
- Yao, X.; Tang, P.; Li, Z.; Li, D.; Liu, Y.; Huang, H. The first complete chloroplast genome sequences in Actinidiaceae: Genome structure and comparative analysis. PLoS ONE 2015, 10, e129347. [Google Scholar] [CrossRef] [PubMed]
- Dong, W.; Xu, C.; Li, C.; Sun, J.; Zuo, Y.; Shi, S.; Cheng, T.; Guo, J.; Zhou, S. Ycf1, the most promising plastid DNA barcode of land plants. Sci. Rep. 2015, 5, 8348. [Google Scholar] [CrossRef] [PubMed]
- Kikuchi, S.; Bédard, J.; Hirano, M.; Hirabayashi, Y.; Oishi, M.; Imai, M.; Takase, M.; Ide, T.; Nakai, M. Uncovering the protein translocon at the chloroplast inner envelope membrane. Science 2013, 339, 571. [Google Scholar] [CrossRef] [PubMed]
- Provan, J. Novel chloroplast microsatellites reveal cytoplasmic variation in Arabidopsis thaliana. Mol. Ecol. 2000, 9, 2183–2185. [Google Scholar] [CrossRef] [PubMed]
- Flannery, M.L.; Mitchell, F.J.; Coyne, S.; Kavanagh, T.A.; Burke, J.I.; Salamin, N.; Dowding, P.; Hodkinson, T.R. Plastid genome characterisation in Brassica and Brassicaceae using a new set of nine SSRs. Theor. Appl. Genet. 2006, 113, 1221–1231. [Google Scholar] [CrossRef] [PubMed]
- Saito, Y.; Tsuda, Y.; Uchiyama, K.; Saito, Y.; Tsuda, Y.; Uchiyama, K.; Fukuda, T.; Seto, Y.; Kim, P.G.; Shen, H.L.; et al. Genetic Variation in Quercus acutissima Carruth., in Traditional Japanese Rural Forests and Agricultural Landscapes, Revealed by Chloroplast Microsatellite Markers. Forests 2017, 8, 451. [Google Scholar] [CrossRef]
- Yang, Y.; Zhu, J.; Feng, L.; Zhou, T.; Bai, G.; Yang, J.; Zhao, G. Plastid genome comparative and phylogenetic analyses of the key genera in Fagaceae: Highlighting the effect of codon composition bias in phylogenetic inference. Front. Plant Sci. 2018, 9, 82. [Google Scholar] [CrossRef] [PubMed]
- Wang, L.; Wuyun, T.N.; Du, H.; Wang, D.; Cao, D. Complete chloroplast genome sequences of Eucommia ulmoides: Genome structure and evolution. Tree Genet. Genomes 2016, 12, 12. [Google Scholar] [CrossRef]
- Doyle, J.J. A rapid DNA isolation procedure for small quantities of fresh leaf tissue. Phytochem. Bull. 1987, 19, 11–15. [Google Scholar]
- Dierckxsens, N.; Mardulyn, P.; Smits, G. Novoplasty: De novo assembly of organelle genomes from whole genome DNA. Nucleic Acids Res. 2017, 45, e18. [Google Scholar] [PubMed]
- Chang, L.; Shi, L.; Zhu, Y.; Chen, H.; Zhang, J.; Lin, X.; Guan, X. CpGAVAS, an integrated web server for the annotation, visualization, analysis, and GenBank submission of completely sequenced chloroplast genome sequences. BMC Genom. 2012, 13, 715. [Google Scholar]
- Wyman, S.K.; Jansen, R.K.; Boore, J.L. Automatic annotation of organellar genomes with DOGMA. Bioinformatics 2004, 20, 3252–3255. [Google Scholar] [CrossRef] [PubMed] [Green Version]
- Schattner, P.; Brooks, A.N.; Lowe, T.M. The tRNAscan-SE, snoscan and snoGPS web servers for the detection of tRNAs and snoRNAs. Nucleic Acids Res. 2005, 33, W686. [Google Scholar] [CrossRef] [PubMed]
- Lohse, M.; Drechsel, O.; Bock, R. Organellar Genome DRAW (OGDRAW): A tool for the easy generation of high-quality custom graphical maps of plastid and mitochondrial genomes. Curr. Genet. 2007, 52, 267–274. [Google Scholar] [CrossRef] [PubMed]
- Mudunuri, S.B.; Nagarajaram, H.A. IMEx: Imperfect Microsatellite Extractor. Bioinformatics 2007, 23, 1181–1187. [Google Scholar] [CrossRef] [PubMed] [Green Version]
- Kurtz, S.; Choudhuri, J.V.; Ohlebusch, E.; Schleiermacher, C.; Stoye, J.; Giegerich, R. REPuter: The manifold applications of repeat analysis on a genomic scale. Nucleic Acids Res. 2001, 29, 4633–4642. [Google Scholar] [CrossRef] [PubMed]
- Kurtz, S.; Phillippy, A.; Delcher, A.L.; Smoot, M.; Shumway, M.; Antonescu, C.; Salzberg, S.L. Versatile and open software for comparing large genomes. Genome Biol. 2004, 5, R12. [Google Scholar] [CrossRef] [PubMed]
- Mayor, C.; Brudno, M.; Schwartz, J.R.; Poliakov, A.; Rubin, E.M.; Frazer, K.A.; Pachter, L.S.; Dubchak, I. VISTA: Visualizing global DNA sequence alignments of arbitrary length. Bioinformatics 2000, 16, 1046–1047. [Google Scholar] [CrossRef] [PubMed]
- Frazer, K.A.; Pachter, L.; Poliakov, A.; Rubin, E.M.; Dubchak, I. VISTA: Computational tools for comparative genomics. Nucleic Acids Res. 2004, 32, W273. [Google Scholar] [CrossRef] [PubMed]
- Katoh, K.; Kuma, K.; Toh, H.; Miyata, T. MAFFT version 5: Improvement in accuracy of multiple sequence alignment. Nucleic Acids Res. 2005, 33, 511–518. [Google Scholar] [CrossRef] [PubMed]
- Hall, T.A. BioEdit: A user-friendly biological sequence alignment editor and analysis program for windows 95/98/NT. Nucleic Acids Symp. Ser. 1999, 41, 95–98. [Google Scholar]
- Lam-Tung, N.; Schmidt, H.A.; Arndt, V.H.; Quang, M.B. IQ-TREE: A fast and effective stochastic algorithm for estimating maximum-likelihood phylogenies. Mol. Biol. Evol. 2015, 32, 268–274. [Google Scholar]
- Huelsenbeck, J.P.; Ronquist, F. MRBAYES: Bayesian inference of phylogenetic trees. Bioinformatics 2001, 17, 754–755. [Google Scholar] [CrossRef] [PubMed] [Green Version]
Figure 1.
Chloroplast genome map of Q. acutissima. Genes inside the circle are transcribed clockwise, and those outside are transcribed counterclockwise. Genes of different functions are color-coded. The darker gray in the inner circle shows the GC content, while the lighter gray shows the AT content.

Figure 2.
Complete chloroplast genome comparison of six species using the chloroplast genome of Q. variabilis as a reference. The grey arrows and thick black lines above the alignment indicate the genes’ orientations. The Y-axis represents the identity from 50% to 100%.
Figure 2.
Complete chloroplast genome comparison of six species using the chloroplast genome of Q. variabilis as a reference. The grey arrows and thick black lines above the alignment indicate the genes’ orientations. The Y-axis represents the identity from 50% to 100%.

Figure 3.
Comparison of the large single copy (LSC), small single copy (SSC), and inverted repeat (IR) regions in chloroplast genomes of four species. Genes are denoted by colored boxes. The gaps between the genes and the boundaries are indicated by the base lengths (bp). Extensions of the genes are indicated above the boxes.

Figure 4.
Bayesian inference (BI) phylogenetic tree reconstruction including 25 species based on all chloroplast genomes. Malus prunifolia and Ulmus gaussenii were used as the outgroup.
Figure 4.
Bayesian inference (BI) phylogenetic tree reconstruction including 25 species based on all chloroplast genomes. Malus prunifolia and Ulmus gaussenii were used as the outgroup.

Table 1.
Summary of five Quercus chloroplast genome features.
| Genome Features | Q. acutissima | Q. variabilis | Q. dolicholepis | C. mollissima | L. balansae | F. engleriana |
|---|---|---|---|---|---|---|
| Genome size (bp) | 161,124 | 161,077 | 161,237 | 160,799 | 161,020 | 158,346 |
| LSC length (bp) | 90,423 | 90,387 | 90,461 | 90,432 | 90,596 | 87,667 |
| SSC length (bp) | 19,068 | 19,056 | 19,048 | 18,995 | 19,160 | 18,895 |
| IR length (bp) | 51,632 | 51,634 | 51,728 | 51,372 | 51,264 | 51,784 |
| Number of genes | 136 | 134 | 134 | 130 | 134 | 131 |
| Number of protein–coding genes | 88 | 86 | 86 | 83 | 87 | 83 |
| Number of tRNA genes | 40 | 40 | 40 | 37 | 39 | 40 |
| Number of rRNA genes | 8 | 8 | 8 | 8 | 8 | 8 |
Table 2.
Base composition of the Q. acutissima chloroplast genome.
| Region | A (%) | T (U) (%) | C (%) | G (%) | A + T (%) | G + C (%) |
|---|---|---|---|---|---|---|
| LSC | 31.99 | 33.4 | 17.74 | 16.88 | 65.39 | 34.62 |
| SSC | 34.46 | 34.71 | 16.24 | 14.6 | 69.17 | 30.84 |
| IR | 28.61 | 28.61 | 21.39 | 21.39 | 57.22 | 42.78 |
| Total | 31.69 | 32.24 | 18.46 | 17.62 | 63.93 | 36.08 |
Table 3.
List of genes annotated in the cp genomes of Q. acutissima sequenced in this study.
| Function | Genes |
|---|---|
| RNAs, transfer | trnH-GUG, trnK-UUU, trnQ-UUG, trnS-GCU, trnG-GCC, trnR-UCU, trnC-GCA, trnD-GUC, trnY-GUA, trnE-UUC, trnT-GGU, trnM-CAU, trnS-UGA, trnG-GCC, trnfM-CAU, trnS-GGA, trnT-UGU, trnL-UAA, trnF-GAA, trnV-UAC, trnM-CAU, trnT-GGU, trnW-CCA, trnP-UGG, trnP-GGG, trnI *-CAU, trnL-CAA *, trnV-GAC, trnI-GAU *, trnA-UGC, trnR-ACG, trnN-GUU, trnL-UAG, trnN-GUU, trnR-ACG, trnA-UGC, trnV-GAC |
| RNAs, ribosomal | rrn23 *, rrn16 *, rrn5 *, rrn4.5 * |
| Transcription and splicing | rpoC1 *, rpoC2, rpoA, rpoB |
| Translation, ribosomal proteins | |
| Small subunit | rps2, rps3, rps4, rps7, rps8, rps11, rps12 **, rps14, rps15, rps16 *, rps18, rps19 |
| Large subunit | rpl2 *, rpl14, rpl16 *, rpl20, rpl22, rpl23, rpl32, rpl33, rpl36 |
| Photosynthesis | |
| ATP synthase | atpE, atpB, atpA, atpF *, atpH, atpI |
| Photosystem I | psaI, psaB, psaA, psaC, psaJ, ycf3 *, ycf4 |
| Photosystem II | psbD, psbC, psbZ, psbT, psbH, psbK, psbI, psbJ, psbF, psbE, psbM, psbN, psbL, psbA, psbB |
| Calvin cycle | rbcL |
| Cytochrome complex | petN, petA, petL, petG, petB *, petD * |
| NADH dehydrogenase | ndhB *, ndhI, ndhK, ndhC, ndhF, ndhD, ndhG, ndhE, ndhA, ndhH, ndhJ |
| Others | inFA, ycf15 *, ycf1 *, ycf2 *, accD, cemA, ccsA, clpP ** |
* Genes containing one intron; ** genes containing two introns.
Table 4.
The lengths of exons and introns in genes with introns in the Q. acutissima chloroplast genome.
Table 4.
The lengths of exons and introns in genes with introns in the Q. acutissima chloroplast genome.
| Gene | Location | Exon I (bp) | Intron I (bp) | Exon II (bp) | Intron II (bp) | Exon III (bp) |
|---|---|---|---|---|---|---|
| rps16 | LSC | 42 | 898 | 195 | ||
| atpF | LSC | 144 | 780 | 411 | ||
| rpoC1 | LSC | 432 | 827 | 1626 | ||
| ycf3 | LSC | 127 | 718 | 228 | 778 | 155 |
| clpP | LSC | 69 | 844 | 294 | 649 | 228 |
| petB | LSC | 6 | 841 | 642 | ||
| petD | LSC | 9 | 640 | 474 | ||
| rpl16 | LSC | 9 | 1102 | 399 | ||
| rpl2 | RepeatA | 390 | 628 | 471 | ||
| ndhB | RepeatA | 777 | 680 | 756 | ||
| rps12 | RepeatA | 10 | 537 | 231 | ||
| ndhA | SSC | 551 | 1040 | 541 | ||
| rps12 | RepeatB | 232 | 536 | 26 | ||
| ndhB | RepeatB | 777 | 680 | 756 | ||
| rpl2 | RepeatB | 390 | 628 | 471 | ||
| trnG-GCC | LSC | 23 | 734 | 37 | ||
| trnK-UUU | LSC | 37 | 2505 | 35 | ||
| trnL-UAA | LSC | 35 | 483 | 50 | ||
| trnV-UAC | LSC | 36 | 630 | 37 | ||
| trnI-GAU | RepeatA | 42 | 950 | 35 | ||
| trnA-UGC | RepeatA | 38 | 800 | 35 | ||
| TRNA-UGC | RepeatB | 38 | 800 | 35 | ||
| trnI-GAU | RepeatB | 42 | 950 | 35 |
Table 5.
Long repeat sequence in the Q. acutissima chloroplast genome.
| ID | Repeat Start I | Type | Size (bp) | Repeat Start 2 | Mismatch (bp) | E-Value | Gene | Region |
|---|---|---|---|---|---|---|---|---|
| 1 | 6831 | F | 46 | 6853 | 0 | 1.47 × 10⁻¹⁸ | IGS | LSC |
| 2 | 11,847 | R | 31 | 11,847 | 0 | 1.58 × 10⁻⁹ | IGS | LSC |
| 3 | 6818 | R | 26 | 6818 | 0 | 1.62 × 10⁻⁶ | rps16 | LSC |
| 4 | 47,242 | F | 25 | 47,264 | 0 | 6.49 × 10⁻⁶ | IGS | LSC |
| 5 | 6831 | F | 24 | 6875 | 0 | 2.59 × 10⁻⁵ | IGS | LSC |
| 6 | 115,801 | F | 24 | 135,722 | 0 | 2.59 × 10⁻⁵ | ycf1 | IRA; IRB |
| 7 | 113,545 | F | 23 | 113,576 | 0 | 1.04 × 10⁻⁴ | IGS | IRA |
| 8 | 118,844 | R | 23 | 118,844 | 0 | 1.04 × 10⁻⁴ | IGS | IRA |
| 9 | 137,948 | F | 23 | 137,979 | 0 | 1.04 × 10⁻⁴ | IGS | IRB |
| 10 | 11,371 | F | 22 | 41,193 | 0 | 4.15 × 10⁻⁴ | trnG-GCC (exon), trnG-GCC | LSC |
| 11 | 9536 | F | 21 | 39,849 | 0 | 1.66 × 10⁻³ | trnS-UGA, trnS-GCU | LSC |
| 12 | 10,319 | F | 21 | 18,682 | 0 | 1.66 × 10⁻³ | IGS | LSC |
| 13 | 117,049 | R | 21 | 117,049 | 0 | 1.66 × 10⁻³ | ndhF | SSC |
| 14 | 36,478 | F | 20 | 53,719 | 0 | 6.64 × 10⁻³ | IGS | LSC |
| 15 | 53,720 | F | 20 | 130,481 | 0 | 6.64 × 10⁻³ | IGS | LSC; SSC |
| 16 | 55,907 | R | 20 | 55,907 | 0 | 6.64 × 10⁻³ | atpB | LSC |
| 17 | 57,271 | F | 20 | 142,064 | 0 | 6.64 × 10⁻³ | trnV-UAC, trnA-UGC | LSC; IRB |
| 18 | 105,331 | F | 20 | 105,349 | 0 | 6.64 × 10⁻³ | IGS | IRA |
| 19 | 146,178 | F | 20 | 146,196 | 0 | 6.64 × 10⁻³ | IGS | IRB |
| 20 | 4930 | F | 19 | 36,476 | 0 | 2.66 × 10⁻² | IGS | LSC |
| 21 | 8915 | R | 19 | 8915 | 0 | 2.66 × 10⁻² | IGS | LSC |
| 22 | 13,541 | R | 19 | 76,642 | 0 | 2.66 × 10⁻² | atpA | LSC |
| 23 | 18,685 | R | 19 | 118,842 | 0 | 2.66 × 10⁻² | clpP | LSC; SSC |
| 24 | 21,297 | R | 19 | 54,183 | 0 | 2.66 × 10⁻² | rpoC2 | LSC |
| 25 | 36,479 | F | 19 | 130,481 | 0 | 2.66 × 10⁻² | IGS | LSC; SSC |
| 26 | 39,957 | R | 19 | 39,957 | 0 | 2.66 × 10⁻² | IGS | LSC |
| 27 | 62,040 | R | 19 | 62,040 | 0 | 2.66 × 10⁻² | IGS | LSC |
| 28 | 64,751 | R | 19 | 64,751 | 0 | 2.66 × 10⁻² | IGS | LSC |
| 29 | 69,026 | R | 19 | 69,026 | 0 | 2.66 × 10⁻² | IGS | LSC |
| 30 | 71,277 | R | 19 | 71,277 | 0 | 2.66 × 10⁻² | IGS | LSC |
| 31 | 72,561 | R | 19 | 72,561 | 0 | 2.66 × 10⁻² | IGS | LSC |
| 32 | 4430 | R | 18 | 4430 | 0 | 1.06 × 10⁻¹ | IGS | LSC |
| 33 | 4437 | F | 18 | 24,828 | 0 | 1.06 × 10⁻¹ | rpoC1 (intron) | SSC |
| 34 | 4935 | F | 18 | 52,105 | 0 | 1.06 × 10⁻¹ | IGS | LSC |
| 35 | 4938 | F | 18 | 118,695 | 0 | 1.06 × 10⁻¹ | IGS | LSC |
| 36 | 6813 | F | 18 | 6847 | 0 | 1.06 × 10⁻¹ | IGS | LSC |
| 37 | 6813 | F | 18 | 6869 | 0 | 1.06 × 10⁻¹ | IGS | LSC |
| 38 | 6817 | F | 18 | 127,945 | 0 | 1.06 × 10⁻¹ | ndhA (intron) | LSC |
| 39 | 7369 | F | 18 | 7387 | 0 | 1.06 × 10⁻¹ | IGS | LSC; SSC |
| 40 | 7465 | R | 18 | 7465 | 0 | 1.06 × 10⁻¹ | IGS | LSC; SSC |
| 41 | 8589 | R | 18 | 34,768 | 0 | 1.06 × 10⁻¹ | IGS | LSC; SSC |
| 42 | 9996 | R | 18 | 9996 | 0 | 1.06 × 10⁻¹ | IGS | LSC |
| 43 | 10,283 | F | 18 | 31,730 | 0 | 1.06 × 10⁻¹ | IGS | LSC |
| 44 | 10,322 | R | 18 | 118,843 | 0 | 1.06 × 10⁻¹ | IGS | LSC; IRA |
| 45 | 10,548 | F | 18 | 133,365 | 0 | 1.06 × 10⁻¹ | ycf1 | LSC |
| 46 | 31,728 | F | 18 | 125,951 | 0 | 1.06 × 10⁻¹ | IGS | LSC |
| 47 | 39,812 | F | 18 | 40,698 | 0 | 1.06 × 10⁻¹ | trnS-UGA | LSC; SSC |
| 48 | 40,022 | R | 18 | 69,093 | 0 | 1.06 × 10⁻¹ | IGS | LSC |
| 49 | 40,700 | F | 18 | 123,827 | 0 | 1.06 × 10⁻¹ | IGS | LSC |
| 50 | 43,446 | F | 18 | 45,670 | 0 | 1.06 × 10⁻¹ | psaB | SSC |
| 51 | 40,022 | R | 18 | 69,093 | 0 | 1.06 × 10⁻¹ | IGS | LSC |
| 52 | 40,700 | F | 18 | 123,827 | 0 | 1.06 × 10⁻¹ | IGS | LSC |
| 53 | 43,446 | F | 18 | 45,670 | 0 | 1.06 × 10⁻¹ | psaB, psaA | LSC |
F: forward; I: inverted; IGS: intergenic space.
Table 6.
Simple sequence repeats (SSRs) in the Q. acutissima chloroplast genome.
| ID | Repeat Motif | Length (bp) | Start | End | Region | Gene | ID | Repeat Motif | Length (bp) | Start | End | Region | Gene |
|---|---|---|---|---|---|---|---|---|---|---|---|---|---|
| 1 | (A)10 | 9 | 1809 | 1818 | LSC | 34 | (T)10 | 9 | 55,713 | 55,722 | LSC | ||
| 2 | (C)14 | 13 | 4433 | 4446 | LSC | 35 | (T)10 | 9 | 59,591 | 59,600 | LSC | ||
| 3 | (T)11 | 10 | 4697 | 4707 | LSC | 36 | (T)10 | 9 | 60,063 | 60,072 | LSC | ||
| 4 | (A)10 | 9 | 4939 | 4948 | LSC | trnK-UUU | 37 | (T)10 | 9 | 64,092 | 64,101 | LSC | accD |
| 5 | (T)11 | 10 | 7001 | 7011 | LSC | 38 | (A)11 | 10 | 64,266 | 64,276 | LSC | ||
| 6 | (T)10 | 9 | 7746 | 7755 | LSC | 39 | (AT)7 | 13 | 64,570 | 64,583 | LSC | ||
| 7 | (A)10 | 9 | 8174 | 8183 | LSC | 40 | (T)14 | 13 | 64,945 | 64,958 | LSC | ||
| 8 | (A)12 | 11 | 8590 | 8601 | LSC | psbK | 41 | (T)13 | 12 | 66,170 | 66,182 | LSC | |
| 9 | (A)11 | 10 | 8920 | 8930 | LSC | 42 | (T)11 | 10 | 68,616 | 68,626 | LSC | petA | |
| 10 | (A)10 | 9 | 9465 | 9474 | LSC | 43 | (T)11 | 10 | 70,730 | 70,740 | LSC | ||
| 11 | (A)10 | 9 | 10,161 | 10,170 | LSC | 44 | (T)11 | 10 | 71,398 | 71,408 | LSC | ||
| 12 | (A)11 | 10 | 13,547 | 13,557 | LSC | 45 | (T)11 | 10 | 73,389 | 73,399 | LSC | ||
| 13 | (T)12 | 11 | 15,345 | 15,356 | LSC | 46 | (AT)6 | 11 | 77,274 | 77,285 | LSC | clpP | |
| 14 | (T)10 | 9 | 16,160 | 16,169 | LSC | 47 | (TA)7 | 13 | 82,928 | 82,941 | LSC | petD | |
| 15 | (A)12 | 11 | 18,692 | 18,703 | LSC | rpoC2 | 48 | (A)11 | 10 | 85,781 | 85,791 | LSC | |
| 16 | (T)12 | 11 | 21,295 | 21,306 | LSC | rpoC2 | 49 | (T)10 | 9 | 86,100 | 86,109 | LSC | |
| 17 | (T)14 | 13 | 25,299 | 25,312 | LSC | 50 | (T)10 | 9 | 88,820 | 88,829 | LSC | ||
| 18 | (T)10 | 9 | 28,563 | 28,572 | LSC | 51 | (T)11 | 10 | 114,070 | 114,080 | IRA | ||
| 19 | (T)10 | 9 | 29,651 | 29,660 | LSC | 52 | (T)12 | 11 | 118,582 | 118,593 | SSC | ||
| 20 | (T)11 | 10 | 30,275 | 30,285 | LSC | 53 | (A)11 | 10 | 118,695 | 118,705 | SSC | ||
| 21 | (C)14 | 13 | 30,428 | 30,441 | LSC | 54 | (T)11 | 10 | 119,000 | 119,010 | SSC | ||
| 22 | (T)11 | 10 | 31,731 | 31,741 | LSC | 55 | (A)10 | 9 | 119,794 | 119,803 | SSC | ||
| 23 | (A)10 | 9 | 32,094 | 32,103 | LSC | 56 | (T)11 | 10 | 122,199 | 122,209 | SSC | ndhD | |
| 24 | (A)10 | 9 | 33,986 | 33,995 | LSC | 57 | (A)10 | 9 | 122,546 | 122,555 | SSC | ||
| 25 | (A)13 | 12 | 34,775 | 34,787 | LSC | 58 | (AT)8 | 15 | 123,832 | 123,847 | SSC | ||
| 26 | (A)10 | 9 | 34,955 | 34,964 | LSC | 59 | (T)11 | 10 | 125,812 | 125,822 | SSC | ||
| 27 | (A)10 | 9 | 36,485 | 36,494 | LSC | 60 | (T)11 | 10 | 125,954 | 125,964 | SSC | ||
| 28 | (AT)6 | 11 | 39,819 | 39,830 | LSC | 61 | (T)11 | 10 | 130,262 | 130,272 | SSC | ||
| 29 | (T)10 | 9 | 41,238 | 41,247 | LSC | trnfM-CAU | 62 | (A)10 | 9 | 130,487 | 130,496 | SSC | |
| 30 | (T)11 | 10 | 53,217 | 53,227 | LSC | 63 | (T)10 | 9 | 133,465 | 133,474 | SSC | ycf1 | |
| 31 | (A)10 | 9 | 53,726 | 53,735 | LSC | 64 | (T)13 | 12 | 134,042 | 134,054 | SSC | ycf1 | |
| 32 | (T)15 | 14 | 54,110 | 54,124 | LSC | 65 | (A)11 | 10 | 137,468 | 137,478 | SSC | ||
| 33 | (A)11 | 10 | 54,990 | 55,000 | LSC |
© 2018 by the authors. Licensee MDPI, Basel, Switzerland. This article is an open access article distributed under the terms and conditions of the Creative Commons Attribution (CC BY) license (http://creativecommons.org/licenses/by/4.0/).
Share and Cite
MDPI and ACS Style
Li, X.; Li, Y.; Zang, M.; Li, M.; Fang, Y. Complete Chloroplast Genome Sequence and Phylogenetic Analysis of Quercus acutissima. Int. J. Mol. Sci. 2018, 19, 2443. https://0-doi-org.brum.beds.ac.uk/10.3390/ijms19082443
AMA Style
Li X, Li Y, Zang M, Li M, Fang Y. Complete Chloroplast Genome Sequence and Phylogenetic Analysis of Quercus acutissima. International Journal of Molecular Sciences. 2018; 19(8):2443. https://0-doi-org.brum.beds.ac.uk/10.3390/ijms19082443
Chicago/Turabian StyleLi, Xuan, Yongfu Li, Mingyue Zang, Mingzhi Li, and Yanming Fang. 2018. "Complete Chloroplast Genome Sequence and Phylogenetic Analysis of Quercus acutissima" International Journal of Molecular Sciences 19, no. 8: 2443. https://0-doi-org.brum.beds.ac.uk/10.3390/ijms19082443
Note that from the first issue of 2016, this journal uses article numbers instead of page numbers. See further details here.